Renewable Hydrogen from Biomass Pyrolysis Aqueous · PDF fileRenewable Hydrogen from Biomass...
46
Renewable Hydrogen from Biomass Pyrolysis Aqueous Phase Abhijeet P Borole (PI) 1 Ramesh Bhave 1 , Costas Tsouris 1,2 , Spyros Pavlostathis 2 , Sotira Yiacoumi 2 , Philip Ye 3 , Nikki Labbe 3 , Pyongchung Kim 3 , Jim Pollack 4 , Dan Westerheim 5 1 Oak Ridge National Laboratory 2 Georgia Institute of Technology 3 University of Tennessee 4 OmniTech international 5 FuelCellEtc, Inc. 6 Pall Corporation May 30, 2014 CHASE Project Webinar The slides from this presentation should not be distributed, forwarded or cited (where noted)
Transcript of Renewable Hydrogen from Biomass Pyrolysis Aqueous · PDF fileRenewable Hydrogen from Biomass...

Renewable Hydrogen from Biomass Pyrolysis Aqueous Phase
Abhijeet P Borole (PI) 1
Ramesh Bhave1, Costas Tsouris1,2, Spyros Pavlostathis2, Sotira Yiacoumi2, Philip Ye3, Nikki Labbe3, Pyongchung Kim3, Jim Pollack4, Dan Westerheim5 1Oak Ridge National Laboratory 2Georgia Institute of Technology 3University of Tennessee 4OmniTech international 5FuelCellEtc, Inc. 6Pall Corporation May 30, 2014 CHASE Project Webinar
The slides from this presentation should not be distributed, forwarded or cited (where noted)

2 Managed by UT-Battelle for the U.S. Department of Energy Presentation_name
Outline • Background
– Biomass pyrolysis process – Need for Hydrogen – Potential impact on efficiency of biofuel production – Potential impact on greenhouse gas emissions and sustainability
• Objectives • Project tasks • Team members • Microbial Electrolysis • Bio-oil production, oil-water separation, downstream
membrane separations, LCA analysis.

3 Managed by UT-Battelle for the U.S. Department of Energy Presentation_name
Fast pyrolysis-based biofuel production
Gasoline, diesel
Ref: Biomass Multi-year Program Plan

4 Managed by UT-Battelle for the U.S. Department of Energy Presentation_name
Fast Pyrolysis Process Flow Diagram
Biomass: C5H7O2N → gasoline (C8H18), diesel (C12H23)
Needs significant amount of hydrogen
Ref: Jones et al., Production of gasoline and diesel from biomass via fast pyrolysis, hydrotreating and hydrocracking: A design case.; PNNL-18284 Rev.1; Pacific Northwest National Laboratory: 2009

5 Managed by UT-Battelle for the U.S. Department of Energy Presentation_name
Hydrogen production from natural gas
• Natural gas – Steam-Reforming Reactions
Methane: CH4 + H2O (+ heat) → CO + 3H2
• Producer gas from pyrolysis – Water-Gas Shift Reaction
CO + H2O → CO2 + H2 (+ small amount of heat)
T = 700-1000°C P = 3-25 bar

6 Managed by UT-Battelle for the U.S. Department of Energy Presentation_name
Hydrogen Efficiency and Process yields
The energy content of the fuel product depends significantly on natural gas input (26-40% of energy input)
Energy balance 74% 26%
19% 31% 49%
51%
Biooil characterization Fuel product characterization
Carbon balance Energy balance
loss
Yield
Ref: Jones et al., Production of gasoline and diesel from biomass via fast pyrolysis, hydrotreating and hydrocracking: A design case.; PNNL-18284 Rev.1; Pacific Northwest National Laboratory: 2009
ORNL preliminary energy balance
Note: The data on this slide should not be distributed, forwarded or cited.

7 Managed by UT-Battelle for the U.S. Department of Energy Presentation_name
Other issues
• Problems – Stability of biooil (polar-non-polar separation over time) – Corrosivity due to acids (biooil pH = 2.8) – Biooil and fuel yield (biomass basis) – Loss of carbon to aqueous phase
Phenolic acids
Acetic acid CH3COOH
CHASE program: Carbon, hydrogen and separations efficiency improvement.

8 Managed by UT-Battelle for the U.S. Department of Energy Presentation_name
Microbial Electrolysis
Biomass
Electrons
Bio-oil Upgrading and
Hydrotreatment
Hydrocarbon fuels
Pyrolysis
Hydrogen
Oil phase
Aqueous Phase
Bio-oil
Schematic of the biomass to biofuel process with modifications to enable improvement in hydrogen efficiency
Project Outline
Note: The information on this slide should not be distributed, forwarded or cited.

9 Managed by UT-Battelle for the U.S. Department of Energy Presentation_name
Focus: Hydrogen
Is there an alternate way to meet the objectives without using natural gas? Oil stabilization Upgrading to gasoline/diesel fuels Reducing cost of hydrogen
Hydrogen production expenses: Capital costs: 28% for natural gas reformer Operating Expenses: 16% for natural gas Minimizing natural gas use has potential to minimize operating expenses, while meeting GHG emission goals to meet Renewable fuel standard (RFS).
Ref: Biomass Multi-year Program Plan

10 Managed by UT-Battelle for the U.S. Department of Energy Presentation_name
Project objectives
• Develop reforming process for efficient conversion of aqueous phase organics to hydrogen via microbial electrolysis.
• Develop energy-efficient methods to separate bio-oil aqueous phase, extract acidic and polar compounds from bio-oil for production of hydrogen.
• Demonstrate improvement in hydrogen efficiency via mass and energy balance.
• Demonstrate potential for reduction in life cycle greenhouse gas emissions via life-cycle analysis.
Address Technical Area 2: Hydrogen Efficiency, Subtopic: Reforming hydrogen from aqueous streams in biomass liquefaction.

11 Managed by UT-Battelle for the U.S. Department of Energy Presentation_name
Potential Impacts
• The proposed work will enable efficient conversion of the corrosive and polar, carbon-containing compounds in bio-oil aqueous phase to hydrogen.
• Potential to improve the stability of the bio-oil and reduce corrosivity.
• The implementation of MEC reforming and separation unit operations being developed in this study will enable improvements in hydrogen production and overall biomass to biofuel conversion efficiency while minimizing use of natural gas and thus reducing life cycle greenhouse gas emissions.

Microbial Electrolysis

14 Managed by UT-Battelle for the U.S. Department of Energy Presentation_name
Bioelectrochemical Conversion Technology
2 Borole, A. P., Reguera, G; Ringeisen, B.; Wang, Z-W; Feng, Y.; Kim, B H; l. (2011). "Electroactive biofilms: Current status and future research needs.“ Energy Environ. Sci. 4: 4813-4834.
Substrate
Product / Fuel /
Chemical Organic Carbon/ Reduced
substrate/ Waste
CO2 + H2O
Bio
cata
lytic
ano
de
Cat
hode
BioElectrochemical System (BES)
e- e-
H+
H+
H+
H+
CxHyOz → CO2 + H+ + e- MEC: H+ + e- → H2
Nutrients
Cell mass
Load/Power source
Reduction
Type of BES Cathode Product substrate MFC Oxygen Electricity MEC Protons Biohydrogen BES Acetate Ethanol/biofuel BES Oxygen Hydrogen peroxide BES Carbon dioxide Electrofuels BES other/sunlight Photo/biofuels
Proposed path: Bio-oil Aqueous Phase → electrons + protons in MEC (anode ) → BioH2 (cathode)

15 Managed by UT-Battelle for the U.S. Department of Energy Presentation_name
Microbial Electrolysis for converting aqueous phase generated during pyrolysis to hydrogen
• Pyrolysis derived aqueous phase – Potential for loss of carbon via aqueous phase – Emulsifies with oil phase – Makes bio-oil unstable (polar-non-polar separation over
time) – Makes bio-oil corrosivity due to acids (bio-oil pH = 2.8)
• Microbial electrolysis – Conversion of biooil aqueous organics to hydrogen – Anode: Conversion of degradable organics to electrons,
protons and CO2
– Cathode: Proton reduction to hydrogen at applied potential of 0.3-1V.
– Develop electroactive biofilms with tolerance to inhibitory and toxic molecules in biooil aqueous phase (furfural, HMF, phenolics, etc.)
H2
H+ Organic Carbon
CO2 + H2O
Bio
cata
lytic
ano
de
e- e-
CxHyOz → CO2 + H+ + e- H+ + e- → H2
Nutrients
Cell mass
Cat
hode
> 0.3 V
Cathode catalyst
H+
H+
H+
H+
MEC

16 Managed by UT-Battelle for the U.S. Department of Energy Presentation_name
Biological hydrogen production MEC vs. Existing Technologies
Borole, A. P. (2011). Biofuels, Bioproducts & Biorefining "Improving energy efficiency and enabling water recycle in biorefineries using bioelectrochemical cells." 5(1): 28-36.

17 Managed by UT-Battelle for the U.S. Department of Energy Presentation_name
Pyrolysis-derived water-soluble compounds
• Furfural
• Acetic acid
• Phenolics
• Vanillin
• Eugenol
• Acetol
• unknowns
Convert in MEC: e.g., Vanillin: C8H8O3 + 13H2O → 17H2 + 8CO2.
Biomass to fuels conversion reaction (with MEC reforming included): 30 CH2O (biomass) + 0 CH4 + 0 H2O + kW → C8H18 + C12H23 + 10 CO2 + 10 H2O (gasoline) (diesel)
Many of these molecules have not been tested in MEC previously
Note: The data on this slide should not be distributed, forwarded or cited.

18 Managed by UT-Battelle for the U.S. Department of Energy Presentation_name
H2
H+ Organic Carbon
CO2 + H2O
Bio
cata
lytic
ano
de
e- e-
CxHyOz → CO2 + H+ + e- H+ + e- → H2
Nutrients
Cell mass
Cat
hode
> 0.3 V
Cathode catalyst
H+
H+
H+
H+
Microbial Electrolysis Cell
Biology Microbiology Molecular Biology Biocatalysis
Engineering Chemical Engineering Electrochemical Engineering Environmental Engineering Life-cycle analysis
Electrochemistry Electrocatalysis Voltammetry Chronoamperometry Impedance spectroscopy
Materials chemistry Membrane materials Electrode materials Catalyst formulation
Analytical chemistry Bio-oil and aqueous phase analysis -Chromatography -Mass spectrometry -UV-Vis spectroscopy
Interdisciplinary Components

19 Managed by UT-Battelle for the U.S. Department of Energy Presentation_name
Handling toxic molecules in MFC/MEC • Typical substrates
– Hemicellulose byproducts - acetic acid (deacetylation).
– Sugar degradation products – furfural, hydroxymethylfurfural
– Lignin degradation products – phenolic aldehydes and ketones and acids.
• Investigate energy recovery from acidic molecules while managing toxic compounds present in biooil aqueous phase (mechanisms).
• Transformation of toxic molecules to non-toxic products without energy extraction
• Mineralization of recalcitrant and inhibitory byproducts 1
• Evaluate potential for water recycle
• Applicable to fermentation-derived biorefinery wastewater stream, enabling processing high biomass loading (> 20% solids) cellulosic biochemical conversion process with water recycle.
Borole, et.al., 2009, Biotechnol for Biofuels., Controlling accumulation of fermentation inhibitors in biorefinery process water using Microbial Fuel Cells, April 2009, 2, 1, 7.

20 Managed by UT-Battelle for the U.S. Department of Energy Presentation_name
Approach to bioanode development • Development of engineered bioanode systems for energy
recovery – To increase current density.
• Designed novel BES systems to achieve high coulombic efficiency and current density – Engineering parameter optimization.
• Enrichment of electroactive microbial catalysts for conversion of organic acids, sugars, etc to bioenergy – Biocatalyst development.
• Assessment of limitations in bioanode performance – Electrochemical Impedance Spectroscopy.
• Characterization of the microbial communities to understand the diversity of novel electrogenic organisms.
– Microbial diversity of exoelectrogens
Borole, A. P. (2010). Microbial fuel cell with improved anode, US Patent 7,695,834. USA, UT-Battelle. US Patent 7,695,834.
Borole et.al., 2009, J. Power Sources, 191(2): 520-527..
75 µm
MFC-A (day 113)
0% 11%
0%
10%
0%
8%
25%
42%
4%
MFC-A (day 126)
0%18%
1%
27%
2%4%
26%
19%
3%
MFC-A (day 136)0%
20%
0%
29%
0%2%
40%
7%
2%MFC-B (day 162)
2%
54%
0%11%
9%
11%
7%
0%
1%
5%

21 Managed by UT-Battelle for the U.S. Department of Energy Presentation_name 21
Conversion of furan aldehydes and phenolic molecules in bioanode
– Demonstrated potential of bioanode to remove furfurals, phenolics, organic acids, and sugar derivatives in model aqueous streams3.
– Examine effect of concentration of toxic/ inhibitory molecules at representative concentrations (acetate 10 g/L, 2-furfural, HMF, phenolics: 1-4 g/L) • No detrimental effect on current production
– Near complete removal of the substrates – Coulombic efficiency up to 64% – Current density : up to 10 A/m2 (3700
mW/m2 power density)
Borole, et.al., 2009, Biotechnol for Biofuels., Controlling accumulation of fermentation inhibitors in biorefinery process water using Microbial Fuel Cells, April 2009, 2, 1, 7.
0
200
400
600
800
1000
-1.0 1.0 3.0 5.0 7.0Pow
er d
ensi
ty, m
W m
-2
Current density, A m-2
0.1 g/L 2-furfural2 g/L 2-furfural0.2 g/L acetate5 g/L acetate10 g/L acetate
0
500
1000
1500
2000
2500
3000
3500
4000
0 5 10 15
mW
m-2
A m-2
Furfural5-HMF4-HB

22 Managed by UT-Battelle for the U.S. Department of Energy Presentation_name
Electroactive Biocatalyst Characterization • Biofilm sample from bioanode developed for model substrate mixtures
(furfural, HMF, 3 phenolic compounds, acetic acid, ) • 16S rRNA analysis
14%
19%
9%
50%
6% 2%
Alphaproteobacteria
BetaproteobacteriaRhodocyclaceaeBetaproteobacteriaBurkholderiaceaeDeltaproteobacteriaDesulfovibrioGammaproteobacteria
Firmicutes Anaerofilum

23 Managed by UT-Battelle for the U.S. Department of Energy Presentation_name

24 Managed by UT-Battelle for the U.S. Department of Energy Presentation_name
Developing high performance MECs
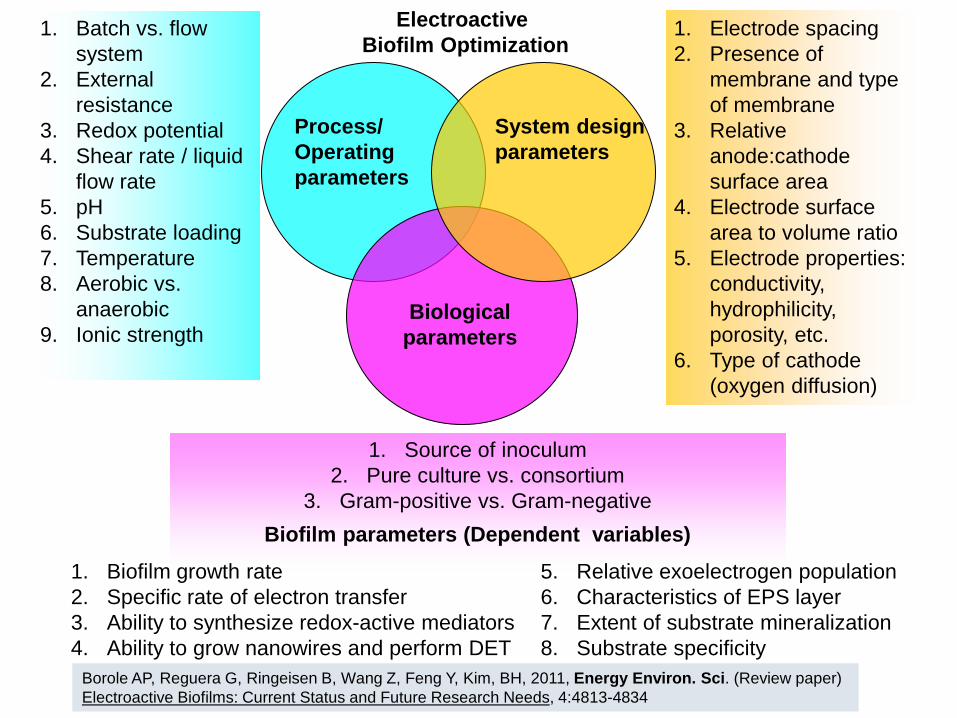
Process/ Operating parameters
Biological parameters
Electroactive Biofilm Optimization
1. Batch vs. flow system
2. External resistance
3. Redox potential 4. Shear rate / liquid
flow rate 5. pH 6. Substrate loading 7. Temperature 8. Aerobic vs.
anaerobic 9. Ionic strength
1. Electrode spacing 2. Presence of
membrane and type of membrane
3. Relative anode:cathode surface area
4. Electrode surface area to volume ratio
5. Electrode properties: conductivity, hydrophilicity, porosity, etc.
6. Type of cathode (oxygen diffusion)
1. Source of inoculum 2. Pure culture vs. consortium
3. Gram-positive vs. Gram-negative Biofilm parameters (Dependent variables)
1. Biofilm growth rate 2. Specific rate of electron transfer 3. Ability to synthesize redox-active mediators 4. Ability to grow nanowires and perform DET
System design parameters
5. Relative exoelectrogen population 6. Characteristics of EPS layer 7. Extent of substrate mineralization 8. Substrate specificity Borole AP, Reguera G, Ringeisen B, Wang Z, Feng Y, Kim, BH, 2011, Energy Environ. Sci. (Review paper)
Electroactive Biofilms: Current Status and Future Research Needs, 4:4813-4834

26 Managed by UT-Battelle for the U.S. Department of Energy Presentation_name
Stability of maximum current production
Current density increased first 30 days, thereafter, it remained ~ 35 A/m2 for 20 days, but not without fluctuations. Coulombic efficiency ranged from 50-80% (for fermentative substrates glucose + lactate)
Current prouction (-0.2V vs Ag/AgCl)
0
10
20
30
40
50
0 10 20 30 40 50 60
days
mA
/cm
2
Current production
A/m
2
Note: The data on this slide should not be distributed, forwarded or cited.

27 Managed by UT-Battelle for the U.S. Department of Energy Presentation_name
Biooil aqueous phase analysis
Bio-oil aqueous phase characterization via HPLC
Note: The data on this slide should not be distributed, forwarded or cited.

1 Presented by: Spyros G. Pavlostathis and Xiaofei Zeng
Renewable Hydrogen Production from Pyrolysis Aqueous Phase Task II: Reforming of Aqueous Phase to Hydrogen using MEC
• Objective: Assess the biotransformation extent of specific model compounds in anodic biofilms and their contribution to hydrogen production
H2
MEC
Biofuels
Hydrogenation
Oil Phase
Aqueous Phase
Page 1

2 Presented by: Spyros G. Pavlostathis and Xiaofei Zeng
• Experimental Setup
Page 2
Renewable Hydrogen Production from Pyrolysis Aqueous Phase Task II: Reforming of Aqueous Phase to Hydrogen using MEC
A MFC maintained as stock culture to provide inoculum for MECs
MFC
Furan Compounds
Phenolic Compounds
Model Compounds MEC

3 Presented by: Spyros G. Pavlostathis and Xiaofei Zeng
• Results
Page 3
Renewable Hydrogen Production from Pyrolysis Aqueous Phase Task II: Reforming of Aqueous Phase to Hydrogen using MEC
Time (d)0 10 20 30 40 50 80 90 100
Curr
ent
Den
sity
(m
A/cm
2 )
0.00
0.05
0.10
0.15
0.20
0.25
0.30
500250100100
Resistance (Ω):
Time (d)70 75 80 85 90 95 100 105
H2
Prod
uctio
n (m
L/L
anod
e)0
50
100
150
200
250
300
350
Cycle
16 17 18
Sol
uble
CO
D (m
g/L)
0
100
200
300
400InitialFinal
Cycle
16 17 18
Met
abol
ites
Abun
danc
e (m
UA*
s)
0
1000
2000
3000
4000
P18-210P24-210
On-going Work
1. Startup of MEC 2. Bioconversion of furan
and phenolic compounds in separate MFCs
3. Biotransformation pathways of model compounds
Note: The data on this slide should not be distributed, forwarded or cited.

31 Managed by UT-Battelle for the U.S. Department of Energy Presentation_name
Potential application in bioconversion-based biorefinery
Estimated Energy production Electricity production = 2.5 MW (MFC) or 7000 m3/hr H2 (MEC) ~ 25% of total power needs for a biorefinery targeting 70 millions gallons ethanol/year.
Borole, A. P. US Patent, (2012). Microbial fuel cell treatment of ethanol fermentation process water, UT-Battelle, LLC. Borole AP, Mielenz J, Intl J Hydrogen Energy, 2011, Estimating Hydrogen Production Potential in Biorefineries Using Microbial Electrolysis Cell Technology, 36, 14787–14795.
Mixing
Overliming followed
by pH adjustment
S/L Separation
Distillation
Fermentation
Saccharification
Further product purification
Cell Production
S/L Separation
Treated recycle water
Liquid
Solids Treated recycle
water
Enzyme
Nutrients
Process water
Bottoms (with solids)
Bioalcohol
Recycle water
Solids
Liquid
To Boiler Dilution water
MFC / MEC
Recirculating dilution water El
ectr
icity
/ H
ydro
gen
Pretreatment Biomass
Enable water recycle
H2
H+ Organic Carbon/ Inhibitor molecules
CO2 + H2O
Bioc
atal
ytic
ano
de
e- e-
CxHyOz → CO2 + H+ + e- H+ + e- → H2
Nutrients
Cell mass
Cath
ode
> 0.3 V
Cathode catalyst
H+
H+
H+
H+

32 Managed by UT-Battelle for the U.S. Department of Energy Presentation_name
10.7 % Distillation Bottoms
Stover feedstock
Pretreatment and
Conditioning (1)
Hydrolyzate Distillation and Dehydration (3)
Evaporation (4)
Ethanol
Burner / Boiler (5)
Electricity (8)
Water Treatment / Recycle (7)
Blowdown
Methane And
Sludge Pretreatment Flush
Cooling Tower
(6)
Evaporator Heat (via
water), 11.7%
Proc/Cond Heat, 0.7% Ferm. Heat, 0.6% Distillation Heat, 8.6%
Boiler Heat, 2.7 %
WWT Heat, 0.6 % Syrup (18.8%)
Solid Residue (36.6%)
110%
Ferm. broth
110%
Ambient Heat,
CW Evaporation
Flue gas,
22.4%
7.6%
14.7% 0.6% 1.3%
8 %
67.5% Energy In, 100%
HP Steam 9 % 3.2%
Process
Make-up water 88.5%
Water in 7%
Water in 3%
Saccharification Fermentation
(2)
Enzyme
Water losses, 99% (including evaporator, cooling tower and boiler)
LP Steam
48.7%
4.8%
Legend
Green ovals indicate percent water content of the process stream in the flowsheet
Teal boxes show energy content of each stream as percent of total energy in (i.e., biomass) throughout the process
Yellow shapes indicate energy/water loss from the existing process stream, which can be minimized using MECs.
Product streams showing energy content as fraction of total energy in (Biomass) in the process reported by NREL Heat loss paths in the process reported by NREL
7.4%
Potential for improvement in energy efficiency and ability to recycle water using MECs.
Borole AP, Biofuels, Bioproducts & Biorefining, Improving Energy Efficiency and Enabling Water Recycle in Biorefineries Using Bioelectrochemical Cells. 5(1):28-36 (2011).

33 Managed by UT-Battelle for the U.S. Department of Energy Presentation_name
Projected mature biorefinery scenarios
AFEX pretreatment +
Consolidated bioprocessing
Biomass
Ammonia Ethanol
Solid residue
Gasification Gas cleanup H2S, CO2 separation
FT Synthesis
Separation/Refining
Power Island
MEC
FT liquids
Export electricity
Process steam and electricity
Treated water Hydrogen
Aqueous stream after solids removal
AFEX pretreatment +
Consolidated bioprocessing
Biomass
Ammonia Ethanol
Solid residue
Gasification Gas cleanup H2S, CO2 separation
FT Synthesis
Separation/Refining POX
Power Island
WWT
FT liquids
Export electricity
Process steam and electricity
Unconverted syngas
Biogas Treated water
Aqueous stream after solids removal
Borole AP, Biofuels, Bioproducts & Biorefining, Improving energy efficiency and enabling water recycle in biorefineries using bioelectrochemical cells., 5(1):28-36 (2011).
Laser, et al., 2009, Biofuels, Bioproducts & Biorefining
34 Managed by UT-Battelle for the U.S. Department of Energy Presentation_name
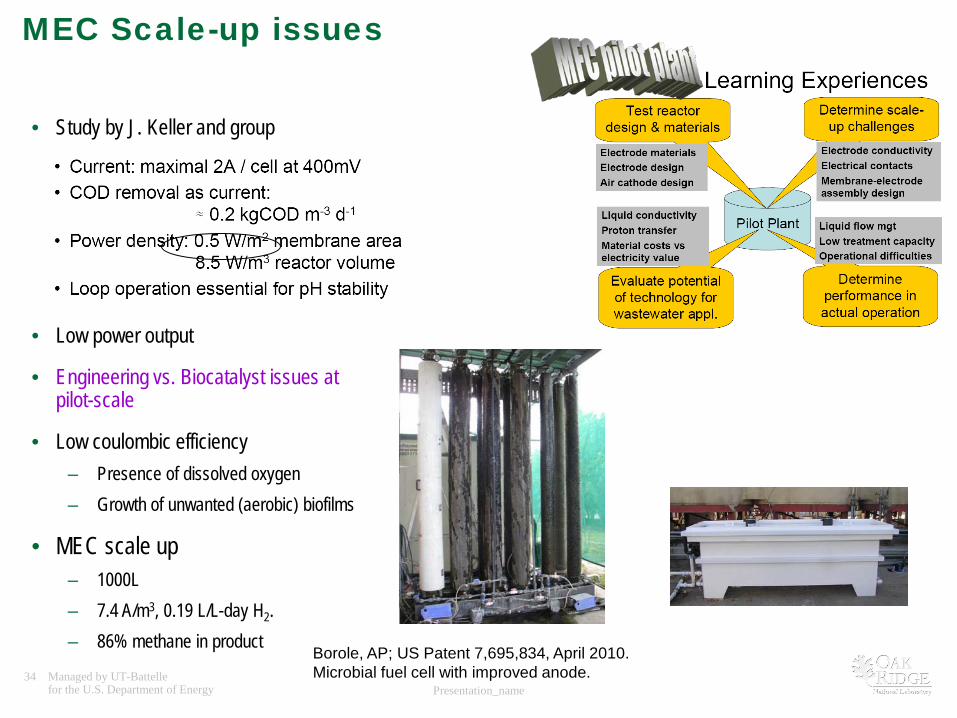
MEC Scale-up issues
• Study by J. Keller and group
• Low power output
• Engineering vs. Biocatalyst issues at pilot-scale
• Low coulombic efficiency – Presence of dissolved oxygen – Growth of unwanted (aerobic) biofilms
• MEC scale up – 1000L – 7.4 A/m3, 0.19 L/L-day H2. – 86% methane in product
Borole, AP; US Patent 7,695,834, April 2010. Microbial fuel cell with improved anode.

Bio-oil production and aqueous phase bio-oil separation for MEC experiments from switchgrass using pyrolysis unit at UTK CRC
Bio-oil production by pilot auger pyrolysis reactor at UTK CRC
• Source: switch grass particle size: less than 2mm • Feeding rate: 10kg/hr • Reaction temperature: 500°C and 550°C • Bio-oil yield: 40-50wt%, biochar: 25-30wt%,
gas:20-25wt% • The bio-oil is combined by three condensers
Aqueous phase bio-oil separation
• Water: oil: 4:1 • Vigorous shaking • Standing for overnight at
4°C • Centrifugation:
5000rpm/min for 30min Fractions of bio-oil (wt% of crude bio-oil) after separation
Pilot auger pyrolysis reactor at UTK CRC
36.7%
5.5%
35.1%
22.6%
water in crude bio-oil to aqueous phasewater in crude bio-oil to organic phasechemicals to aqueous phasechemicals to oganic phase
Fractions of crude bio-oil (wt%) before separation
42.27%
55.68%
1.74% 0.31%
Water Chemicals Solids Ash
Note: The data on this slide should not be distributed, forwarded or cited.

Characterization of crude and aqueous phase bio-oil Properties of crude and aqueous phase bio-oil
Properties Crude bio-oil Aqueous phase bio-oil
Water content (wt%) 42.27±0.66 91.72±1.03
Total solid (wt%) 1.74±0.25 Not detected
pH value 2.84±0.07 3.02±0.01
Density (g/ml) 1.13±0.001 1.01±0.004
Ash (wt%) 0.31±0.04 0.085±0.004 Viscosity at 40 °C
centistokes (cSt) 6.5±0.82 0.75±0.01
TAN, mg KOH/g 137.39±2.96 30.13±1.28
Major chemicals identification and quantification in aqueous phase bio-oil
Aqueous phase
Chemicals extracted by organic solvent
Organic solvent extraction
GC/MS
chemicals identification chemicals Quantification
Aqueous phase
GC HPLC
Most volatiles: Aldehydes, ketones, lignin
Acids and sugars
Note: The data on this slide should not be distributed, forwarded or cited.
Removal of Water from Bio-oil Liquid-Liquid Extraction of Bio-oil Components
Investigators: Sotira Yiacoumi and Costas Tsouris Ph.D. Student: Kyoung Eun (Lydia) Park
School of Civil and Environmental Engineering Georgia Institute of Technology

Aqueous Solution
Organic Solvent
Aqueous Extraction of Bio-oil with the Centrifugal Contactor
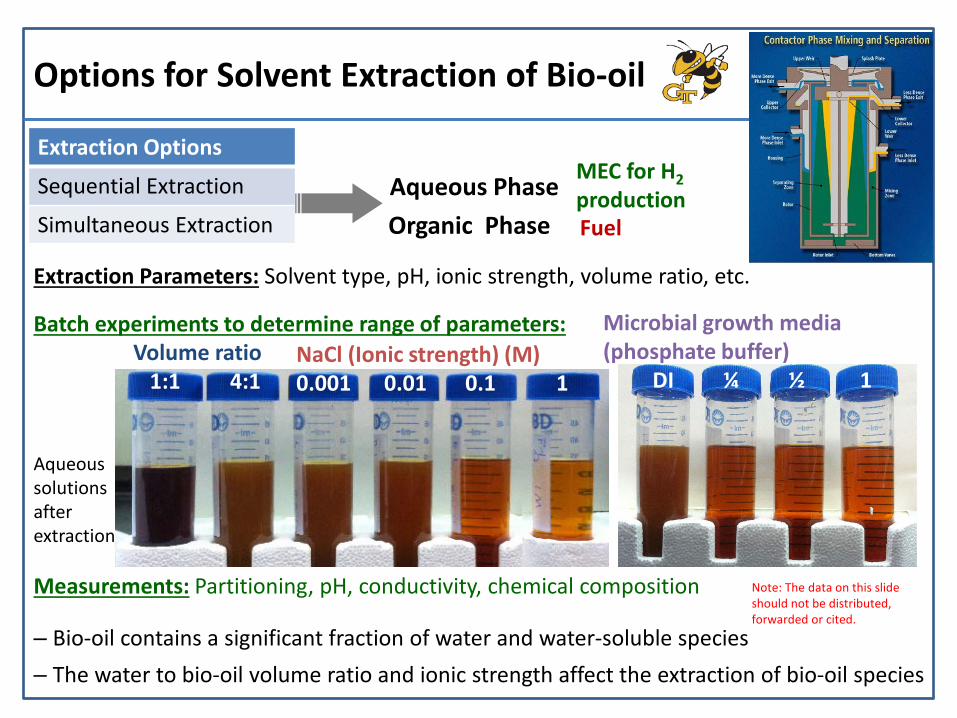
Options for Solvent Extraction of Bio-oil
Aqueous Phase Organic Phase
MEC for H2 production Fuel
Extraction Options
Sequential Extraction
Simultaneous Extraction
Extraction Parameters: Solvent type, pH, ionic strength, volume ratio, etc.
Volume ratio 1:1 4:1
NaCl (Ionic strength) (M) 0.001 0.01 0.1 1
Microbial growth media (phosphate buffer) DI ¼ ½ 1
‒ Bio-oil contains a significant fraction of water and water-soluble species ‒ The water to bio-oil volume ratio and ionic strength affect the extraction of bio-oil species
Measurements: Partitioning, pH, conductivity, chemical composition
Batch experiments to determine range of parameters:
Aqueous solutions after extraction
Note: The data on this slide should not be distributed, forwarded or cited.

1 Managed by UT-Battelle for the Department of Energy
Membrane Separations-Objectives • Removal of cellular debris in the MEC effluent.
• Evaluate impact of carryover oil, fines and contaminants in recycle water on downstream processes.
• Produce clean water for recycle to aqueous phase.
• Feed volumes from microbial reactor: <1L -10L
• Identify and develop process parameters using hollow fiber and tubular ceramic membranes- hydrophobic (PVDF) and hydrophilic (PAN) and zirconia.
• Flux stability over time, membrane fouling, back pulsing and membrane regeneration.
• Process optimization, integration, reliability and scalability.
• Obtain engineering data for scale-up and assess energy requirements.

2 Managed by UT-Battelle for the Department of Energy
Verification of water flux for Pall membranes
Note: The data on this slide should not be distributed, forwarded or cited.
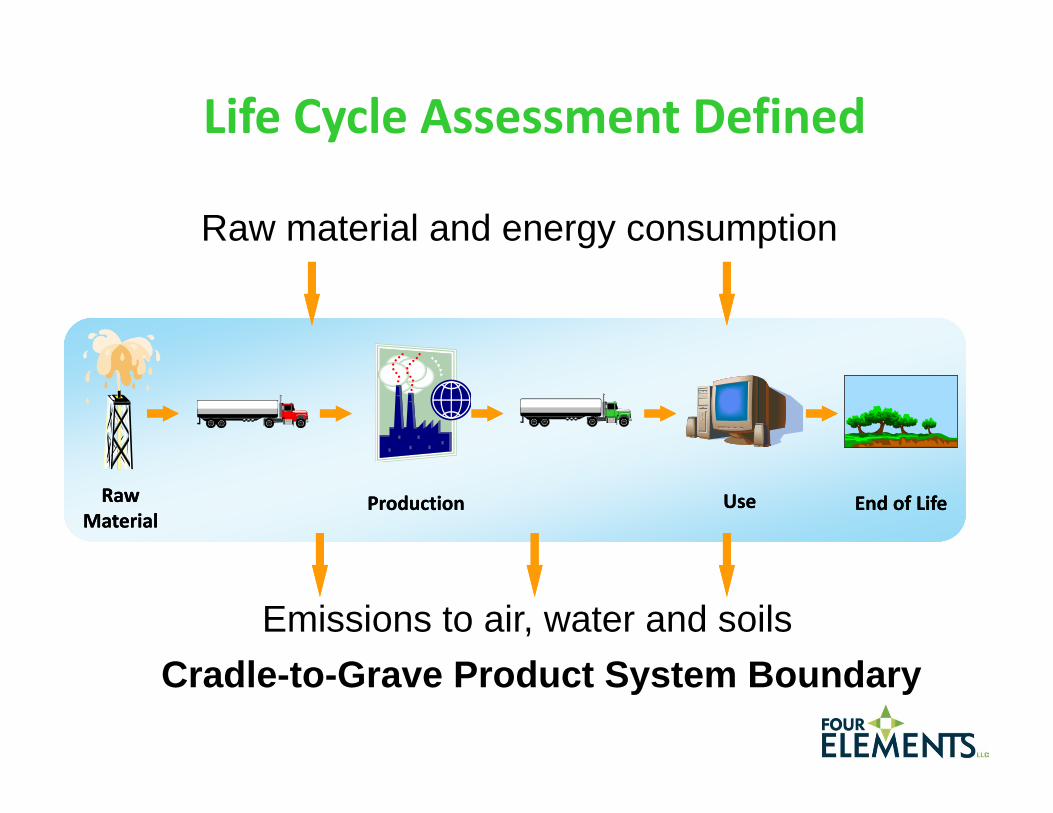
Life Cycle Assessment Defined
Cradle-to-Grave Product System Boundary
Raw material and energy consumption
Emissions to air, water and soils
RawMaterial
RawMaterial
ProductionProduction UseUse End of LifeEnd of Life
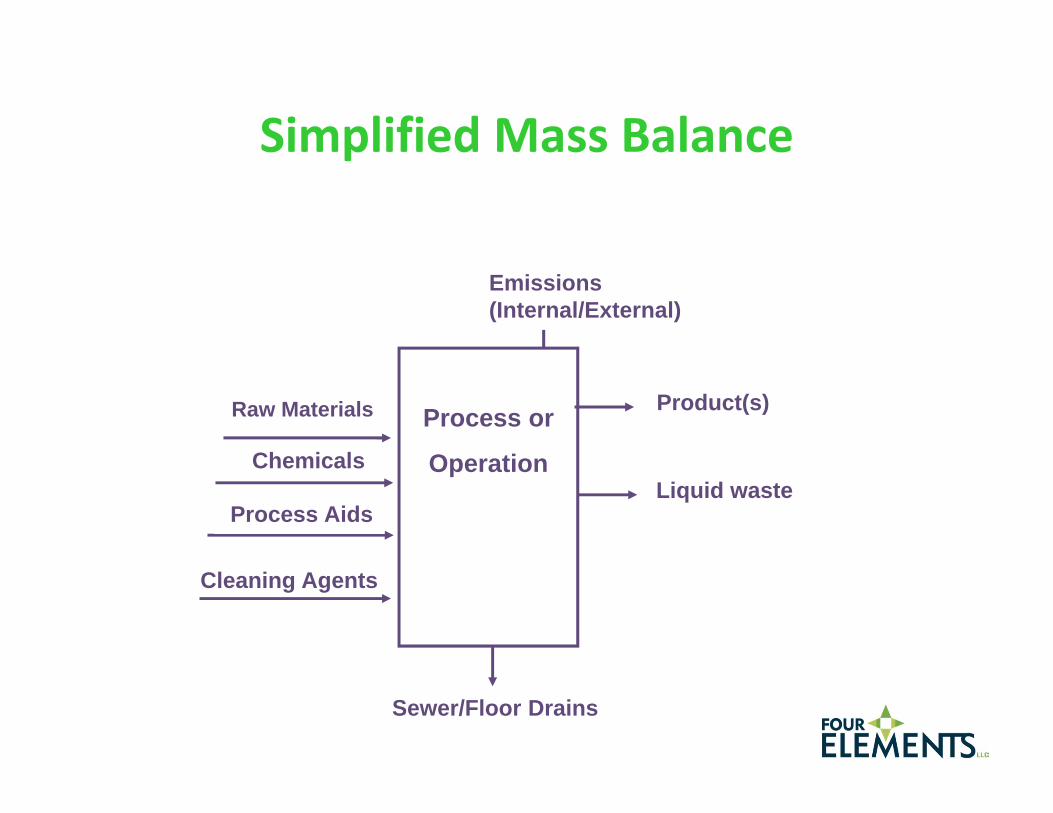
Simplified Mass Balance
Process or
Operation
Product(s)
Liquid waste
Sewer/Floor Drains
Chemicals
Process Aids
Cleaning Agents
Emissions (Internal/External)
Raw Materials

Balance sheet of environmental inflows and outflows
Sample list
Life Cycle Inventory

Sample Life Cycle Impact Assessment Calculation
Global Warming Potential
Corresponding characterization
factors
GWP equiv. factor LCI Result LCIA Result
Carbon dioxide 1 2000 2000Methane 21 15 315Nitrous Oxide 310 0.1 31
Total Potential GWP (CO2-eq) --> 2346

-60
-40
-20
0
20
40
60
80
100
120
Petro PolyolImpact ScoreEquals 100%
Assessing Environmental Performanceof Soy vs. Petroleum Polyols
Petro Polyol Soy Polyol
Sample Comparative Results

48 Managed by UT-Battelle for the U.S. Department of Energy Presentation_name