Meteorological conditions, seasonal and annual mass...
11
Meteorologicalconditions,seasonalandannualmassbalancesof ChhotaShigriGlacier,westernHimalaya,India Mohd Farooq AZAM, 1,2,3 AL. RAMANATHAN, 2 P. WAGNON, 1,4 C. VINCENT, 5 A. LINDA, 2,6 E. BERTHIER, 7 P. SHARMA, 2 A. MANDAL, 2 T. ANGCHUK, 2 V.B. SINGH, 2 J.G. POTTAKKAL 2,8 1 IRD/UJF – Grenoble I/CNRS/G-INP, LGGE UMR 5183, LTHE UMR 5564, 38402 Grenoble Cedex, France 2 School of Environmental Sciences, Jawaharlal Nehru University, New Delhi, India 3 Water Resources Systems Division, National Institute of Hydrology, Roorkee, India 4 International Centre for Integrated Mountain Development, Kathmandu, Nepal 5 UJF – Grenoble I/CNRS, LGGE UMR 5183, 38041 Grenoble Cedex, France 6 Department of Environmental Sciences, School of Earth and Environmental Sciences, Central University of Himachal Pradesh, Dharamshala, India 7 LEGOS, CNRS, Université de Toulouse, Toulouse, France 8 Western Himalayan Regional Centre, National Institute of Hydrology, Jammu, India Correspondence: Mohd Farooq Azam <[email protected]> ABSTRACT. We present the updated glaciological mass balance (MB) of Chhota Shigri Glacier, the longest continuous annual MB record in the Hindu-Kush Karakoram Himalaya (HKH) region. Additionally, 4 years of seasonal MBs are presented and analyzed using the data acquired at an automatic weather station (AWS-M) installed in 2009 on a lateral moraine (4863ma.s.l.). The glaciologicalMBseriessince2002isfirstrecalculatedusinganupdatedglacierhypsometryandthen validatedagainstgeodeticMBderivedfromsatellitestereo-imagerybetween2005(SPOT5)and2014 (Pléiades).ChhotaShigriGlacierlostmassbetween2002and2014withacumulativeglaciologicalMB of–6.72mw.e.correspondingtoameanannualglacier-wideMB(B a )of–0.56mw.e.a –1 .Equilibrium- linealtitude(ELA 0 )forthesteady-stateconditioniscalculatedas �4950ma.s.l.,correspondingtoan accumulation–arearatio(AAR 0 )of �61%.AnalysisofseasonalMBsbetween2009and2013withair temperature from AWS-M and precipitation from the nearest meteorological station at Bhuntar (1050ma.s.l.)suggeststhatthesummermonsoonisthekeyseasondrivingtheinterannualvariabilityof B a for this glacier. The intensity of summer snowfall events controls the B a evolution via controlling summerglacier-wideMB(B s ). KEYWORDS: accumulation, glacier mass balance, glacier meteorology, mountain glaciers 1.INTRODUCTION The Hindu-Kush Karakoram Himalaya (HKH), covering a glacierized area of �40000km 2 (Bolch and others, 2012), are the birthplace of some of the largest rivers in the world. The role of HKH glaciers as an important source of fresh water for the population living in the adjacent lowlands has been highlighted by several studies (e.g. Immerzeel and others, 2010; Kaser and others, 2010; Thayyen and Gergan, 2010), but these glaciers have not been monitored on a long-term basis (Bolch and others, 2012; Vincent and others, 2013). Mass-balance observations are needed to study the impact of climate change, especially in high remote areas such as the HKH region where meteorological observations are difficult and, thus, only recent and sparse (e.g. Fowler and Archer, 2006; Bhutiyani and others, 2010; Shekhar and others, 2010; Dimri and Dash, 2012). A contrasting pattern of glacier change has been observed throughout the HKH range, mainly revealed by studies using remote-sensing data (e.g. Fujita and Nuimura, 2011; Kääb and others, 2015). The poor understanding of HKH glaciers has been high- lightedinseveralrecentstudies(e.g.Cogley,2009;Bolchand others,2012;Vincentandothers,2013).Mostofthesestudies attribute the major gaps in our knowledge of the behavior of these glaciers mainly to an insufficient number of in situ measurements, only partly substituted by remote-sensing studies (Bolch and others, 2012; Vincent and others, 2013). Obviously, ground-based observations are not possible for all glaciers in the HKH region, but they are necessary to validate/confirm the remotely sensed observations. Chhota Shigri is a representative (Vincent and others, 2013) ‘tier 2’-type (Paul and others, 2007) glacier in the Lahaul valley and has been studied for various aspects such asMB,icethickness,surfacevelocity,MBreconstructionand energybalance(Wagnonandothers,2007;Azamandothers, 2012, 2014a,b; Vincent and others, 2013). The goals of the present work are: (1) to understand the temporal and seasonal variability of meteorological parameters on Chhota Shigri Glacier using the glacier-side automatic weather station (AWS-M) data available between 2009 and 2013, (2) to discuss 12 years (2002–14) of annual glacier-wide MBs (B a ) and their validation against geodetic MB between 2005 and 2014, and (3) to present 4 years (2009–13) of measured seasonal (winter and summer) glacier-wide MBs (B w and B s ) and analyze the meteorological control of B a , B w and B s . 2.STUDYSITEANDAWS-MDESCRIPTION Chhota Shigri Glacier (32.28°N, 77.58°E) is a valley-type, non-surgingglacierlocatedintheChandra–Bhagariverbasin Annals of Glaciology 57(71) 2016 doi: 10.3189/2016AoG71A570 328 © The Author(s) 2016. This is an Open Access article, distributed under the terms of the Creative Commons Attribution licence (http://creativecommons. org/licenses/by/4.0/), which permits unrestricted re-use, distribution, and reproduction in any medium, provided the original work is properly cited. http://dx.doi.org/10.3189/2016AoG71A570 Downloaded from http:/www.cambridge.org/core. IRD - France, on 04 Nov 2016 at 10:14:49, subject to the Cambridge Core terms of use, available at http:/www.cambridge.org/core/terms.
Transcript of Meteorological conditions, seasonal and annual mass...

Meteorological conditions seasonal and annual mass balances ofChhota Shigri Glacier western Himalaya India
Mohd Farooq AZAM123 AL RAMANATHAN2 P WAGNON14 C VINCENT5
A LINDA26 E BERTHIER7 P SHARMA2 A MANDAL2 T ANGCHUK2
VB SINGH2 JG POTTAKKAL28
1IRDUJF ndash Grenoble ICNRSG-INP LGGE UMR 5183 LTHE UMR 5564 38402 Grenoble Cedex France2School of Environmental Sciences Jawaharlal Nehru University New Delhi India3Water Resources Systems Division National Institute of Hydrology Roorkee India4International Centre for Integrated Mountain Development Kathmandu Nepal5UJF ndash Grenoble ICNRS LGGE UMR 5183 38041 Grenoble Cedex France
6Department of Environmental Sciences School of Earth and Environmental SciencesCentral University of Himachal Pradesh Dharamshala India7LEGOS CNRS Universiteacute de Toulouse Toulouse France
8Western Himalayan Regional Centre National Institute of Hydrology Jammu IndiaCorrespondence Mohd Farooq Azam ltfarooqamanyahoocoingt
ABSTRACT We present the updated glaciological mass balance (MB) of Chhota Shigri Glacier thelongest continuous annual MB record in the Hindu-Kush Karakoram Himalaya (HKH) regionAdditionally 4 years of seasonal MBs are presented and analyzed using the data acquired at anautomatic weather station (AWS-M) installed in 2009 on a lateral moraine (4863masl) Theglaciological MB series since 2002 is first recalculated using an updated glacier hypsometry and thenvalidated against geodetic MB derived from satellite stereo-imagery between 2005 (SPOT5) and 2014(Pleacuteiades) Chhota Shigri Glacier lost mass between 2002 and 2014 with a cumulative glaciological MBof ndash672mwe corresponding to a mean annual glacier-wide MB (Ba) of ndash056mwe andash1 Equilibrium-line altitude (ELA0) for the steady-state condition is calculated as 4950masl corresponding to anaccumulationndasharea ratio (AAR0) of 61 Analysis of seasonal MBs between 2009 and 2013 with airtemperature from AWS-M and precipitation from the nearest meteorological station at Bhuntar(1050masl) suggests that the summer monsoon is the key season driving the interannual variability ofBa for this glacier The intensity of summer snowfall events controls the Ba evolution via controllingsummer glacier-wide MB (Bs)
KEYWORDS accumulation glacier mass balance glacier meteorology mountain glaciers
1 INTRODUCTIONThe Hindu-Kush Karakoram Himalaya (HKH) covering aglacierized area of 40 000 km2 (Bolch and others 2012)are the birthplace of some of the largest rivers in the worldThe role of HKH glaciers as an important source of freshwater for the population living in the adjacent lowlands hasbeen highlighted by several studies (eg Immerzeel andothers 2010 Kaser and others 2010 Thayyen and Gergan2010) but these glaciers have not been monitored on along-term basis (Bolch and others 2012 Vincent andothers 2013) Mass-balance observations are needed tostudy the impact of climate change especially in highremote areas such as the HKH region where meteorologicalobservations are difficult and thus only recent and sparse(eg Fowler and Archer 2006 Bhutiyani and others 2010Shekhar and others 2010 Dimri and Dash 2012) Acontrasting pattern of glacier change has been observedthroughout the HKH range mainly revealed by studies usingremote-sensing data (eg Fujita and Nuimura 2011 Kaumlaumlband others 2015)
The poor understanding of HKH glaciers has been high-lighted in several recent studies (eg Cogley 2009 Bolch andothers 2012 Vincent and others 2013)Most of these studiesattribute the major gaps in our knowledge of the behavior ofthese glaciers mainly to an insufficient number of in situ
measurements only partly substituted by remote-sensingstudies (Bolch and others 2012 Vincent and others 2013)Obviously ground-based observations are not possible forall glaciers in the HKH region but they are necessary tovalidateconfirm the remotely sensed observations
Chhota Shigri is a representative (Vincent and others2013) lsquotier 2rsquo-type (Paul and others 2007) glacier in theLahaul valley and has been studied for various aspects suchasMB ice thickness surface velocity MB reconstruction andenergy balance (Wagnon and others 2007 Azam and others2012 2014ab Vincent and others 2013) The goals of thepresent work are (1) to understand the temporal andseasonal variability of meteorological parameters on ChhotaShigri Glacier using the glacier-side automatic weatherstation (AWS-M) data available between 2009 and 2013(2) to discuss 12 years (2002ndash14) of annual glacier-wide MBs(Ba) and their validation against geodetic MB between 2005and 2014 and (3) to present 4 years (2009ndash13) of measuredseasonal (winter and summer) glacier-wide MBs (Bw and Bs)and analyze the meteorological control of Ba Bw and Bs
2 STUDY SITE AND AWS-M DESCRIPTIONChhota Shigri Glacier (3228degN 7758deg E) is a valley-typenon-surging glacier located in the ChandrandashBhaga river basin
Annals of Glaciology 57(71) 2016 doi 1031892016AoG71A570328copy The Author(s) 2016 This is an Open Access article distributed under the terms of the Creative Commons Attribution licence (httpcreativecommonsorglicensesby40) which permits unrestricted re-use distribution and reproduction in any medium provided the original work is properly cited
httpdxdoiorg1031892016AoG71A570Downloaded from httpwwwcambridgeorgcore IRD - France on 04 Nov 2016 at 101449 subject to the Cambridge Core terms of use available at httpwwwcambridgeorgcoreterms
of Lahaul valley Pir Panjal range western Himalaya (Fig 1)It extends from 5830 to 4050masl with a total length of9 km and area of 1548 km2 in 2014 (Section 3) The ablationarea comprises two main flows (Fig 1) one coming from theeastern side of the accumulation area and the second fromthe western side The lower ablation area (lt4500masl) iscovered by debris representing 34 of the total surface area(Vincent and others 2013) Chhota Shigri Glacier is locatedin the monsoonndasharid transition zone and is influenced by theIndian summer monsoon (ISM) during summer (JulyndashSeptem-ber) and the Northern Hemisphere mid-latitude westerlies(MLW) during winter (JanuaryndashApril)
AWS-M is located off-glacier on a western lateralmoraine (4863masl Fig 1) on a flat rocky surface andhas been functioning continuously since 18 August 2009The list of sensors installed on AWS-M data gaps andtreatments are provided in Azam and others (2014b) At theglacier base camp (3850masl 2 km north of the glaciersnout) an all-weather precipitation gauge with a hangingweighing transducer (Geonor T-200B) worked between12 July 2012 and 10 October 2013 (Fig 1)
3 FIELD MEASUREMENTS TO ASSESS THE MASSBALANCESThe hydrological year is defined from 1 October to30 September of the following year on this glacier mainlyfor practical reasons because access to the glacier isrestricted after 15 October The year is divided into summer(MayndashOctober) and winter (NovemberndashApril) glaciologicalseasons Annual glacier-wide surface MB measurementshave been carried out on Chhota Shigri Glacier since 2002at the end of September or beginning of October using thedirect glaciological method (Paterson 1994 Wagnon andothers 2007) The distribution of ablation and accumu-lation sites is shown in Figure 1 In October 2013 theelectronic balance failed at an accumulation site so thesnowfirn core densities could not be calculated Weobserved that from year to year at a given location thethickness of the annual snowfirn layer varies but the depth-averaged density remains almost the same For instancebetween 2009 and 2012 the mean depth-averaged densitywas 460 kgmndash3 (standard deviation (STD) = 20 kgmndash3) at5200m asl on the western tributary and 480 kgmndash3
(STD=60 kgmndash3) at 5180masl on the eastern tributaryTherefore at each accumulation site the mean verticaldensity in every pit for glaciological year 201213 wasassumed equal to the mean depth-averaged density at thissite from previous years
Since 2002 the glaciological Ba of Chhota Shigri Glacierhas been calculated using the glacier hypsometry (surfaceelevation distribution) obtained by combining two SPOT5(Satellite Pour lrsquoObservation de la Terre) digital elevationmodels (DEMs) (12 and 13 November 2004 20 and21 September 2005) (Wagnon and others 2007) In everyglaciological MB series changing glacier area and elevationover time may give rise to some bias therefore theglaciological MB series need to be recalculated (Zemp andothers 2013) The recent hypsometry of Chhota ShigriGlacier is calculated using a DEM derived from Pleacuteiadesimages from 18 August 2014 In earlier publications asmall area of 010 km2 located below the summit between5830 and 6263masl has been systematically includedin the MB calculations However visual examination of
high-resolution Pleacuteiades orthoimages suggested that thisuppermost part is disconnected from the rest of the glacierThis small area is now excluded The total glacierizedarea from Pleacuteiades images in 2014 between 4050 and5830masl is 1548 km2 while the glacierized area overthe same altitudinal range from the 2005 SPOT5 images is1562 km2 Thus between 2005 and 2014 the area de-creased by 014 km2 (09 of the 2005 area) Using theseupdated glacier outlines and hypsometries we recalculatedthe Ba series assuming a linear area change (eqns 7 and 8 inZemp and others 2013) between 20ndash21 September 2005and 18 August 2014 and considering 5830masl as theupper limit of the accumulation area Chhota Shigri is atemperate glacier with thickness varying from 124 to 270min its ablation area (Azam and others 2012) Such glacierstake a few decades (15ndash60 years) to adjust to their MBchanges (Cuffey and Paterson 2010) so one can expect asmooth change in area especially over a short time periodThe overall error in Ba calculated following Thibert andothers (2008) comes from a variance analysis applied to alltypes of errors (icesnow density core length stake heightdetermination liquid-water content of the snow snowheight) Applying these errors at different altitudinal rangesthe uncertainty in Ba was calculated as 040mwe andash1The details of error estimation are provided in Azam andothers (2012)
Fig 1Map of Chhota Shigri Glacier showing the ablation stakes onthe debris-cover area (black dots) on the eastern flank (blue dots)on the western flank (green dots) accumulation sites (red squares)AWS-M (black star) and precipitation gauge (black cross) The mapcoordinates are in the UTM43 (north) World Geodetic System 1984(WGS84) reference system
Azam and others Meteorology and mass balances of Chhota Shigri Glacier 329
httpdxdoiorg1031892016AoG71A570Downloaded from httpwwwcambridgeorgcore IRD - France on 04 Nov 2016 at 101449 subject to the Cambridge Core terms of use available at httpwwwcambridgeorgcoreterms
4 RESULTS41 Meteorological conditions on Chhota ShigriGlacierFigure 2 displays the daily temporal variation in Tair RH uSWI and LWI from 18 August 2009 to 30 September 2013recorded by the AWS-M and daily precipitation sums atglacier base camp recorded by the precipitation gaugebetween 12 July 2012 and 30 September 2013 Fourhydrological years (1 October 2009 to 30 September2013) for AWS-M variables and one hydrological year(1 October 2012 to 30 September 2013) for precipitationwere selected to analyze the meteorological conditions atseasonal and annual scale Based on local meteorologyAzam and others (2014b) delineated four seasons summermonsoon (JunendashSeptember) winter (DecemberndashMarch)pre-monsoon (AprilndashMay) and post-monsoon (OctoberndashNovember) For purposes of meteorological analysis weadopt this subdivision of the annual cycle Table 1 displaysthe mean annual and seasonal values of all studied variables
for each hydrological year as well as for the whole period(1 October 2009 to 30 September 2013)
411 Air temperature and relative humidityThe monthly mean Tair during winter was ndash134degC and thatfor the summer monsoon was 25degC while during pre-monsoon and post-monsoon it was ndash53degC and ndash78degCrespectively (Table 1) Whereas the monthly average Tairexceeds 0degC during at least three months (JulyndashSeptember)mean daily Tair can drop below the freezing point even inthe hottest months of the year (21 of days in June 5 inJuly 3 in August and 15 in September) A suddenchange in mean monthly Tair characterizes the onset of anew season the most evident inter-seasonal change wasfound between the summer monsoon and post-monsoonwith a drop of 103degC while the minimum difference(56degC) was found between post-monsoon and wintershowing that winter and the summer monsoon are thermallywell distinguished Compared to 200910 201011 and
Fig 2 Daily means of (a) air temperature Tair (degC) (b) relative humidity RH () (c) wind speed u (m sndash1) (d) incoming shortwave radiationSWI (Wmndash2) and (e) incoming longwave radiation LWI (Wmndash2) at AWS-M Tair RH u and SWI are the daily means for the full observationperiod between 18 August 2009 and 30 September 2013 while LWI are the daily means between 23 May 2010 and 30 September 2013(f) The daily precipitation (mmwe) between 12 July 2012 and 30 September 2013 collected by the precipitation gauge at glacier basecamp The thick lines in (andashe) are the 15 day running means
Azam and others Meteorology and mass balances of Chhota Shigri Glacier330
httpdxdoiorg1031892016AoG71A570Downloaded from httpwwwcambridgeorgcore IRD - France on 04 Nov 2016 at 101449 subject to the Cambridge Core terms of use available at httpwwwcambridgeorgcoreterms
201112 the 201213 summer monsoon was relativelywarm (08degC higher than the mean of the four hydrologicalyears) while the 200910 winter season was warmer (10degChigher than the mean of the four hydrological years)
The highest peak in mean monthly relative humidity (RH)was observed in August (74) while another peak wasobserved in February (51) (Azam and others 2014b) Thesummer monsoon mean RH was 68 and the winter seasonmean was 42 Post-monsoon showed the lowest (39)RH while pre-monsoon showed the RH (52) closest to theannual mean The mean monthly RH between October andMay was always lower than the annual mean (52) whilethe lowest RH (33) was observed in December The201112 summer monsoon showed the maximum RH (69)whereas winter RH was minimum (38) for 201213Furthermore a sudden drop in RH noticed around20 September (Fig 2) shows the sharp decay of themonsoon on Chhota Shigri Glacier
412 PrecipitationThe automatic precipitation gauge (3850masl Fig 1)provides the only recorded local precipitation data forChhota Shigri Glacier Table 1 shows the seasonalprecipitation sums for a single complete hydrological yearbetween 1 October 2012 and 30 September 2013 Theobserved precipitation during winter was maximum with acontribution of 71 to the total annual precipitation
whereas post-monsoon received minimum precipitation(3 of the annual amount) The contributions of pre-monsoon and summer monsoon to annual precipitationwere only 15 and 12 respectively Although 71 of theprecipitation occurred during the 201213 winter seasonthe mean winter season RH was low (38) (Table 1) This isbecause the MLW bring moisture in the form of strongstorms (Lang and Barros 2004) which are generally shortwith a life span of 2ndash4 days but provide important amountsof precipitation (Dimri and Mohanty 2009) This interpret-ation is supported by Figure 2b where RH occasionallypeaked to very high values during winter but otherwise thisseason is mostly very dry By contrast the monsoon is aconstantly humid season (high RH) with frequent but lightprecipitation resulting in total amounts of precipitation thatare lower than in winter Therefore unlike the summer-accumulation type glaciers (Ageta and Higuchi 1984) in thecentral Himalaya Chhota Shigri Glacier seems to receivemost of its precipitation in winter The monthly precipitationsums (not shown in Table 1) were highest in January andFebruary (183 and 238mm respectively) whereas thelowest were in October and November (14 and 18mmrespectively) The precipitation minimum during Octoberand November in agreement with studies in the neighbor-ing Beas Basin (eg Prasad and Roy 2005 Datt and others2008) supports the choice of the hydrological year startingfrom 1 October However these analyses should be
Table 1 Mean seasonal values of Tair RH u SWI and LWI at AWS-M (4863masl) Tair RH u and SWI are the mean seasonal values offour hydrological years between 1 October 2009 and 30 September 2013 while LWI are the mean seasonal values between 1 June 2010 and30 September 2013 P is the seasonal precipitation for one hydrological year between 1 October 2012 and 30 September 2013 at glacierbase camp (3850masl) collected by the precipitation gauge
Year Mean
Season Variable 200910 201011 201112 201213
Post-monsoon (OctndashNov) Tair (degC) ndash88 ndash73 ndash61 ndash91 ndash78RH () 48 35 33 40 39u (m sndash1) 51 42 41 42 44
SWI (Wmndash2) 150 191 186 178 176LWI (Wmndash2) ndash 178 192 192 187P (mmwe) ndash ndash ndash 32 ndash
Winter (DecndashMar) Tair (degC) ndash124 ndash136 ndash145 ndash131 ndash134RH () 43 41 43 38 42u (m sndash1) 51 55 63 50 55
SWI (Wmndash2) 144 168 163 168 161LWI (Wmndash2) ndash 190 195 190 192P (mmwe) ndash ndash ndash 679 ndash
Pre-monsoon (AprndashMay) Tair (degC) ndash46 ndash49 ndash61 ndash55 ndash53RH () 52 50 54 51 52u (m sndash1) 39 34 34 35 35
SWI (Wmndash2) 249 323 311 316 299LWI (Wmndash2) ndash 230 233 231 231P (mmwe) ndash ndash ndash 148 ndash
Summer monsoon (JunndashSep) Tair (degC) 19 28 24 33 25RH () 69 67 69 68 68u (m sndash1) 29 27 29 27 28
SWI (Wmndash2) 260 277 263 265 266LWI (Wmndash2) 280 276 283 308 289P (mmwe) ndash ndash ndash 117 ndash
Annual (mean) Tair (degC) ndash57 ndash56 ndash61 ndash57 ndash58RH () 54 50 52 50 52u (m sndash1) 41 40 43 38 41
SWI (Wmndash2) 201 234 225 227 221LWI (Wmndash2) ndash 224 230 237 230P (mmwe) ndash ndash ndash 976 ndash
Azam and others Meteorology and mass balances of Chhota Shigri Glacier 331
httpdxdoiorg1031892016AoG71A570Downloaded from httpwwwcambridgeorgcore IRD - France on 04 Nov 2016 at 101449 subject to the Cambridge Core terms of use available at httpwwwcambridgeorgcoreterms
regarded with caution as they are based on a single year ofprecipitation A long-term precipitation record from glacierbase camp is desirable to definitely state whether or notChhota Shigri is a winter-accumulation type glacier
413 Incoming short- and longwave radiationsSWI was highest during the pre-monsoon As soon as thesummer monsoon starts Tair increases but SWI is reduced inagreement with high RH (Fig 2 Table 1) (Azam and others2014b) The LWI was highest during the summer monsoonbecause of high emission from the summer-monsoonalclouds The post-monsoon and winter season exhibitedsimilar conditions The mean monthly LWI was highest(336Wmndash2) in August 2013 and lowest (165Wmndash2) inDecember 2010 whereas the mean monthly SWI washighest (344Wmndash2) in May 2011 and lowest (107Wmndash2) inDecember 2009
414 Wind regimesOn average u was highest during the winter season with amean value of 55m sndash1 reaching its maximum monthlyvalue of 62m sndash1 in February u was also strong in pre-monsoon (mean 35m sndash1) especially in March (monthlymean 51m sndash1) u over the summer monsoon was quiteweak (mean 28m sndash1) with a minimum speed in August(monthly mean 24m sndash1) During the post-monsoon windspeeds were moderate (mean 44m sndash1) and approached thehigh speed of wintertime The summer monsoon winds werealmost the same for the four hydrological years while thewinter wind exhibited more interannual variability with thehighest speed measured during the 201112 hydrologicalyear A decrease in u during the first half of May (Fig 2) canbe considered as the onset of the monsoon on Chhota ShigriGlacier Indeed Shea and others (2015) based on recordsfrom five high-altitude meteorological stations in theNepalese Himalaya showed that the monsoon as soon asit starts is characterized by relatively calm conditions (dailywind speeds are generally lt4m sndash1)
42 Annual and seasonal mass balances
421 Spatial pattern of point mass balancesFigure 3andashh show the point MBs as a function of altitude forhydrological years 2006ndash14 (for 2002ndash06 see Wagnon andothers 2007) Ablation at the stakes (black dots) in thelowest part of the ablation area is subdued by 2ndash3mwe andash1
irrespective of their altitude (Fig 3andashh) This is due to thedebris cover which has an insulating effect and the deepnarrow valley which reduces incoming shortwave radiation(Wagnon and others 2007) However the annual point MBsare still very negative on the debris-covered area withannual values varying between ndash2 and ndash5mwe
Given the harsh conditions and rugged terrain the pointaccumulation measurements at 55005550masl couldonly be carried out in 2003 2004 2005 2009 and2011 For the years without accumulation measurementsat 55005550masl an extrapolation of 5200masl meanMB (three measurements in the eastern part) to55005550masl was done applying the MB gradientcalculated between 5200 and 55005550m asl frompoint-MB profiles in similar years (the years with almostthe same point annual MBs up to 5200masl) Accumu-lation at 55005550masl on the eastern flank (mainglacier) varied between a minimum annual value of
10mwe in 200607 (extrapolated) and a maximum valueof 23mwe in the 200809 (measured) hydrological year
422 Annual vertical mass-balance gradientsThe blue lines in Figure 3andashh are the regression lines fitted toannual point MBs measured on the debris-free part of themain glacier body (eastern flank) between 4400 and5200masl These regression lines were used to derivethe vertical MB gradients (dbdz) for each hydrological yearThe annual dbdz are reported in Table 2 Over the 2002ndash14observation period the annual dbdz between 4400 and5200masl showed a STD of 009mwe (100m)ndash1 witha minimum value of 052mwe (100m)ndash1 for 200809and a maximum value of 081 mwe (100 m)ndash1 for201112 The mean dbdz between 2002 and 2014 was066mwe (100m)ndash1 which is in good agreement with themean dbdz of 069mwe (100m)ndash1 calculated over a smallaltitudinal range (4400ndash4900masl) between 2002 and2006 on Chhota Shigri Glacier (Wagnon and others 2007)
The annual dbdz over the debris-covered part of theglacier is negative due to a decrease in the debris thickness(and in turn of its resulting insulating effect) as a function ofaltitude However given the short altitudinal range (only100m between stakes installed at 4300 and 4400masl)any quantification of this dbdz would be speculative andnot statistically significant The annual dbdz in theaccumulation area (Fig 3) showed rather less annualvariability (STD=008mwe (100m)ndash1) with a low meanvalue of 022mwe (100m)ndash1 between 2002 and 2014 Themean accumulation dbdz was calculated using field-observed accumulation dbdz available for only five years(Table 2)
423 Annual and cumulative glacier-wide massbalancesThe recalculated Ba of Chhota Shigri Glacier between 2002and 2014 are given in Table 2 whereas Figure 4 displays theBa as well as the cumulative glacier-wide MB over thesame period The recalculation changed the Ba up to005mwe andash1 Ba was generally negative except for fouryears (200405 200809 200910 and 201011) when it wasslightly positive Ba varied from a minimum value ofndash143 040mwe in 200203 to a maximum value of+032040mwe in 200910 and had a large interannualvariability (STD=065mwe andash1) The cumulative glacier-wide MB of Chhota Shigri was ndash672mwe between 2002and 2014 corresponding to a Ba of ndash056 040mwe andash1
424 ELA and AARTable 2 shows the equilibrium-line altitude (ELA) andaccumulationndasharea ratio (AAR) for each hydrological yearbetween 2002 and 2014 ELA was calculated using theregression line (blue lines in Fig 3) extracted through theannual point MBs of the main glacier body (eastern flank)between 4400 and 5200masl The AAR for each year isthen calculated using the ELA of the corresponding yearSince 2002 the ELA has varied from a maximum value of5235masl in 200203 (Ba = ndash143040mwe AAR=24) to a minimum value of 4905masl in 200405(Ba = +013040mwe and AAR=69) The annual ELAand AAR showed a good correlation with Ba (r2=094 and094 respectively) between 2002 and 2014 (Fig 5) The ELAfor a zero Ba (ELA0) was also derived from the regressionbetween Ba and ELA over 2002ndash14 and calculated as
Azam and others Meteorology and mass balances of Chhota Shigri Glacier332
httpdxdoiorg1031892016AoG71A570Downloaded from httpwwwcambridgeorgcore IRD - France on 04 Nov 2016 at 101449 subject to the Cambridge Core terms of use available at httpwwwcambridgeorgcoreterms
Fig 3 (andashh) The annual point MB (dots) as a function of altitude derived from field measurements (stakes drillings or pits) on Chhota ShigriGlacier for eight hydrological years between 2006 and 2014 Measurements were performed on 30 September 2006 1 October 20076 October 2008 9 October 2009 10 October 2010 9 October 2011 10 October 2012 6 October 2013 and 4 October 2014 (4 days)The black blue and green dots are the annual point MBs over the debris-cover area (lt4400masl) the eastern flank and the western flankof the glacier respectively whereas red dots are the MBs at 55005550masl The blue and red lines are the regression lines fitted to pointannual MBs in the ablation and accumulation parts of the eastern flank respectively Ba and ELA for each year are also displayed on thecorresponding panel (i) The hypsometry (50m altitudinal ranges) and mean (2002ndash14) altitudinal MBs (brown dots) of Chhota ShigriGlacier The mean altitudinal MBs are mean MBs for each 50m range (eg 4400 MB represents the mean MB for 4400ndash4450 range) exceptat 4250 and 5400 where the mean MBs are for 4050ndash4300 and 5400ndash5830 range respectively
Azam and others Meteorology and mass balances of Chhota Shigri Glacier 333
httpdxdoiorg1031892016AoG71A570Downloaded from httpwwwcambridgeorgcore IRD - France on 04 Nov 2016 at 101449 subject to the Cambridge Core terms of use available at httpwwwcambridgeorgcoreterms
4950masl Similarly AAR0 was calculated as 61 forsteady-state Ba (Fig 5)
425 Seasonal glacier-wide mass balancesOn Chhota Shigri Glacier seasonal MB measurements werestarted in May 2010 to assess the winter (Bw) and summerglacier-wide MBs (Bs) separately Access to the glacier at theend of winter depends on road clearance so Bw observationscould not be carried out on fixed dates The measurementswere performed on 21 May 2010 24 June 2011 20 June2012 and 6 July 2013 (3 days) Azam and others (2014a)suggested that the average summer ablation period lasts96 18 days from mid-June to the end of September andneither ablation nor accumulation is dominant during Mayndash
June Therefore no correction was applied to the field Bw forvarying measurement dates Table 2 and Figure 6 show theseasonal MBs Bw ranged from a maximum value of119mwe in 200910 to a minimum value of 076mwein 201213 whereas Bs varied from ndash087mwe in 200910to ndash164mwe in 201112 Between 2009 and 2013 theobserved Ba on Chhota Shigri Glacier was slightly positive for200910 (032mwe) and 201011 (006mwe) and nega-tive for 201112 (ndash046mwe) and 201213 (ndash077mwe)The separation of seasonal MBs over this period is crucial tounderstand the causes for positive and negative balanceyears (Section 52)
426 Geodetic glacier-wide mass balanceThe 2005ndash14 glacier-wide geodetic MB has been computedusing DEMs derived from SPOT5 and Pleacuteiades stereo-images The 2005 SPOT5 DEM was derived from astereo-pair acquired on 20 and 21 September 2005 by theSPOT5-HRG sensor with a resolution of 25m The 2014DEM was derived from Pleacuteiades stereo-images acquired on18 August 2014 The methodology followed to compute thePleacuteiades DEM to adjust horizontally and vertically the twoDEMs on the ice-free terrain and to estimate the glacier-wide MB has been described in detail for similar datasetsacquired over the Mont Blanc area European Alps (Berthierand others 2014) Given the similarity of the imagery usedover Chhota Shigri Glacier to that used in the Mont Blancstudy we also used the uncertainties estimated over MontBlanc glaciers using GPS measurements Elevation changesfrom SPOT5Pleacuteiades DEM differencing were found to beaccurate within 13m and this error level was conserva-tively multiplied by a factor of 5 for regions where at leastone of the DEMs had data gaps In the case of Chhota ShigriGlacier these unsurveyed areas cover 23 of the total
Table 2 Annual and seasonal MBs ELA AAR and MB gradients dbdz (mwe (100m)ndash1) for Chhota Shigri Glacier The subscripts abl andacc stand for ablation zone (4400ndash5200masl) and accumulation zone (5200ndash5830masl) respectively The mean and STD are alsodisplayed for every variable The uncertainty range for Ba is 040mwe (Azam and others 2012)
200203 200304 200405 200506 200607 200708 200809 200910 201011 201112 201213 201314 mean STD
Ba (mwe) ndash143 ndash124 013 ndash143 ndash100 ndash095 012 032 006 ndash046 ndash077 ndash008 ndash056 065ELA (masl) 5235 5105 4905 5230 5125 5110 4920 4925 4940 5025 5090 5010 5052 116AAR () 24 39 69 22 37 39 67 64 66 52 36 54 47 17dbdzabl(mwe (100m)ndash1)
062 074 062 061 068 068 052 054 073 081 076 064 066 009
dbdzacc(mwe (100m)ndash1)
029 018 025 ndash ndash ndash 03 ndash 01 ndash ndash ndash 022 008
Bw (mwe) ndash ndash ndash ndash ndash ndash ndash 119 097 118 076 ndash 102 020Bs (mwe) ndash ndash ndash ndash ndash ndash ndash ndash087 ndash091 ndash164 ndash153 ndash ndash124 040
Meteorological conditionsAnnualtemperature (degC)
ndash ndash ndash ndash ndash ndash ndash ndash57 ndash56 ndash62 ndash58 ndash ndash58 03
Summertemperature (degC)
ndash ndash ndash ndash ndash ndash ndash 13 27 25 32 ndash 24 08
Wintertemperature (degC)
ndash ndash ndash ndash ndash ndash ndash ndash101 ndash90 ndash99 ndash85 ndash ndash94 08
Annualprecipitation (mm)
ndash ndash ndash ndash ndash ndash ndash 1187 1130 825 939 ndash 1020 168
Summerprecipitation (mm)
ndash ndash ndash ndash ndash ndash ndash 766 493 402 228 ndash 472 225
Winterprecipitation (mm)
ndash ndash ndash ndash ndash ndash ndash 421 637 423 711 ndash 548 149
Temperature at AWS-M (4863masl) and precipitation at Bhuntar meteorological station (1092masl) For the summer or winter means the starting andending dates have been chosen to match the field measurements of Bs and Bw respectively
Fig 4 Cumulative (blue dots) and annual glacier-wide massbalances (red (ndash) and green (+) histograms) of Chhota Shigri Glacierbetween 2002 and 2014 Error bars represent the uncertainty inannual glacier-wide mass balance calculated in Azam andothers (2012)
Azam and others Meteorology and mass balances of Chhota Shigri Glacier334
httpdxdoiorg1031892016AoG71A570Downloaded from httpwwwcambridgeorgcore IRD - France on 04 Nov 2016 at 101449 subject to the Cambridge Core terms of use available at httpwwwcambridgeorgcoreterms
glacier area Between 21 September 2005 and 18 August2014 the total elevation change is ndash355 252m corres-ponding to a mean annual rate of ndash040 028mandash1 Weconverted this elevation change to a glacier-wide MB ofndash302 215mwe using a density of 850 60 kgmndash3
(Huss 2013)
5 DISCUSSION51 Annual mass balancesThis unique MB dataset in the HKH region shows thatChhota Shigri Glacier previously found to be representativeof the whole Lahaul and Spiti region (2110 km2 Vincent andothers 2013) has been losing mass since 2002 at a meanrate of ndash056mwe andash1 Even though the Chhota Shigri MBseries is the longest in the HKH region 12 years ofmeasurements is still too short to extract any statisticallysignificant trend of MB highlighting the need for this
valuable series to be maintained over the long term so thatthe glacier may be used as a climatic indicator Moreoverthis dataset provides reliable data on ELAndashBa or AARndashBarelationships that could be used to reconstruct the MB seriesin time or to spatially extrapolate it Recently Brun andothers (2015) used Moderate Resolution Imaging Spectro-radiometer (MODIS) images of Chhota Shigri Glacier andreconstructed the MB series between 1999 and 2013 Theyobtained MB of ndash082 ndash109 and ndash094mwe andash1 for 19992000 200001 and 200102 respectively Combining thesedata with our glaciological series the cumulative MB is thencalculated as ndash827mwe between 1999 and 2011 corres-ponding to ndash069 040mwe andash1 which is in reasonableagreement with the value reported by Gardelle and others(2013) who calculated a region-wide MB of ndash045013mwe andash1 for the 2110 km2 area in Lahaul and Spitiwestern Himalaya between 1999 and 2011 Kaumlaumlb andothers (2012) calculated an elevation change ofndash077 008mandash1 for a 2deg latitude 2deg longitude cellaround Chhota Shigri Glacier between 2003 and 2008 Thiselevation change is converted using an ice density of900 kgmndash3 to a mass loss of ndash069 007mwe andash1 Overthe same period the mean Ba of Chhota Shigri Glacier isalso in agreement with a value of ndash090040mwe andash1
The MB gradients (Table 2) calculated over the debris-free ablation area of Chhota Shigri Glacier are comparableto those observed in the European Alps Nepalese Himalayaand other mid-latitude regions (eg Rabatel and others2005 Zemp and others 2009 Shea and others 2013Wagnon and others 2013) Some recent studies (egRacoviteanu and others 2013) developed glacier meltmodels at watershed scale in the Himalayan region basedon a single ablation gradient Such models can therefore beimproved in the future using different MB gradients fordifferent glacier zones (debris-covered ablation and accu-mulation areas)
52 Seasonal mass balancesAzam and others (2014b) using a surface energy-balance(SEB) approach analyzed the impact of the ISM on ChhotaShigri Glacier Ba and concluded that the intensity ofsnowfall events during the summer monsoon is among themost important drivers controlling Ba via enhancing summeraccumulation and limiting ablation The snowfalls duringthe summer monsoon cover the glacier surface and controlthe glacier albedo and thus the amount of absorbed
Fig 5 The ELA and AAR as a function of annual glacier-wide mass balance
Fig 6 Annual winter and summer mass balances are shown byrespectively gray light blue and light orange histograms Theannual winter summer precipitations and temperatures are shownby black blue orange histograms and dots respectively The meantemperatures are from AWS-M while the precipitation sums arefrom Bhuntar meteorological station
Azam and others Meteorology and mass balances of Chhota Shigri Glacier 335
httpdxdoiorg1031892016AoG71A570Downloaded from httpwwwcambridgeorgcore IRD - France on 04 Nov 2016 at 101449 subject to the Cambridge Core terms of use available at httpwwwcambridgeorgcoreterms
shortwave radiation which is the main heat source for theHimalayan glaciers (Azam and others 2014b)
Although the seasonal MBs are available only between2009 and 2013 this series still provides a first preliminaryopportunity to analyze how the seasonal MBs determine BaIn order to understand the influence of the meteorologicalconditions on seasonal MBs and in turn on Ba the annualand seasonal MBs were compared with the meteorologicaldata (Table 2 Fig 6) In situ temperature (Tair) records fromthe AWS-M (4863masl) were used for this analysis whileprecipitation (P) data were taken from the precipitationrecord at Bhuntar meteorological station (1092masl50 km southwest of Chhota Shigri Glacier Fig 1) For aproper comparison Ba Bw and Bs were compared withannual winter and summer Tair and P over identical periodsmatching the dates of MB field measurements
The relationship between Ba and annual P was consistentwith a positive deviation from the mean during positive Bayears (precipitation anomaly of +167 and +110mm in200910 and 201011 respectively compared to the2009ndash13 mean of 1020mm) and a negative deviationduring negative years (precipitation anomaly of ndash195 andndash81mm in 201112 and 201213 respectively) At seasonalscale we could not find any relationship between Bw andwinter P Contrary to Bw Bs showed a good agreement withsummer P in 200910 and 201011 the Bs were lessnegative (ndash087 and ndash091mwe respectively) with highersummer P (precipitation anomaly of +294 and +21mmrespectively compared to the 2009ndash13 mean of 472mm)whereas in 201112 and 201213 the Bs were more negative(ndash164 and ndash153mwe respectively) with lower summer P(precipitation anomaly of ndash70 and ndash244mm respectivelycompared to the 2009ndash13 mean)
The annual mean deviations from the mean annual Tair(ndash58degC) were small +01 +02 ndash04 and 00degC in 200910201011 201112 and 201213 respectively which pre-vents any reliable examination of the relation between Baand annual Tair Nevertheless Bw values were consistentwith winter Tair (Fig 6) with a negative deviation (tempera-ture anomaly of ndash07degC and ndash05degC respectively) from themean (ndash94degC) during the high Bw years (200910 and201112) and a positive deviation (temperature anomaly of+04degC and +09degC respectively) during the low Bw years(201011 and 201213) Bs also showed a consistentrelationship with summer mean Tair except for 201011when summer Tair was slightly higher (+03degC) than themean summer Tair (24degC) between 2009 and 2013 but Bswas less negative (ndash091mwe)
Even though the mean summer monsoon Tair at AWS-Mwas positive during the 4 years (Table 1) daily mean Tairoccasionally dropped below the freezing point (Sec-tion 411 Fig 2) during summer months indicating thatprecipitation may sometimes occur as snow This wasprobably the dominant case in 200910 and 201011positive Ba years (with positive precipitation anomaly)compared to the other years These snowfalls changed thesurface albedo of the glacier during the high melting periodof summer so the melting was reduced leading to lessnegative Bs for 200910 and 201011 Given that in 201112and 201213 negative Ba years summer Tair were slightlyhigher and P were lower than their mean values between2009 and 2013 the snowfalls were probably sporadic andnot heavy enough to protect the glacier from higher meltingThese years were thus characterized by highly negative Bs
The present analysis at seasonal scale is in agreement withthe findings of our earlier detailed SEB study (Azam andothers 2014b) This key impact of wet-season snowfalls viathe albedo effect during the melt season has already beendescribed in other parts of High Mountain Asia (eg Fujita2008 Zhang and others 2013) and elsewhere (eg Sicart andothers 2011) In the central Tibetan Plateau Moumllg and others(2012) analyzed the impact of ISM on Zhadang Glacier usinga fully distributed SEBMB model between 2009 and 2011and concluded that the timing of monsoon onset leaves aclear footprint on the glacier via the albedo effect
Although Chhota Shigri Glacier receives maximumprecipitation during winter (Section 412) the presentanalysis suggests that summer is the key season for thisglacier During summer months the ablation and accumu-lation coincide and the intensity of summer accumulationcontrols the Ba evolution through Bs However we believethat the unclear link between Bw and winter P needs to beclarified and this analysis should be developed with long-term comparison of seasonal MBs with meteorologicalvariables to reach more robust conclusions
53 Validation of glaciological mass-balance seriesIt is recommended that the glaciological MB series bevalidated with geodetic MB to detect the potential system-atic biases in glaciological MB series (eg Zemp and others2013) Given the harsh high-altitude conditions of the HKHregion access to the accumulation area is often difficultwhich limits the number of point accumulation measure-ments therefore it becomes even more essential to checkthe glaciological MB series In the HKH region theglaciological MB series are generally very short and nevervalidated using geodetic MB
To be meaningful the comparison must be done overmatching periods The glaciological MBs have generallybeen calculated from the first week of October to the firstweek of October of the following year between 2002 and2014 whereas the geodetic MB was calculated between21 September 2005 and 18 August 2014 Therefore anadjustment is necessary to calculate the geodetic MB for ninefull years (between 21 September 2005 and 21 September2014) The MB reconstruction model (Azam and others2014a) is used to make this adjustment to geodetic MBUnfortunately the meteorological data (between 18 Augustand 21 September 2014) needed to run the model were notavailable at the time of writing Thus the mean reconstructedMB between 18 August and 21 September during 1969ndash2013 (ndash052mwe with a STD of 020mwe) is added to thegeodetic MB (ndash302 215mwe from 21 September 2005to 18 August 2014) to extend it over the full 9 year perioduntil 21 September 2014 leading to a cumulative massbalance of ndash354mwe equivalent to ndash039mwe andash1Nevertheless there is still a shift of 10 days in bothmethods as glaciological MB is calculated from the firstweek of October to the first week of October of the followingyear but this is acceptable as the shift is systematic Thecumulative glaciological MB between 2005 and 2014 iscalculated as ndash406mwe (equivalent to ndash041mwe andash1)The difference between cumulative glaciological MB andgeodetic MB between 2005 and 2014 is only ndash052mwewhich is equivalent to a difference of ndash005mwe andash1Following Zemp and others (2013 section 34) the nullhypothesis H0 (the cumulative glaciological MB is notstatistically different from the geodetic MB) is accepted at
Azam and others Meteorology and mass balances of Chhota Shigri Glacier336
httpdxdoiorg1031892016AoG71A570Downloaded from httpwwwcambridgeorgcore IRD - France on 04 Nov 2016 at 101449 subject to the Cambridge Core terms of use available at httpwwwcambridgeorgcoreterms
the 95 as well as 90 levels so the difference betweencumulative glaciological MB and geodetic MB between2005 and 2014 is insignificant The statistical agreementbetween the two MBs suggests that the stake and accumu-lation site network (Section 3) is suitable and able to capturethe spatial variability of MB over the glacier and that nolarge systematic biases exist in the glaciological methodConsequently no bias correction was applied to the MBglaciological series
6 CONCLUSIONA 4 year meteorological dataset (between 1 October 2009and 30 September 2013) one of the longest high-altitude(4863masl) records in this part of the HKH was used todescribe the meteorology on Chhota Shigri Glacier Adecrease in wind speed and a rapid increase of RH and LWIfrom the last week of May or the first week of June mark theonset of the monsoon whereas a sudden drop in RH andLWI and an increase in wind speed around 20 Septembershowed the sharp decay of the monsoon on ChhotaShigri Glacier
In the main ablation part of the glacier (between 4400 and5200m asl) the mean annual dbdz of annual MB066mwe (100m)ndash1 over the 2002ndash14 period is similarto those observed in the Nepalese Himalaya or on mid-latitude glaciers The mean annual dbdz in the accumu-lation area (between 5200 and 55005550masl) was022mwe (100m)ndash1 The glaciological MB series wasrecalculated assuming a linear area change between 2005and 2014 and evaluated against the geodetic MB calculatedfrom SPOT5 and Pleacuteiades DEMs Glaciological and geodeticcumulative MBs are statistically similar (difference ofndash005mwe andash1 over 9 years) suggesting that there is noneed to apply any bias correction to the glaciological MBChhota Shigri Glacier experienced mass wastage between2002 and 2014 with a cumulative MB of ndash672mwe anda mean Ba of ndash056040mwe andash1 ELA0 for zero Ba wascalculated as 4950masl corresponding to an AAR0of 61
A single year of precipitation data at Chhota ShigriGlacier base camp showed that this glacier receivedmaximum accumulation during the winter months Inaddition the comparison of 4 years of seasonal massbalances (Bw and Bs) with meteorological variables sug-gested that there is a co-occurrence of ablation andaccumulation during the summer months and that theintensity of summer accumulation (ie monsoon) controlsthe Ba evolution through controlling the Bs However thepresent analysis conducted over 4 years only needs to beconfirmed by longer-term studies of glaciological seasonalMBs and meteorological variables The Ba series of ChhotaShigri Glacier since 2002 is the longest continuous Ba seriesin the HKH region and should be continued to use thisglacier as a benchmark for climate change studies
ACKNOWLEDGEMENTSThis work has been supported by IFCPARCEFIPRA projectNo 3900-W1 the French Service drsquoObservation GLACIO-CLIM a grant from Labex OSUG2020 (Investissementsdrsquoavenir ndash ANR10 LABX56) as well as support from CHARISINDICE SAC and Department of Science and Technology(DST) Government of India MF Azam is grateful to IRD for
providing financial support for his PhD A special thanks toour field assistant Adhikari Ji and the porters who have takenpart in successive field trips sometimes in harsh conditionsWe thank Jawaharlal Nehru University for providing thefacilities to carry out this work EB acknowledges supportfrom the French Space Agency (CNES) through the TOSCAand ISIS program We are also grateful to two anonymousreferees and the Chief Editor Graham Cogley whosethorough comments significantly improved the paper
REFERENCESAgeta Y and Higuchi K (1984) Estimation of mass balance
components of a summer-accumulation type glacier in theNepal Himalaya Geogr Ann A 66 249ndash255
Azam MF and 10 others (2012) From balance to imbalance a shiftin the dynamic behaviour of Chhota Shigri Glacier (westernHimalaya India) J Glaciol 58 315ndash324 (doi 1031892012JoG11J123)
Azam MF Wagnon P Vincent C Ramanathan AL Linda A andSingh VB (2014a) Reconstruction of the annual mass balance ofChhota Shigri Glacier (western Himalaya India) since 1969Ann Glaciol 55(66) 69ndash80 (doi 1031892014AoG66A104)
Azam MF and 6 others (2014b) Processes governing the massbalance of Chhota Shigri Glacier (western Himalaya India)assessed by point-scale surface energy balance measurementsCryosphere 8 2195ndash2217 (doi 105194tc-8-2195-2014)
Berthier E and 10 others (2014) Glacier topography and elevationchanges derived from Pleacuteiades sub-meter stereo images Cryo-sphere 8 2275ndash2291 (doi 105194tc-8-2275-2014)
Bhutiyani MR Kale VS and Pawar NJ (2010) Climate change andthe precipitation variations in the northwestern Himalaya1866ndash2006 Int J Climatol 30(4) 535ndash548
Bolch T and 11 others (2012) The state and fate of Himalayanglaciers Science 336 310ndash314
Brun F and 8 others (2015) Seasonal changes in surface albedo ofHimalayan glaciers from MODIS data and links with the annualmass balance Cryosphere 9 341ndash355 (doi 105194tc-9-341-2015)
Cogley JG (2009) Geodetic and direct mass-balance measurementscomparison and joint analysis Ann Glaciol 50 96ndash100
Cuffey KM and Paterson WSB (2010) The physics of glaciers 4thedn Butterworth-Heinemann Oxford
Datt P Srivastava PK Negi PS and Satyawali PK (2008) Surfaceenergy balance of seasonal snow cover for snow-melt estimationin N-W Himalaya J Earth Syst Sci 117 567ndash73
Dimri AP and Dash SK (2012) Wintertime climatic trends in thewestern Himalayas Climatic Change 111(3ndash4) 775ndash800
Dimri AP and Mohanty UC (2009) Simulation of mesoscale featuresassociated with intense western disturbances over westernHimalayas Meteorol Appl 16 289ndash308
Fowler HJ and Archer DR (2006) Conflicting signals of climaticchange in the Upper Indus Basin J Climate 19 4276ndash4293
Fujita K (2008) Effect of precipitation seasonality on climaticsensitivity of glacier mass balance Earth Planet Sci Lett276(1) 14ndash19
Fujita K and Nuimura T (2011) Spatially heterogeneous wastage ofHimalayan glaciers Proc Natl Acad Sci USA (PNAS) 10814 011ndash14 014 (doi 101073pnas1106242108)
Gardelle J Berthier E Arnaud Y and Kaumlaumlb A (2013) Region wideglacier mass balances over the Pamir Karakoram Himalayaduring 1999ndash2011 Cryosphere 7 1263ndash1286 (doi 105194tc-7-1263-2013)
Huss M (2013) Density assumptions for converting geodetic glaciervolume change to mass change Cryosphere 7 877ndash887 (doi105194tc-7-877-2013)
Immerzeel WW Van Beek LPH and Bierkens MFP (2010)Climate change will affect the Asian water towers Science328 1382ndash1385
Azam and others Meteorology and mass balances of Chhota Shigri Glacier 337
httpdxdoiorg1031892016AoG71A570Downloaded from httpwwwcambridgeorgcore IRD - France on 04 Nov 2016 at 101449 subject to the Cambridge Core terms of use available at httpwwwcambridgeorgcoreterms
Kaumlaumlb A Berthier E Nuth C Gardelle J and Arnaud Y (2012) Con-trasting patterns of early 21st century glacier mass change in theHimalaya Nature 488(7412) 495ndash498 (101038nature11324)
Kaumlaumlb A Treichler D Nuth C and Berthier E (2015) BriefCommunication Contending estimates of 2003ndash2008 glaciermass balance over the PamirndashKarakoramndashHimalaya Cryo-sphere 9 557ndash564 (doi 105194tc-9-557-2015)
Kaser G Groszlighauser M and Marzeion B (2010) Contributionpotential of glaciers to water availability in different climateregimes Proc Natl Acad Sci USA (PNAS) 107 20 223ndash20 227(doi 101073pnas1008162107)
Lang TJ and Barros AP (2004) Winter storms in central HimalayasJ Meteorol Soc Jpn 82(3) 829ndash844
Moumllg T Maussion F Yang W and Scherer D (2012) The footprint ofAsian monsoon dynamics in the mass and energy balance of aTibetan glacier Cryosphere 6 1445ndash1461 (doi 105194tc-6-1445-2012)
Paterson WSB (1994) The physics of glaciers 3rd edn ElsevierOxford
Paul F Kaumlaumlb A and Haeberli W (2007) Recent glacier changes inthe Alps observed by satellite consequences for future moni-toring strategies Global Planet Change 56 111ndash122
Prasad VH and Roy P (2005) Estimation of snowmelt runoff in BeasBasin India Geocarto Int 20(2) 41ndash47
Rabatel A Dedieu JP and Vincent C (2005) Using remote-sensingdata to determine equilibrium-line altitude and mass-balancetime series validation on three French glaciers 1994ndash2002J Glaciol 51 539ndash546 (doi 103189172756505781829106)
Racoviteanu A Armstrong R and Williams M (2013) Evaluation ofan ice ablation model to estimate the contribution of meltingglacier ice to annual discharge in the Nepal Himalaya WaterResour Res 49 5117ndash5133
Shea JM Menounos B Moore RD and Tennant C (2013) Anapproach to derive regional snow lines and glacier mass changefrom MODIS imagery western North America Cryosphere 7667ndash680 (doi 105194tc-7-667-2013)
Shea JM Wagnon P Immerzeel WW Biron R and Brun F (2015) Acomparative high-altitude meteorological analysis from three
catchments in the Nepal Himalaya Int J Water Res Dev31(2) 174ndash200 (doi 1010800790062720151020417)
Shekhar M Chand H Kumar S Srinivasan K and Ganju A (2010)Climate-change studies in the western Himalaya Ann Glaciol51 105ndash112 (doi 103189172756410791386508)
Sicart JE Hock R Ribstein P Litt M and Ramirez E (2011) Analysisof seasonal variations in mass balance and meltwater dischargeof the tropical Zongo Glacier by application of a distributedenergy balance model J Geophys Res 116 D13105 (doi1010292010JD015105)
Thayyen RJ and Gergan JT (2010) Role of glaciers in watershedhydrology a preliminary study of a lsquoHimalayan catchmentrsquoCryosphere 4 115ndash128
Thibert E Blanc R Vincent C and Eckert N (2008) Glaciologicaland volumetric mass-balance measurements error analysis over51 years for Glacier de Sarennes French Alps J Glaciol54(186) 522ndash532 (doi 103189002214308785837093)
Vincent C and 10 others (2013) Balanced conditions or slight massgain of glaciers in the Lahaul and Spiti region (northern IndiaHimalaya) during the nineties preceded recent mass lossCryosphere 7 569ndash582 (doi 105194tc-7-569-2013)
Wagnon P and 10 others (2007) Four years of mass balanceon Chhota Shigri Glacier Himachal Pradesh India a newbenchmark glacier in the western Himalaya J Glaciol 53603ndash611
Wagnon P and 11 others (2013) Seasonal and annual massbalances of Mera and Pokalde glaciers (Nepal Himalaya) since2007 Cryosphere 7 1769ndash1786 (doi 105194tc-7-1769-2013)
Zemp M Hoelzle M and Haeberli W (2009) Six decades of glaciermass-balance observations a review of worldwide monitoringnetwork Ann Glaciol 50(50) 101ndash111
Zemp M and 16 others (2013) Reanalysing glacier mass balancemeasurement series Cryosphere 7 1227ndash1245 (doi 105194tc-7-1227-2013)
Zhang G and 10 others (2013) Energy and mass balance of theZhadang Glacier surface central Tibetan Plateau J Glaciol213 137ndash148 (doi 1031892013JoG12J152)
Azam and others Meteorology and mass balances of Chhota Shigri Glacier338
httpdxdoiorg1031892016AoG71A570Downloaded from httpwwwcambridgeorgcore IRD - France on 04 Nov 2016 at 101449 subject to the Cambridge Core terms of use available at httpwwwcambridgeorgcoreterms
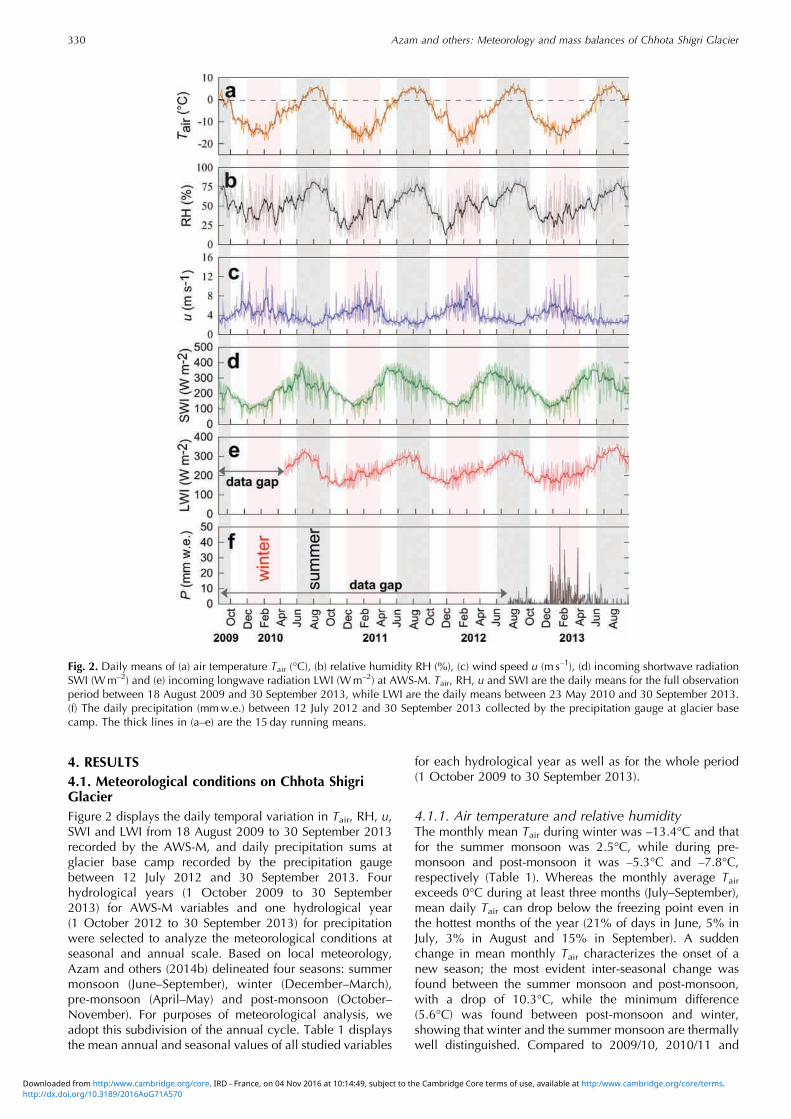
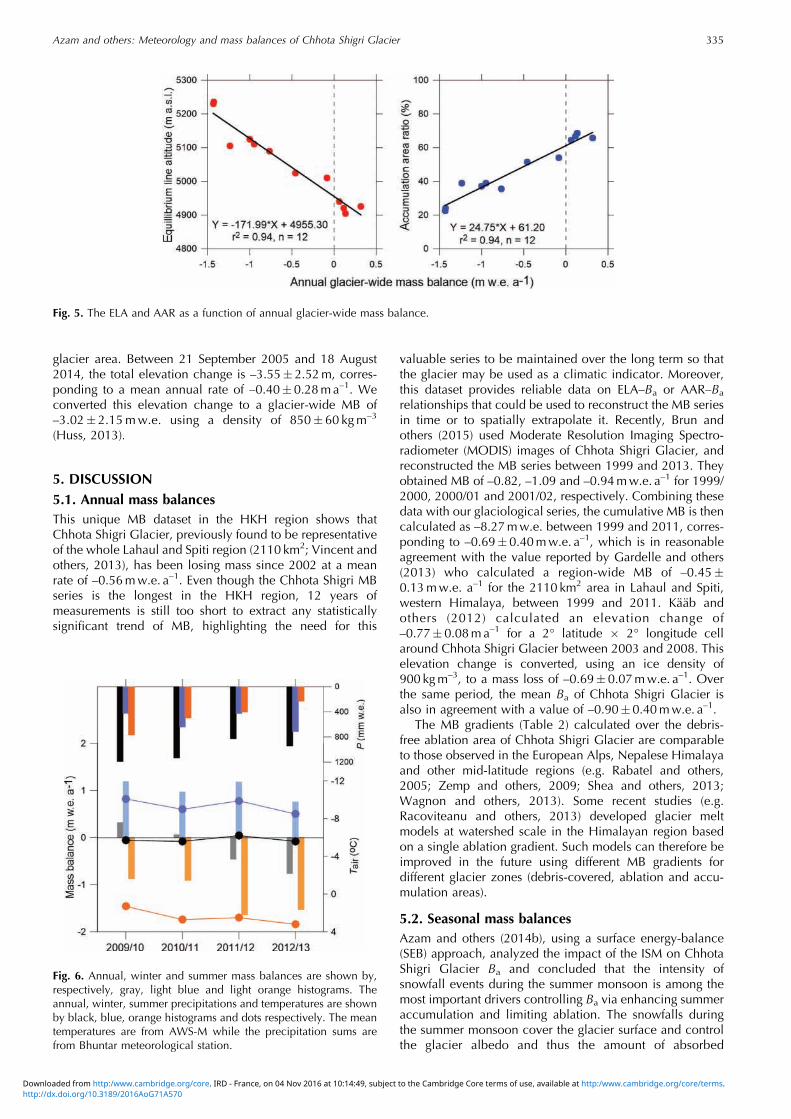
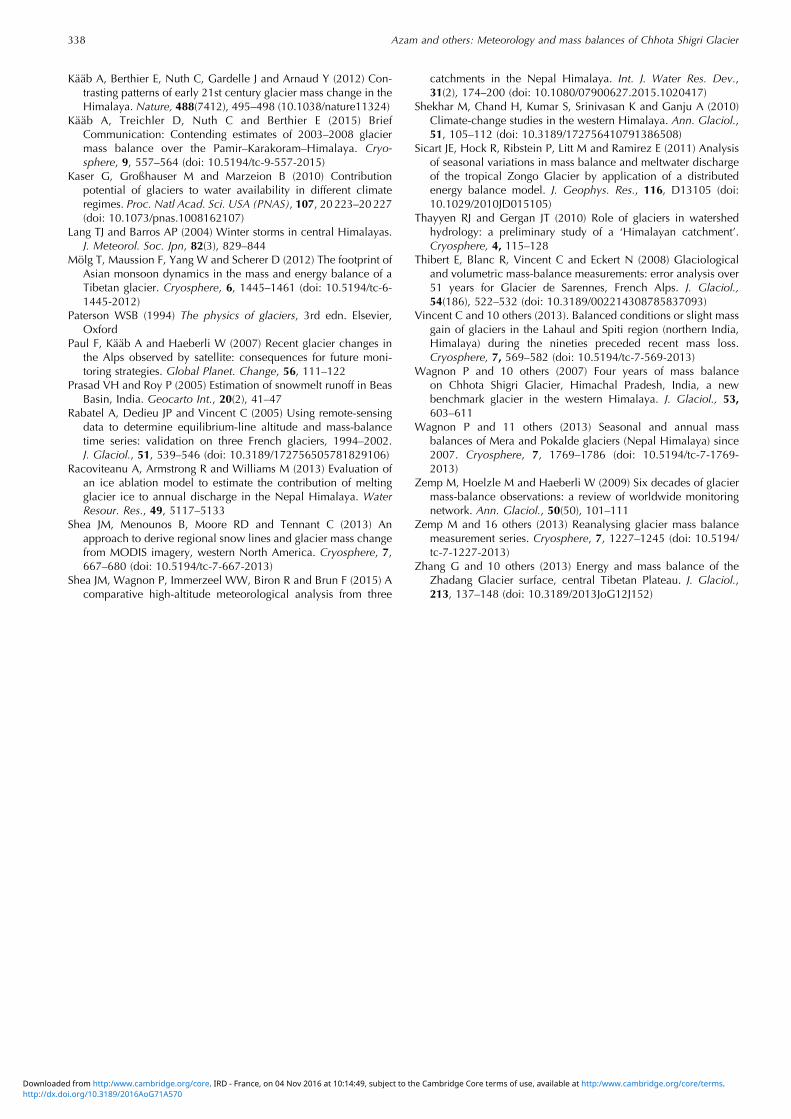