Are female employment statistics more sensitive than male...
58
UMR 225 IRD - Paris-Dauphine UMR DIAL 225 Place du Maréchal de Lattre de Tassigny 75775 • Paris •Tél. (33) 01 44 05 45 42 • Fax (33) 01 44 05 45 45 • 4, rue d’Enghien • 75010 Paris • Tél. (33) 01 53 24 14 50 • Fax (33) 01 53 24 14 51 E-mail : [email protected] • Site : www.dial.ird.fr DOCUMENT DE TRAVAIL DT/2015-22 Are female employment statistics more sensitive than male ones to questionnaire design? Evidence from Cameroon, Mali and Senegal Virginie COMBLON Anne‐Sophie ROBILLIARD
Transcript of Are female employment statistics more sensitive than male...

UMR 225 IRD - Paris-Dauphine
UMR DIAL 225 Place du Maréchal de Lattre de Tassigny 75775 • Paris •Tél. (33) 01 44 05 45 42 • Fax (33) 01 44 05 45 45
• 4, rue d’Enghien • 75010 Paris • Tél. (33) 01 53 24 14 50 • Fax (33) 01 53 24 14 51 E-mail : [email protected] • Site : www.dial.ird.fr
DOCUMENT DE TRAVAIL DT/2015-22
Are female employment statistics more sensitive than male ones to questionnaire design? Evidence from Cameroon, Mali and Senegal
VirginieCOMBLONAnne‐SophieROBILLIARD

Are female employment rates really more sensitive than maleones to questionnaire design?
Evidence from Cameroon, Mali and Senegal
Virginie Comblon∗ and Anne-Sophie Robilliard†
December 2015
Abstract
This paper investigates the effect of several survey questionnaire characteristics on em-ployment statistics. It also assess the differences in sensitivity to survey design across genderand living area. Indeed, as suggested in the literature, women, especially those living in ruralareas, are expected to be more sensitive than men to survey design, due to both the nature ofthe work (seasonal, occasional, temporary, informal, unpaid family work) and social norms.In many African countries, labor force surveys are not available on a regular basis and theway existing household surveys and census measure employment differs greatly, both overtime and between countries. This makes it difficult to properly study labor market dynamicsand to draw meaningful policy recommendations. Using about fifty surveys and censusescollected in Cameroon, Mali and Senegal between 1976 and 2012, we first review the diver-sity of survey instruments used and highlight the key questionnaire characteristics that arelikely to affect employment statistics. Exploiting within-survey variations of the wording ofquestions, the detail of the labor module and the length of the reference period, we thenassess the effect of these features on labor statistics. Empirical results shows significanteffects of each questionnaire feature and suggest that women are not systematically moresensitive than men to survey design, nor is it the case for rural individuals compared tourban ones.
JEL Classification : C81, C83, J21, J71, O55Keywords : Employment statistics, Survey design, Gender, Data comparability, Sub-SaharanAfrica
∗Universite Paris-Dauphine, PSL Research University, IRD, LEDa, DIAL, 75016 PARIS, FRANCE.Adress : DIAL, 4 rue d’Enghien 75010. Phone : +33 1 53 24 14 68. E-mail: [email protected]
†IRD, LEDa, DIAL UMR 225, F-75010 Paris, France. E-mail: [email protected]
2
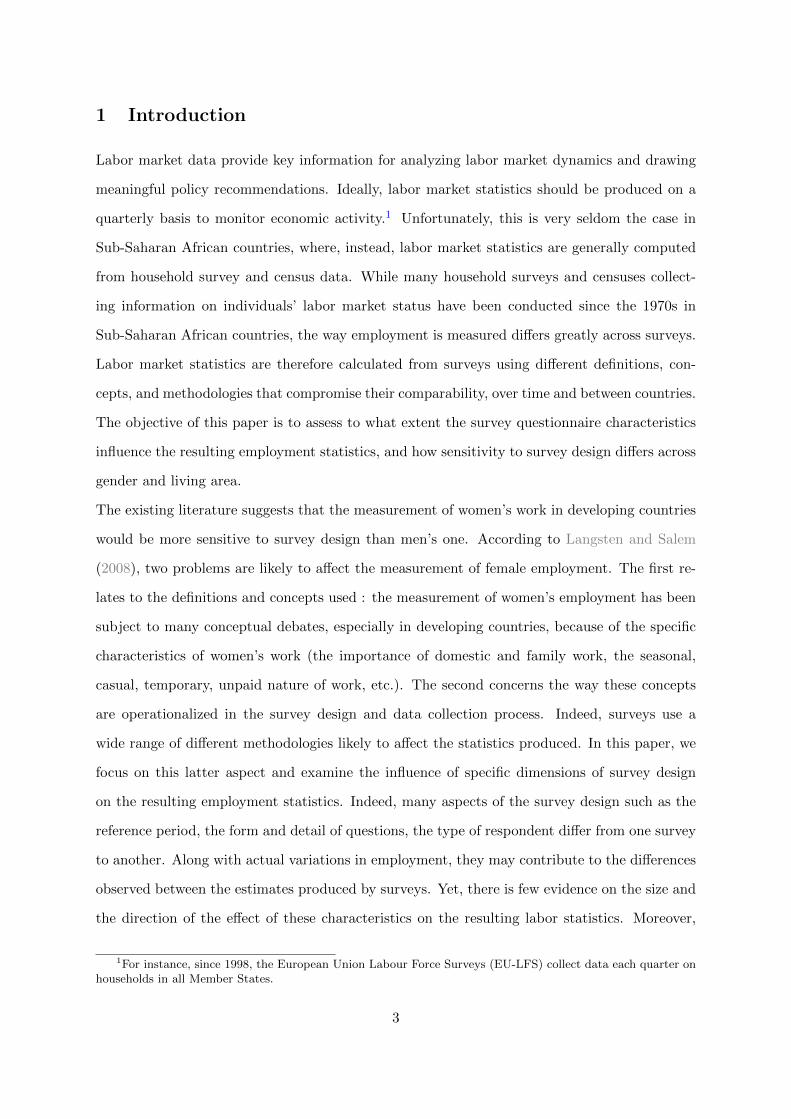
1 Introduction
Labor market data provide key information for analyzing labor market dynamics and drawing
meaningful policy recommendations. Ideally, labor market statistics should be produced on a
quarterly basis to monitor economic activity.1 Unfortunately, this is very seldom the case in
Sub-Saharan African countries, where, instead, labor market statistics are generally computed
from household survey and census data. While many household surveys and censuses collect-
ing information on individuals’ labor market status have been conducted since the 1970s in
Sub-Saharan African countries, the way employment is measured differs greatly across surveys.
Labor market statistics are therefore calculated from surveys using different definitions, con-
cepts, and methodologies that compromise their comparability, over time and between countries.
The objective of this paper is to assess to what extent the survey questionnaire characteristics
influence the resulting employment statistics, and how sensitivity to survey design differs across
gender and living area.
The existing literature suggests that the measurement of women’s work in developing countries
would be more sensitive to survey design than men’s one. According to Langsten and Salem
(2008), two problems are likely to affect the measurement of female employment. The first re-
lates to the definitions and concepts used : the measurement of women’s employment has been
subject to many conceptual debates, especially in developing countries, because of the specific
characteristics of women’s work (the importance of domestic and family work, the seasonal,
casual, temporary, unpaid nature of work, etc.). The second concerns the way these concepts
are operationalized in the survey design and data collection process. Indeed, surveys use a
wide range of different methodologies likely to affect the statistics produced. In this paper, we
focus on this latter aspect and examine the influence of specific dimensions of survey design
on the resulting employment statistics. Indeed, many aspects of the survey design such as the
reference period, the form and detail of questions, the type of respondent differ from one survey
to another. Along with actual variations in employment, they may contribute to the differences
observed between the estimates produced by surveys. Yet, there is few evidence on the size and
the direction of the effect of these characteristics on the resulting labor statistics. Moreover,
1For instance, since 1998, the European Union Labour Force Surveys (EU-LFS) collect data each quarter onhouseholds in all Member States.
3

little is known about how individual characteristics (i.e. gender and area of residence) can
account for the sensitivity (if any) to survey design.
From a sample of about fifty surveys collected over three decades in Cameroon, Mali and
Senegal, we first present the diversity of survey questionnaires used to measure employment and
identify key characteristics likely to influence labor statistics : the wording of questions, the
length of employment module, the reference period and the data collection period. Exploiting
within-survey variations we find that these features significantly affect resulting statistics. We
investigate heterogeneous effects across gender and results suggest that women are not system-
atically more sensitive to survey design than men. Finally, on the basis of these findings, we
provide some recommendations on the preferred surveys instruments to measure employment.
The structure of the paper is as follows. The literature is reviewed in Section 2, while section
3 presents the diversity of labor modules in survey questionnaires. Section 4 presents the impact
of several key questionnaire characteristics on the resulting employment statistics. Section 5
draws recommendations and concludes.
2 Literature Review
This paper relates to two strands of literature. The first one discusses the issue of the measure-
ment of women’s work in statistics that does not reflect reality in developing countries. The
second one examines more specifically to what extent the survey design affects the resulting
statistics.
2.1 Women’s work in statistics: conceptual and measurement issues
There is a broad consensus in the literature that women’s work is poorly measured in employ-
ment statistics, notably in developing countries. Following the seminal work of Boserup (1970),
many studies have subsequently highlighted the systematic underestimation of women’s work,
whether in population censuses or labor force surveys (Beneria, 1981; Anker, 1983; Anker and
Anker, 1989; Donahoe, 1999; Mata-Greenwood, 2000). In the 1980s, a series of debates have
emerged on the restrictiveness of traditionally used definitions of labor force status (employed2,
2The “employed” comprise all persons above a specific age who during a specified brief period, either oneweek or one day, were in paid employment or in self-employment (ILO -Thirteenth International Conference ofLabour Statisticians (Geneva, 1982)).
4

unemployed3 or not in labor force4). A first issue concerns the inclusion of domestic work
and unpaid family work that contribute to the wellbeing of the family but are not considered
as work by national statistics. According to Beneria (1981), the underestimation of women’s
contribution to production is both due to an ideological bias linked to the prevailing norms in
the society on gender roles (women’s work being usually considered as secondary and less im-
portant than men’s one) and a more practical aspect, related to the way employment statistics
are produced. Notably, Beneria (1981) criticizes survey questions on “main occupation” that
tend to underestimate women’s economic contribution. Indeed, many women see themselves
primarily as housewives who mainly perform domestic work, even though they also perform
economic activities. She argues that conventional definitions should be expanded to take into
account all workers involved in the production, if it has either a use value (non-market) or an
exchange value (market), including activities such as domestic production and all types of sub-
sistence production that contribute to the family welfare.5 In order to overcome some of these
conceptual and operational limits, several improvements have been made over time. The ILO
has extended its definition of the labor force6 in 1982, in order to include those engaged in “the
production and processing of primary products, whether for the market, for barter or for own
consumption, the production of all other goods and services for the market and, in the case of
households which produce such goods and services for the market, the corresponding production
for own consumption”, notably to take into account the production for household consumption.
3“The “unemployed” comprise all persons above a specified age who during the reference period were with-out work, currently available for work and seeking work” (Resolution adopted by the Thirteenth InternationalConference of Labour Statisticians (Geneva, 1982)).
4The “labor force” (or economically active population) includes employed and unemployed individuals, inother words, those who are available for the production of goods and services in accordance with the System ofNational Accounts.”
5 Likewise, Donahoe (1999) suggests to broaden the traditionally accepted definition of work by incorporatingall activities, including those which only have a use value. She proposes a typology of work that is closer to thereality of women’s labor in developing countries, identifying different forms of work (housework, subsistence pro-duction, income generation activities, and non-family employment) that goes beyond simple formal employment.She recommends the use of questionnaires on time use. This approach is a good way to capture women’s worksince it provides detailed information on all activities performed by women and imposes no a priori restrictivedefinition of work. It is however costly and cannot be collected over very long periods of time. It is howevercostly and cannot be collected over very long periods of time.
6The United Nations Statistics Commission definition of 1966 defined the economically active as “all personsof either sex who furnish the supply of labour for the production of economic goods and services”
5
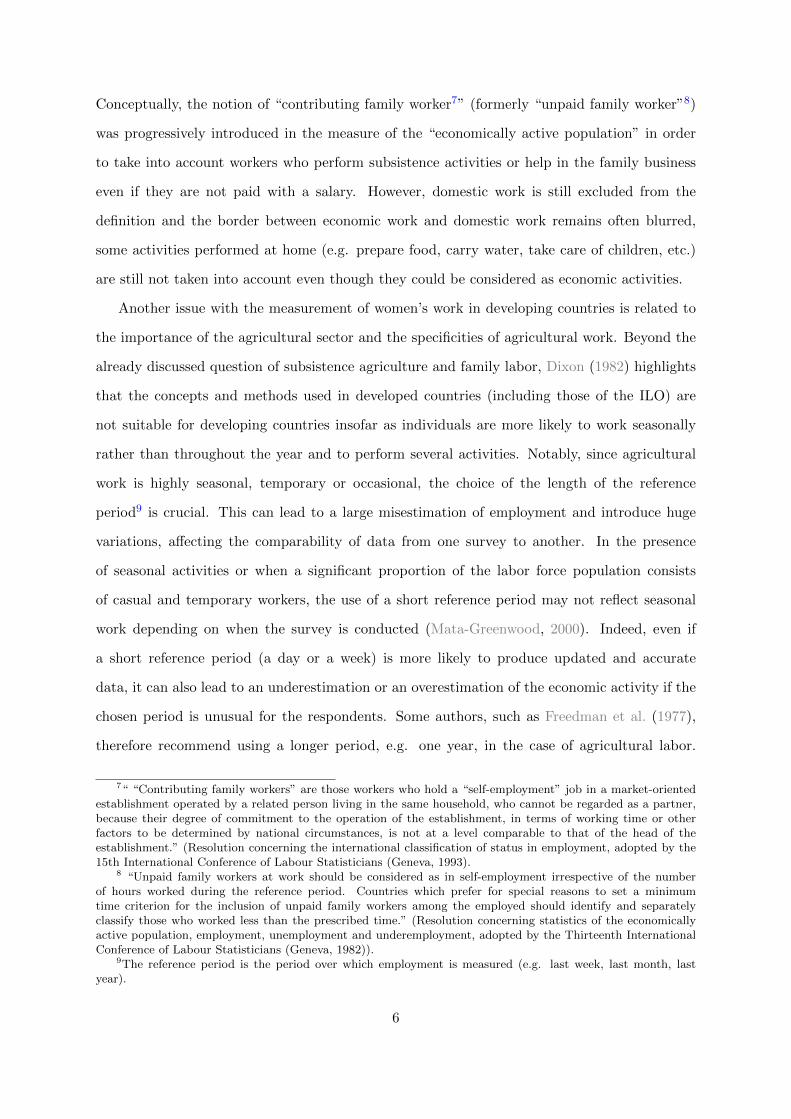
Conceptually, the notion of “contributing family worker7” (formerly “unpaid family worker”8)
was progressively introduced in the measure of the “economically active population” in order
to take into account workers who perform subsistence activities or help in the family business
even if they are not paid with a salary. However, domestic work is still excluded from the
definition and the border between economic work and domestic work remains often blurred,
some activities performed at home (e.g. prepare food, carry water, take care of children, etc.)
are still not taken into account even though they could be considered as economic activities.
Another issue with the measurement of women’s work in developing countries is related to
the importance of the agricultural sector and the specificities of agricultural work. Beyond the
already discussed question of subsistence agriculture and family labor, Dixon (1982) highlights
that the concepts and methods used in developed countries (including those of the ILO) are
not suitable for developing countries insofar as individuals are more likely to work seasonally
rather than throughout the year and to perform several activities. Notably, since agricultural
work is highly seasonal, temporary or occasional, the choice of the length of the reference
period9 is crucial. This can lead to a large misestimation of employment and introduce huge
variations, affecting the comparability of data from one survey to another. In the presence
of seasonal activities or when a significant proportion of the labor force population consists
of casual and temporary workers, the use of a short reference period may not reflect seasonal
work depending on when the survey is conducted (Mata-Greenwood, 2000). Indeed, even if
a short reference period (a day or a week) is more likely to produce updated and accurate
data, it can also lead to an underestimation or an overestimation of the economic activity if the
chosen period is unusual for the respondents. Some authors, such as Freedman et al. (1977),
therefore recommend using a longer period, e.g. one year, in the case of agricultural labor.
7“ “Contributing family workers” are those workers who hold a “self-employment” job in a market-orientedestablishment operated by a related person living in the same household, who cannot be regarded as a partner,because their degree of commitment to the operation of the establishment, in terms of working time or otherfactors to be determined by national circumstances, is not at a level comparable to that of the head of theestablishment.” (Resolution concerning the international classification of status in employment, adopted by the15th International Conference of Labour Statisticians (Geneva, 1993).
8 “Unpaid family workers at work should be considered as in self-employment irrespective of the numberof hours worked during the reference period. Countries which prefer for special reasons to set a minimumtime criterion for the inclusion of unpaid family workers among the employed should identify and separatelyclassify those who worked less than the prescribed time.” (Resolution concerning statistics of the economicallyactive population, employment, unemployment and underemployment, adopted by the Thirteenth InternationalConference of Labour Statisticians (Geneva, 1982)).
9The reference period is the period over which employment is measured (e.g. last week, last month, lastyear).
6

Langsten and Salem (2008) consider that questions which refer to “usual” work (past three
months or past year) are preferable than questions about “current” work to capture women’s
work more effectively. Besides, if the reference period is long, statistics are more likely to reflect
economic activity throughout the year, but some authors argue that the information given by
the respondent is less precise. According to Kalton and Schuman (1982), the length of the
period can have two kinds of effect on the respondents : it can introduce a bias called “recall
loss”10 and a “telescoping effect” 11. A long reference period will then result in a greater effect
of “recall loss” but a lower “telescoping effect”. Thus, Grosh and Glewwe (2000) advocates
the use of two reference periods, the last year and the last week, with less detailed questions
following the last 12 months question since it is more difficult for respondents to accurately
recall the characteristics of their activity over a long period of time. ILO standards follows
these recommendations and defines two concepts of labor force participation: the “currently
active population” which is measured over a day or a week and “the usually active population”
calculated over a long reference period, such as one year.
Additionally, while informal employment12 is the main form of employment in developing
countries, it is often badly apprehended in statistics (Charmes, 1998; Chen, 2001; Roubaud,
2009). Informal activities are often underestimated because survey instruments are generally
designed for developed countries where wage employment is the norm. Chen (2001) notes that
since women are more involved in informal activities than men, their economic contribution is
likely to be even more underestimated in the data. Hence, beyond their unpaid work, a large
part of women’s paid work remains “invisible”, such as economic activities they perform at
home or in the street (e.g. make, sell products or prepare food for sale; washed, do laundry,
do the cleaning for another household for pay, animal husbandry, etc.). Informal sector and
informal employment were respectively included in the international standards in 199313 and
10The recall loss is linked to the memory of the respondent and depends on the length of the recall period andthe ability of the respondent to remember information from his past.
11The telescoping error corresponds to the fact of “remembering an event as having occurred more recentlythan in fact the case” (Kalton and Schuman, 1982).
12“Employment in the informal sector includes all jobs in informal sector enterprises or all persons who,during a given reference period, were employed in at least one informal sector enterprise, irrespective of theirstatus in employment and whether it was their main or a secondary job” (Seventeenth International Conferenceof Labour Statisticians, Geneva, 2003).
13ILO, Resolution on the measurement of employment in the informal sector, adopted by the Fifteenth Inter-national Conference of Labour Statisticians (ICLS), Geneva, 1993.
7

200314. However it remains difficult to retain an harmonized definition, adapted to different con-
texts. Besides, although conceptual aspects are essential, operationalization of these concepts
in surveys is key in the production of labor statistics (Roubaud, 2009).
2.2 The impact of survey and questionnaire design on statistics
The way concepts are operationalized in surveys is an essential dimension of the question of
women’s work measurement. In particular, the survey and questionnaire design can have a
significant impact on the resulting statistics.15 Survey instruments and questionnaire method-
ology have historically been designed to measure employment in developed countries and mainly
capture paid employment whereas a large part of the population in developing countries is more
likely to be self-employed, employed in domestic production, a family business, to perform per-
form seasonal, casual, informal or unpaid labor, etc. Conventional methods of data collection
generally used to measure women’s work rely on keyword questions with terms such as “work”,
“job”, “main activity”. Anker (1983) points out the limitations of such an approach that lead
to a recurrent misunderstanding from the respondents of the concepts used in questions. He
advocates the alternative use of an exhaustive list of economic activities in order to better
capture women’s work. Using a study carried out in India in 1981 and comparing the “list of
activities” with the “keyword” questions, he shows that the list question leads to higher esti-
mates of women’s work. This superiority of “list of activities” relative to “keyword” questions is
confirmed by another study conducted in Egypt (Anker and Anker, 1989). Likewise, Langsten
and Salem (2008) find that the format “list of activities” is more effective than a single (or
several) keyword question(s) to capture women’s work, especially that of casual, intermittent,
part-time, home-based or unpaid workers, i.e. less formal jobs. Bardasi et al. (2011) analyze
the impact of the detail of labor modules on several employment statistics (participation rates,
14ILO, Guidelines concerning a statistical definition of informal employment, adopted by the SeventeenthInternational Conference of Labour Statisticians, Geneva, 2003.
15Several authors have investigated the effects of the wording, position, length of questions in a questionnaireon survey responses (Kalton and Schuman, 1982; Kasprzyk, 2005). Beyond the bias introduced by respondentsrelated to their understanding of the concepts used in the questions, they emphasize the importance of how ques-tions are phrased. Kalton and Schuman (1982) note that compared to open questions, closed questions (whichinclude a list of possible answers from which the respondent must choose) have the advantage of standardizedtreatment, but they have the disadvantage that the available choices are not necessarily adapted to the respon-dents and influence the answers given. Moreover, responses to closed questions may be affected by the order ofanswers. Some authors find a slight tendency to get a higher share of responses in favor of the first alternativein writing, while the last alternative seem to be more favored orally. However, other authors find that the orderhas no effect (Kalton and Schuman, 1982).
8

hours of work, main activity, type of work) for adults through a randomized experiment con-
ducted in Tanzania. Surprisingly, employment rates are found to be higher with the short
labor module for both men and women than with the detailed one16. It suggests that a simple
general question lead to an overestimation of employment rate, a possibility rarely envisaged
in the literature. After a reclassification of those who declared domestic duties as their main
occupation into “no work” in both modules, the employment rate turns out to be lower for
women with the short module than with the detailed one. This suggests that the short ques-
tionnaire captures a larger share of women who declared themselves as “employed” but who
are actually engaged in domestic duties.17 Guarcello et al. (2010) investigate the impact of the
type of survey, the type of questions, the period of field work on child labor estimates. Overall,
observable survey characteristics account for 8% to 48% of the variations in children’s economic
activity across survey. They identify three broad categories of questions used to measure child
labor: simple questions18, complex questions 19, questions determining the status in the main
occupation 20, and finally the other cases 21. The authors shows that the complex questions
and the simple questions lead respectively to 13 percentage points and 10 ppts (thereafter ppts)
higher estimates than questions on main occupation.
Another survey feature that matters is the type of respondents (self-reporting or proxy
informants). Survey designers provides rules about who is eligible to answer the questions. In
most surveys that measure employment, responsible adults at home at the time of the survey
are generally those eligible to answer for themselves and for other members of the household
(Hendershot, 2004) and the head of household is generally chosen to provide information about
children’s activities (Dammert and Galdo, 2013). The impact of the type of respondent on
the estimates is not clear. Indeed, on the one hand, the information given by the respondents
themselves can be seen as more accurate since proxy informants are likely to have incomplete
information on the activities of other household members. Presumably, proxy respondents’
16The detailed module comprises several specific questions about the type of work done by the respondent inthe last 7 days.
17However, this reclassification based on a “main occupation” question implies that some employed womenmay have been reclassify as “not employed” even if they perform at the same time an economic activity alongsidetheir domestic work (see Beneria (1981)).
18Such as “Did [Name] work in the past 7 days?”19Chain questions that include lists of activities.20E.g. employed, unemployed , housewife, student, retired, etc.21E.g. when the economic activity is determined only by the number of weekly working hours.
9

responses may also be biased by their opinion of the other members of the household.22 On
the other hand, one might instead consider that proxy respondents have better information and
they are more objective than individual respondents themselves. Anker and Anker (1989) show
that the type of respondent has no significant effect on the estimation of unpaid work of women
in Egypt, but the use of proxy respondents does underestimate employment. In the same vein,
Bardasi et al. (2011) show that the use of proxy respondents has a large and significant impact
on several employment outcomes, either an underestimation for labor market participation and
the number of weekly hours worked, either an overestimation for the daily remuneration and the
share of unpaid family workers. They explain the differences between self and proxy respondents
by information problems in the household, the age difference between the respondent and the
person for whom information is collected, whereas gender and educational differences seem to
be less influential factors. Besides, Dillon et al. (2012) find that the type of respondent does
not affect the child labor estimates in Tanzania, whereas Dammert and Galdo (2013) find a
significant underestimation for the proxy respondents in Peru.
The timing of the survey is also crucial, especially in contexts of seasonal activity. In devel-
oping countries, economic activity is highly subject to seasonal fluctuations related to climate
(seasons and rainfall), institutional aspects (e.g. holiday periods), religious (e.g. Ramadan,
pilgrimage), cultural (e.g. baptism, marriage, funeral), and the nature of jobs performed (e.g.
casual, temporary, seasonal). Therefore, employment statistics may be affected by the time
surveys are conducted, especially if the reference period used is short23. For instance, Guarcello
et al. (2010) find that even if the effects of field work periods24 on child labor estimates are
no longer individually significant when the type of survey is controlled for, they remain jointly
significant. Since surveys are not always carried out at the same time, this gives rise to problems
of data comparability between surveys due to seasonal effects. The level of employment may
either be over-estimated during periods of high activity, or conversely underestimated during
periods of low economic activity. Individuals considered as unemployed during a given observa-
tion period may actually occupy seasonal or casual jobs that are not properly taken into account
by the surveys. Some additional questions adapted can be used to capture these individuals
22For instance, child labor could be misreported because of social desirability : if child labor is seen as socially“bad”, proxy respondents are more likely to under report the children’s work (Dammert and Galdo, 2013).
23See the discussion about the length of the reference period in Section 2.1..24Field work periods considered : in school (reference category), partially outside school term, outside school
term, missing
10

(i.e. specific questions about seasonal activities, reasons for inactivity during a short reference
period, livelihoods for those who are not employed, etc.).
In this paper, we contribute to the existing literature in several ways. First, we make a
diagnosis of the variety of survey instruments used in three Sub-Saharan countries over three
decades. Second, we take advantage of within-survey variations of questionnaire characteristics
to accurately assess the effect of the wording, the length of labor module and the reference
period. Finally, we provide recommendations for labor data users and analysts.
3 Overview of data comparability issues in three Sub-Saharan
African countries
The analysis is carried out on data from 53 surveys and censuses collected in Cameroon, Mali
and Senegal between 1976 and 2012 (see the list of surveys and acronyms that will be used in
the remaining of the paper in Tables A1, A2 and A3).25
3.1 Employment rates evolution in Cameroon, Mali and Senegal from 1976
to 2012)
Cameroon, Mali and Senegal are three Sub-Saharan African countries of comparable size with
a populations respectively estimated at 22, 17 and 15 million inhabitants (World Bank, 2015).
They differ somewhat however on a number of dimensions. Cameroon displays higher GNI per
capita (Atlas method), higher educational attainment and lower poverty rates (measured by
the poverty headcount ratio at national poverty lines) than the two other countries. However,
Senegal enjoys larger life expectancy and lower child mortality. While the agricultural sector
contributes to 40% of GDP in Mali, its contribution is around 20% in Cameroon and Senegal.
In those three countries, however, the agricultural sector employs more than half of the working
age population.
25These datasets were gathered as part of the MIMADEM project (see Kuepie and Robilliard (2015) for moredetails).
11

Figures 1, 2 and 3 display employment rates26’27 calculated from nationally representa-
tive surveys28 between 1976 to 2012, on the population aged 15-49 years29 and provide a first
overview of data comparability issues in Cameroon, Mali and Senegal over time.30 These fig-
ures show some surprising and unexplainable variations in employment rates both for men and
women over the reporting period. For the same year or over a short period of time in the same
country, two surveys can produce very different employment rates, both for men and women.
For instance in 2001 in Mali, two surveys interviewed the same individuals, and they produced
quite different female employment rates : it is equal to 78.1 % in EMEP survey and to 54.4%
in the QUID31 (Figure 2). The same observation can be made for the male employment rate in
1987 in Mali: it reaches 96.3% according to DHS whereas the RGPH estimates it at 87.1%. In
Senegal, female employment rate goes from 22.7% in RGPH 1988 to 52.2% in ESP 1991, which
corresponds to a rise of about 30 percentage points (thereafter ppts) in three years (Figure 3).
As regards men, we observe an increase in their mean employment rate of about 17 ppts be-
tween 2009 (MRHS) and 2010 (EDS). In Cameroon, female employment rates goes from 60.4%
in 2005 (EESI) to 42.6% 2006 (MICS), and then to 70.1% in 2007 (ECAM3).
The magnitude of these gaps questions the comparability of these statistics and casts seri-
ous doubts on the reliability of these data to run rigorous temporal and spatial analysis and to
draw meaningful policy recommendations. These variations could be explained (1) by sampling
errors32 and design effect33 (2) by non-sampling errors that relate to data collection and pro-
cessing procedures. This second category is broad and refers to several very different aspects :
26Employment rate is the proportion of the country’s working-age population (here aged 15 to 49 years old)that is employed. Here, the ‘employed’ are defined as all persons above a specific age who worked during aspecified reference period.
27Employment rate is our preferred labor market indicator here since we can calculate it for all the surveys.This is not the case for other indicators such as labor force participation, unemployment rates, number of workinghours, earnings, etc.
28In order to ensure the comparability of the surveyed population, we excluded from our initial sample ofsurvey: surveys conducted only in urban areas; men in CM DHS 1991 because the subsample is only composedof married men, hence not representative of the whole population.
29DHS samples only interview 15-49 years old women, so we calculate employment rates on this age group inorder to ensure comparability between surveys.
30Note that we systematically use the question with the shorter reference period (usually “1 week or Cur-rently”) to calculate employment rates. Surveys for which employment rates are not calculated on the “1 week”or “Currently” reference periods are indicated below figures.
31A Unified Questionnaire on Development Indicators designed by the World Bank.32Errors induced by differences in characteristics between the subsample on which employment rate is estimated
and the whole population33The design effect is “the ratio of the actual variance of a sample to the variance of a simple random sample
of the same elements” (Kish, 1965). In other words, it represents the impact of the sampling strategy (clustering,stratification) on the sampling error.
12

the quality of interviewers, errors from the respondents (e.g. misunderstanding), inappropriate
methods of interview, data entry or coding errors, etc. In this paper, we focus on errors arising
from the questionnaire design. Indeed, we suspect that differences in those characteristics across
surveys can explain a substantial part of these variations.
3.2 The diversity of labor modules in questionnaires
This section shows the diversity of labor modules through three key questionnaire characteristics
that are most likely to influence employment statistics : (1) the wording and type of questions,
(2) the length of labor modules and (3) the reference period used. We discuss the possible role
of differences in these questionnaire characteristics in influencing employment statistics. The
details about the characteristics of each survey questionnaires are given in appendix in Tables
A4, A5, A6.
3.2.1 Type of questions and wording
As mentioned in the literature review, the wording, the length, the detail and the form of
questions are likely to influence answers given by the respondents (Kalton and Schuman, 1982;
Kasprzyk, 2005; Guarcello et al., 2010; Bardasi et al., 2011).
First, questions can expect different types of answers according to their formulation. Two
main forms of questions can be distinguished in our sample of survey questionnaires : closed
questions and questions with a list of possible answers (see Table 1 for examples). Closed ques-
tions expect a “yes/no” answer and are the most widespread type of questions. The other form
expects one or several answers among different alternatives proposed by the interviewer. These
lists can be about economic activities or occupational status. Second, as suggested in the liter-
ature the wording and the keywords used are essential (Anker, 1983). Several keywords related
to employment appear in questionnaires : “work” , “economic activity”, “job”,“occupation”,
“type of activity” (see Table 2 for examples). Let’s consider some examples to highlight the
importance of the wording of questions : individuals may perform an actual “economic activity”
(e.g. prepare food for selling) but not consider it as a “job” or “work”, women may consider
themselves as “mainly occupied” as a housewife but still perform in addition an economic activ-
ity, individuals may have not worked during the past week but however have a job, etc. Third,
13

the detail of the question may also matter and influence the respondents’ answers, questions
can be more or less precise. The details given can be about the amount of time spent working,
remuneration (work for cash or payment in kind), type of economic activity or several types of
detail at the same time (see Table 3 for examples). Additionally, it is worth noting that some
surveys, i.e. DHS surveys, do not ask the same questions to men and women34, which makes
them non-comparable.
In our sample, 75 % of the surveys contain questions on “work” or “economic activity” (Table
4) and about 40% contains questions on “occupation”.35’36 Table 5 shows that questions on
“occupation” were more frequent during the period 1976-1990, and that questions about “work”
became more and more widespread from the 1990s onwards, at the expense of questions on
“occupation”. Questions on “economic activities”, “job” and “other wording” generally refer
to questions in long labor modules which more frequent in the last decade (see Example 7).
Overall, we expect that questions on occupation to underestimate female employment rate
compared to work question as suggested by Beneria (1981) since they tend to declare themselves
as main occupied as housewives even if they work. Since questions on “economic activities”
and “job” are generally questions belonging to long labor modules that aim at better capturing
economic activity for those who would have not declared work in the initial question, we expect
them to produce higher employment rates.
3.2.2 Length and detail of labor modules
The length and level of detail of labor modules vary greatly across surveys and are likely to play
a key role in influencing employment statistics (Bardasi et al., 2011). While some surveys and
census only ask one single question to determine the labor force status of respondents, others
present longer labor modules with a wide range of questions.37 Table 6 shows the distribution
34For instance, women are asked “As you know, some women take up jobs for which they are paid in cash orkind. Others sell things, have a small business or work on the family farm or in the family business. In the lastseven days, have you done any of these things or any other work?”, and men “Have you done any work in thelast 12 months? (CM DHS 1998) ”.
35One survey can contain several questions related to employment, and thus they may have both types ofwording. For this reason, the two types of questions wording do not sum up to 100%.
36Note that this classification only considers questions that enable to determine whether an individual shouldbe considered as employed or not. Thus, some labor modules may contains more questions related to employmentthat are not considered here.
37Note that this classification only consider questions that enable to determine whether an individual shouldbe considered as employed or not. Thus, some labor modules will be considered as having only one single questionwith our typology if other questions in the labor modules do not allow to determine the labor force status of therespondent (e.g. additional questions about the type of job, remuneration, etc.).
14

of the types of labor module: 64.2% of surveys in our sample rest on several questions (long
modules) to determine individuals’ labor status, the remaining of the surveys only use one
single question (short modules). Among long labor modules, additional questions can refer to:
(i) another reference period than in the initial question38, (ii) another question on “work” if the
first question was about occupational status 39, and vice versa (iii) a list of economic activities
that may not have been considered as “work” by the respondent in the first place, (iv) having
a job despite not working during the reference period or absence at work during the reference
period even if the respondent actually has a job40. Long labor modules can contain one or
several of the four types of additional questions we identified.
Long labor modules are expected to provide higher employment rates since they ask addi-
tional question that aim at catching up workers who would have not declared themselves as
employed with a unique question on work.
3.2.3 Reference period and Seasonality
As discussed in the literature review, the reference period is also likely to have an impact on
the measurement of employment. There are five different reference periods in our sample of
survey questionnaires: “1 week/7days”, “Currently”, “1 month/4 weeks”, “1 year/12 months”
and “No reference period specified” (see Tables A4, A5, A6). 41 Basically, the standard question
asked is “Did you work during [the reference period]?” or “What was your occupation during
[the reference period] ?” for the first four reference periods and “Even if you did not work during
the [reference period], do you have a job?” for the “No reference period specified”. The share of
surveys using each of the mentioned reference periods over the reporting period is described in
Table 7. The most frequent reference period is “1 week”42 present in about half of the surveys,
38E.g. “Did you work during the last 12 months?”, “Did you work during the last 7 days?” (CM ECAM11996)
39E.g. “What is your current occupation regarding employment?”, “During the last week, did you howeverwork at least an hour for an occasional or unusual ?” (CM EDM 2000)
40An example of a detailed module is displayed in Example 7.41Actually, there is one survey with a 6 months reference period (SN RGPH 1976) that we reclassify in the “1
year” reference period.42This reference period corresponds to the “currently active population” measuring the economically active
population in relation to a short reference period such as one week or one day.
15
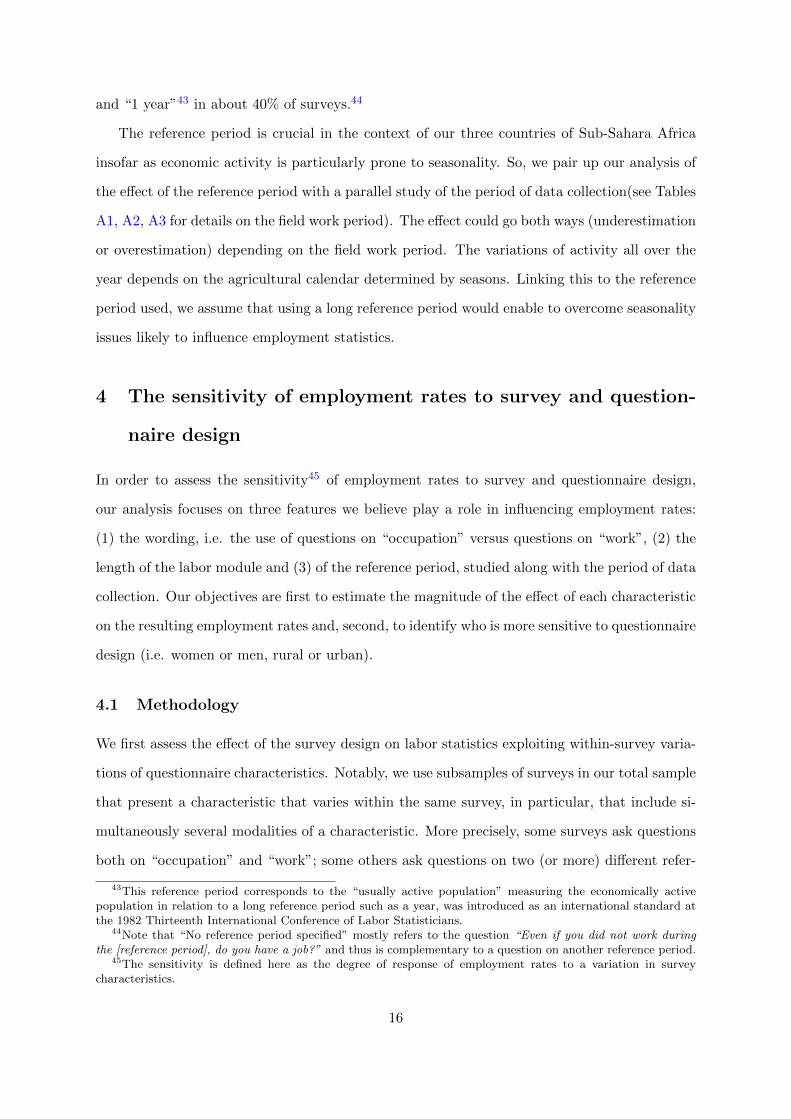
and “1 year”43 in about 40% of surveys.44
The reference period is crucial in the context of our three countries of Sub-Sahara Africa
insofar as economic activity is particularly prone to seasonality. So, we pair up our analysis of
the effect of the reference period with a parallel study of the period of data collection(see Tables
A1, A2, A3 for details on the field work period). The effect could go both ways (underestimation
or overestimation) depending on the field work period. The variations of activity all over the
year depends on the agricultural calendar determined by seasons. Linking this to the reference
period used, we assume that using a long reference period would enable to overcome seasonality
issues likely to influence employment statistics.
4 The sensitivity of employment rates to survey and question-
naire design
In order to assess the sensitivity45 of employment rates to survey and questionnaire design,
our analysis focuses on three features we believe play a role in influencing employment rates:
(1) the wording, i.e. the use of questions on “occupation” versus questions on “work”, (2) the
length of the labor module and (3) of the reference period, studied along with the period of data
collection. Our objectives are first to estimate the magnitude of the effect of each characteristic
on the resulting employment rates and, second, to identify who is more sensitive to questionnaire
design (i.e. women or men, rural or urban).
4.1 Methodology
We first assess the effect of the survey design on labor statistics exploiting within-survey varia-
tions of questionnaire characteristics. Notably, we use subsamples of surveys in our total sample
that present a characteristic that varies within the same survey, in particular, that include si-
multaneously several modalities of a characteristic. More precisely, some surveys ask questions
both on “occupation” and “work”; some others ask questions on two (or more) different refer-
43This reference period corresponds to the “usually active population” measuring the economically activepopulation in relation to a long reference period such as a year, was introduced as an international standard atthe 1982 Thirteenth International Conference of Labor Statisticians.
44Note that “No reference period specified” mostly refers to the question “Even if you did not work duringthe [reference period], do you have a job?” and thus is complementary to a question on another reference period.
45The sensitivity is defined here as the degree of response of employment rates to a variation in surveycharacteristics.
16
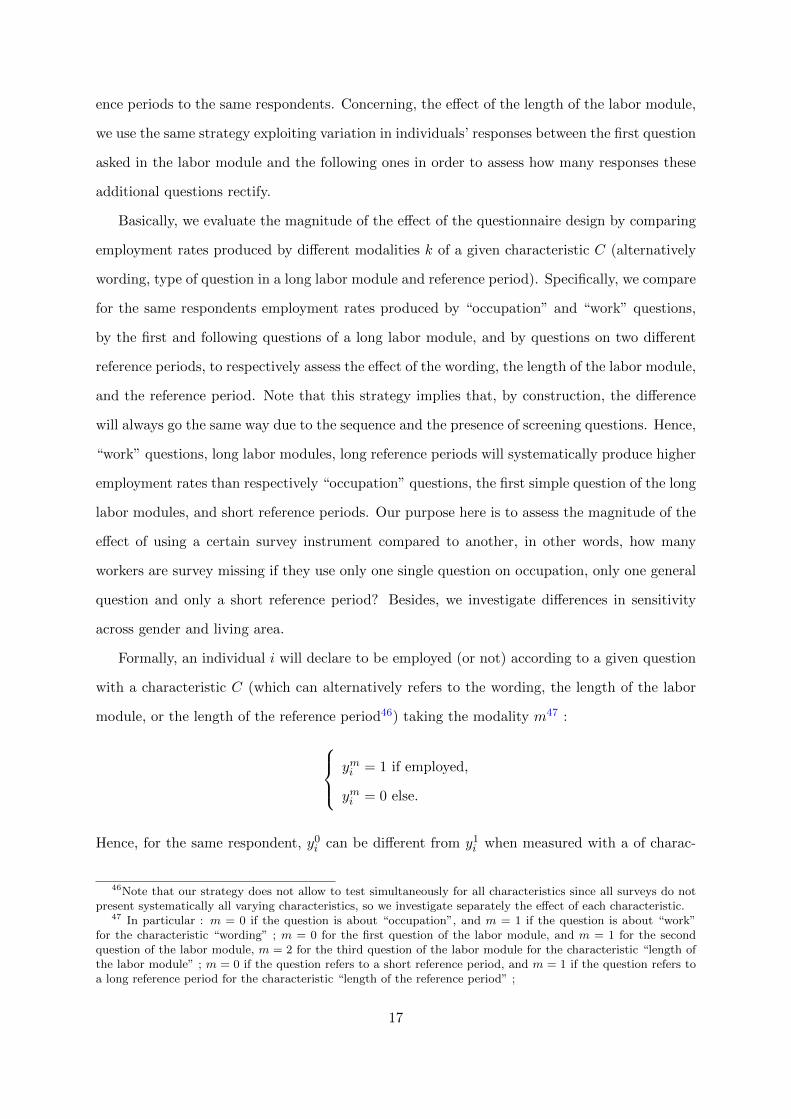
ence periods to the same respondents. Concerning, the effect of the length of the labor module,
we use the same strategy exploiting variation in individuals’ responses between the first question
asked in the labor module and the following ones in order to assess how many responses these
additional questions rectify.
Basically, we evaluate the magnitude of the effect of the questionnaire design by comparing
employment rates produced by different modalities k of a given characteristic C (alternatively
wording, type of question in a long labor module and reference period). Specifically, we compare
for the same respondents employment rates produced by “occupation” and “work” questions,
by the first and following questions of a long labor module, and by questions on two different
reference periods, to respectively assess the effect of the wording, the length of the labor module,
and the reference period. Note that this strategy implies that, by construction, the difference
will always go the same way due to the sequence and the presence of screening questions. Hence,
“work” questions, long labor modules, long reference periods will systematically produce higher
employment rates than respectively “occupation” questions, the first simple question of the long
labor modules, and short reference periods. Our purpose here is to assess the magnitude of the
effect of using a certain survey instrument compared to another, in other words, how many
workers are survey missing if they use only one single question on occupation, only one general
question and only a short reference period? Besides, we investigate differences in sensitivity
across gender and living area.
Formally, an individual i will declare to be employed (or not) according to a given question
with a characteristic C (which can alternatively refers to the wording, the length of the labor
module, or the length of the reference period46) taking the modality m47 :
ymi = 1 if employed,
ymi = 0 else.
Hence, for the same respondent, y0i can be different from y1
i when measured with a of charac-
46Note that our strategy does not allow to test simultaneously for all characteristics since all surveys do notpresent systematically all varying characteristics, so we investigate separately the effect of each characteristic.
47 In particular : m = 0 if the question is about “occupation”, and m = 1 if the question is about “work”for the characteristic “wording” ; m = 0 for the first question of the labor module, and m = 1 for the secondquestion of the labor module, m = 2 for the third question of the labor module for the characteristic “length ofthe labor module” ; m = 0 if the question refers to a short reference period, and m = 1 if the question refers toa long reference period for the characteristic “length of the reference period” ;
17

teristic C and modality 0 or of modality 1.48
The overall effect of each questionnaire characteristic can be measured by regressing a cat-
egorical variable Cm on the employment status (which is equivalent to performing a t-test).
Since the employment status yi of individual i is also determined by a set of individual and
household covariates Xi, we additionally control for these characteristics. For our purpose, we
then estimate the following linear probability model on samples expanded m times49 :
ymi = βCm + δXi + θS + εmi (1)
where ymi if a dummy equal to 1 if the individual i work according to the question of charac-
teristic C and modality m, Xi are individual, household and survey characteristics : gender,
living area, age, education, marital status, household size, geographical fixed effect, month of
interview (depending on the availability of these variables). We also include survey fixed effects
to control for unobservable characteristics of surveys.50 Since we have multiple observations (m)
of each respondent, we account for serial correlation in the error terms by clustering standard
errors at the individual level.
Second, another interesting question relates to the characteristics of the respondents who would
have been misclassified if they were only asked a single question with the characteristic C of
modality m = 0 instead of another question with the same characteristic of modality m = 1
(or m = 2). In particular, we are interested in whether the sensitivity to survey design differs
across gender and living area. We add interaction terms between the variable of interest, gender
and living area to assess the difference in sensitivity between men and women, rural and urban
respondents :
ymi = βCm ∗ γF ∗ δr + δXi + θS + εmi (2)
where γF and δr are respectively female and rural dummies.
We run our estimations separately for each characteristic (insofar as not all characteristics
vary within surveys) and separately for Cameroon, Mali and Senegal since sensitivity to survey
48Due to the structure of the questionnaires used for the analysis, we can have : y0i = y1
i (equal to 0 or 1) ory0i = 0 and y1
i = 1, but we cannot have y0i = 1 and y1
i = 0.49This allows us to have several measures of the work status for the same individual within the same survey50When the analysis is run out on more than one survey.
18
design may differ across countries.
4.2 The wording effect : “Occupation” versus “Work”
We first explore the effect of the wording used in questions on employment rates and respon-
dents’ answers. In particular, we ask: how many workers do surveys miss if they only use one
question on “occupation” with occupational status as alternatives for answers instead of adding
an additional question on “work” ? And who is more sensitive to the wording of questions?
Our analysis relies on surveys asking both types of questions on “occupation” and “work”
to the same respondents. This implies focusing on a restricted sample of surveys with different
wordings within surveys. This strategy allows us to compare the responses of the same re-
spondents to both wordings controlling for surveys’ unobservable characteristics. We use three
surveys to assess the magnitude of the effect of the wording within-survey and identify who
is more sensitive to the wording: CM EDM 2000, ML EMEP 2001 and SN EDMC 1996 (see
details of these surveys in Annex A1 to A6 ). These surveys have comparable labor modules
and all ask the two following questions in the same order :
1.“What is your current occupation, your situation regarding employment?” a.Work b.Look for
a job c.Student d.Retired e.Annuitant f.Housewife g.Other inactive
2. During the last seven days did you however work, at least one hour, for an occasional or
exceptional work? 51,52
Table 8 displays for these surveys the employment rates generated by both wordings, broken
up by country, sex and living area (only for ML EMEP 2001 because the two other surveys are
only urban, so we can only observe differences between the two wordings for urban area). Statis-
tics descriptive suggest that the overall effect at the aggregate level is variable depending in the
context of study : the gap is very small in urban Senegal, a little higher in urban Cameroon,
and the largest gaps are observed in Mali, especially for women in rural areas. Indeed, the
51Note already that details in bracket are given about what is to consider as work [“(Consider also workingfor own account or as an employee, helping a family member, paid or unpaid apprentice)”] in the first questionfor CM EDM 2000 and SN EDMC 1996 but in the second question in ML EMEP 2001’s labor module. We willget back later to this point in the paper.
52Thus, employment rates produced by the “work” question will be systematically higher that those computedfrom the “occupation” question insofar as it is only asked to those who did not defined themselves as “Employed”in the occupational question.
19
“work” question adds about 22 ppts to the initial female employment rate produced by the
only question on “occupation” in urban area, and the rate more than doubles in rural areas. It
rectifies to a much smaller extent Malian male employment rate in both areas. In Cameroon
and Senegal, urban male employment rates varies more with the “work” question than female
one, but the effects appear quite small, especially in Senegal.
How many workers adds the “work” question compared to a single question on “occupation”?
Table 9 reports the results of specifications (1) and (2) for the wording characteristic. Controlling
for individual characteristic, results are consistent with the descriptive statistics: the question
on work adds 23.4 ppts, 2.7ppts, and less than 1 ppt respectively in Mali (as a whole), urban
Mali and urban Senegal (columns (1), (2) and (3)).
Malian respondents seem more affected by the wording (even when considering only urban
area), while the effect is small in Cameroon and negligible in Senegal. A straightforward inter-
pretation of this result could be that surveys using “occupation” questions are most likely to
underestimate employment rate for Malian women, and studies and recommendations derived
from these estimates might be biased. Nevertheless, the smaller effects observed in Cameroon
and Senegal compared to Mali may also be due to another difference in the design of the labor
module, implying that results are not strictly comparable. Indeed, details about what is to be
considered as work (“working for own account or as an employee, helping a family member,
paid or unpaid apprentice”) are given in bracket as an instruction in the first question about
“occupation” in the surveys of Cameroon and Senegal, while this indication only comes along
with the second question on “work” in the Malian survey. This highlights another important
aspect of the wording, the detail given in the question, also likely to affect respondent’s answers.
For this reason, we will interpret separately results for Mali on the one hand, and for Cameroon
and Senegal on the other hand.
Which individuals are more sensitive to the wording? As regards gender differences in sen-
sitivity to the wording, Malian women appear significantly more sensitive to the wording than
men. The probability of declaring themselves employed is 14.9 ppts higher if they live in urban
area and 29.2 ppts higher in rural area compared to men (column (4)). Men tend to slightly
more declare themselves as employed with the “work” question in urban area than in rural one
20

(2.1 ppts more added compared to urban), while female employment rate in rural area is largely
more sensitive than that of urban area. On the contrary, the “work” adds significantly more
men than women in Cameroon. There is no difference in sensitivity across gender in Senegal,
but the overall effect is very small.
Why is female employment rate more sensitive than male’s one in Mali? Who are those
who are not currently occupied as employed but who worked last week? Table 10 provides more
details about the structure of the Malian population by occupational status (1), the share within
each occupational status who worked during the last seven days (2) and the contribution of each
occupational status to the difference in employment rates observed between the “occupation”
and the work question (3). Men are less sensitive to the wording first because their employment
rate is much more higher than female one, so the possibility for correction is more limited.
While about half of the women are housewives, men are mostly employed, all the more in rural
area (90.5 %). Second, an interesting feature is that many women who declare themselves as
housewives actually perform economic activities on top of their domestic work, 43.3% of them
did work during the past week in urban area and 84.7% of them actually worked in rural area.
This aspect largely explains why female employment rate is more sensitive than male one to
the wording : women are mainly housewives, and the latter are the more likely to work at the
same time compared to other occupational status. Thus, they contribute up to 87.9% to the
gap in employment rates between the two wordings in urban area, and up to 96.7% in rural
area. This supports Beneria’s criticism towards “main occupation” questions that would tend
to underestimate women’s real economic contribution. Besides, men who look for a job are
more likely than women with the same occupational status to have worked last week among
those who are not employed. As regards other occupational status, women are systematically
more likely than men to have worked last week if they did not declare themselves employed. It
could mean that unemployed men can nevertheless perform temporary work to make money,
waiting to find what they could consider to be a “real” job. Students’ share is higher in urban
area but in proportion they work more along with their studies in rural area (35.8%). Rural
students are plausibly helping in the family farm or business and studying at the same time.
Turning now to the comparison between the two other countries, we first seek to explain
21

why wording has such a negligible effect in Senegal compared to Cameroon. It does not seem to
be explained by differences in terms of repartition of the population by occupational status, but
rather by the fact that the share of workers among non employed is much more smaller in Senegal
than in Cameroon (Table 10). Indeed, even if the structure by occupational status somewhat
differs, the main explanation lies in the fact that non employed systematically work more in
Cameroon than in Senegal. In particular, even if housewives’ share in the total population is
higher in Senegal (42% of women in urban area) than in Cameroon (18%), they do not work
more. Several elements gleaned from the data in CM EDM 2000 and SN EDMC 1996 can also
shed some light on this aspect. According to Table 11, the proportion of those who are not
employed and are not searching for a job is high, especially in Senegal (94.8% for women and
89.2% for men). One of the main reason given is that these individuals want to finish their
studies : 75.7 % and 46.1% respectively for men and for women in Cameroon and reciprocally
58.9 % and 21.8% in Senegal. It is consistent with the previous table which suggests that
students do not work at the same time. We assume however that more students would have
worked at the same time in rural area, but unfortunately we have no data to confirm our
intuition. A significant share of women who did not search a job claim that they have to help
with household duties, especially in Senegal (35.6% against 18% in Cameroon). A striking
figure is that 34.4% of non-working women in Senegal actually do not want to work53. It is not
the case in Cameroon, where 65% of women who did not search for work would like to work.54
In Senegal, not working appears to be a choice made by women who choose to be housewives
and not to work. It underlies the fact that in Senegal, women value their role in the family as
a wife and a mother and prefer not to work, family needs being fulfilled by men (Adjamagbo
et al., 2006). As regards Cameroonian women, they rather face lack of work opportunities and
constraints due to their household duties and qualification which prevent them from working
even if they want to.
Another question is why, contrary to our expectations, male employment rates are more
affected than female ones in these two countries? Within the same occupational status (except
housewives), more men than women worked last week. Our interpretation is that this result
may be due the small overall number of individuals added of both sexes.
53Note however that since multiple answers are not allowed, it is possible that women do not want to workfor one of the others reasons mentioned.
54According to EDM 2000, this result is not display in a table.
22

To summarize our findings, the wording effect differs a lot across contexts of study. Results
from the Malian survey shows large effects and female employment rate appears more sensitive
than male one to the wording. In particular, women tend to combine both their role of housewife
and work at the same time for the majority of them. Rural statistics for women are also more
sensitive to the wording than urban ones. In Cameroon and Senegal, the effects are smaller,
which can be partly explained by another wording aspect : the detail given in the question
is likely to play a non negligible role in influencing employment rates, along with the sheer
effect of the keywords used. As regards differences between those two countries, within the
same occupational status Senegalese individuals (men and women) systematically work less
than Cameroonian ones if they are not employed in urban area. A similar study in rural area
would be necessary to draw a conclusion for the whole country and would eventually provide
very different effects judging by the differences observed in Mali across living areas. Following
the idea that details given in questionnaires affect respondents’ answers, we now turn to an
analysis of the contribution of long labor modules compared to single questions.
4.3 The contribution of long labor modules
In this section, we analyze the contribution of long labor modules composed of several questions
compared to labor modules with only one single question. Long labor modules are usually de-
signed with the intention to better capture employment since one single general question might
miss some workers. We are interested in surveys with detailed modules including : (1) a question
on whether the individual worked during the previous week, (2) a question with a list of economic
activities and (3) a question on having a job despite not working during the reference period or
a question on absence at work during the reference period55 (see questions EA1. EA2. EA3. in
Figure 7). The first additional question (2) provides details about economic activities that may
have not been considered as “work” by respondents in the first question. The goal of the second
additional question (3) on having a job or being absent from work is to check if the respondent
has actually a job even if he declared he did not work during the previous week. In order to
explore this question, we use a subsample of eight surveys with comparable labor modules: CM
55This question basically boils down to the same idea of having a job but not having worked during thereference period
23

ECAM3 2007, CM EESI 2005, CM EESI 2010, ML ELIM 2006, ML EPAM 2004, ML EPAM
2007, ML EPAM 2010, SN ENTE 200556. Our strategy, as previously, consists in analyzing
within-surveys variations to estimate the effect of additional questions on employment variables.
We seek to answer the following questions : How much the employment rate is underes-
timated in surveys that do not use a detailed labor module? Are female employment rates
more sensitive to the length of the module than men? Table 12 reports descriptive statistics on
employment rates generated by additional questions, broken up by country, sex and living area
at the aggregate level. In proportion of the initial employment rate, long labor modules adds
between 3.4 ppts (for women in urban Senegal) and 7.9 ppts (for women in urban Cameroon)
to initial employment rates produced with one single question. They systematically contribute
to capture more women than men whatever the country or the living area in proportion of the
initial employment rate. As regards the respective contribution of (2)list of economic activities
questions and (3)those on having a job despite not working during the reference period, the
latter captures on average more workers except in urban Mali.
Table 13 reports the estimates of the magnitude of the contribution of detailed modules,
controlling for individuals’ characteristics and surveys’ unobservables characteristics. The ques-
tions on economic activities adds on average, other things being unchanged, 3.3 ppts to the
employment rate in Cameroon, 1.8 ppts in Mali and the effect is close to zero in Senegal. There
is no significant difference across gender (except in Cameroon but the difference is close to zero)
neither across living area. Overall, the long modules (the combined contribution of both addi-
tional questions) significantly increase the probability of declaring oneself employed by 6.8 ppts
in Cameroon, 3 ppts in Mali and 4.5 ppts in Senegal. The probability of declaring oneself em-
ployed with a long labor module is 1.7 ppts higher for women than for men in urban Cameroon
and 2.8 ppts in rural Senegal(columns (2) and (6)) . In Senegal, rural workers are significantly
more likely to declare themselves employed than in urban area, while this is not the case in the
two other countries (column(6)).
As suggested in the literature, a “list of activities” question is supposed to be more effective
56Note that this survey is not strictly comparable to the other surveys, but remains quite similar. For thisreason, and since there is no other nationally representative survey with this type of labor module in Senegal,we still include it in our analysis in order to have an idea of the effect of the length of labor module in Senegal.This point however must be borne in mind for interpretation of differences in the effect between countries
24

than a single (or several) keyword questions in capturing women’s work (Langsten and Salem,
2008; Anker, 1983). Our descriptive statistics confirm that more women than men are included
in proportion of the initial employment rate, however the effect is rather small and differences
between men and women is only significant in urban Cameroon. Besides, the overall effect of a
long module instead of a short one is non negligible (between 3 and 6 ppts). The introduction
of the question on having a job seems particularly relevant to include the employed workers
that have been missed by the simple question on work during the reference period. Women
are significantly more sensitive than men to this questionnaire feature in urban Cameroon and
rural Senegal.
Which individuals are more likely to be captured thanks to those additional questions? We
then further explore the characteristics of the workers initially considered as not employed by
a simple question but regarded as employed thanks to the question with a list of economic
activities (Tables 14 and 15). Note that the list of activities given in the Senegalese survey
(ENTE 2005) is not strictly comparable to those in Cameroon and Mali, so we analyze it
separately. It appears that workers who are included thanks to this additional question are
mainly helping in the family business (especially in rural area), apprentices or work in a personal
business in Cameroon. In Mali, about half of the women who declared they did not work last
week actually either made products for sale or did something at home for pay. As regards men,
they are more likely to have worked in a personal business. In rural Mali, 21.6% of women and
33% of men declared they helped in the family business even if they did not work during the past
week. In rural Senegal, most of those who have been captured by the first additional question
are cultivating, harvesting agricultural products or fishing (64.% of the women and 92.6% of
the men). In urban areas, discrepancies between activities performed by men and women are
more pronounced. About half of the women are selling products, food or agricultural products
and 31.5% of them are preparing food, clothes or handicrafts for selling. As regards men they
are mainly taking care of domestic animals (45.4%) or cultivating or harvesting agricultural
products (38.1%).
To summarize, long labor modules (with a question on economic activities and a question
on having a job) contribute to add between 3 and 6 ppts to the employment rate depending
25

on the country. The largest effect is observed in Cameroon and female employment rates are
significantly more sensitive than men ones to this feature in urban Cameroon and rural Senegal.
Sensitivity to detail of labor module vary significantly across living areas only in Senegal.
4.4 Short and Long reference periods and seasonality issues
Finally, we explore the role played by the reference period used in questions in influencing
employment rates. In order to simplify the analysis, we aggregate the “1 week” and “Currently”
reference periods representing “short reference periods” and compare it to the “1 year” reference
period representing a “long reference period”. We leave aside the “1 month” reference period
which is neither purely a short reference period nor a long one and the “No reference period
specified” insofar as it is not a strictly speaking reference period, and is most of the time an
additional question in detailed modules such as those presented in the previous subsection.
As previously, we exploit intra-survey variations of the reference period to assess its influence
on employment rates. In other words, we look at average differences in employment rates
computed from questions using two distinct reference periods ask to the same respondents
within the same survey.
Table 16 describes average differences observed within surveys which have a short and a long
reference periods, disaggregated by country, living area and sex. Overall, the long reference
period adds between 2.7 ppts (female employment rate in urban Mali) and 17.9 ppts (female
employment rate in rural Senegal). The most striking fact is the high difference observed
between the two reference periods in rural area in Senegal both for men (15.5 ppts) and women
(17.9 ppts). The gap is smaller but remains non negligible for urban employment rate in
Senegal (6.1 ppts for female employment rate and 7.6 ppts for men’s one). On average the
magnitude of the differences between reference periods is larger in Senegal than in the two
other countries, suggesting that employment rates are more sensitive to the reference period
in Senegal. The differences in employment rates are higher in rural area than in urban ones
in Mali and Senegal, but it is the contrary in Cameroon. There is no systematic patterns as
regards gender differences, mean gaps between the reference periods are sometimes higher for
male employment rates sometimes for female.
Table 17 shows that, the long reference period yields to significantly higher estimates than
26

the short one : 6 ppts, 2.9 ppts and 9.7 ppts respectively in Cameroon, Mali and Senegal.
Malian respondents are on average less sensitive to the reference period than Senegalese and
Cameroonian ones. Results show that female employment rates are not more sensitive than male
ones to the length of the reference period in the three countries, they are even less sensitive
in Mali (in particular in rural area). This is contradictory with expectations derived from the
literature. Indeed, as suggested by Dixon (1982) , we would have expected women to be more
likely to “be missed” with a shorter reference period because their work is supposed to be more
occasional, irregular, seasonal, etc..
The long reference period question effect on male employment rates in rural area is 3 ppts
and by 7.2 ppts higher than in urban area respectively in Mali and Senegal. Surprisingly, a
longer reference period captures more workers in urban area than in rural one in Cameroon.
We expected rural employment to be more seasonal and thus more sensitive to the length of
the reference period.
Additional information provided by DHS surveys confirms that women in those three coun-
tries are more likely to have a seasonal or occasional jobs than permanent ones compared to
men (Table 18). Nevertheless, even if occasional and seasonal workers are more likely to be
captured by the longer reference period, more men than women are captured. As regards dif-
ferences across living area, while urban workers are more sensitive to the reference period than
rural ones in Cameroon, we observe the contrary in Mali and Senegal where the longer reference
period helps to include more rural workers into the labor force. Employment tends to be more
seasonal in rural area, nevertheless, in proportion, more workers are captured with a longer
reference period in urban area (except for Senegalese women judging by Table 18).
Finally, we explore into more details the relationship between the reference period and an-
other survey feature : the period of data collection. Indeed, the effect of the month of interview
can go both ways (underestimation or overestimation) depending on the time of the survey.
More specifically the agricultural calendar is likely to be determinant in the level of activity all
over the year. In order to explore this issue, we look at variations in employment rates across
months of interview. We use the DHS surveys conducted over several months and for which we
have information on the day respondents where interviewed and that use both long and short
reference periods. We examine seasonality separately for the three countries as they are not sub-
27

ject to the same seasonal variations. As mentioned in the literature, the data collection period
is likely to influence respondent’s answers to employment questions, however seasonal variations
of employment are expected to disappear with a “1 year” reference period. Figures 5, 5 and
6 display large variations in average employment rates according to the month of interview.
We find that seasonal variations in employment rates persists for both short and long reference
periods. This suggests that the use of a longer reference period does not solve the problem of
seasonality. Indeed, recall bias is important, respondents may not remember correctly episodes
of employment if they are far in the past (Kalton and Schuman, 1982). It is also likely that their
current labor force status influence their perception of their labor force status over the past year.
5 Conclusion
Given that employment statistics are widely used both for academic research and to guide
employment policies, we first assess to what extent labor data produced by surveys conducted
in countries of Sub-Saharan Africa are reliable to conduct comparisons over time and between
countries and to draw meaningful recommendations. Using data from about fifty household
surveys and census carried out in Cameroon, Mali and Senegal from 1976 to 2012, we first came
to the conclusion that even if similarities are observed within the same type of surveys, the rule
seems to be that every new survey uses a newly designed labor module.57As a result, statistics
are not comparable over time and space and implications in terms of credibility and reliability
of analysis are of concern. Therefore, we investigate the sensitivity of employment statistics to
questionnaire design in order to evaluate to what extent this diversity in questionnaires affect
labor statistics. More specifically, we analyze the influence of three questionnaire features : the
wording, the length of the labor module, and the length of the reference period (in parallel with
the period of data collection). For each of these characteristics we assess the gap induced by
a change in one of these questionnaire characteristic and explore if women are more sensitive
than men to survey design.
Instead of comparing different surveys with different characteristics as Guarcello et al. (2010)
did in order to study child labor variations with survey design, we exploit within-survey vari-
57DHS Surveys seem to have quite similar labor modules over time, with only few exceptions, and only addnew questions without removing traditional questions which allow for data comparability.
28

ations of our characteristics of interest. It allows us to compare work status declared by the
same respondents across different survey instruments and control for surveys’ specificities. Ad-
ditionally we run a heterogeneity analysis with the the purpose of investigating differences in
sensitivity to questionnaire characteristics across gender and living area.
Our results confirm that employment statistics are sensitive to the design of the survey
questionnaire. A summary of results is displayed in Table 19. However, there is no clear and
simple answer to the following questions : What is the size of the effect of each characteristics?
What is the more “effective” questionnaire characteristic to capture workers in developing coun-
tries? The magnitude of the effect of each characteristic under study on employment rates is
very context-dependent. As regards sensitivity across countries, the wording has a large effect
in Mali (23.4 ppts), a small one in Cameroon (2.7 ppts) and no effect on employment rate in
Senegal. As regard the detail of the labor module, long labor modules add between 3 ppts
and 6.8 ppts to the employment rate, we can thus infer the magnitude of the missed workers
by surveys with a single question. Employment rate is more sensitive to the reference period
in Senegal (more than 12.2 ppts on average). Our findings do not enable to conclude on the
superiority of one survey instrument to capture employment since our strategy does not allow to
assess the comparative effect of all the characteristics simultaneously. Nevertheless, our results
enable to draw analysts’ attention on the fact that using surveys with one single question on
occupation (such as census surveys, e.g.: RGPHs), or one single general question on “work”
(e.g. CM CAVIE 2002, SN ESAM1 1994, SN DHS 1992) instead of a detailed labor module, or
a short reference period (e.g. ML EESI, ML ELIM 2003, SN ESPS 2005) without asking the
same question on a long reference period are likely to significantly underestimate employment.
Who is more sensitive to the survey design, i.e. are (rural) female more sensitive to survey
features? Another informative conclusion of our analysis is that, contrary to our expectations
derived from the existing literature, women are not systematically more sensitive than men to
survey design. Moreover, rural individuals are not systematically more sensitive than urban
ones to survey design either. The effects of each characteristic differ across country, gender, and
living area. A summary of results is displayed in Table 20.
29

On the basis of this analysis, several recommendations can be drawn. As an ex ante strategy
for future surveys, a first best would be to carry out harmonized a repeated labor force surveys
with several waves over the year. A second best would be to harmonize employment mod-
ules across surveys or include systematically a standardized module in all surveys (e.g. QUID
questionnaires). Another implication of our study concerns the contents of the labor module.
Questions on marginal economics activities are not as “effective” as expected to include workers
into the labor force, whereas the questions on having a job or being absent from work seem more
able to capture workers who did not work during the reference period. Further information on
the nature, type and remuneration of work has also to be included to provide a clear picture of
employment (see for instance 1-2-3 Surveys). As suggested earlier, time use surveys listing all
activities performed over the day/week can be an alternative enabling to define ex post what is
defined as an economic activity. However, there is always a trade-off between accuracy and cost
in time and money, such that implementers are not always able to follow recommendations. As
regards ex post strategy with already collected data, harmonizing data is difficult given the
high variability of surveys characteristics. At the aggregate level, the strategy presented by
Guarcello et al. (2010) could be implemented. Another alternative is to use only comparable
surveys for trend analysis, i.e. the more recent DHS surveys in our sample whose labor modules
vary little over time and space compared to other surveys.
Further efforts remain to be done on the basis of this sensitivity analysis to survey characteris-
tics. Other questionnaire characteristics have to be explored (e.g. proxy versus self-respondent),
as well as other dimensions of heterogeneity in sensitivity to survey design. Variations in em-
ployment rates based on data quality also need further investigation. Indeed it is likely that
interviewers’ training plays a key role in the data collection process. Moreover, rigorous methods
to correct data and improve ex post temporal and spatial comparability have to be developed.
30

References
Adjamagbo, A., Antoine, P., Beguy, D., and Dial, F. B. (2006). Comment les femmes concilient-
elles mariage et travail a Dakar et a Lome? DIAL Working Paper 2006-04.
Anker, R. (1983). Female labour force participation in developing countries: A critique of
current definitions and data collection methods. International Labour Review, 122(6):709–23.
Anker, R. and Anker, M. (1989). Measuring the female labour force in Egypt. International
Labour Review, 128(4):511–520.
Bardasi, E., Beegle, K., Dillon, A., and Serneels, P. (2011). Do labor statistics depend on how
and to whom the questions are asked? Results from a survey experiment in Tanzania. The
World Bank Economic Review, 25(3):418–447.
Beneria, L. (1981). Conceptualizing the labor force: The underestimation of women’s economic
activities. The Journal of Development Studies, 17(3):10–28.
Boserup, E. (1970). Woman’s role in economic development. Allen & Unwin (London).
Charmes, J. (1998). Women working in the informal sector in Africa: New methods and new
data. Paper prepated for the UN Statistics Division, the Gender in Development Programme
of UNDP, and the project Women in Informal Employment: Globalizing and Organizing.
Chen, M. A. (2001). Women and informality: A global picture, the global movement. Sais
Review, 21(1):71–82.
Dammert, A. C. and Galdo, J. (2013). Child labor variation by type of respondent: Evidence
from a large-scale study. World Development, 51:207–220.
Dillon, A., Bardasi, E., Beegle, K., and Serneels, P. (2012). Explaining variation in child labor
statistics. Journal of Development Economics, 98(1):136–147.
Dixon, R. B. (1982). Women in agriculture: Counting the labor force in developing countries.
Population and Development Review, 8(3):539–566.
Donahoe, D. A. (1999). Measuring women’s work in developing countries. Population and
Development Review, 25(3):543–576.
31
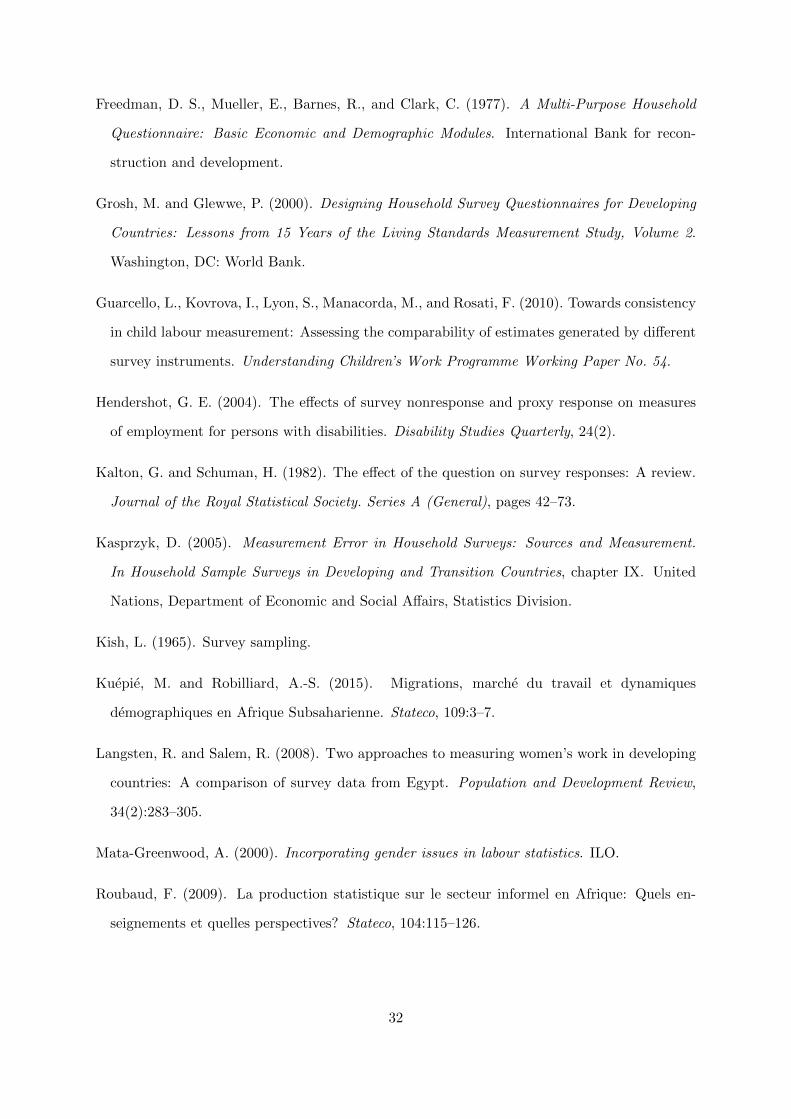
Freedman, D. S., Mueller, E., Barnes, R., and Clark, C. (1977). A Multi-Purpose Household
Questionnaire: Basic Economic and Demographic Modules. International Bank for recon-
struction and development.
Grosh, M. and Glewwe, P. (2000). Designing Household Survey Questionnaires for Developing
Countries: Lessons from 15 Years of the Living Standards Measurement Study, Volume 2.
Washington, DC: World Bank.
Guarcello, L., Kovrova, I., Lyon, S., Manacorda, M., and Rosati, F. (2010). Towards consistency
in child labour measurement: Assessing the comparability of estimates generated by different
survey instruments. Understanding Children’s Work Programme Working Paper No. 54.
Hendershot, G. E. (2004). The effects of survey nonresponse and proxy response on measures
of employment for persons with disabilities. Disability Studies Quarterly, 24(2).
Kalton, G. and Schuman, H. (1982). The effect of the question on survey responses: A review.
Journal of the Royal Statistical Society. Series A (General), pages 42–73.
Kasprzyk, D. (2005). Measurement Error in Household Surveys: Sources and Measurement.
In Household Sample Surveys in Developing and Transition Countries, chapter IX. United
Nations, Department of Economic and Social Affairs, Statistics Division.
Kish, L. (1965). Survey sampling.
Kuepie, M. and Robilliard, A.-S. (2015). Migrations, marche du travail et dynamiques
demographiques en Afrique Subsaharienne. Stateco, 109:3–7.
Langsten, R. and Salem, R. (2008). Two approaches to measuring women’s work in developing
countries: A comparison of survey data from Egypt. Population and Development Review,
34(2):283–305.
Mata-Greenwood, A. (2000). Incorporating gender issues in labour statistics. ILO.
Roubaud, F. (2009). La production statistique sur le secteur informel en Afrique: Quels en-
seignements et quelles perspectives? Stateco, 104:115–126.
32

World Bank (2015). World development indicators 2015. Washington, DC : World Bank
Group. Available at http://documents.worldbank.org/curated/en/2015/04/24352249/world-
development-indicators-2015 [Accessed on April, 11th 2016].
33

Figure 1: Female and male employment rates in Cameroon from 1976 to 2011
020
4060
80
CM RGPH 19
76
CM EBC 19
83
CM RGPH 19
87
CM EDS 19
91
CM ECAM1 1
996
CM EDS 19
98
CM MIC
S 2000
CM ECAM2 2
001
CM EDS 20
04
CM EESI 2
005
CM MIC
S 2006
CM ECAM3 2
007
CM EESI 2
010
CM EDS 20
11
Female employment rates Male employment rates
Notes:(1) Only nationally representative surveys and census are represented here in view of comparability.(2) Employment rates are weighted and calculated for 15-49 years old individuals, for “1 week orcurrently” reference period when it exists. For MICS 2000 and 2006, DHS 1991 for men they arecomputed with “No reference period” and for ECAM2 2001 with a “1 month” reference period.(3) MICS surveys in 2000 and 2006 did not interview men.
Figure 2: Female and male employment rates in Mali from 1976 to 2012
020
4060
8010
0
ML RGPH 19
76
ML EDS 19
87
ML RGPH 19
87
ML EMCES 19
94
ML EDS 19
95
ML RGPH 19
98
ML EDS 20
01
ML EMEP 20
01
ML EMEP 20
01 Q
UID
ML ELIM
2003
ML EPAM 20
04
ML EDS 20
06
ML ELIM
2006
ML EPAM 20
07
ML EPAM 20
10
ML EDS 20
12
Female employment rates Male employment rates
Notes:(1) Only nationally representative surveys and census are represented here in view of comparability.(2) Employment rates are weighted and calculated for 15-49 years old individuals, for “1 week orcurrently” reference period when it exists. For DHS 1987 they are computed with “No referenceperiod” and for RGPH 1987 and 1998 with a “1 month” reference period.
34

Figure 3: Female and male employment rates in Senegal from 1976to 2010
020
4060
8010
0
SN RGPH 19
76
SN EDS 19
86
SN RGPH 19
88
SN ESP 19
91
SN EDS 19
92
SN EMUS 19
93
SN ESAM1 1
994
SN EDS 19
97
SN ESAM2 2
001
SN RGPH 20
02
SN EDS 20
05
SN ENTE 20
05
SN ESPS 20
05
SN MRHS 20
09
SN EDS 20
10
Female employment rates Male employment rates
Notes:(1) Only nationally representative surveys and census are represented here in view of comparability.(2) Employment rates are weighted and calculated for 15-49 years old individuals, for “1 week orcurrently” reference period when it exists. For RGPH 1976, 1988, 2002 and ESAM1 1994 they arecomputed with a “1 year” reference period, and with “No reference period” for DHS 1997 and DHS1992 for men.(3) DHS 1986 did not interview men.
35
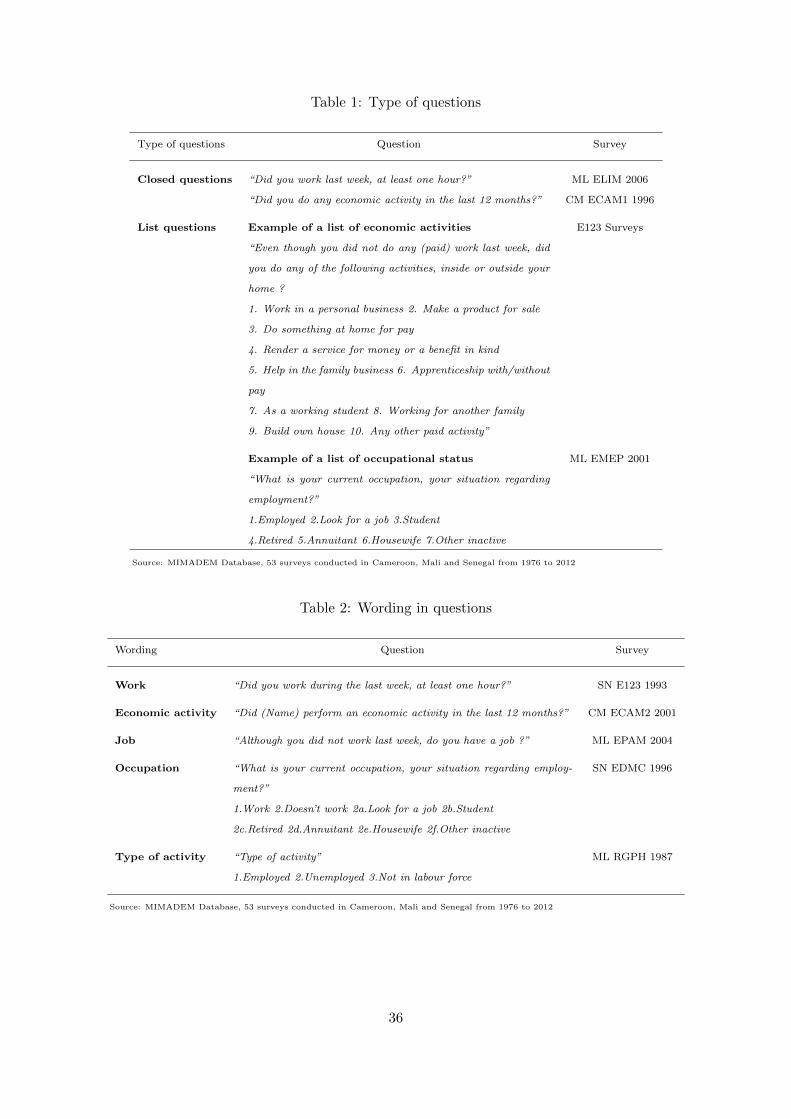
Table 1: Type of questions
Type of questions Question Survey
Closed questions “Did you work last week, at least one hour?” ML ELIM 2006
“Did you do any economic activity in the last 12 months?” CM ECAM1 1996
List questions Example of a list of economic activities E123 Surveys
“Even though you did not do any (paid) work last week, did
you do any of the following activities, inside or outside your
home ?
1. Work in a personal business 2. Make a product for sale
3. Do something at home for pay
4. Render a service for money or a benefit in kind
5. Help in the family business 6. Apprenticeship with/without
pay
7. As a working student 8. Working for another family
9. Build own house 10. Any other paid activity”
Example of a list of occupational status ML EMEP 2001
“What is your current occupation, your situation regarding
employment?”
1.Employed 2.Look for a job 3.Student
4.Retired 5.Annuitant 6.Housewife 7.Other inactive
Source: MIMADEM Database, 53 surveys conducted in Cameroon, Mali and Senegal from 1976 to 2012
Table 2: Wording in questions
Wording Question Survey
Work “Did you work during the last week, at least one hour?” SN E123 1993
Economic activity “Did (Name) perform an economic activity in the last 12 months?” CM ECAM2 2001
Job “Although you did not work last week, do you have a job ?” ML EPAM 2004
Occupation “What is your current occupation, your situation regarding employ-
ment?”
SN EDMC 1996
1.Work 2.Doesn’t work 2a.Look for a job 2b.Student
2c.Retired 2d.Annuitant 2e.Housewife 2f.Other inactive
Type of activity “Type of activity” ML RGPH 1987
1.Employed 2.Unemployed 3.Not in labour force
Source: MIMADEM Database, 53 surveys conducted in Cameroon, Mali and Senegal from 1976 to 2012
36
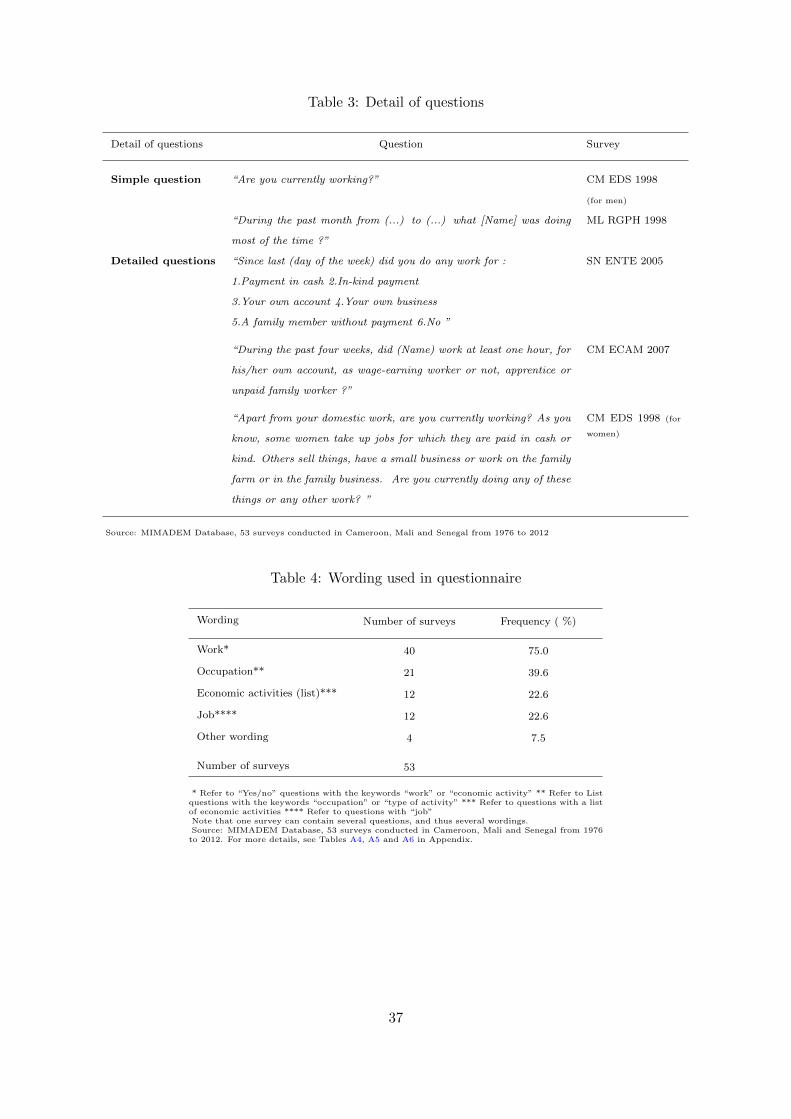
Table 3: Detail of questions
Detail of questions Question Survey
Simple question “Are you currently working?” CM EDS 1998
(for men)
“During the past month from (...) to (...) what [Name] was doing
most of the time ?”
ML RGPH 1998
Detailed questions “Since last (day of the week) did you do any work for : SN ENTE 2005
1.Payment in cash 2.In-kind payment
3.Your own account 4.Your own business
5.A family member without payment 6.No ”
“During the past four weeks, did (Name) work at least one hour, for
his/her own account, as wage-earning worker or not, apprentice or
unpaid family worker ?”
CM ECAM 2007
“Apart from your domestic work, are you currently working? As you
know, some women take up jobs for which they are paid in cash or
kind. Others sell things, have a small business or work on the family
farm or in the family business. Are you currently doing any of these
things or any other work? ”
CM EDS 1998 (for
women)
Source: MIMADEM Database, 53 surveys conducted in Cameroon, Mali and Senegal from 1976 to 2012
Table 4: Wording used in questionnaire
Wording Number of surveys Frequency ( %)
Work* 40 75.0
Occupation** 21 39.6
Economic activities (list)*** 12 22.6
Job**** 12 22.6
Other wording 4 7.5
Number of surveys 53
* Refer to “Yes/no” questions with the keywords “work” or “economic activity” ** Refer to Listquestions with the keywords “occupation” or “type of activity” *** Refer to questions with a listof economic activities **** Refer to questions with “job”Note that one survey can contain several questions, and thus several wordings.Source: MIMADEM Database, 53 surveys conducted in Cameroon, Mali and Senegal from 1976
to 2012. For more details, see Tables A4, A5 and A6 in Appendix.
37

Table 5: Evolution in wording over time
Number of surveys
Wording Frequency (%)
% of surveys
[1976-1990[ ] 1990-2000[ [2000-2012] Total Questions
“Work”* 2 13 25 40
% 22.22 81.25 89.28 75.47
“Occupation”** 7 9 5 21
% 77.77 56.25 17.86 9.43
Economic activities (list)*** 0 2 10 12
% 0.0 12.5 35.71 22.64
Job**** 0 2 10 12
% 0.0 12.5 35.71 22.64
Other wording 0 1 3 4
% 0.0 6.25 10.71 7.55
Number of surveys 9 16 28 53
* Refer to “Yes/no” questions with the keywords “work” or “economic activity” ** Refer to List questionswith the keywords “occupation” or “type of activity” *** Refer to questions with a list of economic activities**** Refer to questions with “job”% represents the share of surveys using this wording during a specific decade.Note that one survey can contain several questions, and thus several wordings.Source: MIMADEM Database, 53 surveys conducted in Cameroon, Mali and Senegal from 1976 to 2012. For
more details, see Tables A4, A5 and A6 in Appendix.
Table 6: Labor Modules in questionnaires
Number of surveys Frequency (%)
Length of labor modules:
- Short : Single question 19 35.8
- Long : Several questions 34 64.2
Number of surveys 53 100.0
Type of long labor modules :
- Several reference periods 21 61.8
- Occupation and work 7 20.6
- Detailed Module* 20 58.9
Number of surveys 34
* ”Detailed modules” refers to modules with complementary questions on economicactivities and/or having a job and/or ask if the individual was absent from workduring reference period if he declared he did not work during the reference period.Source: MIMADEM Database, 53 surveys conducted in Cameroon, Mali and Sene-gal from 1976 to 2012. For more details, see Tables A4, A5 and A6 in Appendix.
38

Table 7: Reference periods used in surveys
Reference periods Number of surveys Frequency (%)
1 week 29 52.83
1 month 10 18.9
1 year 21 39.62
Currently 13 24.52
No reference period specified 23 43.40
Number of surveys 53
Note that a survey can use several reference periods.
Source: MIMADEM Database, 53 surveys conducted in Cameroon, Mali and Sene-
gal from 1976 to 2012. For more details, see Tables A4, A5 and A6 in Appendix.
Table 8: Within-survey comparison of employment rates produced by “Occupation” and “Work”questions by country, sex and living area
Cameroon Mali Senegal
CM EDM 2000 ML EMEP 2001 SN EDMC 1996
Urban Urban Rural Urban
Female Male Female Male Female Male Female Male
Employment rates at the macro level
Occupation (1) 34.9 54.8 30.6 60.7 41.3 90.5 38.2 65.8
Occupation + Work (2) 36.7 58.3 52.5 67.0 89.4 94.6 38.5 66.3
Difference (2) - (1) 1.8 3.5 21.9 6.3 48.1 4.1 0.3 0.5
Difference in % of (1) 5.4 6.6 71.5 10.4 116.5 4.5 0.0 0.0
Employment rates are calculated for the population aged 15-49 years.
For each survey the two following questions are asked :
1.“What is your current occupation, your situation regarding employment?” a.Work (Consider also working for own account or as an employee,
helping a family member, paid or unpaid apprentice) b.Look for a job c.Student d.Retired e.Annuitant f.Housewife g.Other inactive
2. During the last seven days did you however work, at least one hour, for an occasional or exceptional work? . Note that details in bracket about
what is to consider as work the first question is indicated in the second question in EDM’s labor module.
Source: CM EDM 2000,ML EMEP 2001, SN EDMC 1996. Authors’ calculation.
Note that CM EDM 2000 and SN EDMC 1996 are urban surveys, so we decompose by living area only for ML EMEP 2001.
39

Table 9: The effect of the wording on work status - A within-survey analysis by country - Linearprobability model results
Dependent variable : Cameroon Mali Senegal
Dummy=1 if employed (1) (2) (3) (4) (5) (6)
Work (Ref. Occupation) 0.027*** 0.035*** 0.234*** 0.062*** 0.004*** 0.005***
(0.002) (0.004) (0.004) (0.006) (0.001) (0.002)
Work* Female -0.017*** 0.149*** -0.003
(0.005) (0.010) (0.002)
Work * Rural -0.021***
(0.007)
Work* Female * Rural 0.292***
(0.013)
Female -0.202*** -0.193*** -0.288*** -0.345*** -0.292*** -0.290***
(0.012) (0.012) (0.006) (0.014) (0.014) (0.014)
Rural 0.089*** 0.113***
(0.008) (0.011)
Female * Rural -0.172***
(0.016)
25-34 (Ref. 15-24) 0.137*** 0.137*** 0.075*** 0.075*** 0.201*** 0.201***
(0.017) (0.017) (0.008) (0.008) (0.017) (0.017)
35-44 0.301*** 0.301*** 0.110*** 0.110*** 0.354*** 0.354***
(0.022) (0.022) (0.009) (0.009) (0.019) (0.019)
45 and more 0.344*** 0.344*** 0.100*** 0.100*** 0.435*** 0.435***
(0.030) (0.030) (0.013) (0.013) (0.029) (0.029)
Primary education (Ref. No education) 0.343*** 0.343*** -0.111*** -0.111*** -0.020 -0.020
(0.018) (0.018) (0.011) (0.011) (0.018) (0.018)
Secondary education 0.349*** 0.349*** -0.248*** -0.246*** -0.188*** -0.188***
(0.016) (0.016) (0.011) (0.011) (0.018) (0.018)
Tertiary education 0.372*** 0.372*** -0.127*** -0.122*** -0.272*** -0.272***
(0.029) (0.029) (0.038) (0.038) (0.033) (0.033)
Married polygamous (Ref. monogamous) -0.013 -0.013 -0.022*** -0.022***
(0.032) (0.032) (0.007) (0.007)
Single -0.031* -0.031* -0.045*** -0.046***
(0.016) (0.016) (0.008) (0.008)
Other 0.091*** 0.091*** 0.015 0.014
(0.035) (0.035) (0.020) (0.020)
Household size -0.013*** -0.013*** -0.000** -0.000**
(0.002) (0.002) (0.000) (0.000)
Constant 0.694*** 0.689*** 0.666*** 0.742*** 0.582*** 0.582***
(0.025) (0.025) (0.094) (0.093) (0.021) (0.021)
Observations 10,950 10,950 73,190 73,190 8,689 8,689
R-squared 0.315 0.315 0.304 0.351 0.206 0.206
Months of interview dummies Yes Yes Yes Yes Yes Yes
Departments dummies Yes Yes Yes Yes Yes Yes
The dependent variable is a dummy equal to 1 if the individual is employed. Observations have been expanded to estimate the effect of the
wording, i.e. the effect of a ”work question”, compared to the “occupation” question (the reference category).
The population considered is aged 15-49 years.
(1), (3), (5) estimate the model (1) without interaction effects and (2), (4), (6) the model (2) with interaction effects. All regressions are weighted.
Standard errors are clustered at the individual level. Significance levels : * 0.10 ** 0.05 *** 0.01
Source: CM EDM 2000, ML EMEP 2001, SN EDMC 1996
40

Table 10: Incidence of work during the last week (WLW) by occupational status and contribution to the gap in employment rates between “occupation”and “work” questions
Mali
Urban Rural
Female Male Female Male
Structure % WLW Contribution Structure % WLW Contribution Structure % WLW Contribution Structure % WLW Contribution
to the gap (%) to the gap (%) to the gap (%) to the gap (%)
(1) (2) (3) (1) (2) (3) (1) (2) (3) (1) (2) (3)
Employed 30.6 60.7 41.3 90.5
Look for a job 8.9 10.1 4.1 14.3 24.1 54.7 0.6 31.7 0.4 1.8 36.3 15.9
Student 13.1 10.1 6.0 21.5 8.6 29.3 1.6 48.7 1.6 5.2 35.8 45.3
Housewife 44.5 43.3 87.9 0.9 40.1 5.7 54.9 84.7 96.7 1.3 82.4 26.0
Other inactive 3.0 14.5 2.0 2.6 24.8 10.2 1.5 42.8 1.3 1.3 40.6 12.8
Total 100.0 100.0 100.0 100.0 100.0 100.0 100.0 100.0
Cameroon Senegal
Female Male Female Male
Structure % WLW Contribution Structure % WLW Contribution Structure % WLW Contribution Structure % WLW Contribution
to the gap (%) to the gap (%) to the gap (%) to the gap (%)
(1) (2) (3) (1) (2) (3) (1) (2) (3) (1) (2) (3)
Employed 34.9 54.8 38.2 65.8
Look for a job 15.9 3.1 0.4 17.0 14.8 72.2 7.0 1.1 29.8 15.8 3.0 88.7
Student 24.4 1.6 21.4 23.8 2.6 17.7 12.4 0.0 0.0 15.1 0.4 11.3
Housewife 17.9 3.5 34.4 0.0 0.0 0.0 41.7 0.2 32.3 1.6 0.0 0.0
Other inactive 6.9 4.5 17 4.6 7.7 10.2 0.6 16.3 37.9 1.7 0.0 0.0
Total 100.0 100.0 100.0 100.0 100.0 100.0 100.0 100.0
The population considered is aged 15-49 years.
“Other inactive” category is composed of retired, annuitants and other inactive individuals.
(1) represents the composition by occupational status of the population which is not currently occupied.
(2) represents the percentage of individuals who nevertheless worked during the past seven days by occupational status.
(3) represents the contribution to the difference in employment rates observed between the “occupation” and the work question.
Source: ML EMEP 2001, CM EDM 2000 and SN EDMC 1996. Authors’ calculation.
41

Table 11: Reasons for not searching a job in Cameroon and Senegal forthose who are not in the labor force
Cameroon Senegal
Female Male Female Male
Structure Structure Structure Structure
Did not look for a job (%)* 79.8 69.3 94.8 89.2
Reasons for not searching
No jobs available 4.8 3.4 2.6 6.7
Not qualified 10.8 5.4 2.7 8.9
Does not know how to search 5.3 3.3 0.9 1.8
Ill /disabled 3.9 2.5 1.1 2.8
Houseworks 18.0 0.1 35.6 1.0
Waiting for an answer 3.0 4.3 3.0 12.3
Do not want to work 1.1 1.9 34.4 8.0
Finish studies 46.1 75.7 21.8 58.9
Other 4.1 3.2
* ”Did not look for a job” represents the share of those who did not look for a job within the last 30 days
among those who defined themselves as not Employed (who declared another occupational status) and did
not work last week.
The population considered is the non employed population aged 15-49 years.
Source: CM EDM 2000 and SN EDMC 1996. Authors’ calculation.
42

Table 12: Within-survey comparison of employment rates produced by simplequestions and detailed labor modules by country, sex and living area
Cameroon Mali Senegal
Female Male Female Male Female Male
Urban Area
Work last week (1) 46.3 65.8 41.0 58.2 36.4 58.1
List of economic activities (2) - (1) 3.5 2.8 2.7 2.2 0.8 1.0
(2) in % of (1) 7.6 4.3 6.6 3.8 2.2 1.7
Has a job (3) - (2) 4.4 3.2 0.9 1.4 2.6 3.1
(3) in % of (1) 9.5 4.9 2.2 2.4 7.1 5.3
Detailed module (1)+(2)+(3) =(4) 54.2 72.0 44.6 61.9 39.8 62.1
Overall difference (4) - (1) 7.9 6.2 3.6 3.7 3.4 4.0
(4) in % of (1) 17.1 9.4 8.8 6.4 9.3 6.9
Rural Area
Work last week (1) 75.8 81.9 58.7 76.0 33.5 69.2
List of economic activities (2) - (1) 3.1 2.9 1.9 2.0 0.3 0.7
(2) in % of (1) 4.1 3.5 3.2 2.6 0.9 0.6
Has a job (3) - (2) 4.1 3.1 2.0 1.7 6.9 4.3
(3) in % of (1) 5.4 3.8 3.4 2.2 20.6 6.2
Detailed module (1)+(2)+(3) =(4) 83.0 87.9 62.6 79.7 40.7 74.3
Overall difference (4) - (1) 7.2 6 3.9 3.7 7.2 5.1
(4) in % of (1) 9.5 7.3 6.6 4.9 21.5 8.2
Number of surveys 3 3 4 4 1 1
Employment rates are calculated for the population aged 15-49 years .
Source: MIMADEM. Authors’ calculation.
10 nationally representative surveys, we exclude only urban surveys and surveys that interview only women: CM
ECAM3 2007, CM EESI 2005 , CM EESI 2010 , ML ELIM 2006 , ML EPAM 2004, ML EPAM 2007, ML EPAM 2010,
SN ENTE 2005
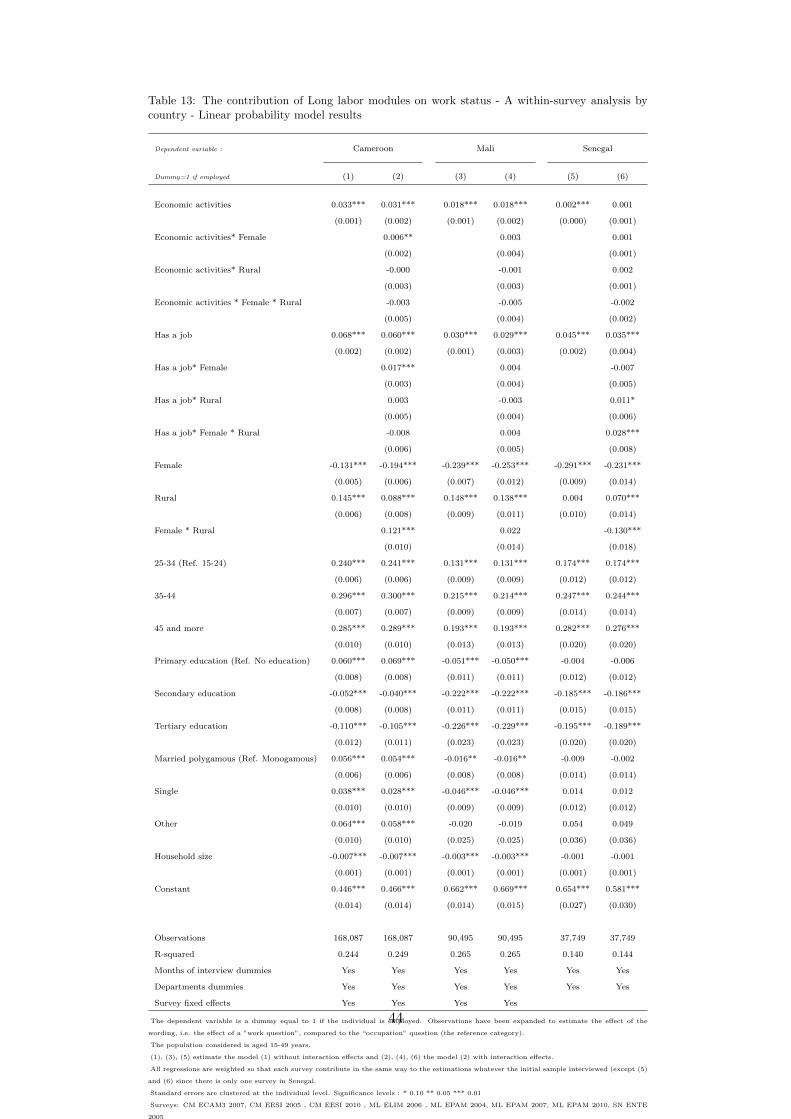
Table 13: The contribution of Long labor modules on work status - A within-survey analysis bycountry - Linear probability model results
Dependent variable : Cameroon Mali Senegal
Dummy=1 if employed (1) (2) (3) (4) (5) (6)
Economic activities 0.033*** 0.031*** 0.018*** 0.018*** 0.002*** 0.001
(0.001) (0.002) (0.001) (0.002) (0.000) (0.001)
Economic activities* Female 0.006** 0.003 0.001
(0.002) (0.004) (0.001)
Economic activities* Rural -0.000 -0.001 0.002
(0.003) (0.003) (0.001)
Economic activities * Female * Rural -0.003 -0.005 -0.002
(0.005) (0.004) (0.002)
Has a job 0.068*** 0.060*** 0.030*** 0.029*** 0.045*** 0.035***
(0.002) (0.002) (0.001) (0.003) (0.002) (0.004)
Has a job* Female 0.017*** 0.004 -0.007
(0.003) (0.004) (0.005)
Has a job* Rural 0.003 -0.003 0.011*
(0.005) (0.004) (0.006)
Has a job* Female * Rural -0.008 0.004 0.028***
(0.006) (0.005) (0.008)
Female -0.131*** -0.194*** -0.239*** -0.253*** -0.291*** -0.231***
(0.005) (0.006) (0.007) (0.012) (0.009) (0.014)
Rural 0.145*** 0.088*** 0.148*** 0.138*** 0.004 0.070***
(0.006) (0.008) (0.009) (0.011) (0.010) (0.014)
Female * Rural 0.121*** 0.022 -0.130***
(0.010) (0.014) (0.018)
25-34 (Ref. 15-24) 0.240*** 0.241*** 0.131*** 0.131*** 0.174*** 0.174***
(0.006) (0.006) (0.009) (0.009) (0.012) (0.012)
35-44 0.296*** 0.300*** 0.215*** 0.214*** 0.247*** 0.244***
(0.007) (0.007) (0.009) (0.009) (0.014) (0.014)
45 and more 0.285*** 0.289*** 0.193*** 0.193*** 0.282*** 0.276***
(0.010) (0.010) (0.013) (0.013) (0.020) (0.020)
Primary education (Ref. No education) 0.060*** 0.069*** -0.051*** -0.050*** -0.004 -0.006
(0.008) (0.008) (0.011) (0.011) (0.012) (0.012)
Secondary education -0.052*** -0.040*** -0.222*** -0.222*** -0.185*** -0.186***
(0.008) (0.008) (0.011) (0.011) (0.015) (0.015)
Tertiary education -0.110*** -0.105*** -0.226*** -0.229*** -0.195*** -0.189***
(0.012) (0.011) (0.023) (0.023) (0.020) (0.020)
Married polygamous (Ref. Monogamous) 0.056*** 0.054*** -0.016** -0.016** -0.009 -0.002
(0.006) (0.006) (0.008) (0.008) (0.014) (0.014)
Single 0.038*** 0.028*** -0.046*** -0.046*** 0.014 0.012
(0.010) (0.010) (0.009) (0.009) (0.012) (0.012)
Other 0.064*** 0.058*** -0.020 -0.019 0.054 0.049
(0.010) (0.010) (0.025) (0.025) (0.036) (0.036)
Household size -0.007*** -0.007*** -0.003*** -0.003*** -0.001 -0.001
(0.001) (0.001) (0.001) (0.001) (0.001) (0.001)
Constant 0.446*** 0.466*** 0.662*** 0.669*** 0.654*** 0.581***
(0.014) (0.014) (0.014) (0.015) (0.027) (0.030)
Observations 168,087 168,087 90,495 90,495 37,749 37,749
R-squared 0.244 0.249 0.265 0.265 0.140 0.144
Months of interview dummies Yes Yes Yes Yes Yes Yes
Departments dummies Yes Yes Yes Yes Yes Yes
Survey fixed effects Yes Yes Yes Yes
The dependent variable is a dummy equal to 1 if the individual is employed. Observations have been expanded to estimate the effect of the
wording, i.e. the effect of a ”work question”, compared to the “occupation” question (the reference category).
The population considered is aged 15-49 years.
(1), (3), (5) estimate the model (1) without interaction effects and (2), (4), (6) the model (2) with interaction effects.
All regressions are weighted so that each survey contribute in the same way to the estimations whatever the initial sample interviewed (except (5)
and (6) since there is only one survey in Senegal.
Standard errors are clustered at the individual level. Significance levels : * 0.10 ** 0.05 *** 0.01
Surveys: CM ECAM3 2007, CM EESI 2005 , CM EESI 2010 , ML ELIM 2006 , ML EPAM 2004, ML EPAM 2007, ML EPAM 2010, SN ENTE
2005
44

Table 14: Economic activities performed despite not working during last week in Cameroon and Mali
Cameroon Mali
Urbain Rural Urbain Rural
Female Male Female Male Female Male Female Male
Work in a personal business 14.8 8.4 5.8 7.4 17.0 29.1 12.5 27.9
Make a product for sale 7.5 2.2 2.9 0.6 30.8 11.7 29.2 5.2
Do something at home for pay 4.9 0.7 1.0 0.1 28.3 15.1 16.0 4.4
Render a service for money or a benefit in kind 4.2 10.7 0.4 3.7 3.3 7.1 1.1 4.7
Help in the family business 39.9 29.0 69.2 66.1 6.1 1.7 21.6 33.0
Apprenticeship with/without pay 23.0 32.2 15.5 13.2 1.0 8.9 1.7 2.5
As a working student 0.1 5.1 1.7 1.2 0.0 4.6 1.1 1.1
Working for another family 2.5 5.0 1.1 2.9 4.0 0.0 2.0 7.9
Any other paid activity 3.0 6.8 2.5 4.9 9.4 21.8 14.8 13.4
Total 100.0 100.0 100.0 100.0 100.0 100.0 100.0 100.
The population considered is the non employed population during the past week aged 15-49 years.
We don’t have the repartition by activities for CM ECAM3 2007, we only know is the respondent perform one activity but we don’t know which one
Source: CM EESI 2005 CM EESI 2010 , ML ELIM 2006, ML EPAM 2004, ML EPAM 2007, ML EPAM 2010
Table 15: Economic activities performed despite not working during last week in Senegal
Urban Rural
Female Male Female Male
Cultivate or harvest agricultural products, fish,etc. 0.0 38.1 64.6 92.6
Prepare food, clothes or handicraft for selling 31.5 0.0 26.0 0.0
Sell products, newspapers,food or agricultural products 49.1 0.0 0.0 0.0
Wash, iron,clean, repair tools or equipments for other with pay in kind or in cash 9.7 0.0 0.0 0.0
Wash cars, polish shoes 0.0 0.0 0.0 0.0
Take care of domestic animals 0.0 45.4 0.0 7.4
Transport goods to market or other related activities 0.0 0.0 0.0 0.0
Construction and maintenance of buildings, house, cars 0.0 0.0 0.0 0.0
Other similar activity 9.7 16.5 9.4 0.0
Total 100.0 100.0 100.0 100.0
The population considered is the non employed population during the past week aged 15-49 years.
Results for Senegal are presented apart from those for Cameroon and Mali because the questionnaire differs in the list of activities
Source: SN ENTE 2005
45

Table 16: Within-survey comparison of employment rates produced bylong and short reference periods by country, sex and living area
Cameroon Mali Senegal
Female Male Female Male Female Male
Urban Area
Short reference period (1) 48.0 64.2 49.3 69.7 41.3 65.2
Long reference period (2) 54.2 71.6 52.0 74.9 47.3 72.8
Difference (2) - (1) 6.3 7.4 2.7 5.2 6.0 7.6
Difference in % of (1) 13.1 11.5 5.5 7.5 14.5 11.7
Rural Area
Short reference period 74.7 80.8 59.2 81.0 33.8 72.6
Long reference period 79.0 86.5 62.3 90.0 51.7 88.2
Difference (2) - (1) 4.2 5.7 3.2 9.0 17.9 15.5
Difference in % of (1) 5.6 7.1 5.4 11.1 53.0 21.3
Number of surveys 5 5 5 5 3 3
Short reference period refers to “1 week” or “Currently” reference period and Long reference period refers
to “1 year” reference period.
Employment rates are calculated for the population aged 15-49 years .
Source: MIMADEM. Authors’ calculation.
Surveys : CM ECAM1 1996 , CM ECAM3 2007 , CM EDS 1998 , CM EDS 2004 , CM EDS 2011 ,ML EDS
1995 , ML EDS 2001 , ML EDS 2006 , ML EDS 2012 , ML ELIM 2006 , SN EDS 2005 , SN EDS 2010 , SN
ENTE 2005
46

Table 17: The effect of a long reference period - A within-survey analysis by country - Linear probabilitymodel results
Dependent variable : Cameroon Mali Senegal
Dummy=1 if employed (1) (2) (3) (4) (5) (6)
Long reference period (Ref. Short reference period) 0.060*** 0.076*** 0.029*** 0.024*** 0.097*** 0.068***
(0.001) (0.003) (0.001) (0.003) (0.002) (0.005)
Long reference period * Female -0.003 -0.006* -0.006
(0.004) (0.004) (0.006)
Long reference period * Rural -0.026*** 0.033*** 0.072***
(0.004) (0.005) (0.008)
Long reference period * Female * Rural -0.002 -0.028*** -0.010
(0.005) (0.005) (0.010)
Female -0.119*** -0.189*** -0.293*** -0.305*** -0.340*** -0.277***
(0.004) (0.007) (0.006) (0.009) (0.007) (0.011)
Rural 0.130*** 0.069*** 0.054*** 0.022** 0.016*** 0.050***
(0.005) (0.006) (0.006) (0.008) (0.006) (0.011)
Female* Rural 0.133*** 0.040*** -0.121***
(0.008) (0.010) (0.013)
25-34 0.177*** 0.178*** 0.107*** 0.107*** 0.181*** 0.179***
(0.005) (0.005) (0.006) (0.006) (0.008) (0.008)
35-44 0.227*** 0.228*** 0.135*** 0.134*** 0.263*** 0.261***
(0.005) (0.005) (0.007) (0.007) (0.009) (0.009)
45 and more 0.232*** 0.232*** 0.140*** 0.139*** 0.284*** 0.278***
(0.007) (0.006) (0.009) (0.009) (0.011) (0.011)
Primary education 0.098*** 0.105*** 0.000 0.001 0.062*** 0.057***
(0.005) (0.005) (0.007) (0.007) (0.008) (0.008)
Secondary education 0.046*** 0.053*** -0.082*** -0.083*** -0.038*** -0.039***
(0.006) (0.006) (0.008) (0.008) (0.010) (0.010)
Tertiary education 0.025** 0.021** -0.067*** -0.071*** -0.064*** -0.059***
(0.010) (0.010) (0.021) (0.021) (0.016) (0.016)
Married polygamous 0.028*** 0.029*** 0.124*** 0.125*** 0.024 0.019
(0.006) (0.006) (0.010) (0.010) (0.023) (0.023)
Single 0.005 0.007 0.092*** 0.092*** -0.050*** -0.050***
(0.006) (0.006) (0.011) (0.011) (0.013) (0.013)
Other 0.056*** 0.057*** 0.166*** 0.168*** 0.110** 0.100**
(0.011) (0.011) (0.029) (0.029) (0.045) (0.044)
Household size -0.005*** -0.005*** 0.002*** 0.002*** -0.001 -0.000
(0.000) (0.000) (0.000) (0.000) (0.000) (0.000)
Constant 0.112*** 0.096*** 0.699*** 0.713*** 0.541*** 0.530***
(0.027) (0.027) (0.011) (0.012) (0.017) (0.018)
Observations 95,926 95,926 123,032 123,032 60,614 60,614
R-squared 0.185 0.192 0.164 0.164 0.253 0.258
Months of interview dummies Yes Yes Yes Yes Yes Yes
Departments dummies Yes Yes Yes Yes Yes Yes
Survey fixed effects Yes Yes Yes Yes Yes Yes
The dependent variable is a dummy equal to 1 if the individual is employed. Observations have been expanded to estimate the effect of the wording, i.e. the
effect of a ”work question”, compared to the “occupation” question (the reference category).
The population considered is aged 15-49 years.
(1), (3), (5) estimate the model (1) without interaction effects and (2), (4), (6) the model (2) with interaction effects.
All regressions are weighted so that each survey contribute in the same way to the estimations whatever the initial sample interviewed.
Standard errors are clustered at the individual level. Significance levels : * 0.10 ** 0.05 *** 0.01
Surveys : CM ECAM1 1996 , CM ECAM3 2007 , CM EDS 1998 , CM EDS 2004 , CM EDS 2011 ,ML EDS 1995 , ML EDS 2001 , ML EDS 2006 , ML EDS
2012 , ML ELIM 2006 , SN EDS 2005 , SN EDS 2010 , SN ENTE 2005
47

Table 18: All year, seasonal or occasional economic activity by country and percentage of those who worked during last year butnot during last week (YNW)(15-49 years old)
Cameroon Mali Senegal
Female Male Female Male Female Male
Structure %YNW Structure %YNW Structure %YNW Structure %YNW Structure %YNW Structure %YNW
Urban Area
All year 62.1 3.7 67.5 2.2 67.0 2.9 76.0 3.5 69.8 4.1 73.8 2.0
Seasonal 17.2 18.5 12.3 38.1 16.3 5.9 17.0 20.0 15.1 20.5 15.6 40.1
Occasional 20.8 17.1 20.2 22.5 16.6 9.4 6.9 28.2 15.1 20.7 10.6 28.0
Total 100.0 100.0 100.0 100.0 100.0 100.0
Rural Area
All year 42.7 1.9 58.7 2.0 30.6 3.1 39.1 1.5 38.3 6.3 47.0 1.1
Seasonal 40.8 6.3 30.9 15.7 57.7 3.9 57.9 12.5 51.2 34.6 46.0 21.8
Occasional 16.5 9.9 10.3 20.7 11.7 5.9 3.0 11.4 10.5 15.8 7.1 16.0
Total 100.0 100.0 100.0 100.0 100.0 100.0
Source: CM EDS 1998, CM EDS 2004, CM EDS 2011,ML EDS 1995, ML EDS 2001, ML EDS 2006, ML EDS 2012, SN EDS 2005, SN EDS 2010
48

Figure 4: Employment rates by month of interview in Cameroon
.5.6
.7.8
.9E
mpl
oym
ent r
ate
Janu
ary
Febru
ary
Mar
chApr
ilM
ayJu
ne July
Augus
t
Septe
mbe
r
Month of interview
Female - weekly activity Male - weekly activityFemale - yearly activity Male - yearly activity
Figure 5: Employment rates by month of interview in Mali
.4.5
.6.7
.8.9
Em
ploy
men
t rat
e
Janu
ary
Febru
ary
Mar
chApr
ilM
ayJu
ne July
Augus
t
Septe
mbe
r
Octobe
r
Novem
ber
Decem
ber
Month of interview
Female - weekly activity Male - weekly activityFemale - yearly activity Male - yearly activity
49

Figure 6: Employment rates by month of interview in Senegal
.2.4
.6.8
1E
mpl
oym
ent r
ate
Janu
ary
Febru
ary
Mar
chApr
ilM
ayJu
ne July
Augus
t
Septe
mbe
r
Octobe
r
Novem
ber
Decem
ber
Month of interview
Female - weekly activity Male - weekly activityFemale - yearly activity Male - yearly activity
50

Table 19: Summary of the effects of questionnaire characteristicson employment rates - Within-surveys results
Average effect (in ppts) Cameroon Mali Senegal
Wording (Work vs Occupation) 2.7*** 23.4*** 0.4***
(urban) (urban)
Long labor module
Economic activities 3.3*** 1.8*** 0.2***
+ Has a job (whole module) 6.8*** 3.0*** 4.5***
Reference period (Long vs Short) 6.0*** 2.9*** 9.7***
Source: Authors’ calculation.
Table 20: Summary of the differences in sensitivity across gender and living area - Within-surveys results
Women + Urban sensitivity Female + Rural sensitivity
Compared to urban men Compared to rural men
Cameroon Mali Senegal Cameroon Mali Senegal
Wording (Work vs Occupation) Less More Equal - More -
Long labor module
Economic activities More (small) Equal Equal Equal Equal Equal
+ Has a job (whole module) More Equal Equal Equal Equal More
Reference period (Long vs Short) Equal Less (small) Equal Equal Less Equal
Source: Authors’ calculation.
51

Appendices
Table A1: Surveys characteristics in Cameroon
Year Survey Acronym Survey Sample sizeCountry (C) /
Urban (U)Field work period
1976 RGPH General Census of Population and Housing 7 385 858 C 04/1976
1983 EBC Budget Consumption Survey 31 047 C 09/1983-09/1984
1987 RGPH General Census of Population and Housing 8 883 609 C 04/1987
1991 DHS Demographic and Health Survey 4 685 C 03/1991-10/1991
1993 E123 1 2 3 Survey 11 172 U 01/1993-02-1993 (phase1)
1994 E123 1 2 3 Survey 12 235 U
1996 ECAM1 Cameroon Household Survey 10 325 C 02/1996-04/1996
1998 DHS Demographic and Health Survey 8 063 C 01/1998-07/1998
2000 EDM Yaounde and Douala Household Expenditure Survey 6 210 U 10/2000-12/2000
2000 MICS Multiple Indicator Cluster Survey 5 069* C 07/2000-08/2000
2001 ECAM2 Cameroon Household Survey 56 443 C 09-2001-12/2001
2002 CAVIE Yaounde and Douala Living Conditions survey 68 446 U 10/2002-12/2002
2004 DHS Demographic and Health Survey 15 936 C 02/2004-08/2004
2005 EESI Survey on Employment and Informal Sector 38 599 C 05/2005-07/2005
2006 MICS Multiple Indicator Cluster Survey 9 408* C 05/2006-06/2006
2007 ECAM3 Cameroon Household Survey 51 836 C 09/2007-12/2007
2010 EESI Survey on Employment and Informal Sector 13 002 C 05/2010-07/2010
2011 DHS Demographic and Health Survey 22 617 C 01/2011-08/2011
* Employment data are only available for women.Source: MIMADEM Database, 17 surveys in Cameroon
52
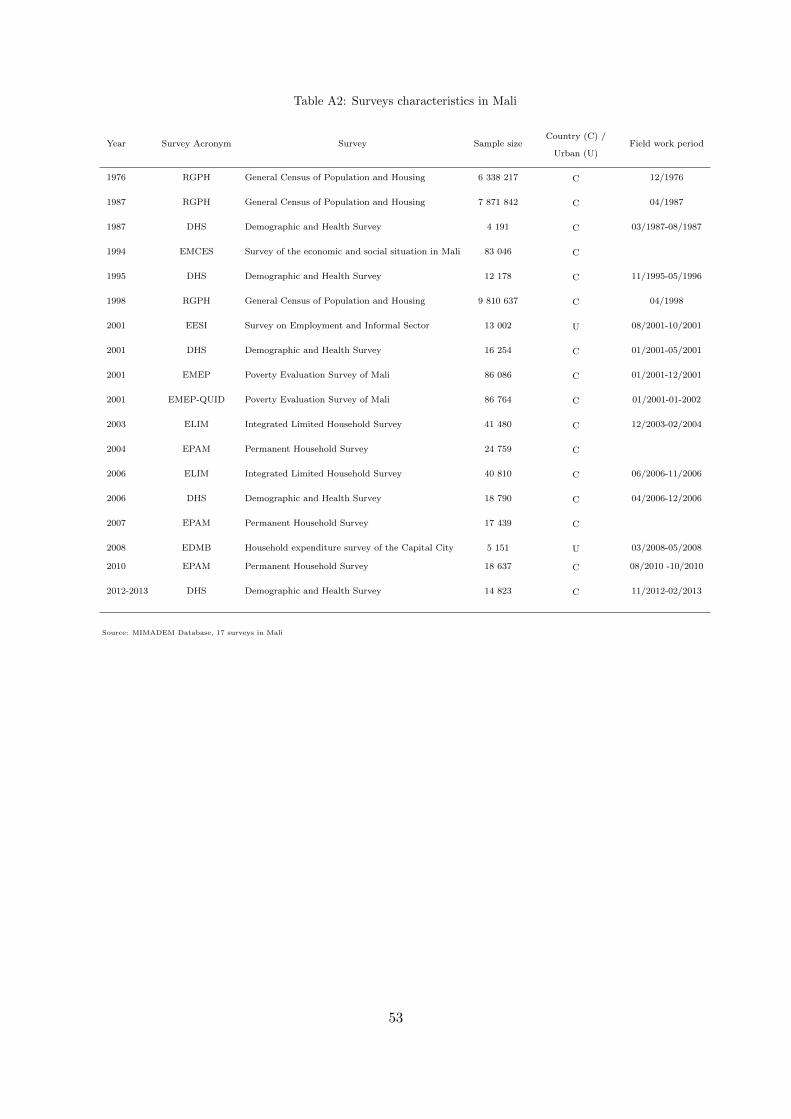
Table A2: Surveys characteristics in Mali
Year Survey Acronym Survey Sample sizeCountry (C) /
Urban (U)Field work period
1976 RGPH General Census of Population and Housing 6 338 217 C 12/1976
1987 RGPH General Census of Population and Housing 7 871 842 C 04/1987
1987 DHS Demographic and Health Survey 4 191 C 03/1987-08/1987
1994 EMCES Survey of the economic and social situation in Mali 83 046 C
1995 DHS Demographic and Health Survey 12 178 C 11/1995-05/1996
1998 RGPH General Census of Population and Housing 9 810 637 C 04/1998
2001 EESI Survey on Employment and Informal Sector 13 002 U 08/2001-10/2001
2001 DHS Demographic and Health Survey 16 254 C 01/2001-05/2001
2001 EMEP Poverty Evaluation Survey of Mali 86 086 C 01/2001-12/2001
2001 EMEP-QUID Poverty Evaluation Survey of Mali 86 764 C 01/2001-01-2002
2003 ELIM Integrated Limited Household Survey 41 480 C 12/2003-02/2004
2004 EPAM Permanent Household Survey 24 759 C
2006 ELIM Integrated Limited Household Survey 40 810 C 06/2006-11/2006
2006 DHS Demographic and Health Survey 18 790 C 04/2006-12/2006
2007 EPAM Permanent Household Survey 17 439 C
2008 EDMB Household expenditure survey of the Capital City 5 151 U 03/2008-05/2008
2010 EPAM Permanent Household Survey 18 637 C 08/2010 -10/2010
2012-2013 DHS Demographic and Health Survey 14 823 C 11/2012-02/2013
Source: MIMADEM Database, 17 surveys in Mali
53
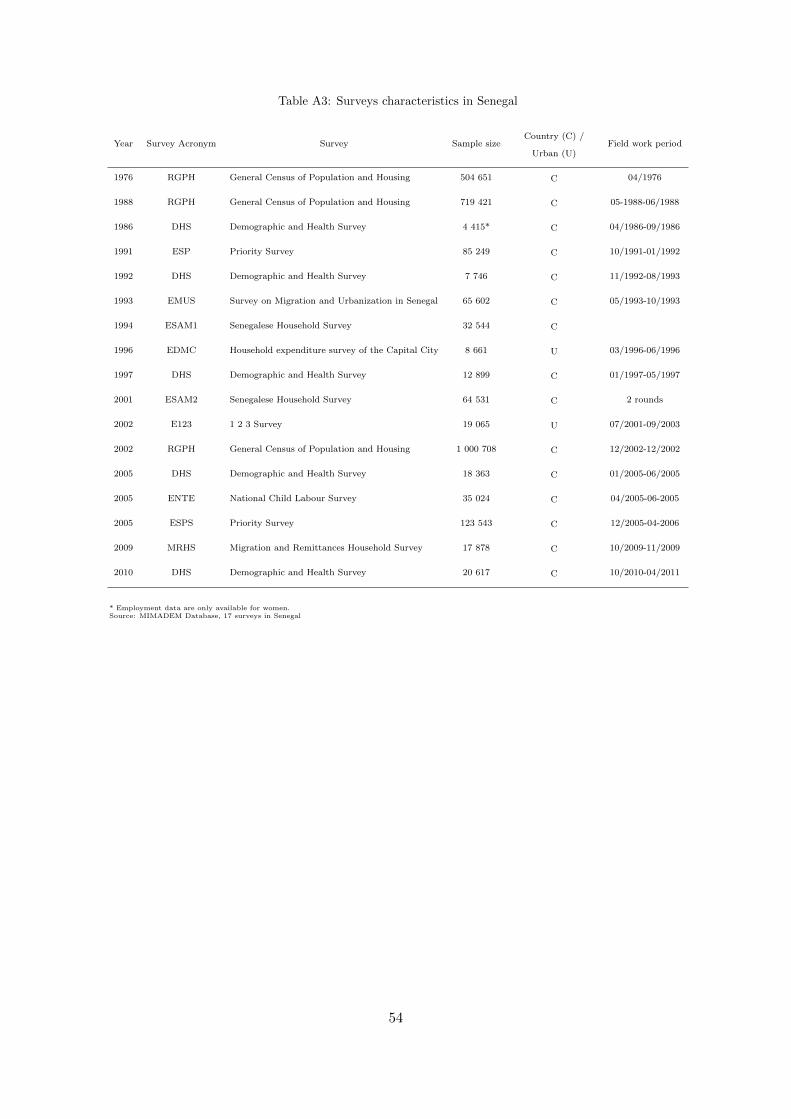
Table A3: Surveys characteristics in Senegal
Year Survey Acronym Survey Sample sizeCountry (C) /
Urban (U)Field work period
1976 RGPH General Census of Population and Housing 504 651 C 04/1976
1988 RGPH General Census of Population and Housing 719 421 C 05-1988-06/1988
1986 DHS Demographic and Health Survey 4 415* C 04/1986-09/1986
1991 ESP Priority Survey 85 249 C 10/1991-01/1992
1992 DHS Demographic and Health Survey 7 746 C 11/1992-08/1993
1993 EMUS Survey on Migration and Urbanization in Senegal 65 602 C 05/1993-10/1993
1994 ESAM1 Senegalese Household Survey 32 544 C
1996 EDMC Household expenditure survey of the Capital City 8 661 U 03/1996-06/1996
1997 DHS Demographic and Health Survey 12 899 C 01/1997-05/1997
2001 ESAM2 Senegalese Household Survey 64 531 C 2 rounds
2002 E123 1 2 3 Survey 19 065 U 07/2001-09/2003
2002 RGPH General Census of Population and Housing 1 000 708 C 12/2002-12/2002
2005 DHS Demographic and Health Survey 18 363 C 01/2005-06/2005
2005 ENTE National Child Labour Survey 35 024 C 04/2005-06-2005
2005 ESPS Priority Survey 123 543 C 12/2005-04-2006
2009 MRHS Migration and Remittances Household Survey 17 878 C 10/2009-11/2009
2010 DHS Demographic and Health Survey 20 617 C 10/2010-04/2011
* Employment data are only available for women.Source: MIMADEM Database, 17 surveys in Senegal
54

Table A4: Questionnaire Characteristics of surveys in Cameroon
Year Survey AcronymWording∗ : W=Work,
O=Occupation
Type of Labor
Module∗∗: L=Long,
S=Short
Reference periods∗∗∗
C=Currently,
W=Week, M=Month,
Y=Year, N= No
reference period
1976 RGPH O S W
1983 EBC O S W
1987 RGPH O S W
1991 DHS W S C2a,N2b
1993 E123 W L: d W, N
1994 E123 W L: d W, N
1996 ECAM1 W L: d, r W,Y
1998 DHS W L: r C,Y
2000 EDM O,W L: w, r C,W
2000 MICS O L : o N
2001 ECAM2 W L: d, r M,Y
2002 CAVIE W S Y
2004 DHS W L: r C,Y
2005 EESI W L: d W,N
2006 MICS 0 L : o N
2007 ECAM3 W L: d, r W,M,Y
2010 EESI W L: d W,M,N
2011 DHS W L: d, r W,Y,N
* Work questions (W) refer to yes/no questions about work or economic activity (e.g. “Did you work last week?”). Occupationquestions (O) are questions which expect occupational status as answers (e.g. “What is your main occupation?” or ”Whatis your type of activity?”, those questions implying responses such as ”in employment, unemployed, retired, pupil or student,housewife, etc.” ).** Short labor modules have only one question to determine labor force status of respondents.Long labor modules contain aseries of additional questions aiming at identifying active individuals. d=modules with questions (i) on whether the individualworked during the past week (ii) on a list of economic activities and (iii) on reasons from being absent from work or questionson having a job despite not working during the reference week ; w= labor module with at least one question on occupation andone question on work; r=labor module with at least two questions with two different reference periods ; o=other type of labormodule*** Reference period design the period over which employment is measured.1a for the non agricultural sector, 1b for the agricultural sector2a for women and 2b for menSource: MIMADEM Database, 17 surveys in Cameroon
55

Table A5: Questionnaire Characteristics of surveys in Mali
Year Survey AcronymWording∗ : W=Work,
O=Occupation
Type of Labor
Module∗∗: L=Long,
S=Short
Reference periods∗∗∗
C=Currently,
W=Week, M=Month,
Y=Year, N= No
reference period
1976 RGPH O S Y
1987 RGPH O S M1a ,Y1b
1987 DHS W a S N
1994 EMCES O L: w, r C,W,Y
1995 DHS W L: r C,Y
1998 RGPH O S M1a,Y1b
2001 EESI W L: d W,N
2001 DHS W L: r C,Y
2001 EMEP O L: w C,W
2001 EMEP-QUID W L: d C,N
2003 ELIM W L: d W
2004 EPAM W L: d, r W,M,N
2006 ELIM W L: d W,N,Y
2006 DHS W L: r C,Y
2007 EPAM W L: d, r M,W,N
2008 EDMB W L: d, r M,W,N
2010 EPAM W L: d, r M,W,N
2012-2013 DHS W L: d, r W,N,Y
a : The question asks about work out of field and not work in general.* Work questions (W) refer to yes/no questions about work or economic activity (e.g. “Did you work last week?”). Occupationquestions (O) are questions which expect occupational status as answers (e.g. “What is your main occupation?” or ”What is your typeof activity?”, those questions implying responses such as ”in employment, unemployed, retired, pupil or student, housewife, etc.” ).** Short labor modules have only one question to determine labor force status of respondents.Long labor modules contain a series ofadditional questions aiming at identifying active individuals. d=modules with questions (i) on whether the individual worked duringthe past week (ii) on a list of economic activities and (iii) on reasons from being absent from work or questions on having a job despitenot working during the reference week ; w= labor module with at least one question on occupation and one question on work; r=labormodule with at least two questions with two different reference periods ; o=other type of labor module*** Reference period design the period over which employment is measured.1a for the non agricultural sector, 1b for the agricultural sector2a for women and 2b for menSource: MIMADEM Database, 17 surveys in Mali
56

Table A6: Questionnaire Characteristics of surveys in Senegal
Year Survey AcronymWording∗ : W=Work,
O=Occupation
Type of Labor
Module∗∗: L=Long,
S=Short
Reference periods∗∗∗
C=Currently,
W=Week, M=Month,
Y=Year, N= No
reference period
1976 RGPH O S Y3
1988 RGPH O S Y
1986 DHS Wa S C
1991 ESP W L: w1, r W,Y
1992 DHS W S C2a, Y2b
1993 EMUS O S N
1994 ESAM1 W S Y
1996 EDMC O L: w, r C,W
1997 DHS O S N
2001 ESAM2 W,O L: w, r W,Y
2002 E123 W L: d W,Y,N
2002 RGPH O S Y
2005 DHS W L: r C,Y
2005 ENTE W L: d, r W,Y
2005 ESPS W S W
2009 MRHS O S C
2010 DHS W L: d, r W,Y,N
a : The question asks about work out of field and not work in general.* Work questions (W) refer to yes/no questions about work or economic activity (e.g. “Did you work last week?”). Occupationquestions (O) are questions which expect occupational status as answers (e.g. “What is your main occupation?” or ”Whatis your type of activity?”, those questions implying responses such as ”in employment, unemployed, retired, pupil or student,housewife, etc.” ).** Short labor modules have only one question to determine labor force status of respondents.Long labor modules contain aseries of additional questions aiming at identifying active individuals. d=modules with questions (i) on whether the individualworked during the past week (ii) on a list of economic activities and (iii) on reasons from being absent from work or questionson having a job despite not working during the reference week ; w= labor module with at least one question on occupation andone question on work; r=labor module with at least two questions with two different reference periods ; o=other type of labormodule*** Reference period design the period over which employment is measured.1a for the non agricultural sector, 1b for the agricultural sector2a for women and 2b for menSource: MIMADEM Database, 17 surveys in Senegal
57
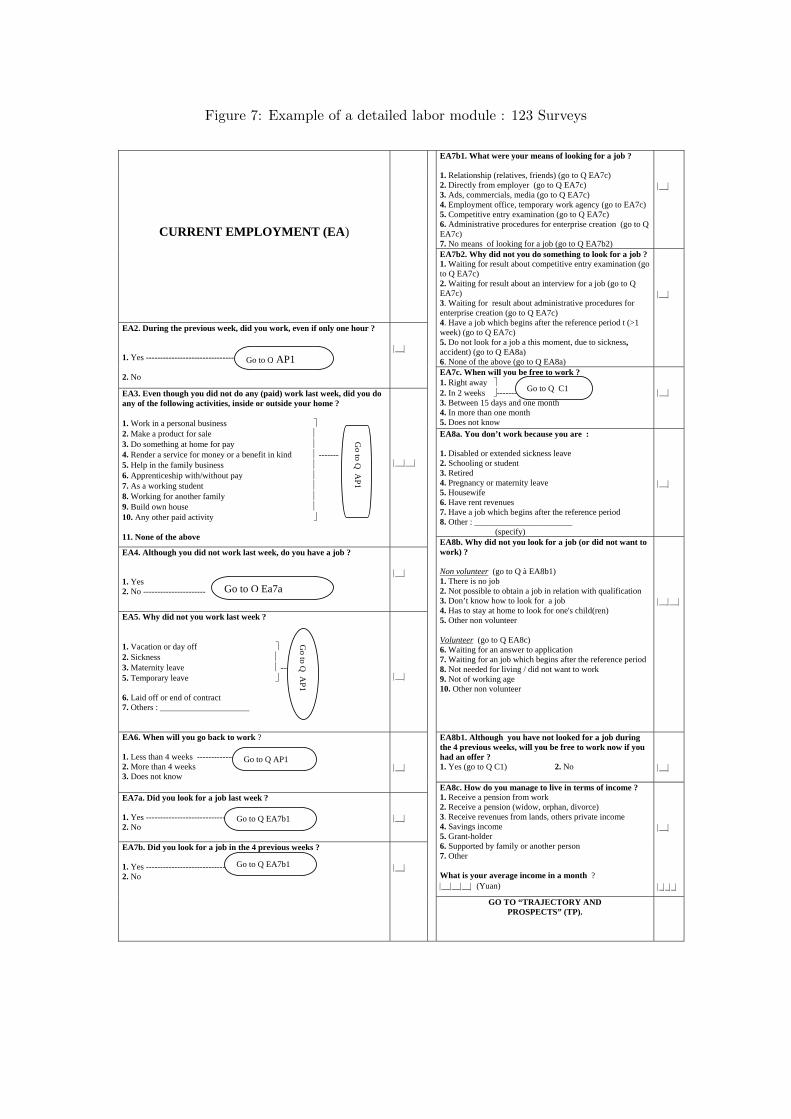
CURRENT EMPLOYMENT (EA)
EA7b1. What were your means of looking for a job ? 1. Relationship (relatives, friends) (go to Q EA7c) 2. Directly from employer (go to Q EA7c) 3. Ads, commercials, media (go to Q EA7c) 4. Employment office, temporary work agency (go to EA7c) 5. Competitive entry examination (go to Q EA7c) 6. Administrative procedures for enterprise creation (go to Q EA7c) 7. No means of looking for a job (go to Q EA7b2)
__
EA7b2. Why did not you do something to look for a job ? 1. Waiting for result about competitive entry examination (go to Q EA7c) 2. Waiting for result about an interview for a job (go to Q EA7c) 3. Waiting for result about administrative procedures for enterprise creation (go to Q EA7c) 4. Have a job which begins after the reference period t (>1 week) (go to Q EA7c) 5. Do not look for a job a this moment, due to sickness, accident) (go to Q EA8a) 6. None of the above (go to Q EA8a)
__
EA2. During the previous week, did you work, even if only one hour ? 1. Yes -------------------------------- 2. No
__
EA7c. When will you be free to work ? 1. Right away 2. In 2 weeks ------- 3. Between 15 days and one month 4. In more than one month 5. Does not know
__ EA3. Even though you did not do any (paid) work last week, did you do
any of the following activities, inside or outside your home ? 1. Work in a personal business 2. Make a product for sale 3. Do something at home for pay 4. Render a service for money or a benefit in kind ------- 5. Help in the family business 6. Apprenticeship with/without pay 7. As a working student 8. Working for another family 9. Build own house 10. Any other paid activity 11. None of the above
____
EA8a. You don’t work because you are : 1. Disabled or extended sickness leave 2. Schooling or student 3. Retired 4. Pregnancy or maternity leave 5. Housewife 6. Have rent revenues 7. Have a job which begins after the reference period 8. Other : _______________________ (specify)
__
EA8b. Why did not you look for a job (or did not want to work) ? Non volunteer (go to Q à EA8b1) 1. There is no job 2. Not possible to obtain a job in relation with qualification 3. Don’t know how to look for a job 4. Has to stay at home to look for one's child(ren) 5. Other non volunteer Volunteer (go to Q EA8c) 6. Waiting for an answer to application 7. Waiting for an job which begins after the reference period 8. Not needed for living / did not want to work 9. Not of working age 10. Other non volunteer
____
EA4. Although you did not work last week, do you have a job ? 1. Yes 2. No ----------------------
__
EA5. Why did not you work last week ? 1. Vacation or day off 2. Sickness 3. Maternity leave ---- 5. Temporary leave 6. Laid off or end of contract 7. Others : _____________________
__
EA6. When will you go back to work ? 1. Less than 4 weeks --------------- 2. More than 4 weeks 3. Does not know
__
EA8b1. Although you have not looked for a job during the 4 previous weeks, will you be free to work now if you had an offer ? 1. Yes (go to Q C1) 2. No
__
EA8c. How do you manage to live in terms of income ? 1. Receive a pension from work 2. Receive a pension (widow, orphan, divorce) 3. Receive revenues from lands, others private income 4. Savings income 5. Grant-holder 6. Supported by family or another person 7. Other What is your average income in a month ? ______ (Yuan)
__ ___
EA7a. Did you look for a job last week ? 1. Yes ----------------------------- 2. No
__
EA7b. Did you look for a job in the 4 previous weeks ? 1. Yes ---------------------------- 2. No
__
GO TO “TRAJECTORY AND PROSPECTS” (TP).
Go to Q AP1
Go to Q
AP
1
Go to Q C1
Go to Q Ea7a
Go to Q
AP
1
Go to Q AP1
Go to Q EA7b1
Go to Q EA7b1
Figure 7: Example of a detailed labor module : 123 Surveys