Metals Mines and Geology Industrial Minerals Oil...
158
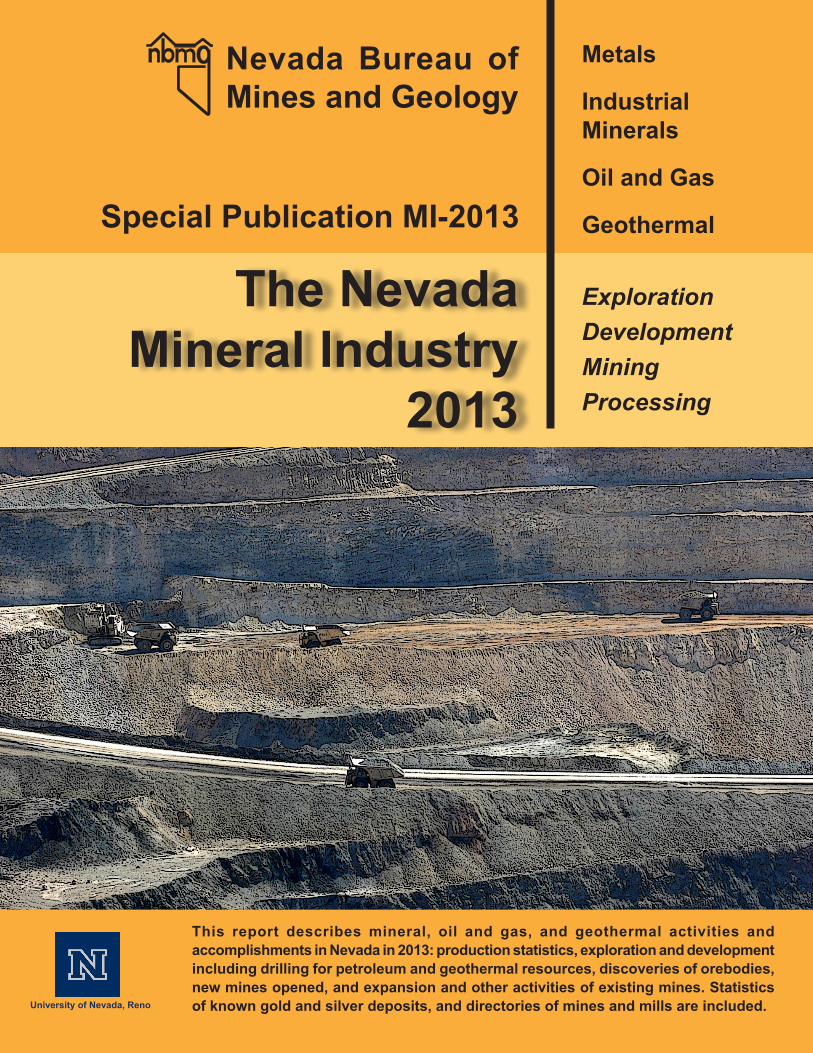
This report describes mineral, oil and gas, and geothermal activities and accomplishments in Nevada in 2013: production statistics, exploration and development including drilling for petroleum and geothermal resources, discoveries of orebodies, new mines opened, and expansion and other activities of existing mines. Statistics of known gold and silver deposits, and directories of mines and mills are included. Exploration Development Mining Processing Special Publication MI-2013 Metals Industrial Minerals Oil and Gas Geothermal The Nevada Mineral Industry 2013 Nevada Bureau of Mines and Geology
Transcript of Metals Mines and Geology Industrial Minerals Oil...
This report describes mineral, oil and gas, and geothermal activities and accomplishments in Nevada in 2013: production statistics, exploration and development including drilling for petroleum and geothermal resources, discoveries of orebodies, new mines opened, and expansion and other activities of existing mines. Statistics of known gold and silver deposits, and directories of mines and mills are included.
ExplorationDevelopmentMiningProcessing
Special Publication MI-2013
Metals
IndustrialMinerals
Oil and Gas
Geothermal
The Nevada Mineral Industry
2013
Nevada Bureau of Mines and Geology

Daniel Klaich, Chancellor
University of Nevada, RenoMarc Johnson, President
College of ScienceJeffrey Thompson, Dean
Mackay School of Earth Sciences and EngineeringRussell Fields, Director
Scientific Research Staff
Economic Geology, Geologic Mapping,and Geologic Framework
James E. Faulds, ProfessorChristopher D. Henry, Research GeologistNicholas H. Hinz, Research Geologist
Sean Long, Research GeologistJohn L. Muntean, Research Economic Geologist
Mike Ressel, Assistant Professor-Economic Geologist
Geologic Hazards and Engineering Geology John W. Bell, Research Engineering Geologist Emeritus Seth Dee, Geologic Mapping Specialist
Craig M. dePolo, Research Geologist Alan R. Ramelli, Research Geologist
Nevada Geodetic Laboratory Geoffrey Blewitt, Research Professor
William C. Hammond, Research Professor Corné W. Kreemer, Research Professor
Environmental Geology and Hydrogeology Lisa Shevenell, Research Hydrogeologist Emeritus
Research and Administrative Support Staff
Cartography and Publication SupportJennifer Vlcan, Cartographer/GIS Manager
Jack Hursh, Cartographer/Publications Editor Rachel Micander, Cartographer/GIS Specialist Katie Ryan, Cartographer/GIS Specialist Irene Seelye, Cartographer/GIS Specialist
Publication Sales and InformationCraig M. dePolo, Supervisor
David Davis, Geologic Information Specialist Charlotte Stock, Sales Manager Bret Pecoraro, Development Technician
Administration Alex Nesbitt, Administrative Assistant Linda Goar, Accounting Assistant
Board of Regents
Sam LiebermanKevin C. MelcherKevin J. Page, ChairmanAllison StephensRick Trachok, Vice Chairman
Andrea Anderson Cedric CrearRobert Davidson Mark W. Doubrava Jason Geddes Trevor Hayes James Dean Leavitt
Michael B. Wixom
Nevada System of Higher Education 2015
Nevada Bureau of Mines and GeologyJames E. Faulds, Director/State Geologist
Cover Photo:Newmont Corporation’s Gold Quarry Mine Eureka County Photographer: Mike Visher

Nevada Bureau of Mines and Geology Special Publication MI-2013
The Nevada Mineral Industry 2013
Contents
3 Overview by John L. Muntean
13 Metals by David A. Davis and John L. Muntean
40 Major Precious-Metal Deposits by David A. Davis and John L. Muntean
92 Other Metallic Deposits by David A. Davis and John L. Muntean
100 Industrial Minerals by David A. Davis
113 Industrial Mineral Deposits by David A. Davis
117 Geothermal Energy by Lisa Shevenell and Alexandra Reid
132 Oil and Gas by David A. Davis
143 Directory of Mining and Milling Operations by David A. Davis
2015


3
OVERVIEW by John L. Muntean
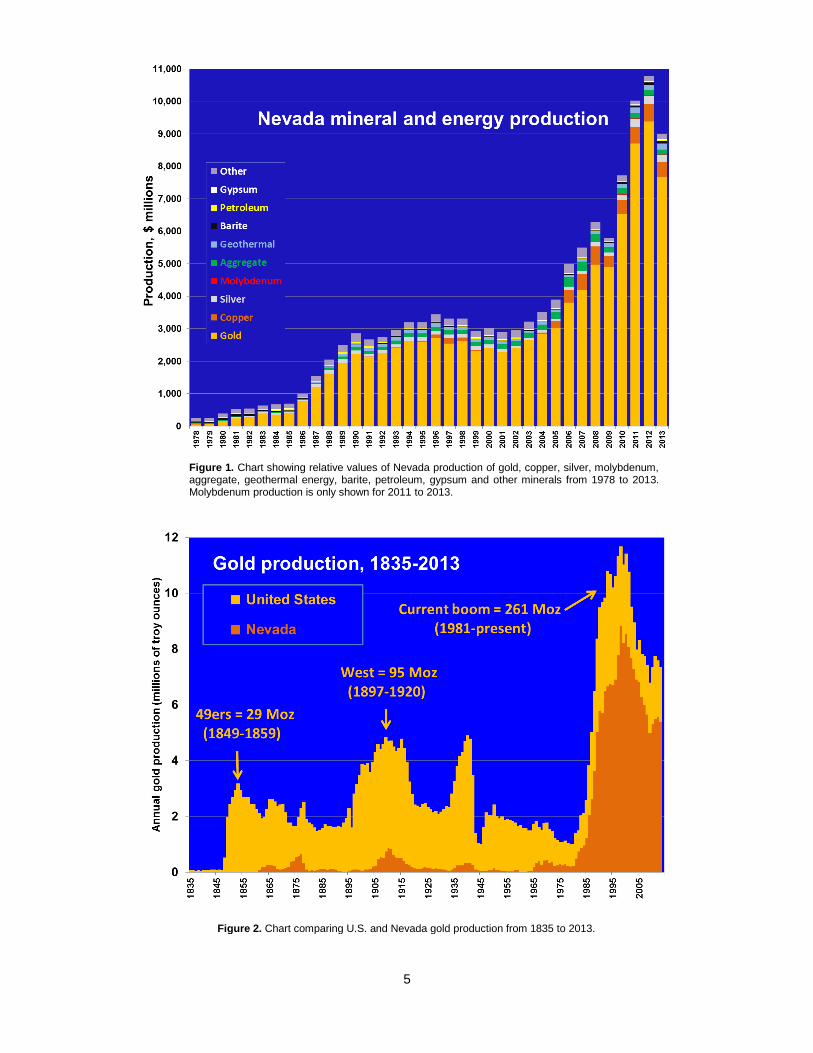
This report highlights activities through 2013 in metals, industrial minerals, geothermal energy, and petroleum. The value of overall mineral and energy production in Nevada in 2013 decreased 16.4% from its all-time high of $10.76 billion in 2012 to just shy of $9 billion (Table 1, Fig. 1). The main cause was a 15.4% decrease in the price of gold from an average cost of $1,669/ounce in 2012 to $1,411/ounce in 2013. Gold production decreased slightly, for the first time in four years, to 5.4 million ounces in 2013 (Fig. 2). Nevertheless, 2013 was the 25th consecutive year with production in excess of 5.0 million ounces. Gold comprised 85% of the value of Nevada’s mineral and energy production. Nevada led the nation in the production of gold and barite, and was the only state that produced magnesite, lithium, and the specialty clays, sepiolite and saponite. Other commodities mined and produced in Nevada in 2013, more or less in order of value, included copper, silver, geothermal energy, construction aggregate (sand, gravel, and crushed stone, including limestone and dolomite), diatomite, lime (produced from limestone and dolomite), petroleum, gypsum, silica, and molybdenum. Additional mined materials with production values less than $10,000,000 in 2013 were clays, perlite, iron ore, dimension stone, salt, and semiprecious gemstones (opal). Locations of many of the sites mentioned in the text of this report are shown on NBMG Open-File Report 2014-01, Nevada Active Mines and
Energy Producers, which is available at http://www.nbmg.unr.edu/freedownloads/of/of2014-01.zip .
As was the case in 2011, Nevada ranked first in the United States in terms of value of overall nonfuel (excluding oil, gas, coal, uranium, and geothermal) mineral production in 2013 (according to the U.S. Geological Survey, Mineral Commodity Summaries 2014, http://minerals.usgs.gov/minerals/pubs/mcs/2014/mcs2014.pdf). Arizona, the country’s major copper producer, retained second place. Minnesota, the leading iron ore producer in the U.S., was third. Florida, mainly because of its phosphate production, rose to fourth. Texas rose to fifth, mainly due to its booming construction industry and demand for aggregate and cement. Alaska, a significant producer of gold, zinc, and silver, was sixth. Utah was seventh, mainly because of its Bingham Canyon copper mine near Salt Lake City. California dropped three places to eight. The contributions that mining makes to the economies of Nevada and the U.S. are significant in terms of jobs, commerce, taxes, improvements to the infrastructure, and lowering of the U.S. trade deficit.
Nevada's production of gold, valued at $7.67 billion, accounted for 74% of the U.S. total and helped the U.S. become the third leading gold producer in the world in 2013. Nevada alone accounted for 6.1% of world production of gold, which was approximately 89 million
ounces in 2013. As in 2012, only China, Australia, and Russia produced more gold than the state of Nevada. Second to gold in terms of Nevada's mineral value in 2013 was copper ($468 million), followed by silver ($206 million), which was chiefly as a byproduct or co-product of gold production. Electrical power from geothermal energy production in Nevada was valued at $185 million. Construction aggregate ranked fifth, with a value of $150 million.
The section on Metals and the tables of Major
Precious-Metal Deposits and Other Metallic Deposits provide details on exploration, new deposit discoveries, new mine openings, mine closures, additions to reserves, and mine expansions. As has been the case for many years, gold continues to be the leading commodity produced in Nevada. Production of gold in 2013 came mainly from 14 major mining operations that each produced greater than 50,000 ounces. The Carlin trend in northeastern Nevada accounted for 35% of the total production, a slightly lower percentage than in 2012. There were nine mining operations not on the Carlin trend that each produced over 100,000 ounces of gold.
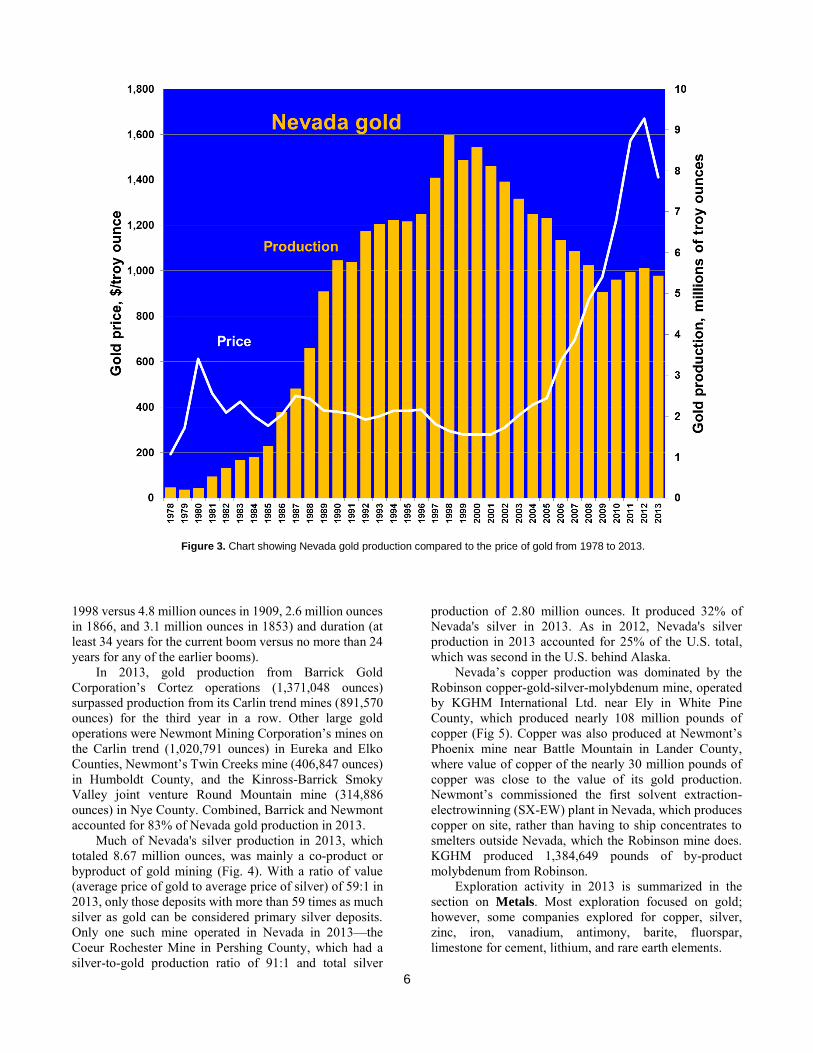
Nevada and the U.S. have produced a significant portion of the world’s gold. The U.S. Geological Survey estimates that total world gold production, since the beginning of civilization, has been approximately 5.54 billion ounces. Although this seems like a large quantity, all the gold ever mined would fit into a cube only 68 feet on a side. Interestingly, about 85% of that gold is still in use (in bullion, coins, jewelry, electronics, etc.), and most gold currently in use will be recycled. In 2012, Nevada reached a major milestone, passing the 200 million ounce mark in gold production, which started in 1859 with the Comstock Lode. Total gold production through 2013 is 208.48 million ounces. Remarkably, 88% has been produced since the Carlin mine began production in 1965; 86% has been produced during the current boom from 1981 to the present; and 28% has been produced in the last ten years. Cumulative U.S. production, primarily since 1835, is approximately 574 million ounces or about 10.4% of total world gold production, and total Nevada production is 3.8% of cumulative world production. The Carlin trend alone accounts for 1.5% of all the gold ever mined in the world. By the end of 2013, cumulative production from the Carlin trend was 82.4 million ounces, assuring its place as one of the most productive gold-mining districts in the world.
Nevada continues to be in the midst of the biggest gold boom in U.S. history, as the graph of historical U.S. gold production illustrates (Fig. 3). The recent surge in production in the U.S. is largely the result of discoveries of Carlin-type gold deposits and other deposits in which gold occurs primarily in grains that are too small to be visible to the naked eye. These deposits are mostly in Nevada. The U.S. production so far in the current boom, the period since

4
1981, has been 254 million ounces. This is significantly greater than the total U.S. production during the era of the California gold rush (1849 to 1859, with 29 million ounces, although some estimates of unreported production may bring that figure up to 70 million ounces); the Comstock (Nevada) era from 1860 to 1875 (with 34 million ounces); and the period from 1897 to 1920, when Goldfield (Nevada), the Black Hills (South Dakota), Cripple Creek
(Colorado), and byproduct gold production from copper mines in Arizona and Utah contributed to cumulative production of 95 million ounces. U.S. production in the last decade from 2004 through 2013 alone was 76 million ounces. The current boom is bigger than previous booms not only in terms of cumulative production but also in terms of peak annual production (11.6 million ounces in
TABLE 1. MINERAL, GEOTHERMAL POWER, AND PETROLEUM PRODUCTION IN NEVADA1 2011 (revised) 2012 % Change from 2011 to 2012 Commodity Quantity Value Quantity Value Quantity Value (millions) (millions) Gold (thousand troy ounces) 5,536 $8700.7 5,615 $9371.7 1.4 7.7 Silver (thousand troy ounces) 7,141 250.8 8,527 265.6 19.4 5.9 Copper (thousand pounds) 123,791 502.6 145,319 537.7 17.4 7.0 Molybdenum 1,145 17.7 296 3.9 -74.1 -77.9
(thousand pounds) Aggregate 25,190 180.4 26,070 162.9 3.5 -9.7
(thousand short tons Barite (thousand short tons) 698 59.5 744 72.1 6.7 21.2 Gypsum (thousand short tons) 1,010 12.7 1,481 17.1 46.6 34.6 Geothermal energy 2,173 153.3 2,410 152.9 10.9 -0.3
(net, thousand megawatt-hours) Petroleum 408 28.9 368 33.5 -9.8 15.9
(thousand 42-gallon barrels) Other minerals2 ----- 115.5 ----- 140.7 ----- 21.8 Total ----- $10,022.1 ----- $10,758.2 ----- 7.3 __________________________________________________________________________________________________________________________________________________________________________________________________________________
1Production as measured by mine shipments, sales, or marketable production (including consumption by producers); compiled by the Nevada Division of Minerals (NDOM) and the Nevada Bureau of Mines and Geology. Products milled or processed in Nevada but mined from deposits in California are excluded. Specifically, zeolite from the Ash Meadows plant in Nye County is not included in these totals.
2Building stone, cement, clay, diatomite, lime, lithium, magnesite, mercury, iron ore, perlite, salt, and silica sand.
The value of minerals and energy were calculated as follows:
Gold and silver: production reported by NDOM using average annual prices for gold ($1571.52/oz for 2011, $1668.98/oz for 2012) and silver
($31.15/oz for 2012), as reported by www.kitco.com.
Copper and molybdenum: production reported by NDOM using average annual prices for copper ($4.06/lb for 2011, $3.70/lb for 2012) and
molybdenum ($15.44/lb for 2011, $13.24/lb for 2012), as reported by USGS.
The values of all the other commodities were the gross proceeds in 2011 and 2012 reported by the Nevada Department of Taxation.
5
Figure 1. Chart showing relative values of Nevada production of gold, copper, silver, molybdenum, aggregate, geothermal energy, barite, petroleum, gypsum and other minerals from 1978 to 2013. Molybdenum production is only shown for 2011 to 2013.
Figure 2. Chart comparing U.S. and Nevada gold production from 1835 to 2013.
6
1998 versus 4.8 million ounces in 1909, 2.6 million ounces in 1866, and 3.1 million ounces in 1853) and duration (at least 34 years for the current boom versus no more than 24 years for any of the earlier booms).
In 2013, gold production from Barrick Gold Corporation’s Cortez operations (1,371,048 ounces) surpassed production from its Carlin trend mines (891,570 ounces) for the third year in a row. Other large gold operations were Newmont Mining Corporation’s mines on the Carlin trend (1,020,791 ounces) in Eureka and Elko Counties, Newmont’s Twin Creeks mine (406,847 ounces) in Humboldt County, and the Kinross-Barrick Smoky Valley joint venture Round Mountain mine (314,886 ounces) in Nye County. Combined, Barrick and Newmont accounted for 83% of Nevada gold production in 2013.
Much of Nevada's silver production in 2013, which totaled 8.67 million ounces, was mainly a co-product or byproduct of gold mining (Fig. 4). With a ratio of value (average price of gold to average price of silver) of 59:1 in 2013, only those deposits with more than 59 times as much silver as gold can be considered primary silver deposits. Only one such mine operated in Nevada in 2013—the Coeur Rochester Mine in Pershing County, which had a silver-to-gold production ratio of 91:1 and total silver
production of 2.80 million ounces. It produced 32% of Nevada's silver in 2013. As in 2012, Nevada's silver production in 2013 accounted for 25% of the U.S. total, which was second in the U.S. behind Alaska.
Nevada’s copper production was dominated by the Robinson copper-gold-silver-molybdenum mine, operated by KGHM International Ltd. near Ely in White Pine County, which produced nearly 108 million pounds of copper (Fig 5). Copper was also produced at Newmont’s Phoenix mine near Battle Mountain in Lander County, where value of copper of the nearly 30 million pounds of copper was close to the value of its gold production. Newmont’s commissioned the first solvent extraction-electrowinning (SX-EW) plant in Nevada, which produces copper on site, rather than having to ship concentrates to smelters outside Nevada, which the Robinson mine does. KGHM produced 1,384,649 pounds of by-product molybdenum from Robinson.
Exploration activity in 2013 is summarized in the section on Metals. Most exploration focused on gold; however, some companies explored for copper, silver, zinc, iron, vanadium, antimony, barite, fluorspar, limestone for cement, lithium, and rare earth elements.
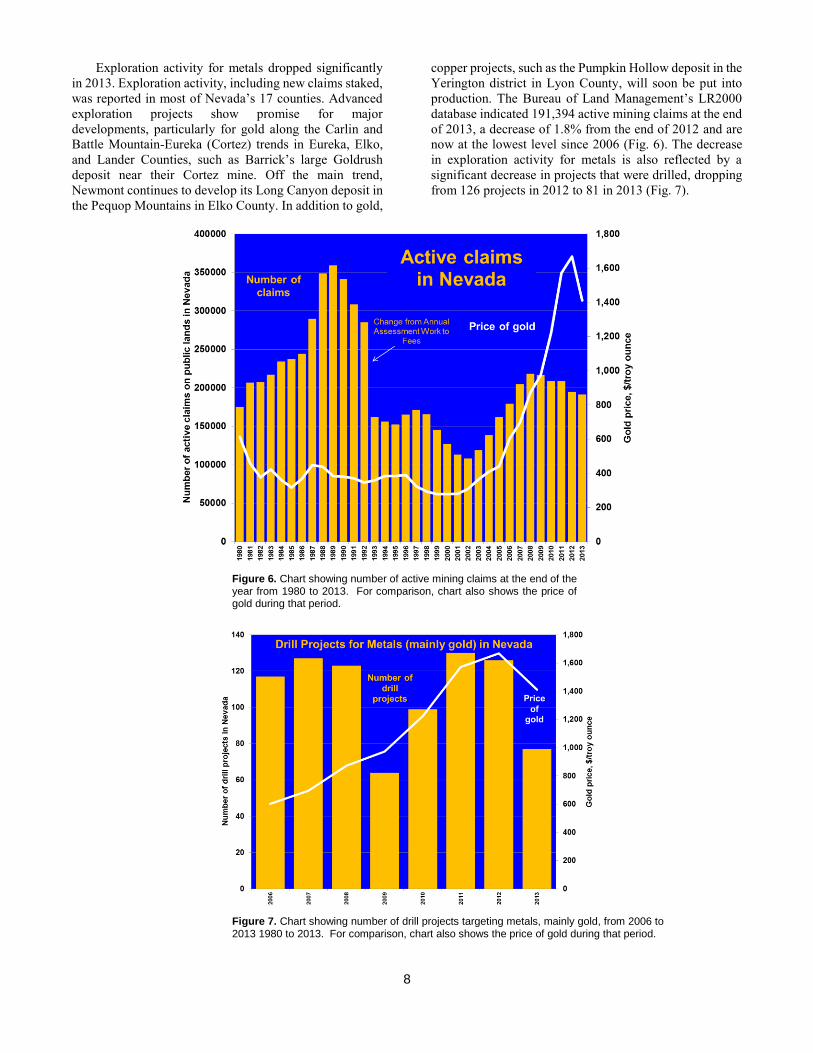
Figure 3. Chart showing Nevada gold production compared to the price of gold from 1978 to 2013.

7
Figure 4. Chart showing Nevada silver production compared to the price of silver from 1978 to 2012.
Figure 5. Chart showing Nevada copper production compared to the price of copper from 1978 to 2012.
8
Exploration activity for metals dropped significantly in 2013. Exploration activity, including new claims staked, was reported in most of Nevada’s 17 counties. Advanced exploration projects show promise for major developments, particularly for gold along the Carlin and Battle Mountain-Eureka (Cortez) trends in Eureka, Elko, and Lander Counties, such as Barrick’s large Goldrush deposit near their Cortez mine. Off the main trend, Newmont continues to develop its Long Canyon deposit in the Pequop Mountains in Elko County. In addition to gold,
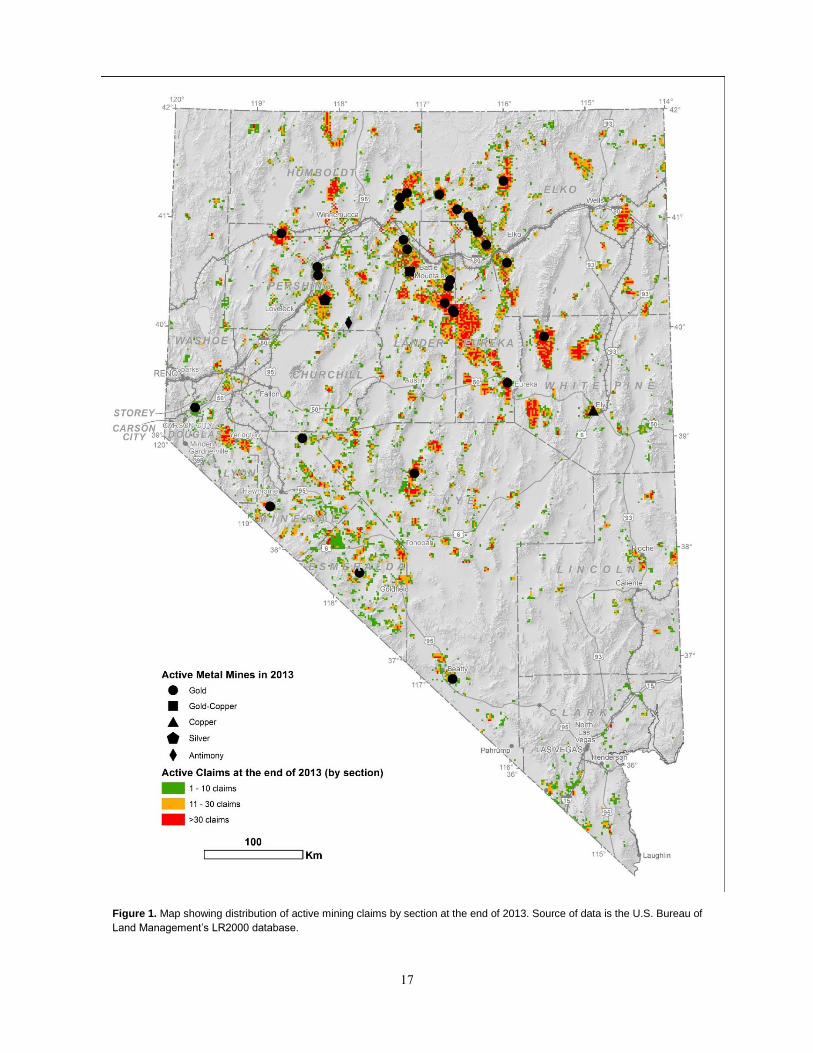
copper projects, such as the Pumpkin Hollow deposit in the Yerington district in Lyon County, will soon be put into production. The Bureau of Land Management’s LR2000 database indicated 191,394 active mining claims at the end of 2013, a decrease of 1.8% from the end of 2012 and are now at the lowest level since 2006 (Fig. 6). The decrease in exploration activity for metals is also reflected by a significant decrease in projects that were drilled, dropping from 126 projects in 2012 to 81 in 2013 (Fig. 7).
Figure 6. Chart showing number of active mining claims at the end of the year from 1980 to 2013. For comparison, chart also shows the price of gold during that period.
Figure 7. Chart showing number of drill projects targeting metals, mainly gold, from 2006 to 2013 1980 to 2013. For comparison, chart also shows the price of gold during that period.

9
The section on Industrial Minerals covers developments during 2013 and gives details on important commodities produced from or processed in Nevada, including aggregate, barite, cement, clays, diatomite, dimension stone, dolomite, gypsum, lime, limestone, lithium, magnesite and brucite, perlite, potassium alum (kalinite), pozzolan, salt, semiprecious gemstones (opal and turquoise), silica, and zeolites. Aggregate production, which until the recession hit Nevada particularly hard, had been increasing as a result of Nevada's expanding population and need for construction materials for homes, schools, streets, highways, airports, resort hotels, and other businesses. Demand for construction raw materials is likely to remain strong in the future because of Nevada’s population and need for highways. However, Nevada’s
population in 2013 was 2.791 million up only slightly from 2.701 million in 2010 (www.census.gov). The recent slow growth in population is reflected in a fairly steady decrease in aggregate production since 2006 (Fig. 8). That being said, Nevada’s gypsum production increased by 41%, indicating building construction is on the rebound.
Nevada was once again the leading domestic producer of barite, of which 95% is used drilling muds. Production in Nevada increased 24% in 2013 (Fig. 9), mainly due to a large increase in domestic drilling for oil and gas. Nevada’s production of diatomite, which is mainly used in filtration, was second only California in the U.S.
Figure 8. Chart showing Nevada aggregate production from 1980 to 2013.

10
Chemetall Foote Corporation’s Silver Peak lithium operation in Clayton Valley in Esmeralda County, where subsurface brines are evaporated on a playa, is the only domestic lithium producer. Premier Chemicals’ (now Premier Magnesia) Gabbs Mine in Nye County is currently the nation's only hard-rock producer of magnesite.
Molycorp’s Mountain Pass mine in southern California is the only domestic producer of rare earths elements (REE) in the U.S. Elissa Resource Ltd., a small exploration company, is evaluating its Thor REE project located very near Mountain Pass, just over the state line in Clark County, Nevada. Unlike Mountain Pass, which produces light REEs, the mineralization at Thor is enriched in the more valuable heavy REEs, including the element neodymium which is a critical component of high-strength magnets used in electronics.
Developments in the geothermal industry are covered in the section on Geothermal Energy. Approximately 24 power plants operating at 16 sites that sold a record amount of electricity in 2013. Nevada geothermal electrical production in 2013 from federal and private lands combined was 2,527,603 megawatt-hours (MWh) net, a 5% increase (Fig. 10). Additionally, geothermal energy is used at numerous places in Nevada for space heating,
domestic warm water, recreation, dehydrating vegetables, and other agricultural applications.
Programs in the U.S. Department of Energy, energy bills passed by the Nevada and California legislatures, and activities of researchers at the University of Nevada Reno are stimulating geothermal development in Nevada. According to the Geothermal Energy Association, at the end of 2013, there were 45 projects (compared to 75 projects at the end of 2012) in various stages of development in Nevada, which could result in the construction of approximately 718 MW of additional power generation capacity over the next 5 to 10 years (GEA, 2014). Like minerals, exploration activity for new geothermal fields waned, mainly due to the low price of natural gas.
Developments in the Nevada petroleum industry are covered in the section on Oil and Gas. Oil is produced primarily in two areas—Railroad Valley in Nye County and Pine Valley in Eureka County. Total annual oil production from Nevada is a minor part of U.S. production. The amount of Nevada oil production decreased nearly 9% from 2012 (Fig. 11). Small amounts of co-produced natural gas are used to fuel equipment used for oil production.
Figure 9. Chart showing Nevada barite production from 1970 to 2013.

11
In 2013, Noble Energy Inc., a medium-sized oil company from Houston, Texas, continued its evaluation of oil and gas in Tertiary shales near Elko and Wells. It plans to employ hydraulic fracturing technology, which is revolutionizing the oil and gas industry throughout the United States. Noble spent $23,000,000 in 2013 on its
leases in Nevada, which covers 350,000 acres between Elko and Wells. One of the holes it drilled in 2013 reportedly recovered oil from multiple intervals and was set to be hydraulically fractured in 2014. Noble estimates the area may hold a potential resource of between 190
Figure 10. Chart showing net geothermal production in megawatt-hours in comparison to the average price of geothermal power in cents per kilowatt-hour for the period from 1985 to 2013.
Figure 11. Chart showing Nevada petroleum production from 1978 to 2013.

12
million and 1.4 billion equivalent barrels of oil with a potential production of up to 50,000 barrels per year.
Local economies benefit from mining in Nevada. Construction of new homes, hotels, casinos, other businesses, schools, and roads requires local sources of sand, gravel, crushed stone, gypsum, and raw materials for cement, all of which are abundant in Nevada. According to the Nevada Department of Employment, Training, and Rehabilitation, the Nevada mining industry employed an average of 17,554 employees in 2013. The average pay for mineral industry employees during this time was $80,725 per year, the highest average of any employment sector in the state. In addition, it is estimated there are about 65,000 jobs in the state related to providing goods and services needed by the mining industry. Mining employment has remained an important factor in Nevada (M. Visher, 2012, Major Mines of Nevada 2012, Mineral Industries in Nevada’s Economy, Nevada Bureau of Mines and Geology Special Publication P-23, 28 p.; available at www.nbmg.unr.edu/dox/mm/mm10.pdf).
Additional information about the Nevada mineral industry and the U.S. gold industry, including the contents of selected publications, is readily available on line through the World Wide Web from the Nevada Bureau of Mines and Geology (www.nbmg.unr.edu/) and the Nevada Division of Minerals (http://minerals.state.nv.us/). Useful national and international data on nonfuel minerals can be obtained from the U.S. Geological Survey (http://minerals.usgs.gov/minerals/), and the U.S. Energy Information Administration (www.eia.doe.gov) provides data on oil and gas, geothermal, solar, wind, hydroelectric, and other energy sources. The Nevada Bureau of Mines and Geology supports several interactive maps on the Web that are backed by periodically updated databases on mineral and energy resources and potential, exploration activity, land ownership and restrictions, and other geographic information (http://www.nbmg.unr.edu/Mapping/InteractiveMaps.html).
CONVERSION FACTORS
1 metric ton = 1.1023113 short ton = 1,000 kilograms = 2,204.6226 pounds = 32,150.7 troy ounces.
31.1035 metric tons = 1 million troy ounces (31.1035 grams = 1 troy ounce).
453.592 grams = 1 pound (avoirdupois) = 16 ounces (avoirdupois) = 14.5833 troy ounces.
34.2857 grams per metric ton = 34.2857 parts per million by weight = 1 troy ounce per short ton.

13
METALS by David A. Davis and John L. Muntean
PRODUCTION
Nevada produced 5,436,430 ounces of gold, 8,668,596 ounces of silver, 137,714,765 pounds of copper, 1,384,649 pounds of molybdenite, and 500 tons of stibnite ore from 31 active mines based on records from the Nevada Division of Minerals. Gold and copper production were slightly lower than 2012, whereas silver was slightly greater.
Gold production decreased for the first time after three years of annual increases, which followed a nine-year decline in production. The Carlin trend helped Barrick Gold Corp. and Newmont Mining Corp. continue their dominance of Nevada’s gold production. Barrick and Newmont accounted for 83% of Nevada’s gold production, down from 86% in 2012. The Carlin trend produced 1,912,361 ounces of gold, a decrease of 11% from 2012. The decrease was mainly due to lower production from Barrick’s Betze-Post open pit mine, which was only partly offset by minor increases from its underground Meikle mine and from Newmont’s overall Carlin operations. The Carlin trend’s share of Nevada’s gold production decreased to 35%, a significant decline from 54% in 2008.
Barrick, the world’s leading gold producer remained Nevada’s leading producer as well in 2013, producing 50% of Nevada’s gold. The company produced 2,736,637 ounces, a decrease of 11% from 2012. Production came from its Bald Mountain, Cortez, Goldstrike, Ruby Hill, Storm, and Turquoise Ridge mines (75% share), plus its 50% share of the Round Mountain mine’s production and its 33% share of the production from the Marigold mine. The open pit and underground mines at the Cortez Hills deposit produced 1,371,048 ounces of gold which was half of Barrick’s Nevada production and 25% of statewide production. Barrick’s gold reserves in Nevada at the end of 2013 totaled nearly 31,000,000 million ounces.
Newmont produced 1,760,616 ounces of gold, a slight increase from 2012. Newmont’s production came from nine open pit and seven underground mines, including its Carlin trend mines and its Emigrant, Midas, Phoenix, and Twin Creeks mines, plus its 25% share of the Turquoise Ridge mine. Production was 82% from refractory ores, the same as in 2012. Newmont’s reserves in Nevada at the end of 2013 amounted to nearly the same as Barrick’s – 31,000,000 ounces of gold, 75% of which is in open pit mines and 25% in underground mines. Newmont’s reserves are 83% in refractory ore, and 17% in oxide ore, and 75% in open pit mines and 25% in underground mines.
Other gold mines reporting production in 2013 included: Round Mountain (314,886 oz; 50% Kinross Gold Corp., 50% Barrick), Hycroft (181,941 oz; Allied Nevada Gold Corp.), Marigold (161,062 oz; Goldcorp, Inc., 66.67%, Barrick 33.33%), Jerritt Canyon (139,556 oz; Veris Gold Corp.); Standard/Florida Canyon (46,152 oz; Jipangu International), Mineral Ridge (36,160 oz; Scorpio Gold),
Hollister (26,821 oz; Great Basin Gold and then Waterton Global Mining), Denton-Rawhide (23,900 oz; Rawhide Mining LLC), Borealis (10,556 oz; Borealis Mining), and Sterling (7,431 oz; Imperial Metals Corp.). New mines that opened in 2013 included the underground Starvation Canyon mine that is part of Veris Gold’s Jerritt Canyon mining operation and underground test mining by Klondex Gold Mines Ltd. at its Fire Creek mine. Approximately 30% of Nevada’s gold production in 2013 was from underground mines. Goldcorp and Barrick announced at the end of 2013, that they were in the process of selling the Marigold mine to Silver Standard Resources Inc.
Newmont was the leading silver producer at 3,233,652 ounces, a 13% increase, 90% of which was from the Midas and Phoenix mines. Production at Coeur d’Alene Mines Corp.’s Rochester mine, the only mine where silver is the primary product, declined slightly to 2,798,937 ounces in 2013. KGHM International’s Robinson mine produced 78% of Nevada’s copper, which amounted to 107,898,857 pounds, an 8% decrease from 2012. Newmont’s Phoenix mine made up the balance of the copper production, producing 29,815,908 pounds, a 7% increase from 2012. The increase was partly the due to Newmont’s commissioning of its solvent extraction-electrowinning (SX-EW) plant in October 2013 at a cost of $91 million. It is the first SW-EW operation in Nevada. KGHM International produced 1,384,649 pounds of by-product molybdenum from Robinson, a 208% increase from 2012, mainly because stockpiles of molybedenite ore were sufficiently large to run through the mill.
EXPLORATION and DEVELOPMENT
Exploration activity decreased significantly in 2013, mainly due to a decreasing gold price. Gold averaged $1411.23 per ounce, a decrease of 15% from $1668.98 per ounce in 2012. It started the year at $1693.75 per ounce and ended the year at $1205.50. Silver averaged $23.79 per ounce, a decrease of 24% from $31.15 per ounce in 2012. It started the year at $30.87 per ounce and ended the year at $19.50.
Nevada county recorders registered 218,407 claims in fiscal year 2013 (which ended June 30, 2013), a 2.8% decrease from fiscal year 2012. These included new claims and annual maintenance of existing claims. The number of claims at the end of 2013, as derived from U.S. Bureau of Land Management’s (BLM) LR2000 database, was 191,394, a decrease of 1.8% from the end of 2012. The distribution of active claims at the end of 2012 is shown in Figure 1. The decrease in exploration trend is clearly reflected by the decrease in new claim staking. The BLM listed 11,151 new claims that were located in calendar year 2013 (Figure 2), a 47% decrease from 2012, and a decrease of 60% from 2011. Table 1 shows the companies that staked over 300 new claims in calendar year 2012. Newmont and Barrick led the way in new claim staking, marking a trend that started three years ago after years in which small junior companies had been staking the most claims. In order to

14
survive financially, junior companies are beginning to trim their claim blocks down to the minimum necessary amount to cover the core areas of their properties. The claim staking by Newmont and Barrick was very focused, with almost all of Newmont’s new claims being staked in the Snake Mountains north of Wells and the vast majority of Barrick’s staking occurring at the north of Monitor Range, the east side of the Northern Nevada Rift in the Buckhorn District of the Cortez Range, and the south end of the Schell Creek Range.
At least 81 projects were drilled in 2013, down significantly from 126 projects in 2012. Table 2 shows the breakdown of the drill projects by size of company and drill program. Eight projects were drilled primarily for copper, one for silver, with the remaining projects targeting gold. Five “major” companies (Barrick, Newmont, Goldcorp, Kinross, and KGHM) and 4 “mid-tier” companies (Agnico Eagle Mines Ltd, Coeur Mining Inc., Allied Nevada Gold Corp., Imperial Metals Corp.) drilled at least 31 projects in 2013, down from 41 in 2012. The remaining 51 projects were drilled by 42 junior “junior” companies. Figure 3 shows the distribution of projects across the state that were drilled in 2013.
____________________________
1 The classification of companies into major, mid-tier, or junior in this section of the report is arbitrarily based on gold production and market capitalization. The loose criteria are as follows: 1) major companies produce greater than 1 million ounces of gold worldwide, and have market capitalizations of over $3 billion, 2) mid-tier companies produce between 50,000 and 1 million ounces of gold and/or have market capitalizations less than $3 billion but more than $500 million, and 3) junior companies produce less than 50,000 ounces of gold and/or have market capitalizations less than $500 million.
____________________________ The main exploration target in Nevada continued to be
gold. Of the 81 projects that were known to have been drilled in 2013, 72 of them targeted gold. One was targeted primarily for silver the remaining 8 were drilled primarily for copper, which were also commonly tested for gold, silver, and molybdenum. Coeur Mining Inc. carried out an aggressive drill program on the claim block that covers its Rochester silver mine, which produces significant by-product gold. The average silver to gold ratio for production from Rochester from the period from 1986 2013 is 83:1. The copper projects focused on the Yerington district, including Pumpkin Hollow (Nevada Copper Corp.), Yerington open pit (Quaterra Resources Inc.), and Ann Mason and Blue Hill (Entrée Gold Inc.). Others projects primarily drilled for copper were Copper Basin (Newmont) in the Battle Mountain district, the Robinson mine near Ely (KGHM International Ltd.), Clay Peters in the Santa Fe district (Silver Reserve Corp.) and M2 Smith in the Marietta district (Great Western Mining Corp.), both of which are in Mineral County. Nevada Copper Corp. continued to make great
strides in driving its Pumpkin Hollow project toward production. Its 2,200-foot shaft to access the underground East deposit became operational with production planned for late 2015. It completed a feasibility study on its planned open pit mines for the South and North deposits. Federal legislation that would transfer 10,400 acres of public lands to the City of Yerington, which would then re-convey much of the land to Nevada Copper, was being deliberated by Congress. The legislation had a wilderness provision added to it which included 26,000 acres in the Pine Forest Range in Humboldt County and 48,000 acres in the Pine Grove Hills in Lyon County.
Most of the money spent on exploration spent by the major companies was spent on drilling near their active mines. Barrick spent about $55 million on exploration and evaluation in Nevada out of the $208 million in spent worldwide in 2013, according to its 2013 annual report. Barrick’s Goldrush discovery, one of the largest discoveries worldwide in the last ten years, continues to grow. The total resource at the end of 2013 amounted to 15.6 million ounces of gold at an average grade of 0.135 opt. The mineralization shows remarkable continuity over a strike length of almost 4.5 miles, and the deposit remains open in multiple directions. The underground portion of Cortez Hills deposit continues to grow, with mineralization still open at depth and to the south and west. Barrick continued to drill its Spring Valley project (joint venture with Midway Gold Corp.), located just north of Coeur Mining’s Rochester mine; however, a new resource estimate on Spring Valley has not been released since 2011. Newmont spent $94 million on exploration and advanced projects in Nevada in 2013, according to its 2013 annual report. It spent $469 million worldwide on exploration and advanced projects. It focused its exploration program on the Long Canyon project, drilling 235,000 feet. Based on drilling through the end of 2013, Newmont released its first reserve estimate for Long Canyon, a probable reserve totaling 1,010,000 ounces of gold. Though its worldwide exploration expenditures amounted to $177 million, Kinross was not very active in exploring Nevada in 2013. Goldcorp’s exploration in Nevada was almost entirely at its Marigold mine, where it spent an unreported amount on drilling. Allied Nevada spent $3.6 million on exploration, scaling back its efforts in 2013 to its Hycroft mine. It divested 75% of its interest in its Hasbrouck Mountain and Three Hills projects near Tonapah to West Kirkland Mining Inc. Agnico Eagle Mines Ltd spent $3.5 million, mainly on drilling its properties (joint venture with Newmont) adjacent to Newmont’s Long Canyon project in the Pequop Mountains.
Though Barrick and Newmont companies still focused their drilling programs their active mine properties, they appeared to become more active in greenfields exploration, as junior company exploration waned in 2013. In 2012 and 2013 both companies focused their staking to a few large claim blocks. Newmont seemingly focusing on carbonate-hosted gold targets in northeastern Nevada, and Barrick on pediment plays along Highway 50 near the Battle Mountain-Eureka trend, namely Antelope Valley on the

15
west side of the Mahogany Hills, which it drilled in 2013, and the pediment north of the Monitor Range. Newmont carried out drill programs at several of its greenfields projects in 2013, including Keystone in the Tybo district, North Eugene at the north end of the Eugene Mountains, South Pilot near Wendover, and Twelvemile near Tecoma.
As previously mentioned, junior companies carried out at least 51 drill projects in 2013. Major drill programs in 2013 that drew attention were Pilot Gold Inc.’s Kinsley project, Premier Gold Mines Inc.’s Cove project, Gold Standard Ventures Corp.’s Railroad project, Klondex Mines Ltd.’s Fire Creek project, Corvus Gold Inc.’s North Bullfrog project, and Veris Gold Corp.’s drill projects on its Jerritt Canyon mine property. Pilot Gold continued to drill high grade gold intercepts on the west flank of Kinsley Mountain, outlining a zone of significant oxide and sulfide gold mineralization within several stratigraphic horizons along a 1,600-foot, north-south-trending zone. Premier Gold discovered several zones of polymetallic high-grade gold-silver mineralization below and around the old Cove pit. It also discovered new zones of Carlin-style mineralization below the pit. Drilling by Gold Standard extended the North Bullion Zone at its Railroad project to a strike length of 3,200 feet long and a width of 1,000 feet with mineralization remaining open to the north and west. Klondex continued to develop its underground Fire Creek mine, and, in so doing, produced 6.208 ounces of gold. Drilling continued to delineate high-grade mineralization in Joyce and Vonnie veins, and as in veins in the West Zone. At North Bullfrog, Corvus Gold drilled both high-grade vein-style mineralization at its Yellowjack deposit, as well as disseminated low-grade mineralization in altered volcanic rocks in several large zones. At its Jerritt Canyon mine, Veris Gold opened the new underground Starvation Canyon mine, which produced 15,750 ounces of gold. It continued its aggressive underground drill program delineating resources at is active Smith and SSX mines.
Despite the decrease in gold production, several mine development projects for gold are in the pipeline that could very well increase annual gold production in the short term. These include Pan (2015, ~81,000 oz/yr) and Gold Rock (2017, formerly Easy Junior), Relief Canyon (2016), South Arturo (2016), and Long Canyon (2017). At Pan, the BLM issued a final environmental impact statement and a record of decision approving the project, which will involve an open-pit gold mine consisting of two larger pits and three smaller pits. In addition, not counting resources around operating mines, 27 new reserve and/or resource estimates were released in 2013 or early 2014. Most were for gold, but three were for copper, two were for silver and one each was for iron, molybdenum, and tungsten. Eleven were upgrades from the previous year and include Buffalo Valley, Contact (copper), Goldrush, Gold Spring, Long Canyon, Mount Hamilton, North Bullfrog, Pumpkin Hollow (copper), Reward, Sandman, and South Arturo. Fourteen were new resource estimates that superseded previous ones and include Big Springs, Goldfield (includes Gemfield), Gold Rock (formerly known as Easy Junior), Hasbrouck, Longstreet, Lookout Mountain, Mount Hope (molybdenum), Nevada Packard (silver), Pinion, Relief Canyon, Springer (tungsten) Talapoosa, Taylor (Silver), Three Hills, and Yerington (copper). The first new iron resource was released for the Buena Vista deposit since 1945. No resources were released for newly discovered deposits.
Exploration activity is summarized below by county and district. Projects that were drilled in 2013 are emphasized. Production, reserves and resources of gold and silver are updated in the section “Major Precious-Metal Deposits.” Recent production, reserves, and resources from projects producing or targeting other metals are listed in the section “Other Metallic Deposits.”

16
Table 1. Claimants that staked the most new claims in 2013.
Claimant
Number of
Claims
Main Areas of Staking
NEWMONT
MINING CORP.
2175 1) .Paleozoic carbonate rocks in the Snake Mountains, north of Wells in Elko County.
BARRICK GOLD
CORP.
1501 1) Paleozoic carbonate rocks at north end of the Monitor Range and the pediment north of the Monitor Range.
2) Along the east side of the Northern Nevada Rift northeast of Goldrush deposit and northwest of Agate Pass in the Cortez Mountains in area of Tertiary sedimentary and basalt cover.
3) Paleozoic carbonate rocks near Silver King Pass at the south end of the Schell Creek Range in Lincoln County.
COEUR
ROCHESTER
526 1) Areas west and south of the Rochester mine.
COLUMBUS
GOLD (and
CORDEX)
461 1) Northeast end of the Monte Cristo Range. 2) Area of its Bolo Projects in Hot Creek Range. 3) Paleozoic rocks at the southeast end of Red Hills at the
northeast end of Spring Valley in White Pine County.
PROXIMATE
HOLDINGS INC.
349 1) Goodsprings District, Clark County.
TERRA ROSA
GOLD INC.
326 1) Cambrian carbonate rocks in Highland District west of Pioche in Lincoln County.
ULTRA LITHIUM
USA INC
301 1) Southwest end of Big Smoky Valley about 24 km northeast of the lithium brine operation in Clayton Valley.
Table 2. Breakdown of 2013 drill programs for metals in Nevada.
Major/Mid-Tier Companies Junior Companies Total
Major Drill Program 18 (32) 12 (13) 30 (45)
Minor Drill Program 12 (9) 39 (72) 51 (81)
Total 30 (41) 51 (85) 81 (126)
For comparison, the number of drill programs in 2012 is shown in parentheses
Major programs are arbitrarily defined as >25 drill holes.
17
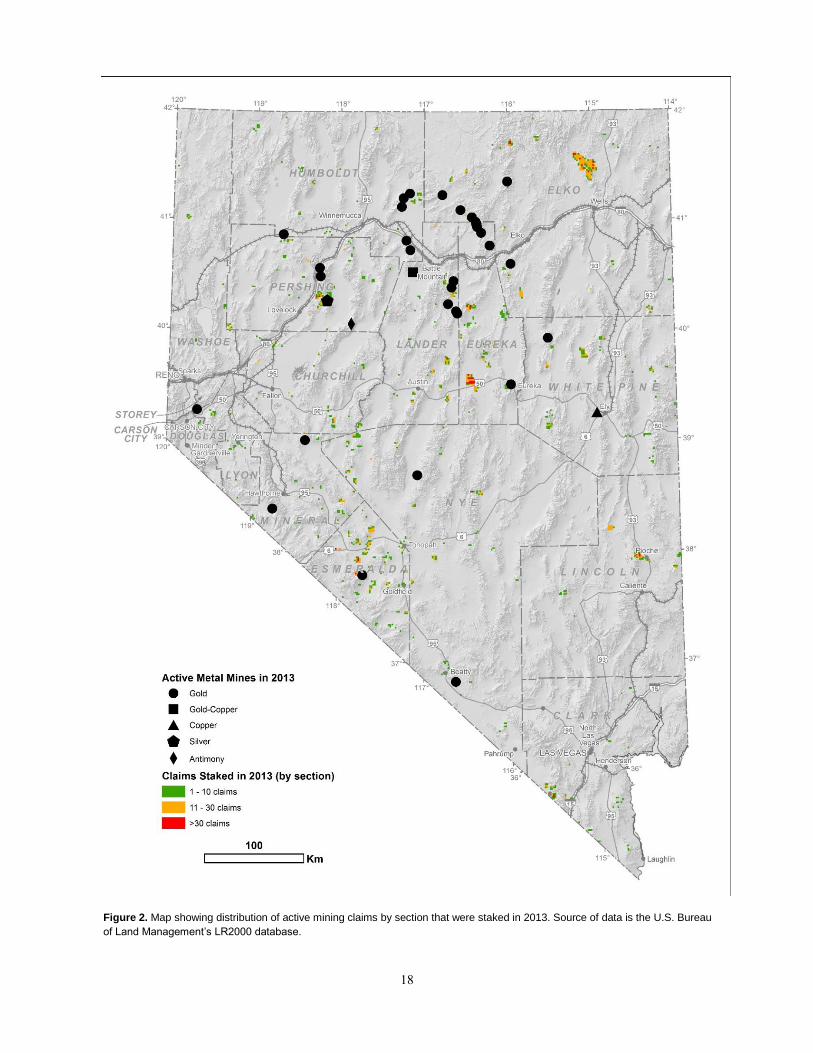
Figure 1. Map showing distribution of active mining claims by section at the end of 2013. Source of data is the U.S. Bureau of
Land Management’s LR2000 database.
18
Figure 2. Map showing distribution of active mining claims by section that were staked in 2013. Source of data is the U.S. Bureau
of Land Management’s LR2000 database.
19
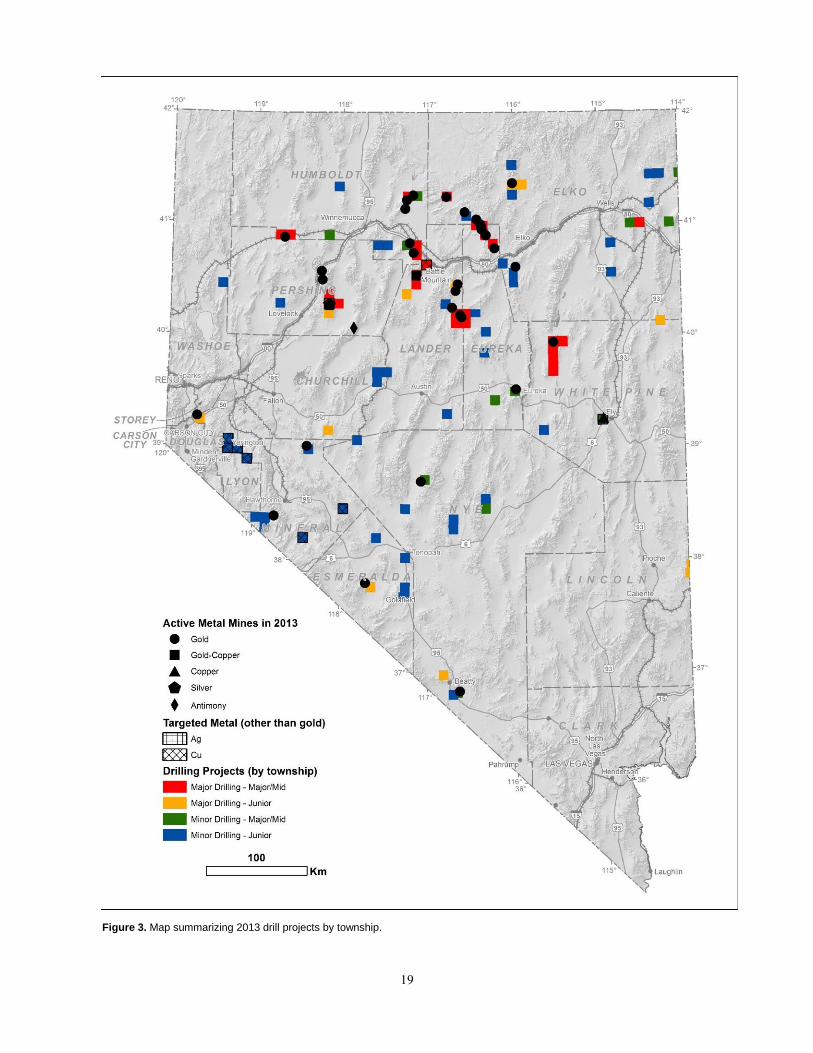
Figure 3. Map summarizing 2013 drill projects by township.

20
CHURCHILL COUNTY
Bell Mountain District
Bell Mountain. Lincoln Mining Corp. completed 34 holes totaling 8,295 feet on the Spurr, Varga, and Sphinx deposits at its Bell Mountain project. The drilling program included 21 in-fill reverse circulation holes totaling 5,505 feet, eight PQ metallurgical core holes totaling 1,617 feet, and five geotechnical core holes totaling 1,173 feet. No results were reported. Gold and silver mineralization consists of structurally controlled epithermal calcite and quartz veins hosted in a sequence of stratified rhyolitic ash flow tuffs within the Tertiary Bell Mountain caldera. (Lincoln Mining Corp. Management and Discussion Analysis, 4/30/2014; Lincoln Mining Corp. news release, 6/18/2013; Lincoln Mining Corp. website, www.lincolnmining.com) Jessup District
Jessup. Newmont Mining Corp. was granted a notice of intent by the BLM to drill holes in Sections 18 and 20, T24N, R28E, west of the old Jessup town site in 2012. It is unknown whether Newmont drilled in 2013. (BLM LR2000 database; Newmont Mining Corp. website, www.newmont.com) Mineral Basin District
Buena Vista. Nevada Iron Ltd., an Australian company, drilled its Buena Vista project in 2012 but not in 2013. However, the company did issue a probable reserve estimate of 111,200,000 metric tonnes of 18.6% Fe. The property includes fee land, 45 patented lode claims, and 184 unpatented lode claims covering 6,052 acres in parts of T24-25N, R34E. Buena Vista is a magnetite iron deposit discovered in 1898, intermittently mined between 1951 and 1959, and most recently explored by US Steel between 1961 and 1979. Nevada Iron is developing the West, East, and Section 5 deposits for production. The iron mineralization is an iron-oxide-copper-gold style deposit minus the copper and gold. The iron deposits likely formed in the Jurassic by the circulation of the non-magmatic brines that mobilized iron out of the Jurassic Humboldt mafic complex. The brine formed a huge volume of scapolite-bearing alteration. (Nevada Iron Ltd., 43-101 Technical Report, 10/22/2013; Nevada Iron Ltd., website, www.nv-iron.com; Johnson and Barton, 2000, SEG Guidebook Series) New Pass District
New Pass. Iconic Minerals Ltd., completed 11 angled reverse circulation holes totaling 5,690 feet at its New Pass project (50/50 joint venture with McEwen Mining Inc.). The drilling extended the mineralization to the north and northwest of the resource area. Holes drilled to test the eastern limits of the mineralization failed to return significant values, but the returns from other holes indicated the mineralization thickens from east to west and is open to
the west. The best intercept was 99 feet grading 0.034 opt gold and 0.121 opt silver including 22.5 feet grading 0.055 opt gold and 0.222 silver and 4.5 feet grading 0.066 opt gold and 0.219 opt silver. (Iconic Minerals, Ltd., news release, 6/11/2013; Iconic Minerals, Ltd., website, www.iconicmineralsltd.com)
ELKO COUNTY
Bootstrap District
South Arturo. Barrick Gold Corp. completed 34 holes totaling 28,238 feet to test possible extensions of its South Arturo deposit. Exploration focused on target delineation activities in the West Dee and Rossi areas and identified a north-south trending conductor and several faults potentially controlling mineralization. The BLM was preparing a final environmental impact statement and record of decision on the Arturo Mine Project of the Barrick-Dee Mining Venture Inc. (Barrick Gold Corp. 60%; Goldcorp, Inc., 40%). The company proposed expanding the Dee open pit mine by constructing two new waste rock disposal facilities, a new heap leach pad, and processing facilities. The project includes the South Arturo deposit just southeast of the Dee pit, which ceased production in 2000 and was in reclamation and closure. (Elko Daily Free Press Mining Quarterly, Spring 2013; BLM News Release ELDO 2014-023, 3/13/2014; BLM Final Environmental Impact Statement, 1/2014; Barrick Gold Corp. Annual Information Form, 3/31/2014; Barrick website, www.barrick.com; Goldcorp, Inc. Annual Information Form, 3/31/2014; Goldcorp website, www.goldcorp.com)
Storm. Barrick Gold Corp. operated the Storm (Barrick Gold Corp. 60%, Goldcorp, Inc. 40%) underground mine, which is accessible through the old Dee open pit. Production was 9,503 ounces of gold and 15,575 ounces of silver. The mine was permanently shut down in February of 2013. (Barrick Gold Corp. website, www.barrick.com)
Carlin District
Carlin. In January 2013, Evolving Gold Corp. announced the continuation of its diamond drilling program started in 2009 at its Carlin/Humboldt project about two miles south of the town of Carlin. Some of the claims were leased from Newmont Mining Corp. The amount of drilling was not disclosed, and only one hole drilled in the high grade mineralization of the Arch Zone was noted. The hole intercepted multiple intervals of high gold grades over a length of about 456 feet. Intercepts included 23 feet averaging 0.23 opt that included 5 feet grading 33 opt; 5 feet grading 60 opt; and 9 feet grading 0.43 opt. The gold mineralization is characterized by decalcification of limestone host rocks, remobilized carbon, fine-grained pyrite and realgar. Earlier drilling defined the Arch Zone as 3,300 feet by 1,970 feet with high-grade intercepts at depths mainly between 2,500 and 3,000 feet. This hole expanded

21
one of two high grade zones in the Arch Zone to about 330 feet north-south and east-west. The zone’s strike is interpreted to be northwest-southeast, and mineralization remains open in all directions. The Humboldt portion of the property was not drilled in 2013. (Evolving Gold Corp., Management and Discussion Analysis, 8/14/2013, 6/30/2014; Evolving Gold Corp., Annual Information Form, 6/30/2014; Evolving Gold Corp., news releases 1/17/2013, 2/14/2013; Evolving Gold website, www.evolvinggold.com)
Contact District
Contact. International Enexco Ltd. did not drill its Contact copper project, but it did complete a pre-feasibility study with a proven and probable reserve estimate of 141,094,000 tons with 0.22% copper. International Enexco, Ltd., was acquired by Denison Mines Corp. The project was transferred to Choice Gold Corp. which subsequently changed its name to CopperBank Resources Corp. (Choice Gold Corp. news release, 6/3/2014; International Enexco Ltd. News Release, 6/9/2014; International Enexco Ltd. Management and Discussion Analysis, 4/9/2014; International Enexco Ltd. 43-101 Technical Report, 10/9/2013)
Eastern Elko County
Angel Wing. Ramelius Resources, Ltd., and Marmota Energy completed five reverse circulation holes totaling 4,049 feet around the Grass Hollow magnetic anomaly at its Angel Wing project (Ramelius Resources, Ltd., 42%, Marmota Energy 28%, Miranda Gold Corp. 30% joint venture). The anomaly is apparently spatially related to a 2,000-foot long, north-northwest striking resistive trend correlative with intense silicification in conglomerate and underlying limestone units. However, the drilling failed to intercept any discrete epithermal veins or breccias. Significant intercepts included 55 feet averaging 0.062 opt gold, including 20 feet grading 0.09 opt gold and 10 feet grading 0.13 opt gold; and 30 feet averaging 0.05 opt gold, including 10 feet grading 0.14 opt gold. Because of the depth of overburden, the results were not considered sufficiently encouraging to continue exploration, and Ramelius Resources, Ltd., and Marmota Energy withdrew from the joint venture. (Marmota Energy Quarterly Report, 9/30/2013; Ramelius Resources website, www.rameliusresources.com.au; Marmota Energy website, www.marmotaenergy.com.au; Miranda Gold website, www.mirandagold.com)
Gold Circle District
Midas. Newmont Mining Corp. produced 52,195 ounces of gold and 1,368,896 ounces of silver, decreases of 37% and 10% respectively from 2012. The decreases were due to lower throughput and grade. The BLM was issued an environmental assessment involving the proposed construction and operation of up to seven ventilation raises,
access roads, and power lines, and approval for 25 acres for future surface exploration projects. A drilling program was carried out in 2013, but no results were reported. On December 4, 2013, Newmont entered into a stock purchase agreement whereby Klondex Holdings (USA) Inc. would acquire the Midas Mine, mill, and support facilities. (BLM News Release No. ELDO 2013-034 3/21/2013; BLM Environmental Assessment, 3/2013; Newmont Mining Corp. news release, 7/26/2013; Newmont Mining Corp. Form 10-K, 2/24/2014; Newmont website, www.newmont.com; Klondex Mines Ltd. news release, 12/4/2013) Independence Mountains District
Big Springs. Anova Metals, Ltd., of West Perth, Australia, acquired the Big Springs property from MRG Copper, and through its subsidiary Anova Metals USA LLC, drilled eight hydrogeological wells at the 601 pit area in the South Sammy deposit. Details of the drilling program were not released. The company estimated a JORC-compliant inferred mineral resource for each deposit – Beadle Creek, Briens Fault, Dorsey Creek, Mac Ridge, North Sammy, North Sammy Contact, and South Sammy. The estimate of the total inferred resource was 16,300,000 tons grading 0.06 opt gold. The company prepared a plan of operations for the U.S. Forest Service, proposing exploration activities and supporting infrastructure on the previously disturbed areas of the property. The company also was in the process of preparing a plan of operations to mine with an open pit the 601 orebody and mine the 701 orebody underground. (Anova Metals, Ltd., quarterly reports, 4/23/2013, 8/9/2013, 10/31/2013, 1/31/2014; Anova Metals, website, anovametals.com.au; U.S. Forest Service, Scoping and Notice of Proposed Action and Opportunity to Comment, Big Springs Gold Exploration Project, 12/2013)
Jerritt Canyon. Veris Gold Corp. produced 165,000 ounces of gold from 1,024,030 tons with an average ore grade of 0.16 opt gold and 86% recovery rate at its Jerritt Canyon property, an increase of 55% from 2012. The Jerritt Canyon property contains over 22 Carlin-type gold deposits on 119 square miles with production in 2013 mostly coming from the underground Smith, SSX/Steer, and Starvation Canyon Mines. The operation of the Smith Mine was contracted out to Small Mine Development, LLC, which mined 526,180 tons of ore that produced 82,309 ounces of gold. Veris operated the SSX/Steer, which mined 315,707 tons of ore that produced 48,930 ounces of gold. Veris opened Starvation Canyon in the second quarter and mined 76,780 tons of ore averaging 0.21 opt gold that produced 15,750 ounces of gold. The roaster capacity was permitted at 6,000 tons per day. Some of the excess capacity was taken up with toll milling contracts. The company processed 119,030 tons of ore from third parties, mostly from Newmont. The company also entered into a toll milling agreement with Klondex Mines Ltd. for its non-refractory ore from Fire Creek.
22
The company completed a major underground drilling program, drilling 1,733 cubex reverse circulation production holes totaling 216,292 feet at the Smith, SSX, and Starvation Canyon underground mines. In addition, 57 underground core holes totaling 43,670 feet were drilled in the SSX Mine. Most of the drilling was for resource definition. Significant intercepts reported included 50 feet grading 0.23 opt gold, 50 feet grading 0.12 opt gold, and 170 feet grading 0.24 opt gold. (Elko Daily Free Press Mining Quarterly, Spring 2013, Fall 2013; Veris Gold Corp. Annual Information Form, 4/14/2014; Veris Gold Corp. Management Discussion and Analysis, 5/15/2014; Veris Gold Corp. news releases, 7/24/2013, 12/4/2013, 2/27/2014; Klondex Mines, Ltd., news releases, 4/2/2013; Veris Gold Corp. website, www.verisgold.com)
Ivanhoe District
Hollister. The underground Hollister Mine was originally operated by Rodeo Creek Gold, Inc., a subsidiary of Great Basin Gold, Ltd. Due to financial problems, Great Basin Gold, Ltd. voluntarily delisted from the New York Stock Exchange at the beginning of the year. Rodeo Creek Gold, Inc. also went in Chapter 11 bankruptcy, and the Hollister Mine and Esmeralda Mill were auctioned off to Waterton Global Resource Management, Inc. in May. Trial mining ceased in November and the mill near Hawthorne operated until the stockpiles there were depleted. During 2013, 12,359 ounces of gold and 55,648 ounces of silver were produced, decreases of 80% and 82% respectively from 2012. The company laid off 157 workers at the mine and 25 at the mill, but said it was only “pausing production” with resumption expected in early 2016. During the interim, the company was going to conduct resource definition drilling to increase the asset value and extend the mine life. Two underground drill rigs were active earlier in the year, but results were not released. The BLM issued a final environmental impact statement on the company’s proposal to transition the underground exploration project into a full underground mining operation. This would also include 222 acres of surface disturbance involving the Hatter production shaft and other supporting infrastructure. A record of decision was in preparation. (Elko Daily Free Press, 11/26/2013; The Wall Street Journal, 5/22/2013; Elko Daily Free Press Mining Quarterly, Spring 2013; BLM, Final Environmental Impact Statement, 7/2013; BLM, Record of Decision, 5/2014; Waterton Global Resource Management website, www.watertonglobal.com)
Kinsley District
Kinsley Mountain. Pilot Gold, Inc., drilled 43 reverse circulation holes totaling 34,286 feet and 14 core holes totaling 12,290 feet, mainly on its Western Flank target of its Kinsley Mountain project (Pilot Gold, Inc., 78%, Nevada Sunrise Gold Corp. 22%). Significant intercepts included 120 feet averaging 0.25 opt gold, including 25 feet grading 0.86 opt gold; 10 feet averaging 0.46 opt gold; and 19 feet
averaging 0.18 opt gold. Drilling at the Western Flank target identified significant oxide and sulfide gold mineralization along a 1,600-foot, north-south-trending zone. The mineralization is hosted within the Cambrian Dunderberg Shale and Secret Canyon Formation. Mineralization is open and becomes shallower to the south of the Western Flank target over a distance of 500 meters to the Right Spot target, a 1,150-foot long, north-northeast trend of jasperoid outcrops. The BLM released an environmental assessment and record of decision approving the company’s plan of operation to expand the area for exploration and development drilling to up to 70 acres. The area would cover the company’s core group of claims, including the Western Flank, Candland Canyon and extensions trending north-northeast and southwest of the historic pits. (BLM Environmental Assessment, 8/2013; BLM Record of Decision, 9/3/2013; Pilot Gold, Inc., Annual Information Form, 3/17/2014; Pilot Gold, Inc., news release 9/3/2013; Pilot Gold, Inc., website, www.pilotgold.com; Nevada Sunrise Gold Corp. news release, 11/18/2013; Nevada Sunrise Gold Corp. Management Discussion and Analysis, 1/27/2014; Nevada Sunrise Gold Corp. website, www.nevadasunrise.ca) Montello District
Lewis Spring. West Kirkland Mining Inc. drilled seven reverse circulation holes on its Lewis Spring property in T38-39N, R67E. Gold anomalies had been discovered previously in stream sediments, but the drill results did not warrant further exploration. (West Kirkland Mining Inc. news release, 4/25/2013; West Kirkland Mining Inc. website, www.wkmining.com)
Pequop District
Long Canyon. Newmont Mining Corp. continued exploration and development of the company’s Long Canyon Project, completing approximately 235,000 feet of drilling. Newmont released its first reserve estimate on Long Canyon based on drilling through the end of 2013. The probable reserve is 15,700,000 million tons grading 0.065 opt of gold, for a total of 1,010,000 ounces. There is another 358,900 ounces of gold categorized as mineralized material. In the proposed mine plan, the Long Canyon deposit is three miles long and up to 2,500 feet wide. A draft environmental impact statement was in preparation for release in early 2014. Construction of the open pit mine and support facilities would take 18 months, mining 8 to 13 years, and reclamation several years after that. Production is expected to start up in 2016 with full production in 2017. The ore is oxide with the lower grade ores to be processed by heap-leaching and the higher grade ores with an oxide mill. (BLM Draft Environmental Impact Statement, 3/21/2014; Elko Daily Free Press Mining Quarterly, Summer 2013, Summer 2014; Newmont Mining Corp. Form 10-K, 2/21/2014; Newmont website, www.newmont.com)

23
Pequop West. Agnico Eagle Mines Ltd. (joint venture with Newmont continued to explore and drilled its West Pequop project. No results were released. (Agnico Eagle website, www.agnicoeagle.com)
Summit. Agnico Eagle Mines Ltd. (joint venture with Newmont) carried out a small drilling project at its Summit project, adjacent and north of Newmont’s Long Canyon project. No results were released. (Agnico Eagle website, www.agnicoeagle.com)
Wood Hills South. NuLegacy Gold Corp. completed 5 reverse circulation holes totaling 4,020 feet on its Wood Hills South property (NuLegacy Gold Corp. 70%, Renaissance Gold, Inc. 30%), located eight miles southwest of the Long Canyon and West Pequop properties. This drilling was a follow-up to holes drilled in 2011 and 2012, which tested geophysical and soil geochemical anomalies, many of which intersected anomalous gold. Two holes encountered zones of anomalous gold concentrations. NuLegacy terminated the joint venture and returned the property to Renaissance Gold. (NuLegacy Gold Corp. news release 4/9/2013; NuLegacy Gold Corp. website, nulegacygold.com; Renaissance Gold, Inc. website, www.rengold.com)
Pilot Peak District
South Pilot. Newmont Mining Corp. drilled 10 to 12 holes on its Pilot Peak Project on the southwest side of the Pilot Range. The company acquired the property through its acquisition of Fronteer Gold in 2011. No details were released and the claims were not renewed by year’s end. (BLM LR2000 database; Newmont website, www.newmont.com)
Railroad District
Railroad-Pinion. Gold Standard Ventures Corp. completed 13 core holes totaling 21,738 feet on its Railroad and Pinion Project at a cost of $6,134,695. Eleven of the holes totaling 18,581 feet were drilled into North Bullion zone. Significant intercepts included 241 feet averaging 0.11 opt gold, including 25 feet grading 0.35 opt gold; and 322 feet averaging 0.095 opt gold, including 56 feet grading 0.29 opt gold. The drilling extended the North Bullion zone to a strike length of 3,200 feet long and a width of 1,000 feet. Mineralization at the North Bullion deposit remained open to the north and west, suggesting a west-northwest structural control. Two of the holes totaling 3,157 feet were drilled into the Central Bullion skarn. Significant intercepts included 22 feet grading 1.73 opt silver, 0.75% copper, 0.13% molybdenum, 0.24% lead, and 0.23% zinc; 14.5 feet grading 6.71 opt silver, 0.29% copper, 0.22% lead, and 0.64% zinc; and 26 feet grading 0.008 opt gold, 0.29 opt silver, 0.19% copper, 0.21% zinc. (Gold Standard Ventures Corp. news releases, 5/13/2013, 9/19/2013, 11/5/2013, 1/22/2014, 9/10/2014; Gold Standard Ventures Corp.
Audited Financial Statements, 3/31/2014; Gold Standard Ventures Corp. Annual Information Form, 3/31/2014; Gold Standard Ventures Corp. NI43-101 Technical Report, 3/31/2014; Gold Standard Ventures website, goldstandardv.com)
Snake Mountains
Claim Staking. Newmont staked 2,093 claims in the Snake Mountains, north of Wells. The claim block covers parts of nine townships in, mainly in areas Paleozoic carbonate rocks. Barite has been the only significant commodity mined in the Snake Mountains. (BLM LR2000 database)
Spruce Mountain District
Spruce Mountain. Renaissance Gold Inc., completed nine reverse circulation holes totaling 8,160 feet at its Spruce Mountain project. Summit Mining Exploration, Inc., (a subsidiary of Sumitomo Corporation) funded the drilling. The program followed up on drilling conducted in 2011 and 2012 and tested three areas. The program drilled two holes along the periphery of the Sprucemont porphyry molybdenum system, five holes in the Santa Fe target about 0.6 miles northwest of Sprucemont, and two holes on a geophysical anomaly in the shallow pediment two to three miles north along the range front. Based on poor drilling results, Summit Mining Exploration decided to discontinue funding and withdrew from the joint venture. Mineralization at Spruce Mountain occurs as base metal-silver veins, polymetallic skarns, quartz stockwork zones, replacement deposits, silicified breccia bodies, jasperoids, and gossans hosted by Paleozoic carbonate and siliciclastic rocks, especially in karst, solution collapse breccias, and shear zones. (Renaissance Gold, Inc., news releases, 11/13/2013, 6/17/2014; Renaissance Gold, website, www.rengold.com)
Tecoma District
Twelvemile. Newmont Mining Corp. drilled no more than 12 holes on its Twelvemile Project. The company acquired the property through its acquisition of Fronteer Gold in 2011. No details were released. (BLM LR2000 database; Newmont website, www.newmont.com)
West of the Tecoma District
12 Mile. West Kirkland Mining Inc. drilled seven reverse circulation holes were drilled on its 12 Mile property and intercepted a new shallow zone of mineralization. Significant intercepts reported were 60 feet grading 0.007 opt gold and 90 feet averaging 0.006 opt gold and 0.23 opt silver. (West Kirkland Mining Inc. news release 4/25/2013; West Kirkland Mining Inc. Management Discussion and Analysis, 4/30/2014; West Kirkland Mining Inc. website, www.wkmining.com)
24
Bandito. West Kirkland Mining Inc. completed four reverse circulation holes on its Bandito property adjacent to the 12 Mile property (joint venture with Rubicon Minerals Corp.). One hole intercepted 40 feet grading 0.028 opt gold and 0.15 opt silver. The remaining three holes returned no significant assays. (West Kirkland Mining Inc. news release 4/25/2013; West Kirkland Mining Inc. Management Discussion and Analysis, 4/30/2014; West Kirkland Mining website, www.wkmining.com)
ESMERALDA COUNTY Divide District
Hasbrouck Mountain. No drilling was conducted in 2013, however, West Kirkland Mining Inc. conducted negotiations with Allied Nevada Gold Corp. to acquire a 75% interest in the Hasbrouck Mountain and Three Hills properties. (West Kirkland Mining Inc. news release 2/24/2014; West Kirkland Mining website, www.wkmining.com) Gilbert District
Castle Black Rock. Wolfpack Gold Corp., a subsidiary of Tigris Uranium Corp., released a 43-101 technical report detailing the Castle Black Rock property. The Castle Black Rock property includes the Boss and Castle deposits. No drilling had been done since 1995, but the old data were used to estimate an inferred resource of 16,185,000 tons grading 0.013 opt gold. (Tigris Uranium Corp., 43-101 Technical Report, 4/3/2013; Wolfpack Gold Corp. Audited Financial Statement, 4/29/2014; Wolfpack Gold website, www.wolfpackgold.com)
Eastside. Columbus Gold Corp. completed 24 angled reverse circulation holes totaling 17,605 feet in two phases of drilling on its Eastside Project 20 miles west of Tonopah. Overall, the mineralization is associated with the margins of a highly altered Tertiary rhyolite dome. Mineralization in the West zone is associated with silicification and quartz stockworks along a steep, northerly-trending fault. The West zone is at least 1,969 feet long and remains completely open to the south. Mineralization in the East zone is higher grade and is associated with brecciation, silicification, and quartz stock works along or near one or more, northerly-striking, west-dipping fault structures. The East zone is also open to the south and southwest, and is open to the north at depth. Significant intercepts included five feet grading 0.377 opt gold, five feet grading 0.27 opt gold and 40 feet grading 1.59 opt silver. (Columbus Gold Corp. news releases, 10/17/2013, 2/19/2014; Columbus Gold Corp. Management Discussion and Analysis, 1/10/2014, 2/21/2014; Columbus Gold website, www.columbusgoldcorp.com)
Goldfield District
Goldfield. International Minerals Corp. drilled its Goldfield property in 2013, but no details were released. The company issued an updated feasibility study as a 43-101 technical report proposing an open pit mine for the Gemfield deposit. In December, International Minerals Corp. was bought out by Hochschild Mining, PLC, and its Nevada properties were acquired by Chaparral Gold. (Chaparral Gold news release, 12/20/2013; International Minerals Corp. Annual Information Form, 9/30/2013; International Minerals Corp. NI43-101 Technical report, 7/25/2013; Chaparral Gold website, www.chaparralgold.com).
Silver Peak District
Mineral Ridge. Mineral Ridge Gold LLC, a subsidiary of Scorpio Gold Corp., produced 39,160 ounces of gold and 14,975 ounces of silver from the Mary and Drinkwater pits at the Mineral Ridge Mine (Scorpio Gold Corp. 70%, Waterton Global Value L.P., 30%). 995,748 tons of ore were processed with a head grade of 0.068 opt gold. The cash cost was $734 per ounce of gold.
The company drilled 255 holes, mostly reverse circulation, totaling 78,300 feet. Of that, 6,550 feet of the drilling contained average grades greater than the mine’s internal cut-off grade of 0.010 opt gold. The areas targeted included the Mary Last Chance (LC) area, the Mary Pit infill, the Northwest Highwall in the Drinkwater Pit, and the Northwest Brodie, Bluelite, Solberry, and Oromonte deposits. Significant intercepts reported at Mary/LC included 10 feet grading 0.153 opt gold, 15 feet grading 0.087 opt gold, and 20 feet grading 0.084 opt gold from three holes. Ten holes were completed in the Northwest Highwall of the Drinkwater Pit to test the possible continuation of the ore trend to the northwest of and down dip from the Drinkwater pit. The program had “moderate success”, and the area will be evaluated for a future drilling campaign. Nine holes were drilled at Northwest Brodie, and 22 were drilled at Bluelite. Both programs intercepted new mineralized intervals. The mineralization at Northwest Brodie is open ended in all directions, and the mineralization in the Bluelite area is open ended to the west and northwest. Significant intercepts reported at Brodie included five feet grading 0.139 opt gold, 5 feet grading 0.119 opt gold, and 10 feet grading 0.09 opt gold from three holes. Significant intercepts reported at Bluelite included five feet grading 0.104 opt gold, 10 feet grading 0.061 opt gold, and 10 feet grading 0.045 opt gold from three holes. Twelve holes were completed at Solberry, which significantly expanded the known mineralized area and showed it to be open to the north, west and south. Four holes were drilled in the Oromonte area, which confirmed a deep mineralized zone open in three directions. In-fill drilling was also conducted around the Mary Pit, which converted waste tons to mineable tons.
The company released a 43-101 technical report on the geology and mineral resources of the satellite deposits:

25
Bluelite, Brody, Solberry, and Wedge. Mineralization at Mineral Ridge, including the Bluelite, Brodie, Oromonte, Solberry and Wedge Satellite areas, is mainly associated with milky quartz veins and lenses accompanied by local argillization and some sericitization. Individual zones typically comprise several higher grade quartz veins from five to 30 feet thick with some up to 50 feet thick. These zones are surrounded by a lower grade envelope of mineralization. Mineralization is hosted in the lower unit of the Wyman Formation near its contact with the crystalline basement rocks and is structurally controlled. The gold mainly consists of native gold and electrum in quartz. The gold to silver ratio is typically near 2:1.
The BLM was preparing an environmental assessment on the company’s plan of operation. The proposal includes expansion of plan of operation boundary and the size of two existing pits, addition of or changes to eight waste rock disposal areas, and an increase in stacking height of ore on the existing leach pads. (BLM news release BMDO 2014-16, 12/20/2013; Scorpio Gold Corp. news releases, 12/16/2013, 2/11/2014, 2/25/2014; Scorpio Gold Corp. Management Discussion and Analysis, 4/17/2014, 5/20/2014; Scorpio Gold Corp. 43-101 Technical Report, 9/26/2013; Scorpio Gold website, www.scorpiogold.com)
Tokop District
Tokop. Global Geoscience, Ltd., completed seven widely spaced reverse circulation holes totaling 4,654 feet on its Tokop property in T7N, R42E. The holes were aligned along a portion of 1.2 mile-long, northeast-trending prospective zone. Significant intercepts of oxidized mineralization included 40 feet grading 0.07 opt gold 62 feet grading 0.04 opt gold and 90 feet grading 0.02 opt gold. The gold mineralization occurs adjacent to and within a multi-phase Jurassic granite stock that has intruded probable Proterozoic and Cambrian limestone and mudstone. Skarn generally crops out within 1,000 feet of the stock. The mineralization is associated with sheeted and stockwork quartz veins, quartz-sericite alteration, and high levels of silver, arsenic, bismuth, molybdenum, tellurium and tungsten. (Global Geoscience, Ltd., Quarterly Activities Report, 10/30/2013; Global Geoscience, Ltd., news release, 9/16/2013; Global Geoscience, website, www.globalgeo.com.au)
Tonopah District
Three Hills. Allied Nevada Gold Corp. completed eight metallurgical core holes totaling 3,509 feet within the main deposit footprint at the Three Hills property. West Kirkland Mining Inc. conducted negotiations with Allied Nevada Gold Corp. to acquire a 75% interest in the Three Hills and the Hasbrouck Mountain (Hasbrouck Mountain is in the Divide District about five miles to the south) properties. (West Kirkland Mining Inc. 43-101 technical report, 2/21/2014; West Kirkland Mining Inc. news release 2/24/2014; Allied Nevada Gold Corp. Form 10-K,
2/27/2014; Allied Nevada Gold Corp. website, www.alliednevada.com; West Kirkland Mining website, www.wkmining.com) EUREKA COUNTY Antelope District
Red Canyon. CMQ Resources, Inc., completed three reverse circulation holes totaling 2,170 feet on its Red Canyon property (joint venture with Miranda Gold Corp.). The best intercepts were 10 feet grading 0.0013 opt gold and 15 feet averaging 0.001 opt gold in two holes. (CMQ Resources Inc. Management and Discussion Analysis, 11/29/2013, 4/29/2014; CMQ Resources website, www.cmqresources.com).
Antelope Valley
Antelope Valley. Barrick Gold Corp. drilled an unknown amount of holes on its large claim block in Antelope Valley west of the Mahogany Hills. No results were released. (Barrick website, www.barrick.com)
Buckhorn District
Claim Staking. Barrick Gold Corp. staked 201 claims along the east side of the Northern Nevada Rift northeast of Goldrush deposit and northwest of Agate Pass in the Cortez Mountains. The claim block occurs mainly in T27N, R49E in an area mainly covered by Tertiary sedimentary rocks and basalt. (BLM LR2000 database)
Cortez Summit. Carlin Gold Corp. re-entered one of the reverse circulation holes (1,760 feet deep) drilled in 2012 and deepened it with core drilling to 4,032 feet on its Cortez Summit property located 0.6 miles northeast of Barrick Gold Corp.’s Goldrush deposit and 0.6 miles west of the old Buckhorn Mine. The depths of the 2012 holes ranged between 1,500 feet and 1,800 feet. The target of the deepening was lower plate carbonate rocks. The bottom 900 feet consisted of variably calcareous mudstone and sandstone, and silty to sandy, laminated, variably carbonaceous limestone locally containing decalcification, clay alteration, and calcite veining. Short intervals of up to 0.0195 opt gold were encountered. The bottom 650 feet was determined to be Devonian in age and are likely the informally named “Horse Canyon formation”, which hosts the upper part of the Cortez Hills ore body. (Carlin Gold Corp. news release, 9/15/2013, 1/15/2014, 9/8/2014; Carlin Gold Corp. Management Discussion and Analysis, 2/28/2014; Carlin Gold website, carlingold.com)
Cortez District
Goldrush. Barrick Gold Corp. continued exploration at its Goldrush deposit about 4 miles southeast of its Cortez Hills mine. The company completed 86 exploration holes totaling
26
231,670 feet at its Cortez land holdings on the southeast side of Crescent Valley, including Goldrush and Cortez Hills. The drilling at Goldrush upgraded the resource base and was focused on establishing confidence in the continuity of the higher grade portions of the deposits. The strike length of the deposit has been expanded to almost 4.5 miles in a northwest directions. The deposit remains open in multiple directions. Drilling in 2013 encountered deep, very high grade mineralization which expanded the size and grade potential to the north. A significant intercept reported across this mineralization was 103 feet grading 0.725 opt gold. Mineralization occurs in the same Devonian carbonate stratigraphy as the Cortez Hills deposit. Measured and indicated resources at Goldrush increased by 1.6 million ounces to 10 million ounces at an average grade of 0.132 opt gold, while inferred resources stood at 5.6 million ounces. Goldrush is one of the highest grade giant gold discoveries made worldwide since 2001 and was the recipient of the Prospectors and Developers Association of Canada’s prestigious Thayer Lindsley award for an international mineral discovery. (Barrick Gold Corp. Management Discussion and Analysis, 8/1/2013; Barrick Gold Corp., Annual Report, 3/31/2014; Barrick Gold Corp. Annual Information Form, 3/31/2014; Barrick Gold website, www.barrick.com) Eureka District
Ruby Hill. Barrick more than doubled its production of gold and silver at Ruby Hill, producing 91,074 ounces of gold and 76,283 ounces of silver in 2013. The production increase was due to increased ore grade. The metallurgical recovery was 70.1% at a cut-off grade between 0.004 and 0.009 opt gold. Mining was halted due to a high wall failure at the bedrock-alluvium contact in the East Archimedes Pit on November 2, which sent 4,000,000 to 5,000,000 tons of alluvial material down to the pit floor. Engineers had been monitoring it for weeks and halted mining the night before. No one was injured, and no equipment was damaged. Barrick drilled an unknown amount of exploration holes in their land holdings surrounding the mine. No results were released. (Elko Daily Free Press, 6/2/2014; Elko Daily Free Press Mining Quarterly, Spring 2013, Winter 2013; Homestake Mining Co. of California Environmental Assessment, 8/2012; Barrick Gold Corp., Management Discussion and Analysis, 4/30/2014; Barrick Gold Corp., Annual Report, 3/31/2014; Barrick Gold Corp. Annual Information Form, 3/31/2014; Barrick Gold website, www.barrick.com)
Gibellini District
Gibellini. American Vanadium Corp. spent almost $4,261,045 on its Gibellini vanadium project in the southern Fish Creek Range, most of it towards environmental permitting, metallurgical testing, engineering, procurement, and construction management. In December 2012, the company submitted its plan of operation to the BLM and
Nevada Division of Environmental Protection to construct a mine at Gibellini. The plan of operation includes the design for an open pit mine, processing facilities, and a reclamation plan. It incorporates a number of outputs for high purity vanadium products including electrolyte for the vanadium flow battery market. Once approved, the operation would begin producing 11,000,000 pounds vanadium pentoxide (V205) per year and have a mine life of eight years. The BLM began preparations for an Environmental Impact Statement. American Vanadium also owns four other nearby vanadium properties. These include the Del Rio Project made up of 120 claims about eight miles south of Gibellini and the Hot Creek Project made up of 18 claims on vanadium-bearing shale south of Del Rio. (Elko Daily Free Press Mining Quarterly, Spring 2013; BLM Battle Mountain District Office news release 2013-10, 4/22/2013; American Vanadium Corp. Management Discussion and Analysis, 4/29/2014; American Vanadium Corp. Audited Financial Statements, 4/29/2014; American Vanadium website, www.americanvanadium.com)
Lynn District
Northern Carlin Trend. Newmont Mining Corp. continued open-pit mining at the Lantern, East Carlin, and Payraise open pits. Payraise is about 2,000 long by 800 feet wide, and consists of two parts, the North Phase (originally part of West Genesis) and the South Phase. Mining at Payraise was expected to end in 2014. Most of the ore was oxide grading 0.07 opt gold. Most of the ore went to leach pads, with ore greater than 0.05 opt gold going to Mill 5. Mining at East Carlin went deep to mine out material left in from underground mining. The company used remote drills and cameras to find and map these voids.
Underground mining continued at the Pete Bajo deposit, which began production in 2011. The portal is at the bottom of the 500-foot deep Pete pit, and the deposit is 350 feet below the portal. An extension called Fence was discovered in 2012, which will extend the life of the mine to 2018. The Fence deposit is 500 feet below and 1,000 feet north of the Pete Bajo deposit. It is at least 3,000 feet long by 1,000 feet wide and 1,350 feet below the surface with the ore grading 0.2 opt gold. The ore is hosted in the Roberts Mountain Formation. Production at Fence began in May of 2013.
The company spent $83,000,000 on the Turf Vent Project. This involved sinking a 26-foot diameter third shaft down 2,050 feet and will take three years to complete. It will double the ventilation and provide another escapeway as the Leeville underground workings are expanded northward. North Exodus was another advanced project that Newmont was spending money on development and feasibility studies. Other new projects that Newmont was evaluating included Green Lantern, North Lantern, and Lantern 3. The life of the mines in the Genesis area was projected out to 2032. Newmont’s Carlin land holdings contain 23 present and future pits. (Elko Daily Free Press Mining Quarterly,

27
Fall 2013, Winter 2013; Newmont Mining Corp. Form 10-K, 2/21/2013; Newmont website, www.newmont.com)
Goldstrike. The total production at Barrick Gold Corp.’s Goldstrike operation (Betze-Post, Meikle, and Storm) was 891,570 ounces of gold, a drop of 24% from 2012. About 96,286,000 tons of ore was mined at an average gold grade of 0.146 opt gold. The total operating cost for gold was $606 per ounce and the all-in sustaining cost was $901 per ounce, increases of 17% and 12% respectively from 2012. The reported production from Goldstrike includes open pit production from the Betze-Post open pit and underground production from the underground Meikle mine, from which ore from several underground ore bodies are mined. Production from the Betze-Post open pit decreased 36% in 2013 to 521,489 ounce of gold. Metallurgical recovery was 78.6% with a cut-off grade of 0.045 to 0.06 opt gold. Underground production from Meikle was 360,578 ounces of gold in 2013, and increase of 10%. Metallurgical recovery for the underground ore was 87.5% with a cut-off grade of 0.1 to 0.22 opt gold. Of the estimated 13,412,000 contained ounces of gold in the reserves and resources, 64% are open pit and 36% are underground. The remaining life for the open pit was estimated to be 13 years, and 11 years for the underground mine. With regard to new resources, the company rarely releases details of its drilling and exploration programs.
The Goldstrike property has two processing facilities, an autoclave to treat non-carbonaceous sulfide or refractory ore, and a roaster to treat carbonaceous ore. These two facilities process the ore from both the open and underground mine, and have a combined capacity of about 33,000 to 35,000 tons per day. The gold is recovered and processed into doré on-site and shipped to outside refineries for processing into gold bullion. Because of increasing carbonate in the ore being mined, the pressure oxidation process in the autoclaves was converted from an acid to an alkaline circuit. Barrick was also converting to a process that uses thiosulfate to leach gold after pressure oxidation as opposed to cyanide, which would allow by-passing of the roaster and continued use of the autoclaves through to the end of the life of the mine. This will allow for earlier processing of stockpiled carbonaceous material and increase the capacity to process ore from other properties. (Barrick Gold Corp., Management Discussion and Analysis, 3/6/2014; Annual Report, 3/31/2014; Barrick Gold Corp. Annual Information Form, 3/31/2014; Barrick Gold website, www.barrick.com)
Maggie Creek District
Gold Quarry. Newmont Mining Corp. nearly finished mining the Phase 4 layback in the Gold Quarry pit, where ore with grades of 0.25 opt gold will be mined from the bottom of the pit. Mining began at the Phase 7 layback, which contains between 350,000,000 and 400,000,000 tons of material. It will take five years to mine Phase 7. The life of the mine was estimated to be out to 2028. In 2013 the
Gold Quarry pit reached 1.5 miles wide and 1,700 feet deep. After being put on hold for about ten years, Newmont began to evaluate remaining potential at the Tusc and Mac deposits, which were mined between 1995 and 1999. Drilling was conducted at Tusc in search of a potential layback. Four holes returned good results, though the details were not released. (Elko Daily Free Press Mining Quarterly Spring 2013, Winter 2013; Newmont Mining Corp. Form 10-K, 2/21/2014; Newmont website, www.newmont.com) Monitor Range
North Monitor Pediment. Barrick Gold Corp. staked 1,087 claims at the north end of the Monitor Range and the pediment to the north of the range. The claims occur near Highway 50 and cover parts of five townships, T18N,R49E; T18N,R50E;, T19N, R49E; T19N, R50E, T20N, R49E. (BLM LR2000 database)
Mount Hope District
Mount Hope. General Moly Inc. (joint venture with POS-Minerals) began construction of its Mount Hope open pit mine in 2013. Construction activities included cultural clearance, clearing and grubbing, wood harvesting, and the development of early construction water. Ames Construction had cleared and grubbed approximately 1,800 acres in preparation for starting major earthworks. However, construction activities came to a halt soon after they started. In March of 2013, General Moly suspended work on a $665 million loan from its Chinese partner, Sichuan Hanlong Group, after a report that Hanlong’s chairman, Liu Han, was detained by Chinese officials. In August General Moly terminated its agreement with Hanlong. General Moly is actively looking for another source of financing. If constructed, the life of the Mount Hope mine is estimated to be 41 years and would produce an estimated 1,200,000,000 pounds of molybdenum. (Bloomberg news, 3/21/2013; Elko Daily Free Press Mining Quarterly Spring 2013, Summer 2013; General Moly Inc. NI43-101 Technical Report, 1/15/2014; General Moly Inc. Form 10-K, 3/13/2014; General Moly website, www.generalmoly.com)
Northern Simpson Park Mountains
Red Hill. NuLegacy Gold Corp. (various agreements with Barrick Gold Corp., and Idaho Resources Corp.) completed five reverse circulation holes defining its Iceberg deposit in the “central mineralized zone” on what is Barrick’s portion of the Red Hill property. Significant intercepts included 135 feet averaging 0.03 opt gold, including 20 feet grading 0.16 opt gold; 55 feet averaging 0.015 opt gold, including 15 feet grading 0.032 opt gold; and 75 feet averaging 0.021 opt gold, including 30 feet grading 0.032 opt gold in three holes. The drilling discovered a new zone of oxide gold mineralization zone at least 1,140 feet of strike length, which extended the “central mineralized zone” northward

28
for a total strike length of 2,500 meters in a north-northwest direction. The high grade zone of oxide gold mineralization within the Iceberg deposit is hosted by decalcified and silicified Devonian carbonate rocks. The property covers about 40 square miles within the JD lower plate window. The company terminated an agreement that covers the portion of the property that is controlled by Miranda Gold Corp., which includes the separate Coal Canyon property located about four miles to the west. (NuLegacy Gold Corp. news release, 6/26/2013; NuLegacy Gold Corp. Management Discussion and Analysis 11/27/2013, 7/28/2014; NuLegacy Gold website, www.nulegacygold.com; Miranda Gold Corp. news release, 1/28/2013; Miranda Gold website, www.mirandagold.com)
HUMBOLDT COUNTY Awakening District
Sleeper. Paramount Gold and Silver Corp. completed 11 holes totaling 25,831 feet on its Sleeper property. Significant intercepts reported were 80 feet grading 0.042 opt gold and 0.055 opt silver and 46 feet grading 0.013 opt gold and 0.067 opt silver from one hole west of the Pad zone below the old Sleeper pit. The hole was for metallurgical purposes. Other significant intercepts included 150 feet averaging 0.017 opt gold and 0.127 opt silver, including 75 feet grading 0.026 opt gold and 0.182 opt silver from one hole in the Facility/Sleeper area; and 1,000 feet averaging 0.032 opt gold and 0.306 opt silver, which included 223 feet grading 0.035 opt gold and 0.96 opt silver from a hole in the West Wood area. (Paramount Gold and Silver Corp. press release, 8/1/2013; Paramount Gold and Silver Corp. 10-Q Forms, 2/6/2013, 5/5/2013, 2/5/2014; Paramount Gold and Silver Corp. 10-K Form, 9/9/2013; Paramount Gold and Silver website, www.paramountgold.com).
Battle Mountain District
Marigold. Goldcorp Inc. produced 161,062 ounces of gold from its Marigold Mine (Goldcorp 66.67%, Barrick 33.33%), an increase of 12%. The company mined 11,280,000 tons of ore with a waste to ore ratio of 2.5, mainly from the Target II pit and from Phase 1 of the Mackay pit. The average grade was 0.01 opt gold, down from 0.016 opt gold in 2012, and the average recovery rate was 73%. Total operating cash cost was $914 per ounce, up from $776 in 2012. The all-in sustaining cost was $1503 per ounce. No details were published, but development drilling was conducted on the Herco-North, Hercules, Mackay Phase I, and Red Dot deposits. Stripping of the Phase I of the Mackay pit was also conducted. Proposed expansion of the Mackay pit would result in a long, thin pit extending for three miles and would take in the Target III and Get ‘Er Done pits, the Red Dot Resource, and part of the Section 19 resource, which is owned by the University of Nevada, Reno. The Basalt Phase 7 and Phase 8 pits were in the process of being backfilled early in 2013. The life of the
mine was estimated to be last until 2030. At year’s end, Goldcorp and Barrick were in the process of selling Marigold to Silver Standard Resources, Inc. (Barrick Gold Corp. Annual Information Form, 3/31/2014; Goldcorp Inc. Annual Information Form, 3/31/2014; Goldcorp Inc. news release, 4/4/2013; Goldcorp Inc. Management Discussion and Analysis, 5/2/2013, 7/25/2013, 10/4/2013, 2/14/2014; Elko Daily Free Press Mining Quarterly Fall 2013; Goldcorp website, www.goldcorp.com; Silver Standard website, www.silverstandard.com) Buffalo Mountain District
Brooks. Newmont Mining Corp. drilled about a dozen holes on its Brooks Project about three miles southwest of the Lone Tree Mine. No results were released. (M. Ressel, oral communication, 10/30/2014; BLM LR2000 database; Newmont website, www.newmont.com) Converse. International Minerals Corp. reported no drilling on its Converse property in 2013. In December, International Minerals Corp. was bought out by Hochschild Mining PLC, and its Nevada properties were acquired by Chaparral Gold. (Chaparral Gold news release, 12/20/2013; International Minerals Corp. Annual Information Form, 9/30/2013; Chaparral Gold website, www.chaparralgold.com). Lone Tree Complex. Newmont Mining Corp. produced 22,931 ounces of gold and 4,970 ounces of silver from its Lone Tree Complex, decreases of 23% and 14% respectively from 2012. The mine is in closure and production is coming from the leach pads. (Newmont Mining Corp. Form 10-K, 2/21/2014; Newmont website, www.newmont.com)
Gold Run District
Adelaide. Wolfpack Gold Corp., a subsidiary of Tigris Uranium Corp., released a 43-101 technical report, and late in 2013, completed a Phase I drilling program consisting of seven reverse circulation holes totaling 4,051 feet on its Adelaide project. The gold-silver mineralization occurs in epithermal banded quartz-adularia-sulfide veins with electrum, which are hosted by the Cambrian Preble and Ordovician Valmy Formations. The mineralization occurs along the north-trending Adelaide fault zone. The main veins trend north-northwest, dip 70 to 85°W, and converge and diverge along strike and include splays and stockwork zones. The more prominent veins are generally four to six feet wide, with the Crown, Recovery and Margarite veins having been previously mined. Significant intercepts included 5 feet grading 1.17 opt Au and 3.06 opt Ag, 15 feet grading 0.06 opt Au and 8.3 opt Ag, and 5 feet grading 0.11 opt Au and 21 opt Ag. (Tigris Uranium Corp., 43-101 Technical Report, 4/8/2013; Wolfpack Gold Corp. news release, 2/26/2014; Wolfpack Gold Corp. Management

29
Discussion and Analysis, 4/29/2014; Wolfpack Gold website, www.wolfpackgold.com).
Mill City District
North Eugene. Newmont Mining Corp. drilled 3 holes on its North Eugene Project on the north end of the Eugene Mountains. No results were released. (M. Ressel, oral communication, 10/30/2014; BLM LR2000 database; Newmont website, www.newmont.com)
National District
Buckskin-National. Volcanic Gold and Silver LLC, submitted to the U.S. Forest Service a plan of operation to conduct exploration drilling at its Buckskin-National project. The plan was approved, but it is unknown whether any holes were drilled in 2013. (U.S. Forest Service Decision Memo, 9/12/2013) Potosi District
Pinson. Atna Resources, Ltd., produced 5,183 ounces of gold from its Pinson underground mine. Mixed sulfide/oxide ores were processed with the roaster at Veris Gold’s Jerritt Canyon mine. Oxide ore was processed at the mill at Newmont’s Twin Creek mine. The main ore zones are the Ogee, Range Front, Adams Peak, and CX. The deposits are structurally-controlled Carlin type deposits. Only ore in the Ogee Zone has been developed and mined. The Company spent $22,200,000 on underground development, equipment, buildings, and other infrastructure, but no drilling was reported. During 2012 and 2013, 4,100 feet of development was completed with a primary spiral driven from the 4650 adit level to the 4530 level 120 feet below the mine portal. Both top cut and underhand ore mining occurred in three Ogee Zone stope blocks. Contract miners using their own underground mining equipment were hired to do the mining. On June 15, the mine was placed on care and maintenance, and all development activities ceased until market conditions improved, additional financing was available, and additional mine design and engineering studies had been conducted. Lower than expected ore-mining productivity during development was also a factor. Despite the shutdown, the company was proceeding with a feasibility study for development of the Mag open pit mine. (Atna Resources Ltd., Form 20-F Annual report, 3/18/2014; Atna Resources Ltd., Management Discussion and Analysis, 5/13/2013, 7/31/2013; Atna Resources Ltd., news release, 6/23/2013; Atna Resources website, www.atna.com)
Turquoise Ridge. The Turquoise Ridge Mine, which is operated by Barrick, (75% Barrick, 25% Newmont), produced 223,189 ounces of gold, an increase of 16% from 2012. The increase was due to 15% more tons mined. The average grade of the mined ore was 0.49 opt gold. The metallurgical recovery was 92%, and the all-in sustaining cost was $927 per ounce. Almost all of the mining was done
underground with some minor surface mining. The ore is processed at the Sage Mill at Twin Creeks Mine. A significant amount of drilling was carried out in 2013, mainly underground drilling in North Zone, but no results were released. (Elko Daily Free Press Mining Quarterly, Spring 2013, Spring 2014; Barrick Gold Corp., Form 40-F, 3/31/2014; Barrick Gold Corp. Annual Information Form, 3/31/2014; Barrick Gold Corp. website, www.barrick.com; Newmont Mining Corp. Form 10-K, 2/21/2014; Newmont website, www.newmont.com)
Twin Creeks. Newmont Mining Corp. produced 406,847 ounces of gold. Mining commenced at Cut 23 layback at the north end of the Mega Pit late in the year. The first ore will be reached in 2015, and the layback is expected be mined through 2017 with 527,000 ounces of gold expected to be recovered. The mine life was projected to last through 2022, but the company was conducting an extensive exploration drilling program with many potential targets to expand the Mega and Vista pits. The all-in sustaining cost reported for the first quarter of 2013 was $792 per ounce. (Elko Daily Free Press, 3/20/2014; Newmont Mining Corp. Management Discussion and Analysis, 4/25/2014; Newmont Mining Corp. Form 10-K, 2/24/2014; Newmont website, www.newmont.com)
Sulphur District
Hycroft. Allied Nevada Gold Corp. produced 181,941 ounces of gold and 858,073 ounces of silver from the company’s Hycroft Mine in 2013, a significant increase over 2012. The adjusted operating cash cost was $855 per ounce, an increase of 34% from 2012. The mine moved 82,041,000 tons of material, including 45,557,000 tons of ore that was placed on the leach pad and another 3,515,000 tons of ore that was stockpiled. The average grade was 0.011 opt gold and 0.219 opt silver. Allied drilled 232 holes, totaling 119,185 feet, with a focus on metallurgical drilling in the Lewis Pad, Central, and Brimstone areas, geotechnical and hydrology drilling in support of construction activities, step out drilling from the Bay, Central and Brimstone areas, and targeting oxide ore proximal to current reserves. The 2013 drill program was directed towards the following items: 15% hydrology; 5% facility design and geotechnical, 21% production support, 5% oxide targets, and 54% infill, step-out, and metallurgy.
The BLM had issued a final environmental impact statement and a record of decision approving the company’s proposed expansion of mining at the Brimstone, Cut-5, Bay, and Central, zones the operation of the north and south leach pads, and infrastructure upgrades. This prompted the company to implement a two-stage expansion project. Loading of the new North leach pad began in May, but the completion of a crushing facility that was under construction and that of other expansion projects were put on hold due to declining metal prices and lower than expected cash flow. (BLM Final Environmental Impact Statement, 7/2012; BLM Record of Decision, 8/2012; Elko

30
Daily Free Press Mining Quarterly, Winter 2013; Allied Nevada Gold Corp. Management Discussion and Analysis, 8/7/2013, 11/6/2013; Allied Nevada Gold Corp. Form 10-K, 2/27/2014; Allied Nevada Gold Corp. 43-101 technical report, 5/21/2014; Allied Nevada Gold website, www.alliednevada.com)
LANDER COUNTY Battle Mountain District
Copper Basin. Newmont Mining Corp. conducted a drilling program at its Copper Basin Project, as a follow up to its 2011 major drilling program. No results were released. (M. Ressel, oral communication, 10/30/2014; BLM Battle Mountain District annual report, 1/2013; BLM Environmental Assessment, DOI-BLM-NV-B010-2013-0062-EA, 9/2013; BLM Finding of No Significant Impact, 2/14/2014; BLM Record of Decision, 2/20/2014) Phoenix. Newmont Mining Corp. produced 29,825,908 pounds of copper from its Phoenix Mine, a minor increase from 2012. The metallurgical recovery was 59%. Gold production was 202,055 ounces, an increase of 27%, with a metallurgical recovery of 73%. Silver production was 1,550,346 1,152,312 ounces, an increase of 35%, with a metallurgical recovery of 36%. In 2012, the BLM issued a final environmental impact statement and record of decision approving Newmont’s copper leach project. The leach pad was finished and initially loaded with 6,000,000 tons of ore. The SX-EW plant, the first in Nevada, was completed in September 2013 at a cost of $91,000,000 pure copper cathode in the form of sheets was produced in October. Annual copper production is expected to be about 20,000,000 pounds for the first five years of production with costs of $1.75 to $2.00 per pound. The company carried out a major drill program, but no results or other details were released. Holes may have also have been drilled on the pediment south of Copper Canyon, where Newmont had Notices of Intent approved by the BLM to drill in sections 15, 16, 20, and 22 in township 30 N, range 43E, in an area where young basalts crop out. (M. Ressel, oral communication, 10/30/2014; BLM Final Environmental Impact Statement, 4/2012; BLM Record of Decision, 6/2012; Elko Daily Free Press Mining Quarterly, Spring 2013; Newmont Mining Corp. Form 10-K, 2/21/2014; Newmont website, www.newmont.com) Buffalo Valley District
Buffalo Valley. Newmont Mining Corp. continued to explore its Buffalo Valley project (Newmont. 70%, Fairmile Goldtech Inc. 30%) and updated the resource, but no drilling was carried out. The BLM began preparing an environmental impact statement, for the company’s proposed mine, which would include two open pits, three waste rock storage areas, high-grade ore stockpiles, a heap leach pad, crushing and processing facilities, and support
infrastructure. (M. Ressel, oral communication, 10/30/2014; BLM News Release BMDO 2013-08, 2/6/2013; Newmont Mining Corp. Form 10-K, 3/21/2014; Newmont website, www.newmont.com). Bullion District
Fire Creek. Though still in the development stage, Klondex Mines Ltd. produced 6,208 ounces of gold from its Fire Creek mine. The company signed an agreement with Newmont to process ore at the Midas custom mill and shipped 8,007 tons of ore. The company also entered into a toll milling agreement with Veris Gold Corp. to process ore at Jerritt Canyon. The company completed 35 underground drill holes and one surface core hole totaling 15,721 feet, mainly as part of an infill drilling program. Drilling sites included the Joyce and Vonnie veins in the Main Zone and the newly discovered West Zone. Significant intercepts reported in the West Zone included 1.8 feet grading 2.803 opt gold, 3 feet grading 0.828 opt gold, 7.2 feet grading 0.43 opt gold in one hole and 1 foot grading 1.01 opt gold and 6.7 feet grading 0.32 opt gold in two other holes. The property covers 11,307 acres, consisting of about 9,680 acres of lode claims, 1,118 acres of private land, 239 acres of mineral leases and 270 acres optioned to purchase. The company issued two NI43-101 technical reports and was preparing a preliminary economic assessment of the property. The reports included updated total resources for Fire Creek and individual resources for the Main, West, North South, and Far North deposits. (Klondex Mines Ltd. Management Discussion and Analysis, 8/13/2013, 11/14/2013, 3/31/2014; Klondex Mines Ltd. news release, 1/20/2014; Klondex Mines Ltd. Annual Information Form, 3/31/2014; Klondex Mines Ltd. 43-101 Technical Reports; 10/31/2013, 11/14/2013, 6/13/2014; Klondex Mines website, www.klondexmines.com)
Pipeline Complex. Barrick Gold Corp. resumed mining at the Pipeline Complex in January, which is expected to last through 2026. Production figures are combined with those for the Cortez Hills open pit. It carried out an unknown amount of drilling on the Pipeline side of Crescent Valley. No results were released. (Barrick Gold Corp., Annual Report, 3/31/2014; Barrick Gold Corp. Annual Information Form, 3/31/2014; Barrick website, www.barrick.com) Utah Clipper. In January, Navaho Gold Ltd. (joint venture with Columbus Gold Corp.) completed one diamond core hole to a depth 3,509 feet on it Utah Clipper property just west of Barrick’s inactive Gold Acres open pit. The hole intersected carbonates of Horse Canyon and Wenban formations, but no significant assays were reported. (Navaho Gold, Ltd., 2013 Annual Report, 12/31/2012; Navaho Gold, Ltd., website, www.navahogold.com; Columbus Gold Corp. Management Discussion and Analysis, 1/10/2014; Columbus Gold website, www.columbusgoldcorp.com)

31
Cortez District
Cortez Hills. Barrick Gold Corp. produced 825,196 ounces of gold from its Pipeline (Bullion District) and Cortez Hills open pits, a decrease of 12% from 2012. The company also produced 545,852 ounces of gold from its Cortez Hills underground mine, an increase of 27% from 2012. A total of 147,718,000 tons of material mined were mined of which 22,045,000 tons were processed with an average grade of 0.076 opt gold and an average total operating cost was $222 per ounce and an all-in sustaining cost was $433 per ounce. The metallurgical recovery was 82.5% with a cut-off grade ranging between 0.004 opt and 0.258 opt gold. The company completed 86 exploration holes totaling 231,670 feet were drilled at Cortez, including Cortez Hills and Goldrush. Drilling in the Cortez Hills area was conducted mainly from underground. Mineralization remains open at depth and to the south and west. (Elko Daily Free Press 5/31/2013; Elko Daily Free Press Mining Quarterly, Fall 2013; Barrick Gold Corp., Annual Report, 3/31/2014; Barrick Gold Corp. Annual Information Form, 3/31/2014; Barrick website, www.barrick.com) McCoy District
Cove. Premier Gold Mines, Ltd. completed 36 core and reverse circulation exploration holes totaling 85,280 feet on its Cove property and discovered high-grade gold-silver mineralization in the new Cove North Deep area about 1,300 feet north of the old Cove pit. Drilling near the Cove pit also resulted in the discovery of the 2201 polymetallic gold-silver zone beneath the pit. Step-out drilling confirmed the extension of the 2201 Zone with multiple intervals of massive, semi-massive, and stringer sulfide mineralization. Mineralization within the 2201 Zone consists of pyrite, sphalerite, galena, arsenopyrite, chalcopyrite, pyrrhotite, electrum and rare visible gold occurring mainly as veins in conglomerate of the Triassic Dixie Valley Formation, mainly at depths of greater than 2,000 feet. Drilling near the pit ramp encountered Carlin-style mineralization in an area referred to as CSD (South Cove Deep). The top of the CSD mineralization occurs about 160 feet below the pit and is similar to that of the Helen Zone, which located 1,600 feet northwest of the Cove pit at depths of 1,500 to 2,000 below the surface. The Helen Zone had been the main exploration target since exploration resumed at the Cove property in 2006. Significant intercepts included 161 feet averaging 0.09 opt gold, including 14 feet grading 0.17 opt gold; and 26 feet averaging 0.21 opt gold (Cove South Deep); 30 feet averaging 0.2 opt gold, 0.38 opt silver, 0.02% copper, 0.32% zinc, 0.06% lead; and 49 feet averaging 0.05 opt gold, 1.21 opt silver, 0.07% copper, 1.24% zinc, 0.19% lead (Dixie Valley Formation, 2201 Zone); 5 feet averaging 0.32 opt gold and 0.27 opt silver (Pennsylvanian-Permian Havallah sequence, 2201 Zone); and 9 feet averaging 0.77 opt gold and 1.16 opt silver (Helen Zone). The company issued a 43-101 Technical Report updating the previous
mineral resource estimate of the Helen Zone. (Premier Gold Mines, Ltd., news releases, 9/18/2013, 11/13/2013, 1/6/2014; Premier Gold Mines, Ltd., Annual Information Form, 3/31/2014; Premier Gold Mines, Ltd., Annual Report, 5/26/2014; Premier Gold Mines, Ltd., 43-101 Technical Report, 1/2/2014; Premier Gold Mines, website, www.premiergoldmines.com)
Northern Toquima Range
Pete’s Summit. Columbus Gold Corp. completed a 10 to 12 hole drilling program on its Pete’s Summit Project 20 miles north of the Northumberland Mine. No results were released, suggesting the results were negative. (Columbus Gold Corp. Management Discussion and Analysis, 2/21/2013, 3/232014; Columbus Gold website, www.columbusgoldcorp.com)
LINCOLN COUNTY Eagle Valley District
Gold Springs. High Desert Gold Corp. completed 43 reverse circulation holes totaling 22,145 feet along the Grey Eagle Zone on its Gold Springs project, located along the border with Utah about 22 miles east of Pioche. Better intercepts included 195 feet averaging 0.032 opt gold and 0.23 opt Ag, including 25 feet grading 0.18 opt gold and 0.80 opt silver; and 200 feet averaging 0.026 opt gold and 0.25 opt silver, including 40 feet grading 0.11 opt gold and 0.51 opt silver. Results of the drilling showed Gray Eagle consists of North, Main, and South zones along a strike of 2,200 feet. At year’s end, South American Silver acquired High Desert Gold Corp. and changed its name to TriMetals Mining Corp. (High Desert Gold Corp. news releases, 9/10/2013, 11/11/2013; High Desert Gold Corp. NI43-101 Technical Reports 5/9/2013, 9/26/2013; TriMetals Mining Corp. NI43-101 Technical Report 3/19/2014; TriMetals Mining Corp. Annual Information Form, 3/20/2014; TriMetals Mining Corp. website, www.trimetalsmining.com) Silver King Pass
Claim Staking. Barrick Gold Corp. staked 170 claims near Silver King Pass at the south end of the Schell Creek Range in Lincoln County. The claims are mainly in T4N, R63E in an area of exposed Paleozoic carbonate rocks. (BLM LR2000 database).
LYON COUNTY Yerington District
Ann Mason. Entrée Gold, Inc., drilled five holes consisting of 3,257 feet of pre-collar reverse circulation drilling and 7,081 feet of core drilling on its Ann Mason property. The company also completed two reverse circulation holes

32
totaling 590 feet to test a new exploration target west of the Ann Mason deposit. The core drilling tested for extensions of mineralization within the current pit design, and three of the five core holes extended the copper mineralization 620 feet to 820 feet to the northwest and northeast of the deposit. The mineralization remains open is several directions. Significant intercepts reported included 721 feet grading 0.3% copper, 0.003% molybdenum, 0.002 opt gold, and 0.05 opt silver and 1,017 feet grading 0.21% copper, 0.014% molybdenum, 0.0006 opt gold, and 0.017 opt silver. Weak, primarily pyritic copper mineralization was intercepted up to 620 feet north of the resource boundary, but higher grade mineralization may exist at depth, given the deposit is tilted nearly 90°. About 790 feet farther east-southeast, a drill encountered strong faulting with no significant mineralization. The two shallow holes drilled 1,640 feet and 2,950 feet west of the Ann Mason intersected intervals up to 20 feet thick containing between 0.16% 0.2% copper. (Entrée Gold Inc. news releases, 9/25/2013; Entrée Gold Inc. Annual Information Form, 3/27/2014; Entrée Gold Management Discussion and Analysis, 3/27/2014; Entrée Gold, Inc., website, www.entreegold.com) Blue Hill. Entrée Gold, Inc., drilled reverse circulation five holes totaling 2,194 feet and deepened two existing reverse circulation holes with core drilling totaling 1,092 feet on its Blue Hill property about one mile northwest of its Ann Mason property. The company also completed four more reverse circulation holes totaling 1,374 feet to test near‐surface copper oxide mineralization to the east of Blue Hill. The deposit consists of two main styles of porphyry mineralization: 1) near surface, mixed oxide-sulfide copper mineralization, and 2) underlying sulfide copper-molybdenum mineralization. The drilling tested for additional areas of copper oxide mineralization and the potential for underlying sulfide mineralization. Westward extensions of the Blue Hill deposit were encountered, and the copper oxide and mixed oxide/sulfide mineralization remains open is several directions. The low-angle post-mineralization Blue Hill Fault truncates the oxide and mixed mineralization to the east, but does not affect the eastward continuation of the underlying sulfide mineralization. Significant intercepts included 55 feet of oxide mineralization grading 0.21% copper, 95 feet of oxide mineralization grading 0.14% copper, and 141 feet of sulfide mineralization grading 0.19% copper. (Entrée Gold Inc. news release, 9/25/2013; Entrée Gold Inc. Annual Information Form, 3/27/2014; Entrée Gold Management Discussion and Analysis, 3/27/2014; Entrée Gold website, www.entreegold.com)
Pumpkin Hollow. Nevada Copper Corp. drilled 11 holes, two of which were pre-collar holes, totaling about 20,990 feet on its Pumpkin Hollow property southeast of Yerington. The drilling followed up new mineralization discovered at the end of the 2012 drilling program along the southern and western edge of the North deposit. Significant intercepts included 38 feet grading 1.45% copper; 13 feet
grading 1.55% copper; and 8 feet grading 2.15% copper in two holes. Most of the mineralization in the North deposit is disseminated within hornfels, silicate skarn, and skarn breccia. However, mineralization along the southern edge is mainly hosted by endoskarn, which opens up a very large prospective area between the North and South deposits for further exploration.
The company issued an open pit operations feasibility study containing some upgrades in the resources and reserves. In brief, the open pit mining operations is estimated to have a 22-year mine. Mining will begin on the North deposit first and later on the South deposit with the two pits eventually merging. Ore will be processed on-site at a rate of 70,000 tons per day in a flotation processing facility, and the concentrates will be trucked off-site. In May, the production-sized head frame and hoist over a 2,200-foot, 24-foot diameter shaft to access the East underground deposit became operational with production planned for late 2015. (Nevada Copper Corp. news release, 6/17/2013; Nevada Copper Corp. Annual Information Form, 3/26/2014; Nevada Copper Corp. Management Discussion and Analysis, 3/26/2014; Nevada Copper Corp. 43-101 Technical Report, 11/14/2013; Nevada Copper website, www.nevadacopper.com)
Yerington Mine. Singatse Peak Services LLC a subsidiary of Quaterra Resources Inc. completed 31 drill holes totaling 3,802 feet on vat leach tailings at its Yerington property, but the results were not released. The company released an NI43-101 technical report with updated resource information. (Quaterra Resources, Inc., news release, 11/20/2013; Quaterra Resources, Inc., 43-101 Technical Report, 1/6/2014; Quaterra website, www.quaterra.com)
MINERAL COUNTY Aurora District
Fletcher Junction. Spruce Ridge Resources Ltd. (joint venture with Nevada Exploration Inc.) completed two core holes totaling 4,000 feet on the Fletcher Junction property. Prior to drilling the company had also completed a high-resolution airborne VTEM (versatile time-domain electromagnetic geophysical system) and magnetic survey over both Fletcher Junction and part of the nearby historic Aurora mining district. The holes penetrated the Aurora basalt and gravel overlying a sedimentary unit consisting of reworked pyroclastic and epiclastic volcanic rocks. The bedrock was hydrothermally altered and contained some silica-sulfide mineralization with only minimal gold values, but did contain anomalous silver (up to 1 opt), antimony (up to 450 ppm), arsenic (up to 800 ppm), mercury (up to 3 ppm), and molybdenum (up to 300 ppm). The combination of alteration and trace-element chemistry suggest that the peripheral and/or upper parts of an Aurora-style gold-bearing quartz-adularia vein system may have been penetrated. Spruce Ridge Resources, Ltd., decided it was not worth pursuing and terminated its joint venture

33
agreement. (Nevada Exploration, Inc. news releases, 1/16/2013, 9/30/2013; Nevada Exploration website, www.nevadaexploration.com) Borealis District
Borealis. Through its subsidiary Borealis Mining Co., Gryphon Gold Corp. produced 10,556 ounces of gold and 21,187 ounces of silver from the its heap leach operation at its Borealis mine (Gryphon Gold Corp. 40%, Waterton Global Value, L.P., 60%). The operation re-crushed material from existing heap leach pads and put them back on the pads. The life of the operation was estimated to be about six years. No drilling was reported for 2013. Because of liquidity issues and a lawsuit by some of the shareholders, the company entered Chapter 11 bankruptcy. The company retained its assets and continued running its business as a debtor-in-possession under supervision of the bankruptcy court. (Gryphon Gold Corp. news release, 7/30/2013; Gryphon Gold Corp. Form 8-K, 7/31/2013; Gryphon Gold website, www.gryphongold.com) Rawhide District
Denton-Rawhide. Rawhide Mining, LLC, produced 23,900 ounces of gold and 305,000 ounces of silver from the company’s Denton-Rawhide Mine. Rawhide Mining, LLC, agreed to lease the Rawhide East property from Emgold Mining Corp. The property consists of 52 unpatented claims and sits between the Denton-Rawhide property to the south and east and the Regent property to the north and west. Emgold Mining Corp. reported Rawhide Mining, LLC, commenced drilling, but no results were released. (Emgold Mining Corp. Management Discussion and Analysis, 3/26/2014; Emgold Mining website, www.emgold.com) Santa Fe District
Clay Peters (Kope Scheelite). Silver Reserve Corp. (a subsidiary of Infrastructure Materials Corp.) completed 4 reverse circulation holes on its Clay Peters (formerly Kope Scheelite) project about 11 miles northeast of Mina. An induced polarization geophysical survey was completed, which was followed by a 7,000-foot drilling program. Drilling was suspended after the four holes were drilled. No significant gold, silver, or copper values were encountered. (Infrastructure Materials Corp. news release, 10/25/2013; Infrastructure Materials Corp. Form 10-K, 9/20/2013; Infrastructure Materials website, www.infrastructurematerialscorp.com) Isabella Pearl. Isabella/Pearl, LLC, received a water pollution control permit from the Nevada Division of Environmental Protection for its proposed Isabella Pearl project (joint venture with Taux Investments, Ltd.) located near the old Santa Fe open pit, which was mined in the 1980s. The company plans to mine oxide from the Isabella, Pearl, and Civit Cat pits, which will eventually merge into
one pit. Mining of the oxide ore deposits will require removal and stockpiling of approximately 65,000 tons of sulfide ore with the intent to process at an off-site facility. The mine life is estimated to be five years. The compilation of an environmental assessment is still pending with the BLM. (Nevada Division of Environmental Protection, Pearl Joint Venture Project NEV2009102 Record of Decision, 6/3/2013; Nevada Division of Environmental Protection, Pearl Joint Venture Project NEV2009102 Fact Sheet, 2013; BLM Scoping Document, 7/21/2011; Diggings website, www.thediggings.com/mine-owners/2256141). NYE COUNTY Bare Mountain District
Reward. Atna Resources Ltd. completed 14 reverse circulation totaling 9,013 feet on its Reward property. The drilling program was intended to expand the existing resource and reserves and to ensure that planned plant facility locations will not be built over mineralized zones. The drilling confirmed the presence of a new zone of bedded gold mineralization along the eastern and southeastern flanks of the main Reward gold deposit. Significant intercepts reported include 320 feet grading 0.022 opt gold including 18.5 feet grading 0.059 opt gold, 75 feet grading 0.041 opt gold, and 118 feet grading 0.057 opt gold including 44 feet grading 0.109 opt gold. The gold mineralization is mainly controlled by the Good Hope fault zone, which hosts a north-south-trending zone of steeply dipping sheeted quartz veins. Adjacent to the fault zone, moderately east-dipping phyllitic quartzite, siltstone, and shales host disseminated gold mineralization associated with narrow iron oxide veinlets (after pyrite) and minor quartz veins. Gold mineralization has a strike length of more than 2,400 feet and extends to a depth of 750 feet along the Good Hope fault zone. The width of mineralization within the structural zone varies between a few feet to up to 200 feet, and bedded zones along the southeastern flank of the main deposit attain thicknesses of over 300 feet.
Prior to 2013, the company released a 43-101 technical report with resource estimate and a proposed open pit mine and heap leach operation. The operation would consist of several small pits starting in the Good Hope area and moving into the Gold Ace and Bull Moose areas. Metallurgical recovery is estimated to be about 80% with 265,810 ounces of gold produced over the life of the operation. The mine life is estimated to be 6.5 years. (Atna Resources Ltd. news releases, 2/25/2013, 3/25/2013; Atna Resources Ltd. Form 20-F, 3/18/2014; Atna Resources Ltd. NI43-101 Technical Report, 7/9/2012; Atna Resources website, www.atna.com)
Sterling. Sterling Gold Mining Corp., a subsidiary of Imperial Metals Corp., produced 7,142 ounces of gold from the company’s Sterling Mine, which reached commercial production in March. Mining was conducted underground in the 144 Zone, from which 160,789 tons of ore with an

34
average grade of 0.083 opt gold was mined. The company completed 52 core holes totaling 5,800 feet to further delineate of the 144 zone. The drilling targeted the northern limb of the 144 Zone at the 3,180-foot level and an unexplored part of the 3,320-foot level. Significant intercepts from three of the holes were 40 feet averaging 0.163 opt gold, including 5 feet grading 0.494 opt gold; 49 feet averaging 0.173 opt gold, including 10 feet grading 0.363 opt gold; and 70 feet averaging 0.166 opt gold, which included 16 feet grading 0.476 opt gold in three holes. (Imperial Metals Corp. Management and Discussion Analysis, 3/31/2014; Imperial Metals Corp. Annual Information Form, 3/31/2014; Imperial Metals website, www.imperialmetals.com)
Bruner District
Bruner. Canamex Resources Corp. completed 39 reverse circulation holes totaling 23,135 feet and three core holes totaling 2,382 feet at the Bruner property (joint venture with Patriot Gold Corp.). Eighteen of the reverse circulation holes and the core holes were drilled on the Penelas East target area to help define the geology and the distribution of gold in the mineralized area. The results confirmed the continuation of the mineralized system beneath an altered and weakly mineralized cap of flow banded rhyolite and indicated the mineralization continued northward. Significant intercepts reported from Penelas East included 95 feet averaging 0.027 opt gold, including five feet grading 0.275 opt gold: and 262 feet averaging 0.044 opt gold, including five feet grading 0.462 opt gold; and five feet grading 0.61 opt gold. Seven of the reverse circulation holes were drilled at the Bruner vein to test for high-grade vein mineralization below historic prospect pits containing chalcedony and bladed calcite-bearing veins up to three feet thick. Significant intercepts reported for the Bruner vein included 30 feet averaging 0.21 opt gold, including five feet grading 0.9 opt gold; 10 feet averaging 0.06 opt gold, and 15 feet averaging 0.051 opt gold. Seven of the reverse circulation holes were drilled along the northern extension to the historic resource area. They intersected many intervals tens of feet to greater than 100 feet thick grading around 0.01 opt gold. However, no higher grade material was found to justify additional drilling. Six of the reverse circulation holes were drilled at a large silica-adularia alteration spire located about 650 feet west of the heart of the historic resource area. The drilling followed up on zones of significant gold grades discovered by earlier drilling near the spire and confirmed the continuation of these gold zones below the silica alteration spire. One hole drilled to test the heart of historic resource area penetrated completely oxidized material and intersected 190 feet grading 0.155 opt gold including a five-foot clay‐rich and silicified interval grading 3.53 opt gold. The intercept was between 260 and 450 feet at depth, and was lost in gold mineralization at 460 feet in a badly fractured zone. (Canamex Resources Corp. news releases, 8/21/2013, 12/4/2013; Canamex Resources Management Discussion and Analysis, 4/7/2014; Canamex
Resources website, www.canamex.us; MinQuest website, www.minquestinc.com)
Bullfrog District
North Bullfrog. Corvus Gold Inc. completed 58 reverse circulation and core holes totaling over 65,000 feet on its North Bullfrog property. The property contains five main deposits: Connection, Jolly Jane, Mayflower, Sierra Blanca, and Yellowjacket. The drilling expanded the known mineralization about 400 feet to the north. The company completed in-fill drilling on the ZuZu claim which covers part of the Jolly Jane deposit. Thirteen holes were drilled at the Jolly Jane deposit, where significant intercepts included 125 feet averaging 0.009 opt gold, including 75 feet grading 0.012 opt gold; and 95 feet grading 0.009 opt gold in two holes. Twenty-five holes were completed on the Yellowjacket, which may be in an area of a higher grade upwelling zone. Several high-grade intercepts were encountered. The best ones were 16 feet averaging 0.49 opt gold and 2.17 opt silver, 105 feet grading 0.11 opt gold and 0.442 opt silver, 18 feet averaging 0.4 opt gold and 2.22 opt silver, 91.5 feet grading 0.1 opt gold and 0.629 opt silver, 41 feet grading 0.25 opt gold and 2.37 opt silver, and 213.5 feet averaging 0.088 opt gold and 0.6 opt silver. The remaining holes were drilled in the North and West Sierra Blanca zones, where 35 feet grading 0.028 opt gold, 35 feet grading 0.023 opt gold, and 135 feet grading 0.02 opt gold were encountered. Two types of precious metal epithermal mineralization occur at North Bullfrog. The first type is potentially high-grade mineralization in structurally controlled fissure veins and associated stockwork zones. The Yellowjacket characterizes this type of mineralization. The second type is low-grade disseminated mineralization within altered volcanic rocks. (Corvus Gold Inc. Management Discussion and Analysis, 8/29/2013, 10/15/2013, 8/7/2014; Corvus Gold Inc. Annual Information Form, 8/29/2013; Corvus Gold Inc. 43-101 technical report, 4/2/2014; Corvus Gold Inc. website, www.corvusgold.com) Longstreet District
Fourmile. Wolfpack Gold Corp., a subsidiary of Tigris Uranium Corp., completed five reverse circulation holes totaling 4,920 feet on the western margin of Sinter Ridge in the Fourmile project zone. The holes were drilled at an angle to the east and were intended to cut across a primary, north-south trending, nearly vertical quartz vein zone that runs along Sinter Ridge in the subsurface. The results suggested that high level bodies of silicification at the surface become increasingly vein-like in geometry at depth. The depths of targeted zones were between 750 and 1,000 feet, but difficult drilling conditions and an unexpected easterly dip of the vein zone prevented testing below about 600 feet. The best intercept was 20 feet grading 0.005 opt Au and 0.72 opt Ag. (Wolfpack Gold Corp. news release 2/26/2014; Wolfpack Gold Corp. Management Discussion and
35
Analysis, 4/29/2014; Wolfpack Gold website, www.wolfpackgold.com).
Longstreet. Star Gold Corp. completed 20 reverse circulation holes totaling 6,930 feet on the Longstreet property (joint venture with MinQuest Inc.). Significant intercepts included 30 feet averaging 0.032 opt gold and 10.34 opt silver, including 5 feet grading 0.166 opt gold and 54.312 opt silver; 25 feet averaging 0.065 opt gold and 0.467 opt silver; and 40 feet grading 0.038 opt gold and 0.81 opt silver in three holes. The property is mainly underlain by poorly to moderately welded tuffs of Oligocene age, which are nearly horizontal and up to 3,000 feet thick. The mineralization is mainly hosted by these tuffs, which are pervasively hydrothermally altered to limonite-stained argillic, potassic, or silicic assemblages. The mineralization has been divided into a number of zones. The main zone contains the estimated mineral resource and has been the main focus of exploration over the years. The gold mineralization is hosted in fractured and stockwork zones. Mineralization in the other zones is mostly in quartz±adularia veins. Several other zones occur around the main zone. The company issued a 43-101 technical report at year’s end with upgraded resource estimates. (Star Gold Corp. news release, 8/29/2013; Star Gold Corp., 10-K report, 7/29/2014; Star Gold Corp., 43-101 Technical Report, 12/15/2013; Star Gold website, www.stargoldcorp.com; MinQuest website, www.minquestinc.com)
Manhattan District
Timber Hill. The U.S. Forest Service issued a Finding of No Significant Impact for Round Mountain Gold Corp.’s Timber Hill exploration project located just south of Manhattan. The project would consist of drilling one to three reverse-circulation or core drill holes on each of up to 34 pads and constructing the associated access roads and staging areas. An environmental assessment was issued in 2012. No drilling was reported for Timber Hill in 2013, but the company rarely reports on the activities concerning its smaller projects. (U.S. Forest Service Environmental Assessment, 9/2012; U.S. Forest Service Finding of No Significant Impact, 4/11/2013; Kinross Gold Corp. Annual Information Form, 4/7/2014) Round Mountain District
Round Mountain. The Round Mountain Gold Corp. produced 314,886 ounces of gold and 636,564 ounces of silver from its Round Mountain Mine (Kinross Gold Corp. 50%, Barrick Gold Corp. 50%). Overall, 21,658,000 tons were mined with an average grade of 0.02 opt gold. Metallurgical recovery was 65.7%. A minor amount of drilling was conducted, but no results were reported. Only about $600,000 was spent on exploration in 2013. (Kinross Gold Corp. Annual Information Form, 4/7/2014; Kinross
Gold Corp. Management Discussion and Analysis, 2/12/2014; Kinross website, www.kinross.com; Barrick Gold Corp. Annual Information Form, 3/31/2014; Barrick Gold website, www.barrick.com) Tybo District
Bolo. Columbus Gold Corp. completed 19 reverse circulation holes totaling 11,400 feet in the South Zone of its Bolo Project. The mineralization is contained in jasperoids and limonite-stained structures cutting Cambrian and Ordovician sedimentary rocks, along two parallel north-south trending faults, the Mine fault and the East fault, traceable for over three miles. Significant intercepts included five feet grading 0.194 opt gold and five feet grading 1.994 opt silver, 20 feet grading 0.084 opt gold and five feet grading 1.206 opt silver, 15 feet grading 0.074 opt gold and 10 feet grading 0.952 opt silver, and five feet grading 0.073 opt gold, and five feet grading 10.514 opt silver in four holes. The company released a NI43-101 technical report describing the property. (Columbus Gold Corp. news releases, 9/25/2013; Columbus Gold Corp. Management Discussion and Analysis, 1/10/2014; Columbus Gold Corp. NI43-101 technical report, 10/9/2013; Columbus Gold Corp., website, www.columbusgoldcorp.com)
Keystone. Newmont Mining Corp. drilled about a dozen holes on its Keystone project south of Flagstaff Mountain. No results were released. (M. Ressel, oral communication, 10/30/2014; BLM LR2000 database; Newmont website, www.newmont.com)
Union District
Summit. IDH Gold LLC acquired the Summit gold property from Taminco, Inc., in 2012, and was preparing to drill in early 2013. No details have been announced. In 1990, a joint venture between Amax Gold and Zephyr Resources produced 8,800 ounces of gold from 37,000 tons of ore averaging 0.24 opt gold. (Arrowhead Business Investment and Decisions, Due Diligence and Evaluation Report, 2/13/2013; IDH Gold website, idhgold.com)
PERSHING COUNTY Antelope Springs District
Relief Canyon. Pershing Gold Corp. spent $3,100,000 on exploration activities on its Relief Canyon Gold Project including drilling 58 holes, both reverse circulation and core holes totaling 35,000 feet. Thirty-two of the holes totaling 22,000 feet were drilled to extend and upgrade the current deposit, and 10 holes totaling 6,500 feet were drilled for metallurgical characterization and groundwater studies. The remaining 16 holes were core holes that tested the North Target aimed at expanding the resource north of the boundary of the North pit. Thirteen of the 16 holes
36
intercepted zones of greater than 0.19 opt gold. Significant intercepts included 43 feet averaging 0.224 opt gold, including 15 feet grading 0.313 opt gold and five feet grading 0.917 opt gold; 21 feet averaging 0.188 opt gold, including 5 feet grading 0.574 opt gold; and 55 feet averaging 0.073 opt gold, including 19 feet grading 0.19 opt gold, in three holes. The 2013 drilling showed the deposit consisted of three stacked mineralized zones controlled by low-angle structures – Main, Lower, and Jasperoid Zones. Both the Lower and Jasperoid Zones had been previously unknown, and the drill results showed higher grades than the previously mined Main Zone. The Lower Zone is about 1,500 feet by 1,000 feet, and the Lower Zone is about 1,200 feet by 800 feet. (Elko Daily Free Press Mining Quarterly, Spring 2013; Pershing Gold Corp. 10-K Form, 3/26/2014; Pershing Gold Corp. news releases, 7/24/2013, 11/25/2013, 1/27/2014, 3/31/2014; Pershing Gold website, www.pershinggold.com). Imlay District
Florida Canyon/Standard. Jipangu, Inc., produced 46,152 ounces of gold and 58,333 ounces of silver from its Standard Mine about five miles south of the Florida Canyon Mine. The company temporarily shut-down the Florida Canyon Mine in March 2011 and shifted mining to the Standard Mine. The shut-down was due to the company’s proposed expansion of Florida Canyon, for which BLM was preparing a preliminary environmental assessment. The plans include the expansion of the pit, modification and expansion of the existing South Waste Rock Storage Facility, installation of a crusher and other ancillary features, and construction of a new leach pad to accommodate more ore. The expansion would also extend the mine life by eight years. Since operations began in 1986, 228,800,000 tons of waste rock have been removed and 201,200,000 tons of leach grade ore have been mine. It is unknown whether Jipangu carried out a drill program at Florida Canyon or Standard. (Elko Daily Free Press Mining Quarterly, Spring 2014; BLM Preliminary Environmental Assessment, DOI-BLM-NV-W010-2013-0061-EA, 8/2014; Jipangu website www.jipangu.co.jp)
Mill City District
Springer Mine/Mill. After refurbishing the mill and releasing a resource estimate in 2009, EMC Metals Corp. suspended work on the property and placed it on care and maintenance until the global financial markets and tungsten prices improved. Due to increases in tungsten prices after 2009, EMC Metals planned to resume work for restarting the mine and mill and issued a new preliminary economic assessment in 2012. However, in December 2013, the company sold the property to Americas Bullion Royalty Corp., which in turn sold the property to the Silver Predator Corp. Silver Predator released a preliminary economic assessment of the property with updated resource estimates. (Americas Bullion Royalty Corp., Management Discussion
and Analysis, 1/10/2014; EMC Metals Corp., Forms 10-K, 3/27/2013, 3/25/2014; Preliminary Economic Assessment, 9/14/2012; EMC Metals website, www.emcmetals.com; Silver Predator Corp. news release, 12/17/2013; Silver Predator Corp. NI43-101 Technical Report, 4/22/2014; Silver Predator website, www.silverpredator.com).
Mineral Basin District
Buena Vista. After drilling 98 holes totaling 160,645 feet at its Buena Vista project in 2012, Nevada Iron Ltd., an Australian company, did not drill in 2013. However, the company did issue a probable reserve estimate of 111,200,000 metric tonnes of 18.6% Fe. The property includes fee land, 45 patented lode claims, and 184 unpatented lode claims covering 6,052 acres in parts of T24-25N, R34E. Buena Vista is a magnetite iron deposit discovered in 1898, intermittently mined between 1951 and 1959, and most recently explored by US Steel between 1961 and 1979. Nevada Iron is developing the West, East, and Section 5 deposits for production. The iron mineralization is an iron-oxide-copper-gold style deposit minus the copper and gold. The iron deposits likely formed in the Jurassic by the circulation of the non-magmatic brines that mobilized iron out of the Jurassic Humboldt mafic complex. The brine formed a large volume of scapolite-bearing alteration. (Nevada Iron Ltd., 43-101 Technical Report, 10/22/2013; Nevada Iron website, www.nv-iron.com; Johnson and Barton, 2000, SEG Guidebook Series)
Rochester District
Rochester. Coeur d’Alene Mines Corp. produced 2,798,937 ounces of silver and 30,860 ounces of gold from the company’s Rochester Mine. 10,693,654 tons averaging 0.55 opt silver and 0.0027 opt gold were milled. Recovery from crushed ore was estimated to be 61% for silver and 92% for gold. The total operating cash cost per ounce was $23.27 per ounce for silver, an increase of 14% from 2012. The company spent $4,100,000 on exploration which included completing over 735 reverse circulation, sonic (rotary vibratory drilling), and core holes totaling 175,315 feet. Of this, 45 holes totaling 4,050 feet were completed at Nevada Packard. Other areas that were drilled included the Rochester North and West stockpiles and the Northwest Rochester and South Mystic areas. Drilling on two of six historic stockpiles was successful in defining new mineral resources and mineral reserves. The company also expanded the Rochester leach pad and upgraded the metal removal system and crusher capacity.
Coeur Rochester and Rye Patch Gold Corp. reached a settlement on their mining claims dispute. In 2011, Coeur Rochester failed to pay the claim maintenance fees for unpatented claims that were part of the Rochester Mine, and Rye Patch staked over that ground informing Coeur after the fact. Coeur began restaking its claims over the Rye Patch’s claims, which resulted in lawsuits and counter-suits involving claim jumping, trespassing, and slander of title.
37
Coeur obtained an order restraining Rye Patch from working the disputed claims, which covered part of the Rochester Mine’s reserves and resources. The Court appointed a Special Master to assist in addressing certain pre-trial matters. The Court adopted a number of the recommendations from the Special Master’s subsequent report, and the mine continued normal operations while the legal actions progressed. To avoid costly litigation that could potentially cut into business operations, the two companies negotiated an out-of-court settlement, which included a cash payment, a net smelter return royalty, and transfer of the Blue Bird patented claim next to Lincoln Hill to Rye Patch from Coeur. (Elko Daily Free Press Mining Quarterly, Winter 2013; Coeur d’Alene Mines Corp. 10-K Report, 2/26/2014; Coeur d’Alene Mines Corp. Management Discussion and Analysis, 8/8/2013, 11/6/2013; Coeur d’Alene Mines Corp. NI43-101 Technical report, 2/21/2014; Coeur website www.coeur.com; Rye Patch Gold Corp. news releases, 6/25/2013; Rye Patch website, www.ryepatchgold.com)
Spring Valley District
Spring Valley. Barrick Gold Corp. (joint venture with Midway Gold Corp.) completed 24 reverse circulation holes totaling 39,357 feet and 26 core holes totaling 29,003 feet to expand the resources and to continue to evaluate the Spring Valley property. Two reverse circulation rigs and two core rigs were employed most of the year. Significant intercepts include 1,185 feet averaging 0.043 opt gold, including 69 feet grading 0.22 opt gold; 75 feet averaging 0.088 opt gold; and 69 feet averaging 0.035 opt gold, including five feet grading 0.163 opt gold, in two holes. The company continued work on hydrology, biological baseline studies, initial site engineering, pit slope and geotechnical studies, and initiated additional metallurgical testing. An internal scoping study was also underway. The deposit is hosted in Permo-Triassic Koipato Group rocks consisting of rhyolite flows, breccias, and volcaniclastic sediments intruded by a fine-grained feldspar porphyry. Hydrothermal alteration includes quartz-sericite-pyrite alteration associated with gold, argillic alteration in hydrothermal breccias, and lesser secondary potassium feldspar, iron carbonate, and hematite-quartz alteration. Mineralization occurs in sheeted quartz veins, hydrothermal breccias, and open fractures. Gold in the form of free grains up to 3 mm across is distributed along the top of the feldspar porphyry intrusion, commonly at stratigraphic contacts and fracture zones in overlying volcanic rocks, and in the remains of a diatreme breccia. (Midway Gold Corp. 10-K Form, 3/13/2014; Midway Gold Corp. news releases, 5/29/2013, 9/4/2013; Midway Gold website, www.midwaygold.com)
Table Mountain District
Fencemaker. First Liberty Power Corp. detonated the first mine blast on October 14 at its Fencemaker underground mine, and afterwards extracted 500 tons of stibnite ore. The
ore was staged outside the mine adit and then trucked 40 miles to the mill in Lovelock for processing to 55% to 60% purity. An initial shipment was contracted for sale to the Shenyang Huachang Antimony Chemical Company. Small Mine Development LLC, was contracted to rehabilitate the existing portal and then to extract the ore. No drilling was reported for 2013. The ore is stibnite in a replacement deposit hosted in calcareous siltstone dolostone of the Triassic Dun Glen Formation. (First Liberty Power Corp. 10-K Report, 11/13/2013; First Liberty Power Corp. 10-Q Report, 6/23/2014; First Liberty Power website, www.firstlibertypower.com; Small Mine Development website: www.undergroundmining.com)
Velvet District
Sinter. Renaissance Gold Inc., completed ten reverse circulation holes totaling 1,720 feet on its Sinter Property about 15 miles west of Lovelock. The program consisted of short angle holes ranging between 80 to 350 feet deep drilled to test a gold-bearing quartz-adularia vein system exposed in trenches dug in 2012. Significant intercepts included 20 feet averaging 0.037 opt gold and 0.123 opt silver, including five feet grading 0.11 opt gold; and ten feet grading 0.031 opt gold and 0.293 opt silver; and ten feet grading 0.055 opt gold and 0.209 opt silver in three holes. The property covers several prominent sinter outcrops in a weathered badlands of strongly to intensely argillized volcanic rocks. These rocks are part of a 14.2 Ma suite of rift-related, bimodal rhyolite and andesite/basalt overlain by unmineralized lacustrine sediments, diatomite, and basalt. N10oE-striking mafic dikes cut both the alteration and mineralization. Most of the sinters are exposed in down-dropped fault blocks in the western and northern areas of the property. Low-sulfidation epithermal alteration and mineralization are associated with a horst near the center of the property. This mineralization is exposed at the surface in the north-northeast-striking Highlander vein set. Other targets at Sinter include the Molly zone consisting of an east-striking set of silicified fractures. (Renaissance Gold, Inc., news release, 8/14/2013; Renaissance Gold, Inc., Management Discussion and Analysis, 5/13/2013; Renaissance Gold, Inc., website, www.rengold.com)
STOREY/LYON COUNTIES Comstock/Silver City Districts
Comstock. Comstock Mining Inc. produced 17,739 ounces of gold and 186,482 ounces of silver from its Lucerne open pit mine. Recovery from the leach pads was estimated to be 70% for gold and 45% for silver. The ore was hauled to the processing plant at American Flat, 2.6 miles south of the Lucerne Pit. After a high initial operating cash cost of $2,190 per ounce of gold due to ramp-up of production the cash cost dropped to $989 per ounce in the fourth quarter.
The company completed 142 drill holes totaling 7,464 feet. In the Lucerne Resource area, these included six holes
38
totaling 2,040 feet in the Billie the Kid zone, thirteen holes totaling 1,560 feet in the Lucerne zone, six holes totaling 960 feet in the Justice zone, and one hole to 120 feet in the Keystone zone. Comstock also completed 116 holes totaling 2,784 feet arranged in a grid pattern on the Kentuck mine dump to evaluate dump material on Sutro Mining Co. lands. The company released an NI43-101 technical report with upgraded estimated resources. The project area consists of 1,350 acres of patented claims and 4,550 acres of unpatented claims. (Elko Daily Free Press Mining Quarterly, Winter 2013; LODE Company Overview, July 2014; Comstock Mining Inc. NI43-101 Technical Report, 1/31/2013; Comstock Mining Inc. press release, 2/7/2013; Comstock Mining, Inc. Form 10-K, 3/17/2014; Comstock Mining website, www.comstockmining.com) WASHOE COUNTY San Emidio District
Wind Mountain. Bravada Gold Corp. completed 7 reverse circulation holes totaling 3,864 feet on three targets at its Wind Mountain property on the east side of the San Emidio desert. The drilling focused on the Connector (three holes), SouthMin (one hole), and Zephyr (three holes) exploration targets. Significant intercepts from Connector included 50 feet grading 0.01 opt gold and 0.187 opt silver, 20 feet grading 0.008 opt gold and 0.303 opt silver, and 60 feet grading 0.009 opt gold and 0.35 opt silver. Only one hole at Zephyr and hole drilled at SouthMin encountered anomalous gold values. (Bravada Gold Corp. News Releases, 3/21/2013, 5/13/2013; Bravada Gold Corp. Management Discussion and Analysis, 11/27/2013, 12/20/2013; Bravada Gold Corp. 43-101 Technical Report, 1/15/2014; Bravada Gold website, www.bravadagold.com) WHITE PINE COUNTY Bald Mountain District
Bald Mountain. Barrick Gold Corp. produced 95,497 ounces of gold from its Bald Mountain mine in 2013. The ore was run-of-mine oxide material that went directly to the leach pads. Production was from ore that averaged 0.02 opt gold. The metallurgical recovery for gold was 72%. A core drilling program was undertaken but no results were released. The BLM was finalizing alternatives in the draft environmental impact statement about proposed continued expansion of the Bald Mountain Mine. The proposal calls for the expansion of existing mine facilities in the North Operations Area Project (NOAP), the expansion of the existing Casino/Winrock Plan of Operations and incorporating it into NOAP, the establishment of a South Operations Area Project (SOAP) that would encompass and expand the existing but now inactive Yankee and Alligator Ridge mine sites, and the construction of an electrical transmission line and an access road between NOAP and
SOAP. (Directory of Nevada Mine Operations 2013, 8/23/2014; Elko Daily Free Press Mining Quarterly, Winter 2013; Barrick Gold Corp., Annual Report, 3/31/2014; Barrick Gold Corp. Annual Information Form, 3/31/2014; Barrick website, www.barrick.com) Pancake District
Pan. Midway Gold Corp. did not drill its Pan Project in 2013, but it did conduct metallurgical testing and prepared for mine construction. The BLM issued a final environmental impact statement and a record of decision approving the project which will involve an open-pit gold mine consisting of two larger pits and three smaller pits, crushing facilities and stockpiles, three waste rock disposal areas, a heap leach pad, processing facilities, and other support facilities and infrastructure. The project would disturb an estimated 3,301 acres. The property covered 10,373 acres consisting of unpatented lode and placer claims and private land. Construction began in January, 2014, and mining was planned to commence in September, 2014. (BLM Environmental Impact Statement, 11/20/2013; BLM Record of Decision, 12/20/2013; Midway Gold Corp. 10-K Form, 3/13/2014; Midway Gold Corp. news releases, 9/17/2013, 11/13/2013, 11/20/2013, 1/15/2014, 9/25/2014; Midway Gold Corp. Audited Annual Financial Statements, 3/13/2014; Midway Gold website, www.midwaygold.com)
Robinson District
Robinson. KGHM International, Ltd., produced 107,898,857 pounds of copper and 1,384,649 pounds of molybdenite (60% molybdenum by weight), Material containing molybdenite is stockpiled, and molybdenum is produced when the stockpiles are large enough to process it in the mill. The company also produced 47,452 ounces of gold and 161,638 ounces of silver. The average grade of ore processed was 0.43% copper and 0.005 opt gold. Metallurgical recovery was 81% for copper. The operating cash cost for copper was $1.83 per pound, down from $2.39 per pound in 2012. Production was mainly from the Kimberly, Ruth West, and Ruth East pits earlier in the year and shifted mainly to the Liberty pit and the coarse ore stockpile as the year progressed. The Liberty pit was contract mined through the end of the year. Concentrates from the mill are trucked to Robinson’s Wendover Bulk Transit Co. rail yard at Wendover, Utah, and loaded into Union Pacific train cars headed for the Port of Vancouver. They are shipped mainly to China, India, and Japan. Capital expenditures in 2013 were $113,000,000, of which $89,300,000 went towards stripping. A minor exploration drill program was carried out, but no results were released. All mining at Robinson is on 21,000 acres of private land. (Directory of Nevada Mine Operations 2013, 8/23/2014; KGHM International, Ltd. Management Discussion and Analysis, 1st Quarter 2013, 2nd Quarter 2013, 3rd Quarter 2013, 4th Quarter 2013; KGHM International, website www.quadrafnx.com)
39
White Pine District
Gold Rock. Midway Gold Corp. completed 15 reverse circulation holes totaling 11,485 feet on its Gold Rock property (formerly known as Easy Junior). The holes targeted North and South Easy Junior and Meridian Flats. Significant intercepts from three holes included 25 feet averaging 0.055 opt gold ,including 10 feet of 0.123 opt gold; 150 feet averaging 0.033 opt gold, including 15 feet grading 0.168 opt gold; 350 feet averaging 0.04 opt gold, including 5 feet each grading 0.158 opt gold, and 145 feet averaging 0.019. The mineralization is mainly hosted by the Joana Limestone with significant amounts also hosted in the overlying Chainman Shale, and scattered, minor amounts in the underlying Pilot Shale. The mineralization is localized in the apex and limbs of the slightly overturned, fault-bounded, Easy Junior anticline. The resource extends 11,000 feet along a N12-15oE trend from 1,000 feet north of the Easy Junior pit to the lower reaches of Meridian Ridge to the south. Alteration in the form of silicification and argillization with associated surface gold anomalies extend north and south well beyond the presently drill-defined resource area and extend nearly the entire 8-mile length of the property. In the Easy Junior pit area, jasperoid of the Joana Limestone carries significant amounts of gold. Oxidation is prevalent throughout the deposit, resulting in the formation mainly of red to maroon limonite. The Joana Limestone tends to be oxidized, whereas the Chainman Shale is commonly carbonaceous and pyritic. (Midway Gold Corp. 10-K Form, 3/13/2014; Midway Gold Corp. 43-101 Technical Report, 5/29/2014; Midway Gold website, www.midwaygold.com) Mount Hamilton. Mount Hamilton, LLC, (joint venture involving Solitario Exploration and Royalty Corp. and Ely Gold and Minerals, Inc.) did not drill its Mount Hamilton property in 2013. However, the company released a new resource estimate. The measured and indicated resource is 31,880,000 tons grading 0.022 opt Au for a total of 687,700 ounces of gold. The company also determined that the Centennial deposit and the Seligman deposit 1,500 feet to the north, which formerly were treated as separate deposits, were actually one deposit that could be mined by a single pit. (Solitario Exploration and Royalty Corp. Form 10-K, 3/13/2014; Solitario Exploration and Royalty Corp. website, http://www.solitarioresources.com; Ely Gold and Minerals, Inc. news release, 9/13/2013; Ely Gold and Minerals website, www.elygoldandminerals.com)
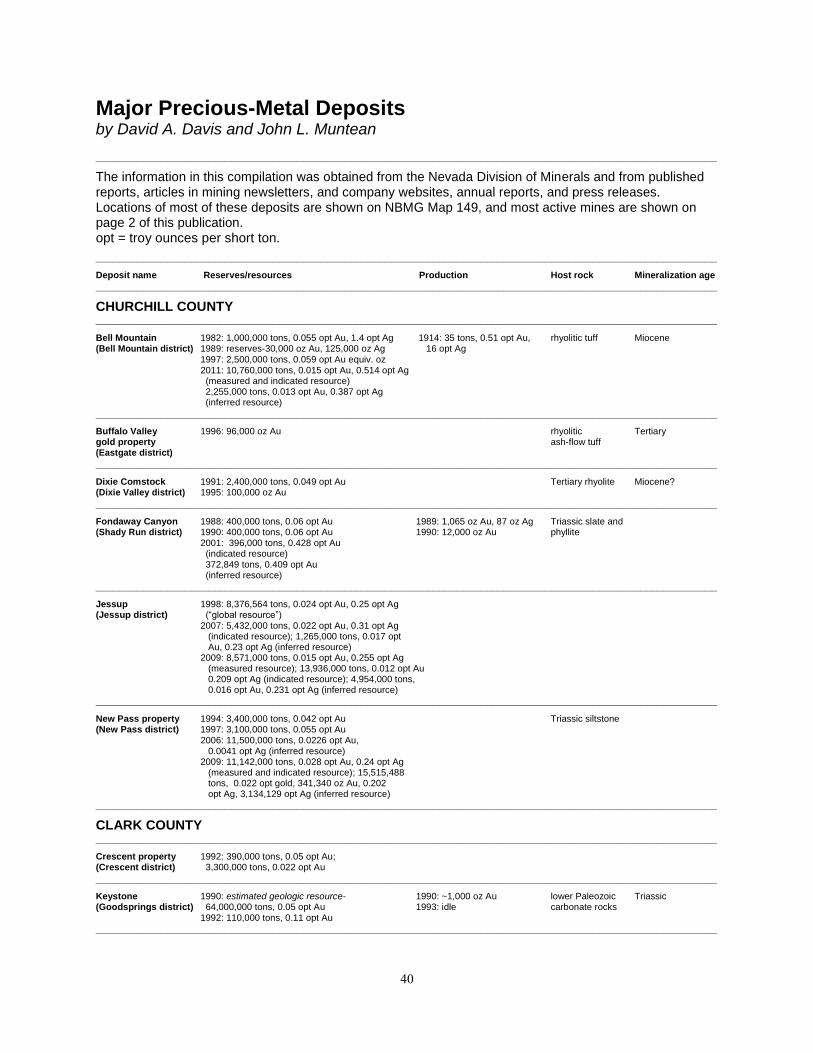
40
Major Precious-Metal Deposits by David A. Davis and John L. Muntean _________________________________________________________________________________________________________
The information in this compilation was obtained from the Nevada Division of Minerals and from published reports, articles in mining newsletters, and company websites, annual reports, and press releases. Locations of most of these deposits are shown on NBMG Map 149, and most active mines are shown on page 2 of this publication. opt = troy ounces per short ton.
_________________________________________________________________________________________________________
Deposit name Reserves/resources Production Host rock Mineralization age
_________________________________________________________________________________________________________
CHURCHILL COUNTY
_________________________________________________________________________________________________________
Bell Mountain 1982: 1,000,000 tons, 0.055 opt Au, 1.4 opt Ag 1914: 35 tons, 0.51 opt Au, rhyolitic tuff Miocene (Bell Mountain district) 1989: reserves-30,000 oz Au, 125,000 oz Ag 16 opt Ag 1997: 2,500,000 tons, 0.059 opt Au equiv. oz 2011: 10,760,000 tons, 0.015 opt Au, 0.514 opt Ag (measured and indicated resource) 2,255,000 tons, 0.013 opt Au, 0.387 opt Ag (inferred resource)
_________________________________________________________________________________________________________
Buffalo Valley 1996: 96,000 oz Au rhyolitic Tertiary gold property ash-flow tuff (Eastgate district)
_________________________________________________________________________________________________________
Dixie Comstock 1991: 2,400,000 tons, 0.049 opt Au Tertiary rhyolite Miocene? (Dixie Valley district) 1995: 100,000 oz Au
_________________________________________________________________________________________________________
Fondaway Canyon 1988: 400,000 tons, 0.06 opt Au 1989: 1,065 oz Au, 87 oz Ag Triassic slate and (Shady Run district) 1990: 400,000 tons, 0.06 opt Au 1990: 12,000 oz Au phyllite 2001: 396,000 tons, 0.428 opt Au (indicated resource) 372,849 tons, 0.409 opt Au (inferred resource)
_________________________________________________________________________________________________________
Jessup 1998: 8,376,564 tons, 0.024 opt Au, 0.25 opt Ag (Jessup district) (“global resource”) 2007: 5,432,000 tons, 0.022 opt Au, 0.31 opt Ag (indicated resource); 1,265,000 tons, 0.017 opt Au, 0.23 opt Ag (inferred resource) 2009: 8,571,000 tons, 0.015 opt Au, 0.255 opt Ag (measured resource); 13,936,000 tons, 0.012 opt Au 0.209 opt Ag (indicated resource); 4,954,000 tons, 0.016 opt Au, 0.231 opt Ag (inferred resource)
_________________________________________________________________________________________________________
New Pass property 1994: 3,400,000 tons, 0.042 opt Au Triassic siltstone (New Pass district) 1997: 3,100,000 tons, 0.055 opt Au 2006: 11,500,000 tons, 0.0226 opt Au, 0.0041 opt Ag (inferred resource) 2009: 11,142,000 tons, 0.028 opt Au, 0.24 opt Ag (measured and indicated resource); 15,515,488 tons, 0.022 opt gold, 341,340 oz Au, 0.202 opt Ag, 3,134,129 opt Ag (inferred resource)
_________________________________________________________________________________________________________
CLARK COUNTY
_________________________________________________________________________________________________________
Crescent property 1992: 390,000 tons, 0.05 opt Au; (Crescent district) 3,300,000 tons, 0.022 opt Au
_________________________________________________________________________________________________________
Keystone 1990: estimated geologic resource- 1990: ~1,000 oz Au lower Paleozoic Triassic (Goodsprings district) 64,000,000 tons, 0.05 opt Au 1993: idle carbonate rocks 1992: 110,000 tons, 0.11 opt Au
_________________________________________________________________________________________________________
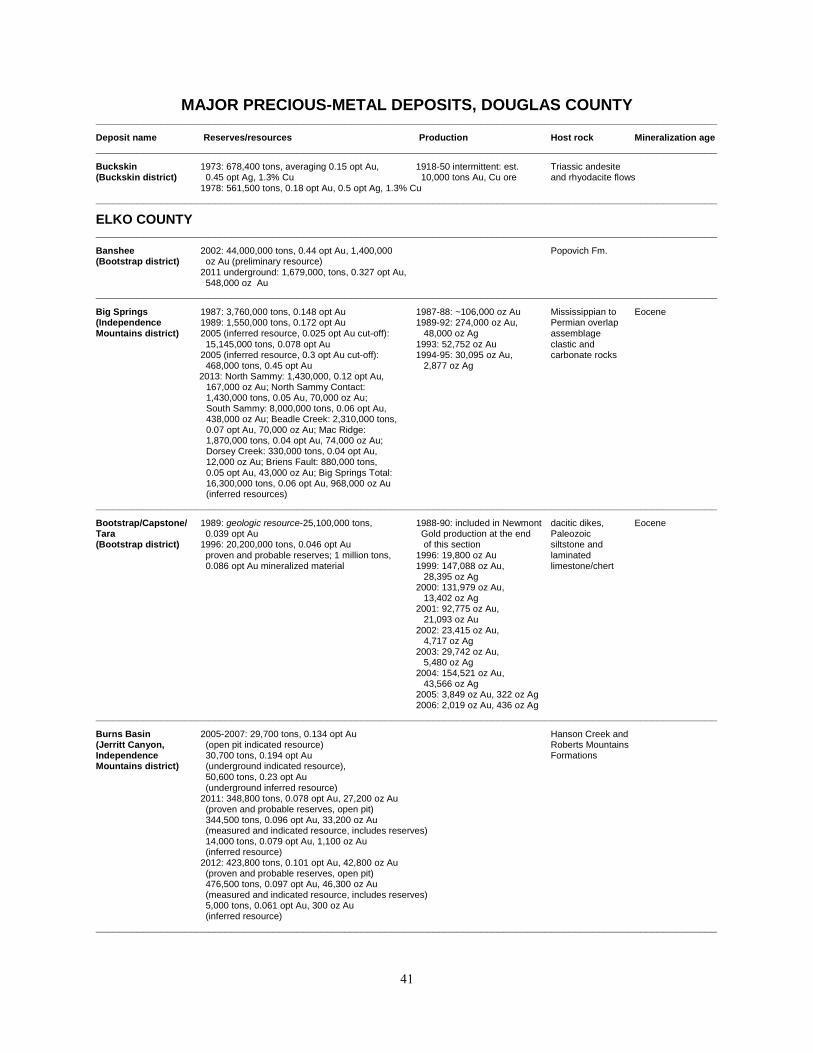
41
MAJOR PRECIOUS-METAL DEPOSITS, DOUGLAS COUNTY _________________________________________________________________________________________________________
Deposit name Reserves/resources Production Host rock Mineralization age
_________________________________________________________________________________________________________
Buckskin 1973: 678,400 tons, averaging 0.15 opt Au, 1918-50 intermittent: est. Triassic andesite (Buckskin district) 0.45 opt Ag, 1.3% Cu 10,000 tons Au, Cu ore and rhyodacite flows 1978: 561,500 tons, 0.18 opt Au, 0.5 opt Ag, 1.3% Cu
_________________________________________________________________________________________________________
ELKO COUNTY
_________________________________________________________________________________________________________
Banshee 2002: 44,000,000 tons, 0.44 opt Au, 1,400,000 Popovich Fm. (Bootstrap district) oz Au (preliminary resource) 2011 underground: 1,679,000, tons, 0.327 opt Au, 548,000 oz Au
_________________________________________________________________________________________________________
Big Springs 1987: 3,760,000 tons, 0.148 opt Au 1987-88: ~106,000 oz Au Mississippian to Eocene (Independence 1989: 1,550,000 tons, 0.172 opt Au 1989-92: 274,000 oz Au, Permian overlap Mountains district) 2005 (inferred resource, 0.025 opt Au cut-off): 48,000 oz Ag assemblage
15,145,000 tons, 0.078 opt Au 1993: 52,752 oz Au clastic and 2005 (inferred resource, 0.3 opt Au cut-off): 1994-95: 30,095 oz Au, carbonate rocks 468,000 tons, 0.45 opt Au 2,877 oz Ag 2013: North Sammy: 1,430,000, 0.12 opt Au, 167,000 oz Au; North Sammy Contact: 1,430,000 tons, 0.05 Au, 70,000 oz Au; South Sammy: 8,000,000 tons, 0.06 opt Au, 438,000 oz Au; Beadle Creek: 2,310,000 tons, 0.07 opt Au, 70,000 oz Au; Mac Ridge: 1,870,000 tons, 0.04 opt Au, 74,000 oz Au; Dorsey Creek: 330,000 tons, 0.04 opt Au, 12,000 oz Au; Briens Fault: 880,000 tons, 0.05 opt Au, 43,000 oz Au; Big Springs Total: 16,300,000 tons, 0.06 opt Au, 968,000 oz Au (inferred resources)
_________________________________________________________________________________________________________
Bootstrap/Capstone/ 1989: geologic resource-25,100,000 tons, 1988-90: included in Newmont dacitic dikes, Eocene Tara 0.039 opt Au Gold production at the end Paleozoic (Bootstrap district) 1996: 20,200,000 tons, 0.046 opt Au of this section siltstone and proven and probable reserves; 1 million tons, 1996: 19,800 oz Au laminated 0.086 opt Au mineralized material 1999: 147,088 oz Au, limestone/chert 28,395 oz Ag 2000: 131,979 oz Au, 13,402 oz Ag 2001: 92,775 oz Au, 21,093 oz Au 2002: 23,415 oz Au, 4,717 oz Ag 2003: 29,742 oz Au, 5,480 oz Ag 2004: 154,521 oz Au, 43,566 oz Ag 2005: 3,849 oz Au, 322 oz Ag 2006: 2,019 oz Au, 436 oz Ag
_________________________________________________________________________________________________________
Burns Basin 2005-2007: 29,700 tons, 0.134 opt Au Hanson Creek and (Jerritt Canyon, (open pit indicated resource) Roberts Mountains Independence 30,700 tons, 0.194 opt Au Formations Mountains district) (underground indicated resource), 50,600 tons, 0.23 opt Au (underground inferred resource) 2011: 348,800 tons, 0.078 opt Au, 27,200 oz Au (proven and probable reserves, open pit) 344,500 tons, 0.096 opt Au, 33,200 oz Au (measured and indicated resource, includes reserves) 14,000 tons, 0.079 opt Au, 1,100 oz Au (inferred resource) 2012: 423,800 tons, 0.101 opt Au, 42,800 oz Au (proven and probable reserves, open pit) 476,500 tons, 0.097 opt Au, 46,300 oz Au (measured and indicated resource, includes reserves) 5,000 tons, 0.061 opt Au, 300 oz Au (inferred resource)
_________________________________________________________________________________________________________

42
MAJOR PRECIOUS-METAL DEPOSITS, ELKO COUNTY (continued) _________________________________________________________________________________________________________
Deposit name Reserves/resources Production Host rock Mineralization age
_________________________________________________________________________________________________________
California Mountain 2005-2007: 8,000 tons, 0.11 opt Au Hanson Creek and (Jerritt Canyon, (open pit indicated resource) Roberts Mountains Independence 32,100 tons, 0.38 opt Au Formations Mountains district) (underground indicated resource), 9,400 tons, 0.33 opt Au (underground inferred resource) 2011: 4,500 tons, 0.184 opt Au, 800 oz Au (indicated resource, underground) 29,500 tons, 0.192 opt Au, 5,700 oz Au (inferred resource)
_________________________________________________________________________________________________________
Coyote Zone 2005-2007: 45,200 tons, 0.21 opt Au Hanson Creek and (Jerritt Canyon, (underground indicated resource) Roberts Mountains Independence 2,700 tons, 0.18 opt Au Formations Mountains district) (underground inferred resource) 2006-2007: 20,100 tons, 0.104 opt Au (open pit inferred resource)
_________________________________________________________________________________________________________
Cobb Creek 1988: geologic resource-3.2 million tons, (Mountain City district) 0.045 opt Au
_________________________________________________________________________________________________________
Cord Ranch 1991: 3,500,000 tons, 0.037 opt Au Webb Formation (Robinson Mountain 1994: 350,000 oz Au in 3 deposits Devils Gate Formation district) (see Piñon) Tomera Formation
_________________________________________________________________________________________________________
Dee 1982: 2,500,000 tons, 0.12 opt Au 1985-88: 189,983 oz Au Vinini Formation, Eocene (Bootstrap district) 1990: 4,500,000 tons, 0.059 opt Au 1989-92: 172,745 oz Au, Devonian 1999: 1,400,000 tons, 0.157 opt Au, 142,000 oz Ag carbonate rocks, proven and probable reserves 1993-95: 97,860 oz Au dacitic dikes 1996: 45,070 oz Au, 50,322 oz Ag 1997-98: 72,595 oz Au 1999: 36,329 oz Au, 68,400 oz Ag 2000: 61,171 oz Au, 110,900 oz Ag 2001: 2,351 oz Au, 6,028 oz Ag
_________________________________________________________________________________________________________
Doby George 1995: 3,700,000 tons, 0.060 opt Au Schoonover (Aura district) 1997: 250,000 oz Au
_________________________________________________________________________________________________________
Hollister 1989: oxide-18,400,000 tons, 0.035 opt Au; 1990: 6,000 oz Au rhyolitic tuff, flows Miocene (Ivanhoe district) estimated mineral inventory 83,500,000 1991: 60,000 oz Au tons, 0.034 opt Au, with 52,800,000 tons of 2007: 4,066 oz Au, oxide and 30.7 million tons of sulfide 38,885 oz Ag 1995: 1,300,000 oz Au; 2008: 41,890 oz Au, 42 million tons of 0.031 opt Au 192,000 oz Ag (geologic resource, combined oxide and sulfide) 2009: 31,174 oz Au, 2001: 719,000 tons, 1.29 opt Au, 7 opt Ag 243,148 oz Ag 2007 (May, 0.25 opt Au cut-off grade): 2010: 105,144 oz Au 903,000 tons, 1.03 opt Au, 5.71 opt Ag 578,855 oz Ag (measured and indicated resource) 2011: 86,518 oz Au 805,000, tons, 1.08 opt Au, 3.94 opt Ag 711,493 oz Ag (inferred resource) 2012: 62,423 oz Au 2008 (June, 0.25 opt Au cut-off grade): 301,526 oz Ag 1,615,000 tons, 0.87 opt Au, 4.57 opt Ag 2013: 12,359 oz Au (measured and indicated resource) 55,648 oz Ag 1,252,000 tons, 0.51 opt Au, 1.43 opt Ag (inferred resource) 2009 (June, 0.25 opt Au cut-off grade): 1,111,200 tons, 1.167 opt Au, 8.59 opt Ag (measured and indicated resource, includes reserves) 1,035,300 tons, 1.340 opt Au, 2.72 opt Ag (inferred resource) 2010 (August, 0.25 opt Au cut-off grade): 1,121,000 tons, 1.305 opt Au, 10.35 opt Ag (measured and indicated resource, includes reserves) 1,487,000 tons, 0.690 opt Au, 11.1 opt Ag (inferred resource)
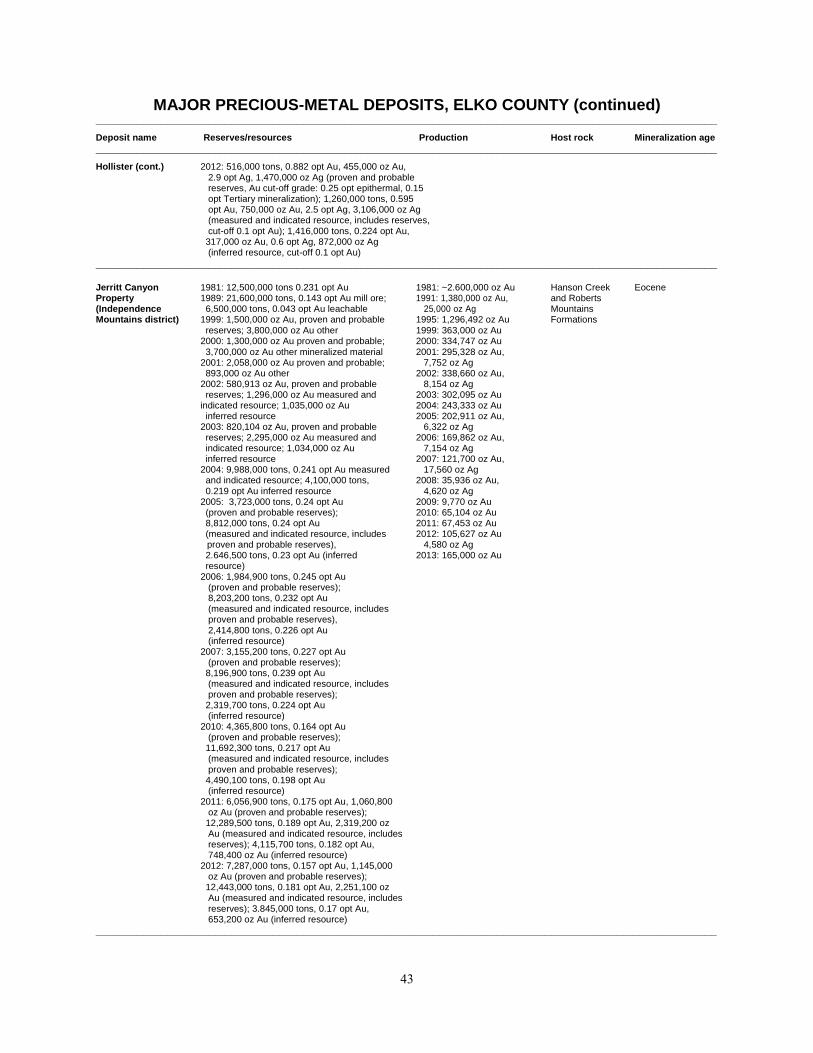
43
MAJOR PRECIOUS-METAL DEPOSITS, ELKO COUNTY (continued) _________________________________________________________________________________________________________
Deposit name Reserves/resources Production Host rock Mineralization age
_________________________________________________________________________________________________________
Hollister (cont.) 2012: 516,000 tons, 0.882 opt Au, 455,000 oz Au, 2.9 opt Ag, 1,470,000 oz Ag (proven and probable reserves, Au cut-off grade: 0.25 opt epithermal, 0.15 opt Tertiary mineralization); 1,260,000 tons, 0.595 opt Au, 750,000 oz Au, 2.5 opt Ag, 3,106,000 oz Ag (measured and indicated resource, includes reserves, cut-off 0.1 opt Au); 1,416,000 tons, 0.224 opt Au, 317,000 oz Au, 0.6 opt Ag, 872,000 oz Ag (inferred resource, cut-off 0.1 opt Au)
_________________________________________________________________________________________________________
Jerritt Canyon 1981: 12,500,000 tons 0.231 opt Au 1981: ~2.600,000 oz Au Hanson Creek Eocene Property 1989: 21,600,000 tons, 0.143 opt Au mill ore; 1991: 1,380,000 oz Au, and Roberts (Independence 6,500,000 tons, 0.043 opt Au leachable 25,000 oz Ag Mountains Mountains district) 1999: 1,500,000 oz Au, proven and probable 1995: 1,296,492 oz Au Formations reserves; 3,800,000 oz Au other 1999: 363,000 oz Au 2000: 1,300,000 oz Au proven and probable; 2000: 334,747 oz Au
3,700,000 oz Au other mineralized material 2001: 295,328 oz Au, 2001: 2,058,000 oz Au proven and probable; 7,752 oz Ag 893,000 oz Au other 2002: 338,660 oz Au, 2002: 580,913 oz Au, proven and probable 8,154 oz Ag reserves; 1,296,000 oz Au measured and 2003: 302,095 oz Au indicated resource; 1,035,000 oz Au 2004: 243,333 oz Au inferred resource 2005: 202,911 oz Au, 2003: 820,104 oz Au, proven and probable 6,322 oz Ag reserves; 2,295,000 oz Au measured and 2006: 169,862 oz Au, indicated resource; 1,034,000 oz Au 7,154 oz Ag inferred resource 2007: 121,700 oz Au, 2004: 9,988,000 tons, 0.241 opt Au measured 17,560 oz Ag and indicated resource; 4,100,000 tons, 2008: 35,936 oz Au, 0.219 opt Au inferred resource 4,620 oz Ag 2005: 3,723,000 tons, 0.24 opt Au 2009: 9,770 oz Au (proven and probable reserves); 2010: 65,104 oz Au 8,812,000 tons, 0.24 opt Au 2011: 67,453 oz Au
(measured and indicated resource, includes 2012: 105,627 oz Au proven and probable reserves), 4,580 oz Ag
2.646,500 tons, 0.23 opt Au (inferred 2013: 165,000 oz Au resource) 2006: 1,984,900 tons, 0.245 opt Au (proven and probable reserves); 8,203,200 tons, 0.232 opt Au (measured and indicated resource, includes proven and probable reserves), 2,414,800 tons, 0.226 opt Au (inferred resource) 2007: 3,155,200 tons, 0.227 opt Au (proven and probable reserves); 8,196,900 tons, 0.239 opt Au (measured and indicated resource, includes proven and probable reserves); 2,319,700 tons, 0.224 opt Au (inferred resource) 2010: 4,365,800 tons, 0.164 opt Au (proven and probable reserves); 11,692,300 tons, 0.217 opt Au (measured and indicated resource, includes proven and probable reserves); 4,490,100 tons, 0.198 opt Au (inferred resource) 2011: 6,056,900 tons, 0.175 opt Au, 1,060,800 oz Au (proven and probable reserves); 12,289,500 tons, 0.189 opt Au, 2,319,200 oz Au (measured and indicated resource, includes reserves); 4,115,700 tons, 0.182 opt Au, 748,400 oz Au (inferred resource) 2012: 7,287,000 tons, 0.157 opt Au, 1,145,000 oz Au (proven and probable reserves); 12,443,000 tons, 0.181 opt Au, 2,251,100 oz Au (measured and indicated resource, includes reserves); 3.845,000 tons, 0.17 opt Au, 653,200 oz Au (inferred resource)
_________________________________________________________________________________________________________

44
MAJOR PRECIOUS-METAL DEPOSITS, ELKO COUNTY (continued) _________________________________________________________________________________________________________
Deposit name Reserves/resources Production Host rock Mineralization age
_________________________________________________________________________________________________________
Kinsley Mountain 1988: 2,100,000 tons, 0.048 opt Au 1993: evaluation upper Paleozoic Oligocene? (Kinsley district) 1996: 3,400,000 tons, 0.032 opt Au 1995-97: 127,065 oz Au, carbonate rocks 1999: (Main NW-trend oxidized): 785,808 24,452 oz Ag tons, 0.037 opt Au, 28,799 oz Au; 1998: 9,543 oz Au (SW “off-trend” oxidized): 590,022 tons, 1999: 1,543 oz Au 0.024 opt Au, 14,227 oz Au; (Main trend, (Unoxidized/refractory): 994,162 tons, 0.072 opt Au, 71,904 oz Au (drill indicated resources)
_________________________________________________________________________________________________________
Long Canyon 2009 (March, 0.012 opt Au cut-off grade): limestone and (Pequop district) 5,300,000 tons, 0.069 opt Au (indicated dolomite resource); 9,678,000 tons, 0.048 opt Au 9,678,000 tons, 0.048 opt Au (inferred resource) 2010 (May, 0.006 opt Au cut-off grade): 13,492,000 tons, 0.050 opt Au (measured and indicated resource) 11,457,000 tons, 0.048 opt Au (inferred resource) 2010 (year-end, 0.006 opt Au cut-off grade): 20,250,000 tons, 0.069 opt Au (measured and indicated resource) 12,313,000 tons, 0.056 opt au (inferred resource) 2012: 27,900,000 tons, 0.094 opt Au 2,630,000 oz Au (inferred resource) 2013: 15,700,000 tons, 0.065 opt Au, 1,010,000 oz Au (probable reserves, 78% metallurgical recovery); 3,700,000 tons, 0.097 opt Au (mineralized material) [NI43-101 compliant]
_________________________________________________________________________________________________________
Maverick Springs 2002: 350,000 oz Au, 32,300,000 oz Ag (Maverick Springs area) (indicated resource); 747,000 oz Au, 68,800,000 oz Ag (inferred resource) 2004: 69,630,000 tons, 0.01 opt Au (indicated resource); 85,550,000 tons, 0.008 opt Au (inferred resource)
_________________________________________________________________________________________________________
Meikle 1992: 7,900,000 tons, 0.613 opt Au 1996: 78,442 oz Au Popovich and Eocene (Lynn district) (geologic resource) 1997-98: 1,421,621 oz Au, Roberts Mountains 1999: 5,900,000 tons, 0.647 opt Au 426,030 oz Ag Formations (proven and probable reserves); 3,300,000 1999: 977,356 oz Au, tons, 0.457 opt Au mineralized material 263,225 oz Ag 2000: 4,900,000 tons, 0.540 opt Au (proven 2000: 805,718 oz Au, and probable reserves); 2,900,000 tons, 205,000 oz Ag 0.450 opt Au (mineral resource) 2001: 712,688 oz Au, 2001: 9,000,000 tons, 0.439 opt Au (proven 213,370 oz Ag and probable reserves); 13,500,000 tons, 2002: 640,337 oz Au, 0.433 opt Au (mineral resource) 203,574 oz Ag 2002: 9,800,000 tons, 0.398 opt Au 2003: 551,664 oz Au, (proven and probable reserves); 12,900,000 99,614 oz Ag tons, 0.396 opt Au (mineral resource) 2004: 561,345 oz Au, 2003: 3,316,000 tons, 0.467 opt Au (proven 129,520 oz Ag Reserves0; 5,862,000 tons, 0.326 opt Au 2005 (includes all underground (probable reserves); 1,580,000 tons, 0.435 opt production at Goldstrike): Au (measured resource); 4,261,000 tons, 0.423 509,568 oz Au, opt Au (indicated resource); 7,725,000 tons, 133,979 oz Ag 0.366 opt Au (inferred resource) 2006 (includes all underground 2004: 7,575,000 tons, 0.392 opt Au (proven and production at Goldstrike): probable reserves); 6,268,000 tons, 0.379 opt Au 477,035 oz Au, 58,345 oz Ag (mineral resource) 2007 (includes all underground 2005 (includes all underground resources at production at Goldstrike): Goldstrike): 7,319,000 tons, 0.379 opt Au (proven 413,186 oz Au, 74,000 oz Ag and probable reserves); 3,234,000 tons, 0.386 2008 (includes all underground opt Au (measured and indicated resource); production at Goldstrike): 3,034,000 tons, 0.386 opt Au (inferred resource) 424,687 oz Au, 51,434 oz Ag 2006 (includes all underground resources at 2009 (includes all underground Goldstrike): 7,662,000 tons, 0.370 opt Au (proven production at Goldstrike): and probable reserves); 4,143,000 tons, 0.338 388,548 oz Au, 30,198 oz Ag opt Au (measured and indicated resource); 2010 (includes all underground 2,159,000 tons, 0.301 opt Au (inferred resource) production at Goldstrike):
281,308 oz Au, 22,628 oz Ag

45
MAJOR PRECIOUS-METAL DEPOSITS, ELKO COUNTY (continued) _________________________________________________________________________________________________________
Deposit name Reserves/resources Production Host rock Mineralization age
_________________________________________________________________________________________________________
Meikle (cont.) 2007 (includes all underground resources at 2011 (includes all underground Goldstrike): 7,423,000 tons, 0.364 opt Au (proven production at Goldstrike): and probable reserves); 4,129,000 tons, 0.329 opt 279,348 oz Au, 16,345 oz Ag Au (measured and indicated resource); 2,747,000 2012: 327,203 oz Au, tons, 0.371 opt Au (inferred resource) 41,775 oz Ag 2008 (includes all underground resources at 2013: 360,578 oz Au, Goldstrike): 6,923,000 tons, 0.368 opt Au proven 58,352 oz Ag and probable reserves; 4,467,000 tons, 0.323 opt Au measured and indicated resource; 3,424,000 tons, 0.393 opt Au inferred resource 2009 (includes all underground resources at Goldstrike): 8,998,000 tons, 0.318 opt Au proven and probable reserves; 4,436,000 tons, 0.334 opt Au measured and indicated resource; 1,858,000 tons, 0.341 opt Au inferred resource 2010 (includes all underground resources at Goldstrike): 10,872,000 tons, 0.272 opt Au (proven and probable reserves); 6,771,000 tons, 0.298 opt Au (measured and indicated resource) 3,047,000 tons, 0.298 opt Au (inferred resource) 2011 (includes all underground resources at Goldstrike): 11,895,000 tons, 0.255 opt Au, 3,055,000 oz Au (proven and probable reserves); 6,077,000 tons, 0.325 opt Au, 1,828,000 oz Au (measured and indicated resource); 2,698,000 tons, 0.298 opt Au, 805,000 oz Au (inferred resource) 2012 (includes all underground resources at Goldstrike): 14,632,000 tons, 0.233 opt Au, 3,405,000 oz Au (proven and probable reserves); 6,144,000 tons, 0.303 opt Au, 1,864,000 oz Au (measured and indicated resource); 2,387,000 tons, 0.265 opt Au, 633,000 oz Au (inferred resource) 2013 (includes all underground resources at Goldstrike): 10,474,000 tons, 0.247 opt Au, 2,585,000 oz Au (proven and probable reserves); 5,985,000 tons, 0.302 opt Au, 1,810,000 oz Au (measured and indicated resource); 1,302,000 tons, 0.311 opt Au, 405,000 oz Au (inferred resource)
_________________________________________________________________________________________________________
MCE 2005-2007: 4,400 tons, 0.20 opt Au Hanson Creek and (Jerritt Canyon, (underground measured and indicated resource) Roberts Mountains Independence 7,800 tons, 0.19 opt Au Formations Mountains district) (underground inferred resource)
_________________________________________________________________________________________________________
Midas (Ken Snyder) 1995: 13,000,000 tons, 0.16 opt Au, 1998: 4,357 oz Au, Tertiary Miocene Mine 2.7 opt Ag, announced resource, 55,329 oz Ag volcanic rocks (Gold Circle district) proven Au reserves<500,000 oz 1999: 189,081 oz Au, 1996: 1,100,000 tons, 1.324 opt Au, 14.95 opt Ag 1,938,470 oz Ag 1999: 3,000,000 tons, 0.816 opt Au, 9.835 opt Ag 2000: 197,800 oz Au, (proven and probable reserves) 1,941,989 oz Ag 2000: 3,400,000 tons, 0.63 opt Au, 7.77 opt Ag 2001: 198,518 oz Au, (proven and probable reserves) 2,393,246 oz Ag 2002: 3,400,000 tons, 0.65 opt Au (proven and 2002: 232,949 oz Au, probable reserves); 400,000 tons 0.46 opt Au 2,870,164 oz Ag (measured and indicated mineralized material); 2003: 218,966 oz Au, 200,000 tons 0.55 opt Au (inferred mineralized 2,647,374 oz Ag material) 2004: 219,778 oz Au, 2003: 700,000 tons, 0.83 opt Au (proven reserves); 2,471,135 oz Ag 2,700,000 tons, 0.51 opt Au (probable reserves); 2005: 167,297 oz Au, 900,000 tons 0.42 opt Au (indicated material) 2,166,396 oz Ag 2004: 2,900,000 tons, 0.510 opt Au (proven and 2006: 140,884 oz Au, probable reserves); 200,000 tons, 0.58 opt Au 1,694,060 oz Ag (indicated resource); 700,000 tons, 0.31 opt Au 2007: 79,133 oz Au, (inferred resource) 1,040,059 oz Ag 2005: 1,500,000 tons, 0.58 opt Au (proven and 2008: 150,608 oz Au probable reserves); 600,000 tons, 0.42 opt Au, 1,872,883 oz Ag (inferred resource) 2009: 123,621 oz Au, 1,634,601 oz Ag 2006: 1,200,000 tons, 0.47 opt Au (proven and 2010: 127,196 oz Au, 1,710,318 oz Ag

46
MAJOR PRECIOUS-METAL DEPOSITS, ELKO COUNTY (continued) _________________________________________________________________________________________________________
Deposit name Reserves/resources Production Host rock Mineralization age
_________________________________________________________________________________________________________
Midas (cont.) probable reserves which includes 6,800,000 oz 2011: 111,476 oz Au; 1,512,287 oz Ag Ag); 800,000 tons, 0.33 opt Au, (inferred 2012: 82,922 oz Au; 1,247,994 oz Ag resource) 2013: 52,195 oz Au, 1,368,896 oz Ag 2007: 1,000,000 tons, 0.493 opt Au, (proven and probable reserves which includes 7,500,000 oz Ag); 200,000 tons, 0.345 opt Au (measured and indicated resource); 100,000 tons, 0.3013 opt Au (inferred resource) 2008: 900,000 tons, 0.436 opt Au, (proven and probable reserves); 200,000 tons, 0.186 opt Au, (measured and indicated resource); 100,000 tons, 0.321 opt Au (inferred resource) 2009: 700,000 tons, 0.425 opt Au, (proven and probable reserves, also includes 4,600,000 oz Ag); 100,000 tons, 0.193 opt Au, measured and indicated resource); 100,000 tons, 0.248 opt Au (inferred resource) 2010: 500,000 tons, 0.319 opt Au (proven and probable reserves, 95% recovery, also includes 2,800,000 oz Ag); 120,000 tons, 0.167 opt Au (measured and indicated resource) 2011: 800,000 tons, 0.226 opt Au, 7.201 opt Ag, 160,000 Au, 5,250,000 oz Ag (proven and probable reserves, 95% Au and 88% Ag recovery); 110,000 tons, 0.070 opt Au; 100,000 tons 4.352 opt Ag (measured and indicated resource); 100,000 tons, 0.049 opt Au, 9.56 opt Ag (inferred resource) 2012: 600,000 tons, 0.095 opt Au, 7.791 opt Ag, 50,000 Au, 4,410,000 oz Ag (proven and probable reserves, 90% Au and 90% Ag recovery); 100,000 tons, 0.056 opt Au, 6.879 opt Ag, N/A oz Au, 740,000 oz Ag (measured and indicated resource); 300,000 tons, 0.07 opt Au, 7.156 opt, Ag, 20,000 oz Au, 2,500,000 oz Ag (inferred resource) 2013: 250,000 tons, 0.093 opt Au, 30,000 oz Au, 11.48 opt Ag, 2,820,000 oz Ag (proven and probable reserve, 85% Au, 93% Ag recovery); 100,000 tons, 0.04 opt Au, 7.25 opt Ag (mineralized material) [NI43-101 compliant]
_________________________________________________________________________________________________________
Mill Creek 2005-2007: 78,400 tons, 0.12 opt Au Hanson Creek and (Jerritt Canyon, (measured and indicated resource) Roberts Mountains Independence 2011: 186,000 tons, 0.09 opt Au, 16,800 oz Au Formations Mountains district) (proven and probable reserves, open pit) 276,200 tons, 0.094 opt Au, 26,100 oz Au (measured and indicated resource, includes reserves) 3,400 tons, 0.154 opt Au, 500 oz Au (inferred resource) 2012: 197,000 tons, 0.09 opt Au, 17,700 oz Au (proven and probable reserves, open pit) 302,000 tons, 0.094 opt Au, 28,300 oz Au (measured and indicated resource, includes reserves) 4,000 tons, 0.153 opt Au, 600 oz Au (inferred resource)
_________________________________________________________________________________________________________
Murray 2005: 243,300 tons, 0.26 opt Au Hanson Creek and (Jerritt Canyon, (proven and probable reserves) Roberts Mountains Independence 789,200 tons, 0.29 opt Au Formations Mountains district) (measured and indicated resource, includes reserves) 2006: 18,400 tons, 0.266 opt Au (proven and probable reserves); 393,300 tons, 0.290 opt Au (measured and indicated resource, includes reserves); 152,000 tons, 0.220 opt Au (inferred resource) 2007: 393,300 tons, 0.290 opt Au (measured and indicated resource); 152,000 tons, 0.220 opt Au (inferred resource) 2011: 412,400 tons, 0.221 opt Au, 91,100 oz Au (proven and probable reserves, underground) 590,200 tons, 0.213 opt Au, 125,900 oz Au (measured and indicated resource, includes reserves)

47
MAJOR PRECIOUS-METAL DEPOSITS, ELKO COUNTY (continued) _________________________________________________________________________________________________________
Deposit name Reserves/resources Production Host rock Mineralization age
_________________________________________________________________________________________________________
Murray (cont.) 86,000 tons, 0.215 opt Au, 18,500 oz Au (inferred resource) 2012: 495,400 tons, 0.165 opt Au, 81,700 oz Au (proven and probable reserves); 545,000 tons, 0.165 opt Au, 89,900 oz Au (measured and indicated resource, includes reserves); 61,000 tons, 0.162 opt Au, 10,000 oz Au (inferred resource)
_________________________________________________________________________________________________________
Pie Creek 2005-2007: 190,200 tons, 0.16 opt Au Hanson Creek and (Jerritt Canyon, (measured and indicated resource) Roberts Mountains Independence 28,300 tons, 0.14 opt Au Formations Mountains district) (inferred resource) 2011: 205,400 tons, 0.087 opt Au, 17,900 oz Au (indicated resource, open pit); 4,900 tons, 0.09 opt Au, 400 oz Au (inferred resource) 2012: 225,000 tons, 0.086 opt Au, 19,200 oz Au (indicated resource, open pit); 5,000 tons, 0.089 opt Au, 500 oz Au (inferred resource)
_________________________________________________________________________________________________________
Piñon (South Bullion 1996: 38,300,000 tons, 0.026 opt Au Webb Formation siltstone and Dark Star) geologic mineral inventory Devils Gate Limestone (Robinson Mountain 2002: 30,600,000 tons, 0.026 opt Au, district) measured, indicated, and inferred resource 2014: 22,970,000 tons, 0.018 opt Au, 423,000 oz Au (indicated resource); 61,650,000 tons, 0.017 opt Au, 1,022,000 oz Au (inferred resource)
_________________________________________________________________________________________________________
Pony Creek 1994:1,100,000 tons, 0.057 opt Au (Robinson Mountain (geologic resource) district) 2004: 32,410,000 tons, 0.044 opt Au (inferred resource)
_________________________________________________________________________________________________________
Railroad Property 1997: 1,500,000 tons, 0.085 opt Au (POD zone) drill-indicated resource (Railroad district)
_________________________________________________________________________________________________________
Rain Property 1982: 3,400,000 tons, 0.147 opt Au and (Carlin district) 8,300,000 tons, 0.083 opt Au
Gnome 1988: 2,700,000 tons, 0.048 opt Au Webb Formation Eocene
Emigrant 1989 (Emigrant Springs): 30,300,000 tons 2012: 20,738 oz Au, Webb Formation Eocene 0.021 opt Au 2,376 oz Ag 2005 (Emigrant Springs): 1,531,165 oz Au 2013: included in Newmont (proven and probable reserves) Gold production at the end 2011 low grade oxide: 1,600,000 oz Au of his section (reserves) 2012: 1,240,000 oz Au (reserves)
Rain 1989: 22,600,000 tons, 0.052 opt Au 1988: 29,000 oz Au (geologic resource) 1991: 135,000 oz Au 1996 (Rain/Emigrant Springs): 16,000,000 tons, 1994: 79,000 oz Au 0.028 opt Au (proven and probable reserves); 1995: 32,100 oz Au 10,400,000 tons, 0.021 opt Au (mineralized 1996: 48,900 oz Au
material) 1997-1998: included in 1999: 13,467,000 tons, 0.026 opt Au proven Newmont Gold production
and probable open-pit ore, 411,000 tons, at the end of this section 0.316 proven and probable underground ore 1999: 23,477 oz Au 2000: 25,004 oz Au, 2,539 oz Ag 2001: 43,488 oz Au, 9,887 oz Ag 2002: 20,065 oz Au, 4,042 oz Ag 2003: 5,039 oz Au, 928 oz Ag 2004: 1,956 oz Au, 551 oz Ag 2005: 404 oz Au, 90 oz Ag
Saddle 2000: 2,000,000 tons, 0.5 opt Au

48
MAJOR PRECIOUS-METAL DEPOSITS, ELKO COUNTY (continued) _________________________________________________________________________________________________________
Deposit name Reserves/resources Production Host rock Mineralization age
_________________________________________________________________________________________________________
SMZ 1989: 1,600,000 tons, 0.019 opt Au (geologic resource)
Rain district 2000: 13,500,000 tons, 0.026 opt Au proven and probable open-pit ore; 308,000 tons, 0.267 opt Au (proven and probable underground ore) 2001: 13,500,000 tons, 0.026 opt Au (proven and probable open-pit ore); 21,000 tons, 0.024 opt Au (proven and probable underground ore); 1,300,000 tons, 0.048 opt Au (mineralized material)
_________________________________________________________________________________________________________
REN 2003: 2,100,000 tons, 0.43 opt Au (Bootstrap district) (inferred resource) 2005: 2,100,000 tons, 0.38 opt Au (indicated resource); 1,400,000 tons, 0.37 opt Au (inferred resource)
2006: 2,713,000 tons, 0.37 opt Au (indicated resource); 758,000 tons, 0.47 opt Au (inferred resource) 2007: 2,991,000 tons, 0.37 opt Au (indicated resource); 835,000 tons, 0.47 opt Au (inferred resource)
_________________________________________________________________________________________________________
Road Canyon 2005-2007: 148,600 tons, 0.14 opt Au (measured Hanson Creek and (Jerritt Canyon, and indicated resource); 74,300 tons, 0.13 opt Au Roberts Mountains Independence (inferred resource) Formations Mountains district) 2011: 17,500 tons, 0.069 opt Au, 1,200 oz Au (indicated resource, open pit) 185,100 tons, 0.082 opt Au, 15,100 oz Au (inferred resource)
_________________________________________________________________________________________________________
Road Canyon (cont.) 2012: 17,000 tons, 0.07 opt Au, 1,200 oz Au (indicated resource, open pit) 187,000 tons, 0.081 opt Au, 15,200 oz Au (inferred resource)
_________________________________________________________________________________________________________
Saval 2005: 104,400 tons, 0.23 opt Au (proven and Hanson Creek and (Jerritt Canyon, probable reserves); 460,500 tons, 0.25 opt Au Roberts Mountains Independence (measured and indicated resource, includes Formations Mountains district) reserves); 270,000 tons, 0.25 opt Au (inferred resource) 2006: 120,200 tons, 0.246 opt Au (proven and probable reserves); 369,300 tons, 0.254 opt Au (measured and indicated resource, includes reserves); 191,200 tons, 0.238 opt Au (inferred resource) 2007: 120,200 tons, 0.246 opt Au (proven and probable reserves); 379,800 tons, 0.252 opt Au (measured and indicated resource, includes reserves); 107,400 tons, 0.206 opt Au (inferred resource) 2010: 169,100 tons, 0.210 opt Au (proven and probable reserves, underground) 656,000 tons, 0.227 opt Au (measured and indicated resource, includes reserves); 201,700 tons, 0.209 opt Au (inferred resource) 2011 underground: 169,100 tons, 0.210 opt Au, 35,500 oz Au (proven and probable reserves) 333,600 tons, 0.224 opt Au, 74,800 oz Au (measured and indicated resource, includes reserves); 95,400 tons, 0.2 opt Au, 19,100 oz Au (inferred resource); open pit: 144,900 tons, 0.092 opt Au, 13,400 oz Au (proven and probable reserves) 654,300 tons, 0.074 opt Au, 48,600 oz Au (measured and indicated resource, includes reserves); 222,200 tons, 0.142 opt Au, 31,600 oz Au (inferred resource) 2012 underground: 168,000 tons, 0.207 opt Au, 34,800 oz Au (proven and probable reserves) 177,600 tons, 0.25 opt Au, 44,200 oz Au (measured and indicated resource, includes reserves); 51,000
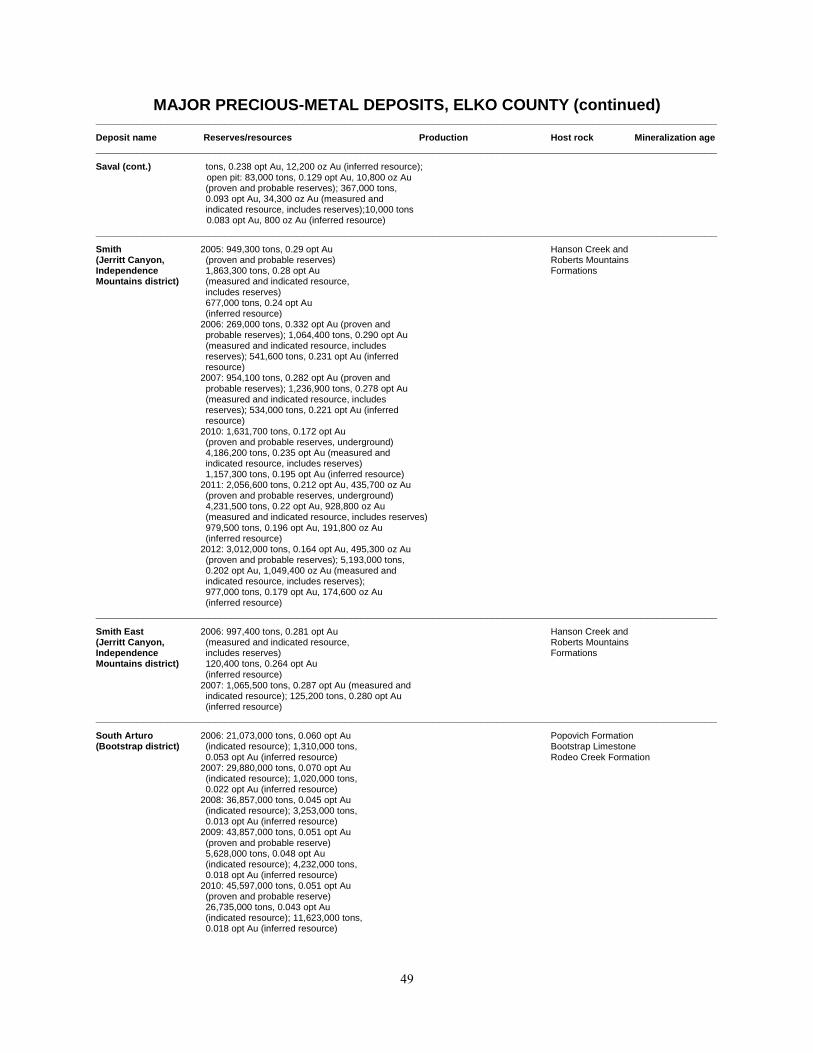
49
MAJOR PRECIOUS-METAL DEPOSITS, ELKO COUNTY (continued) _________________________________________________________________________________________________________
Deposit name Reserves/resources Production Host rock Mineralization age
_________________________________________________________________________________________________________
Saval (cont.) tons, 0.238 opt Au, 12,200 oz Au (inferred resource); open pit: 83,000 tons, 0.129 opt Au, 10,800 oz Au (proven and probable reserves); 367,000 tons, 0.093 opt Au, 34,300 oz Au (measured and indicated resource, includes reserves);10,000 tons 0.083 opt Au, 800 oz Au (inferred resource)
_________________________________________________________________________________________________________
Smith 2005: 949,300 tons, 0.29 opt Au Hanson Creek and (Jerritt Canyon, (proven and probable reserves) Roberts Mountains Independence 1,863,300 tons, 0.28 opt Au Formations Mountains district) (measured and indicated resource, includes reserves) 677,000 tons, 0.24 opt Au (inferred resource) 2006: 269,000 tons, 0.332 opt Au (proven and probable reserves); 1,064,400 tons, 0.290 opt Au (measured and indicated resource, includes reserves); 541,600 tons, 0.231 opt Au (inferred resource) 2007: 954,100 tons, 0.282 opt Au (proven and probable reserves); 1,236,900 tons, 0.278 opt Au (measured and indicated resource, includes reserves); 534,000 tons, 0.221 opt Au (inferred resource) 2010: 1,631,700 tons, 0.172 opt Au (proven and probable reserves, underground) 4,186,200 tons, 0.235 opt Au (measured and indicated resource, includes reserves) 1,157,300 tons, 0.195 opt Au (inferred resource) 2011: 2,056,600 tons, 0.212 opt Au, 435,700 oz Au (proven and probable reserves, underground) 4,231,500 tons, 0.22 opt Au, 928,800 oz Au (measured and indicated resource, includes reserves) 979,500 tons, 0.196 opt Au, 191,800 oz Au (inferred resource) 2012: 3,012,000 tons, 0.164 opt Au, 495,300 oz Au (proven and probable reserves); 5,193,000 tons, 0.202 opt Au, 1,049,400 oz Au (measured and indicated resource, includes reserves); 977,000 tons, 0.179 opt Au, 174,600 oz Au (inferred resource)
_________________________________________________________________________________________________________
Smith East 2006: 997,400 tons, 0.281 opt Au Hanson Creek and (Jerritt Canyon, (measured and indicated resource, Roberts Mountains Independence includes reserves) Formations Mountains district) 120,400 tons, 0.264 opt Au (inferred resource) 2007: 1,065,500 tons, 0.287 opt Au (measured and indicated resource); 125,200 tons, 0.280 opt Au (inferred resource)
_________________________________________________________________________________________________________
South Arturo 2006: 21,073,000 tons, 0.060 opt Au Popovich Formation (Bootstrap district) (indicated resource); 1,310,000 tons, Bootstrap Limestone 0.053 opt Au (inferred resource) Rodeo Creek Formation 2007: 29,880,000 tons, 0.070 opt Au (indicated resource); 1,020,000 tons, 0.022 opt Au (inferred resource) 2008: 36,857,000 tons, 0.045 opt Au (indicated resource); 3,253,000 tons, 0.013 opt Au (inferred resource) 2009: 43,857,000 tons, 0.051 opt Au (proven and probable reserve) 5,628,000 tons, 0.048 opt Au (indicated resource); 4,232,000 tons, 0.018 opt Au (inferred resource) 2010: 45,597,000 tons, 0.051 opt Au (proven and probable reserve) 26,735,000 tons, 0.043 opt Au (indicated resource); 11,623,000 tons, 0.018 opt Au (inferred resource)
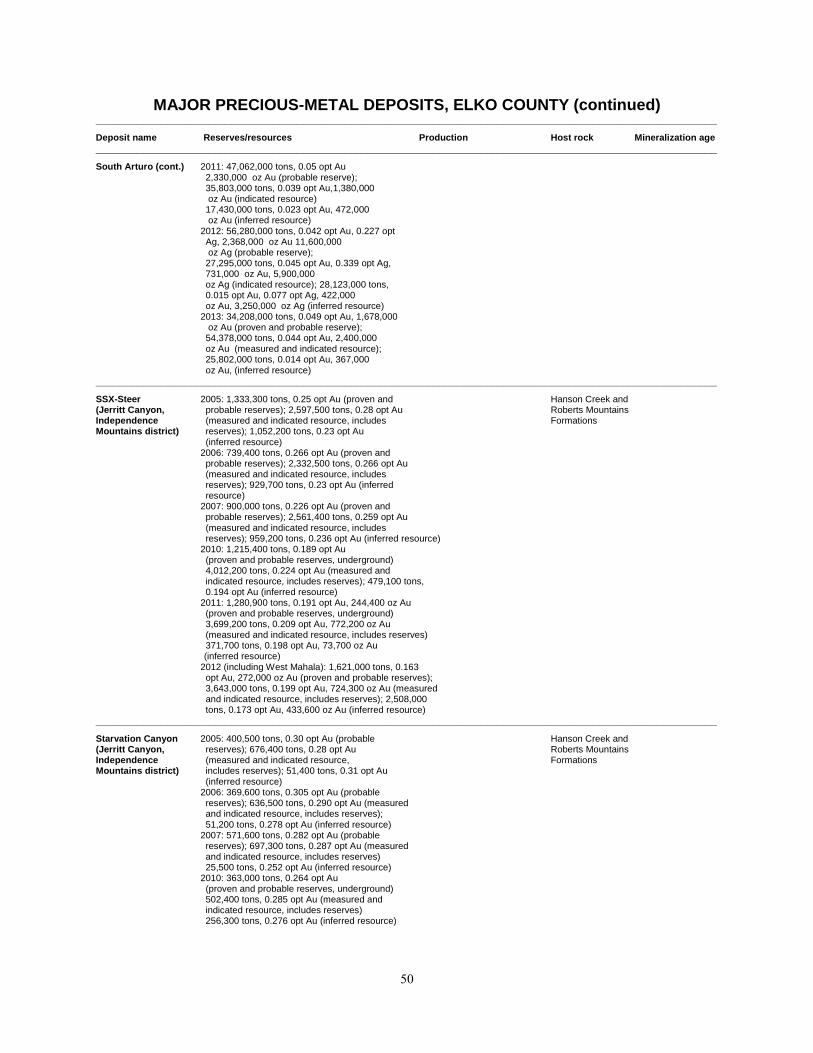
50
MAJOR PRECIOUS-METAL DEPOSITS, ELKO COUNTY (continued) _________________________________________________________________________________________________________
Deposit name Reserves/resources Production Host rock Mineralization age
_________________________________________________________________________________________________________
South Arturo (cont.) 2011: 47,062,000 tons, 0.05 opt Au 2,330,000 oz Au (probable reserve); 35,803,000 tons, 0.039 opt Au,1,380,000 oz Au (indicated resource) 17,430,000 tons, 0.023 opt Au, 472,000 oz Au (inferred resource) 2012: 56,280,000 tons, 0.042 opt Au, 0.227 opt Ag, 2,368,000 oz Au 11,600,000 oz Ag (probable reserve); 27,295,000 tons, 0.045 opt Au, 0.339 opt Ag, 731,000 oz Au, 5,900,000 oz Ag (indicated resource); 28,123,000 tons, 0.015 opt Au, 0.077 opt Ag, 422,000 oz Au, 3,250,000 oz Ag (inferred resource) 2013: 34,208,000 tons, 0.049 opt Au, 1,678,000 oz Au (proven and probable reserve); 54,378,000 tons, 0.044 opt Au, 2,400,000 oz Au (measured and indicated resource); 25,802,000 tons, 0.014 opt Au, 367,000 oz Au, (inferred resource)
_________________________________________________________________________________________________________
SSX-Steer 2005: 1,333,300 tons, 0.25 opt Au (proven and Hanson Creek and (Jerritt Canyon, probable reserves); 2,597,500 tons, 0.28 opt Au Roberts Mountains Independence (measured and indicated resource, includes Formations Mountains district) reserves); 1,052,200 tons, 0.23 opt Au (inferred resource) 2006: 739,400 tons, 0.266 opt Au (proven and probable reserves); 2,332,500 tons, 0.266 opt Au (measured and indicated resource, includes reserves); 929,700 tons, 0.23 opt Au (inferred resource) 2007: 900,000 tons, 0.226 opt Au (proven and probable reserves); 2,561,400 tons, 0.259 opt Au (measured and indicated resource, includes reserves); 959,200 tons, 0.236 opt Au (inferred resource) 2010: 1,215,400 tons, 0.189 opt Au (proven and probable reserves, underground) 4,012,200 tons, 0.224 opt Au (measured and indicated resource, includes reserves); 479,100 tons, 0.194 opt Au (inferred resource) 2011: 1,280,900 tons, 0.191 opt Au, 244,400 oz Au (proven and probable reserves, underground) 3,699,200 tons, 0.209 opt Au, 772,200 oz Au (measured and indicated resource, includes reserves) 371,700 tons, 0.198 opt Au, 73,700 oz Au (inferred resource) 2012 (including West Mahala): 1,621,000 tons, 0.163 opt Au, 272,000 oz Au (proven and probable reserves); 3,643,000 tons, 0.199 opt Au, 724,300 oz Au (measured and indicated resource, includes reserves); 2,508,000 tons, 0.173 opt Au, 433,600 oz Au (inferred resource)
_________________________________________________________________________________________________________
Starvation Canyon 2005: 400,500 tons, 0.30 opt Au (probable Hanson Creek and (Jerritt Canyon, reserves); 676,400 tons, 0.28 opt Au Roberts Mountains Independence (measured and indicated resource, Formations Mountains district) includes reserves); 51,400 tons, 0.31 opt Au (inferred resource) 2006: 369,600 tons, 0.305 opt Au (probable reserves); 636,500 tons, 0.290 opt Au (measured and indicated resource, includes reserves); 51,200 tons, 0.278 opt Au (inferred resource) 2007: 571,600 tons, 0.282 opt Au (probable reserves); 697,300 tons, 0.287 opt Au (measured and indicated resource, includes reserves) 25,500 tons, 0.252 opt Au (inferred resource) 2010: 363,000 tons, 0.264 opt Au (proven and probable reserves, underground) 502,400 tons, 0.285 opt Au (measured and indicated resource, includes reserves) 256,300 tons, 0.276 opt Au (inferred resource)

51
MAJOR PRECIOUS-METAL DEPOSITS, ELKO COUNTY (continued) _________________________________________________________________________________________________________
Deposit name Reserves/resources Production Host rock Mineralization age
_________________________________________________________________________________________________________
Starvation Canyon 2011: 343,400 tons, 0.265 opt Au, 90,900 oz Au (cont.) (proven and probable reserves, underground) 525,200 tons, 0.251 opt Au, 131,800 oz Au (measured and indicated resource, includes reserves) 244,400 tons, 0.253 opt Au, 64,600 oz Au (inferred resource) 2012: 970,000 tons, 0.178 opt Au, 172,600 oz Au (proven and probable reserves); 970,000 tons, 0.178 opt Au, 172,600 oz Au; (measured and indicated resource, includes reserves); 21,000 tons, 0.17 opt Au, 3,600 oz Au (inferred resource)
_________________________________________________________________________________________________________
Storm Mine 1998: 3,100,000 tons, 0.371 opt Au (resource) 2008: 52,000 oz Au Popovich Formation (Rossi) 2000: 2,700,000 tons, 0.345 opt Au (resource) 2009: 64,558 oz Au, Bootstrap Limestone (Bootstrap district) 2002: 1,900,000 tons, 0.335 opt Au (measured 50,069 oz Ag Rodeo Creek Formation
and indicated resource); 1,000,000 tons, 2010: 74,429 oz Au, 0.0335 opt Au (inferred resource) 63,309 oz Ag 2005 and 2006: 500,000 tons, 0.449 opt Au 2011: 86,508 oz Au, (measured and indicated resource) 73,588 oz Ag 800,000 tons, 0.376 opt Au, (inferred resource) 2012: 33,802 oz Au, 18,875 oz Ag 2013: 9,503 oz Au, 15,575 oz Ag
_________________________________________________________________________________________________________
Trout Creek 1988: 1,500,000 tons, 0.04 opt Au 1988: exploration Miocene (Contact district) sedimentary rocks
_________________________________________________________________________________________________________
Tuscarora 1987: 2,000,000 tons, 0.039 opt Au, 1896-1902: 29,940 oz Au, Eocene rhyolitic Eocene (Dexter) 1.9 opt Ag 28,543 oz Ag ignimbrite and (Tuscarora district) 1988: 1,800,000 tons, 0.037 opt Au, 1987-90: 34,163 oz Au, andesite 0.74 opt Ag 189,865 oz Ag
_________________________________________________________________________________________________________
Twelvemile Ranch 1986: 4,000,000 tons, 0.01 opt Au, volcanic and (Tecoma district) (resource) sedimentary rocks
_________________________________________________________________________________________________________
Waterpipe II 2005-2007: 37,400 tons, 0.21 opt Au Roberts Mountains (Jerritt Canyon, (underground inferred resource) Formation Independence Mountains district)
_________________________________________________________________________________________________________
West Mahala 2005 and 2006: 368,100 tons, 0.22 opt Au Hanson Creek and (Jerritt Canyon, (underground measured and indicated resource); Roberts Mountains Independence 141,900 tons, 0.21 opt Au (underground inferred Formations Mountains district) resource) 2007: 197,500 tons, 0.218 opt Au (underground indicated resource); 129,600 tons, 0.206 opt Au (inferred resource) 2010: 225,800 tons, 0.189 opt Au(measured and indicated resource, underground); 1,956,900 tons, 0.191 opt Au (inferred resource) 2011: 199,300 tons, 0.188 opt Au, 37,500 oz Au (proven and probable reserves, underground) 388,700 tons, 0.19 opt Au, 73,900 oz Au (measured and indicated resource, includes reserves) 1,854,600 tons, 0.175 opt Au, 324,000 oz Au (inferred resource) 2012: Included with SSX
_________________________________________________________________________________________________________
West Pequop 2010: 1,349,700 tons, 0.0.0475 opt Au (measured (Pequop district) and indicated resource); 6,055,500 tons, 0.0411 opt Au (inferred resource)
_________________________________________________________________________________________________________
Winters Creek 1986: 1,400,000 tons, 0.146 opt Au lower Paleozoic Eocene (Jerritt Canyon, 2005-2007: 148,900 tons, 0.22 opt Au (measured carbonate rocks Independence and indicated resource); underground 37,200 Mountains district) tons, 0.2 opt Au, (underground inferred resource)

52
MAJOR PRECIOUS-METAL DEPOSITS, ELKO COUNTY (continued) _________________________________________________________________________________________________________
Deposit name Reserves/resources Production Host rock Mineralization age
_________________________________________________________________________________________________________
Winters Creek (cont.) 2011: 90,300 tons, 0.162 opt Au, 14,600 oz Au (indicated resource, underground); 9,200 tons, 0.186 opt Au, 1,700 oz Au (inferred resource) 2012: 117,000 tons, 0.112 opt Au, 13,100 oz Au (indicated resource); 10,000 tons, 0.145 opt Au, 1,500 oz Au (inferred resource)
_________________________________________________________________________________________________________
Wright Window 1986: 1,300,000 tons, 0.095 opt Au 1992: 3,500 oz Au lower Paleozoic Eocene (Jerritt Canyon, 2005-2007: 32,600 tons, 0.226 opt Au, (probable carbonate rocks Independence reserves); 97,800 tons, 0.16 opt Au, (measured Mountains district) and indicated resource, includes reserves); 19,000 tons, 0.23 opt Au (inferred resource) 2010: 84,500 tons, 0.127 opt Au (probable reserve, open pit); 97,800 tons, 0.156 opt Au (measured and indicated resource, includes reserves); 19,000 tons, 0.229 opt Au (inferred resource) 2011: 112,900 tons, 0.096 opt Au, 10,900 oz Au (proven and probable reserves, open pit); 125,800 tons, 0.094 opt Au, 11,800 oz Au (measured and indicated resource, includes reserves) 4,800 tons, 0.093 opt Au, 400 oz Au (inferred resource) 2012: 114,000 tons, 0.096 opt Au, 11,000 oz Au (proven and probable reserves, open pit); 120,000 tons, 0.094 opt Au, 11,200 oz Au (measured and indicated resource, includes reserves) 5,000 tons, 0.089 opt Au, 500 oz Au (inferred resource)
_________________________________________________________________________________________________________
ESMERALDA COUNTY
_________________________________________________________________________________________________________
Boss 1987: 500,000 tons, 0.07 opt Au Ordovician Miocene? (Gilbert district) 1990: reserves-637,500 tons, 0.023 opt Au sedimentary rocks geologic resource-31,000 oz Au 1996: see Castle
_________________________________________________________________________________________________________
Castle Black Rock 1996: 3.7 million tons, 0.03 opt Au Ordovician (includes Castle and 1997: 10 million tons, 0.03 opt Au resource Palmetto Formation Boss) 2000: 215,000 oz Au indicated resource and (Gilbert district) 93,000 oz Au inferred resource 2012: Castle Zone: 16,185,000 tons, 0.013 opt Au (inferred resource, 0.007 opt Au cut-off grade)
_________________________________________________________________________________________________________
Gemfield 1996: 9,500,000 tons, 0.04 opt Au Sandstorm 21 Ma? (Goldfield district) 1998: 500,000 oz, 0.04 opt Au Rhyolite 2003: see Goldfield project 2004: 16,853,000 tons, 0.032 opt Au (measured and indicated resource); 1,001,000 tons, 0.022 opt Au (inferred resource) 2006: 12,459,000 tons, 0.031 opt Au (measured and indicated resource); 88,000 tons, 0.116 opt Au (inferred resource) 2011: 15,748,000 tons, 0.0325 opt Au, 511,000 oz Au; (proven and probable reserves); 18,772,000 tons, 0.031 opt Au, 438,000 oz Au, 0.098 opt Ag, 1,846,000 oz Ag (measured and indicated resource, 0.009 opt Au cut-off grade); 4,596,000 tons, 0.016 opt Au, 74,000 oz Au, 0.059 opt Ag, 272,000 oz Ag (inferred resource, 0.009 opt Au cut-off grade) 2013: 19,702,600 tons, 0.0298 opt Au, 567,000 oz Au; (proven and probable reserves); 27,070,000 tons, 0.025 opt Au, 681,000 oz (measured and indicated resource, 0.007 opt Au cut-off grade); 1,190,000 tons, 0.015 opt Au, 18,000 oz Au (inferred resource, 0.007 opt Au cut-off grade)
_________________________________________________________________________________________________________
Goldfield Project 1983: 1,750,000 tons, 0.087 opt Au 1903-45: 4.19 million oz Au, andesite, 21 Ma (Goldfield district) 1994: 3,480,000 tons, 0.071 opt Au 1.45 million oz Ag rhyodacite, rhyolite 2003: 23,410,200 tons, 0.031 opt Au (measured 1989-97: 28,373 oz Au and indicated resource); 10,239,100 tons 0.024 opt Au inferred resource (includes Goldfield
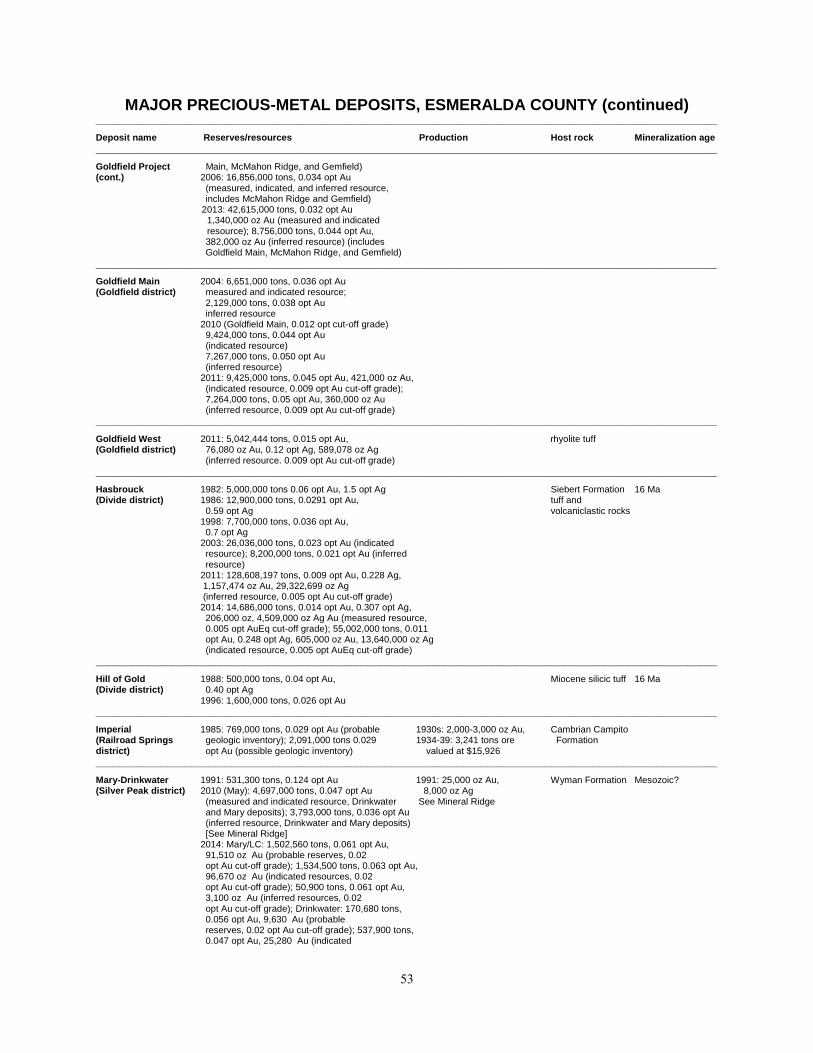
53
MAJOR PRECIOUS-METAL DEPOSITS, ESMERALDA COUNTY (continued) _________________________________________________________________________________________________________
Deposit name Reserves/resources Production Host rock Mineralization age
_________________________________________________________________________________________________________
Goldfield Project Main, McMahon Ridge, and Gemfield) (cont.) 2006: 16,856,000 tons, 0.034 opt Au (measured, indicated, and inferred resource, includes McMahon Ridge and Gemfield) 2013: 42,615,000 tons, 0.032 opt Au 1,340,000 oz Au (measured and indicated resource); 8,756,000 tons, 0.044 opt Au, 382,000 oz Au (inferred resource) (includes Goldfield Main, McMahon Ridge, and Gemfield)
_________________________________________________________________________________________________________
Goldfield Main 2004: 6,651,000 tons, 0.036 opt Au (Goldfield district) measured and indicated resource; 2,129,000 tons, 0.038 opt Au inferred resource 2010 (Goldfield Main, 0.012 opt cut-off grade) 9,424,000 tons, 0.044 opt Au (indicated resource) 7,267,000 tons, 0.050 opt Au (inferred resource) 2011: 9,425,000 tons, 0.045 opt Au, 421,000 oz Au, (indicated resource, 0.009 opt Au cut-off grade); 7,264,000 tons, 0.05 opt Au, 360,000 oz Au (inferred resource, 0.009 opt Au cut-off grade)
_________________________________________________________________________________________________________
Goldfield West 2011: 5,042,444 tons, 0.015 opt Au, rhyolite tuff (Goldfield district) 76,080 oz Au, 0.12 opt Ag, 589,078 oz Ag (inferred resource. 0.009 opt Au cut-off grade)
_________________________________________________________________________________________________________
Hasbrouck 1982: 5,000,000 tons 0.06 opt Au, 1.5 opt Ag Siebert Formation 16 Ma (Divide district) 1986: 12,900,000 tons, 0.0291 opt Au, tuff and 0.59 opt Ag volcaniclastic rocks 1998: 7,700,000 tons, 0.036 opt Au, 0.7 opt Ag 2003: 26,036,000 tons, 0.023 opt Au (indicated resource); 8,200,000 tons, 0.021 opt Au (inferred resource) 2011: 128,608,197 tons, 0.009 opt Au, 0.228 Ag, 1,157,474 oz Au, 29,322,699 oz Ag (inferred resource, 0.005 opt Au cut-off grade) 2014: 14,686,000 tons, 0.014 opt Au, 0.307 opt Ag, 206,000 oz, 4,509,000 oz Ag Au (measured resource, 0.005 opt AuEq cut-off grade); 55,002,000 tons, 0.011 opt Au, 0.248 opt Ag, 605,000 oz Au, 13,640,000 oz Ag (indicated resource, 0.005 opt AuEq cut-off grade)
_________________________________________________________________________________________________________
Hill of Gold 1988: 500,000 tons, 0.04 opt Au, Miocene silicic tuff 16 Ma (Divide district) 0.40 opt Ag 1996: 1,600,000 tons, 0.026 opt Au
_________________________________________________________________________________________________________
Imperial 1985: 769,000 tons, 0.029 opt Au (probable 1930s: 2,000-3,000 oz Au, Cambrian Campito (Railroad Springs geologic inventory); 2,091,000 tons 0.029 1934-39: 3,241 tons ore Formation district) opt Au (possible geologic inventory) valued at $15,926
_________________________________________________________________________________________________________
Mary-Drinkwater 1991: 531,300 tons, 0.124 opt Au 1991: 25,000 oz Au, Wyman Formation Mesozoic? (Silver Peak district) 2010 (May): 4,697,000 tons, 0.047 opt Au 8,000 oz Ag (measured and indicated resource, Drinkwater See Mineral Ridge and Mary deposits); 3,793,000 tons, 0.036 opt Au (inferred resource, Drinkwater and Mary deposits) [See Mineral Ridge] 2014: Mary/LC: 1,502,560 tons, 0.061 opt Au, 91,510 oz Au (probable reserves, 0.02 opt Au cut-off grade); 1,534,500 tons, 0.063 opt Au, 96,670 oz Au (indicated resources, 0.02 opt Au cut-off grade); 50,900 tons, 0.061 opt Au, 3,100 oz Au (inferred resources, 0.02 opt Au cut-off grade); Drinkwater: 170,680 tons, 0.056 opt Au, 9,630 Au (probable reserves, 0.02 opt Au cut-off grade); 537,900 tons, 0.047 opt Au, 25,280 Au (indicated
54
MAJOR PRECIOUS-METAL DEPOSITS, ESMERALDA COUNTY (continued) _________________________________________________________________________________________________________
Deposit name Reserves/resources Production Host rock Mineralization age
_________________________________________________________________________________________________________
Mary-Drinkwater (cont.) resources, 0.02 opt Au cut-off grade); 11,100 tons, 0.035 opt Au, 390 oz Au (inferred resources, 0.02 opt Au cut-off grade) [See Mineral Ridge]
_________________________________________________________________________________________________________
McMahon Ridge 2004: 8,200,000 tons, 0.035 opt Au (measured (Goldfield district) and indicated resource); 171,000 tons, 0.019 opt
Au (inferred resource) 2006: 4,138,000 tons, 0.042 opt Au (measured and indicated resource); 172,000 tons, 0.038 opt Au (inferred resource) 2011: 6,074,000 tons, 0.039 opt Au, 238,000 oz Au (indicated resource, 0.009 opt Au cut-off grade) 121,000 tons, oz, 0.032 opt Au, 4,000 oz Au (inferred resource, 0.009 opt Au cut-off grade)
_________________________________________________________________________________________________________
Mineral Ridge 1995: 5,200,000 tons, 0.068 opt Au (proven and 1997: 13,793 oz Au, Wyman Formation Mesozoic? (Silver Peak district) probable reserves, includes Mary-Drinkwater) 7,907 oz Ag 1998: 4,000,000 tons, 0.06 opt Au; 241,000 oz Au 1998: 8,582 oz Au, 4,877 oz Ag 2000: 2,840,000 tons, 0.074 opt Au (minable 1999: 27,145 oz Au, reserves) 19,915 oz Ag 2002: 2,660,000 tons, 0.079 opt Au (total 2000: 2,200 oz Au, 1,000 oz Ag Reserves) 2001: 1,399 oz Au, 424 oz Ag 2003: 8,300,000 tons, 0.061 opt Au resource 2002: 397 oz Au, 396 oz Ag (includes 2,660,000 tons, 0.079 opt Au 2003: 675 oz Au, 704 oz Ag reserves) 2004: 3,638 oz Au, 3,062 oz Ag 2010 (May): 4,697,000 tons, 0.047 opt Au 2005: 1,589 oz Au, 1,073 oz Ag (measured and indicated resource, Drinkwater 2011: 11,932 oz Au, and Mary deposits); 3,793,000 tons, 0.036 opt Au 6,918 oz Ag (inferred resource, Drinkwater and Mary deposits) 2012: 32,871 oz Au, 2012: 3,231,000 tons, 0.059 opt Au, 190,800 oz Au 13,871 oz Ag (indicated resource, 0.02 opt Au cut-off grade, 2013: 39,160 oz Au, Drinkwater, Mary, and Last Chance deposits) 14,975 oz Ag 89,000 tons, 0.043 opt Au, 3,800 oz Au (inferred resource, 0.02 opt Au cut-off grade, Drinkwater, Mary, and Last Chance deposits) 2014 (incudes Mary/LC and Drinkwater): 2,137,120 tons, 0.061 opt Au, 131,190 oz Au (probable reserves, 0.02 opt Au cut-off grade); 2,697,500 tons, 0.050 opt Au,160,300 oz Au (indicated resources, 0.02 opt Au cut-off grade); 72,730 tons, 0.055 opt Au, 3,970 oz Au (inferred resources, 0.02 opt Au cut-off grade)
_________________________________________________________________________________________________________
Monte Cristo 2006: 363,760 tons, 0.190 opt Au, 0.583 opt Ag late 1980s: 300,000 tons, Tertiary andesite, Tertiary (Gilbert district) (inferred resource) 0.072 opt Au lithic tuff 2010: 2,545,980 tons, 0.11 opt Au (inferred resource, McLean Lode, 0.02 opt cut-off grade) 888,685 tons, 0.04 opt Au (inferred resource, Upper Zone, 0.02 opt cut-off grade) 999,966 tons, 1.27 opt Ag (inferred silver resource, McLean Lode, 0.36 opt cut-off grade) 123,948 tons, 0.78 opt Ag (inferred silver resource, Upper Zone, 0.36 opt cut-off grade)
_________________________________________________________________________________________________________
Nivloc 2011: 1,807,000 tons, 0.023 opt Au, 1937-43: 4,675,408 oz Ag, Alaskite Complex, Late Cenozoic (Red Mtn. district) 41,000 oz Au, 3.11 opt Ag, 5,633,000 oz Ag 18,794 oz Au rhyolite, and
(inferred resource, 1.17 opt Ag cut-off grade) metasediments
_________________________________________________________________________________________________________
Three Hills 1996: 3,200,000 tons, 0.036 opt Au Miocene Siebert (Tonopah district) 1997: 6,300,000 tons, 0.023 opt Au Formation and 2003: 5,736,000 tons, 0.023 opt Au Oddie Rhyolite (indicated resource) 2014: 1,091,000 tons, 0.023 opt Au, 25,000 oz Au (measured resource, 0.005 opt AuEq cut-off grade); 7,413,000 tons, 0.017 opt Au, 126,000 oz Au (indicated resource, 0.005 opt AuEq cut-off grade)
_________________________________________________________________________________________________________

55
MAJOR PRECIOUS-METAL DEPOSITS, ESMERALDA COUNTY (continued) _________________________________________________________________________________________________________
Deposit name Reserves/resources Production Host rock Mineralization age
_________________________________________________________________________________________________________
Tip Top 1997: 109,000 tons, 0.103 opt Au, 0.88 opt Ag Tertiary (Fish Lake Valley (indicated resource) quartz latite district) 1998: 168,000 tons, 0.088 opt Au (inferred geologic resource) 2009: 388,920 tons, 0.096 opt Au
(indicated resource) 323,230 tons, 0.072 opt Au (inferred resource)
_________________________________________________________________________________________________________
Tonopah Divide 1988: 500,000 tons, 0.04 opt Au, 0.4 opt Ag 1912-40: 113,794 tons ore Siebert Formation 16 ma (Divide district) 1997: 1,800,000 tons, 0.55 opt Au 1982-86: 429,876 oz Au 2005: 400,000 tons, 0.348 opt Au (open pit 1983-84: 3,759 oz Ag reserve)
_________________________________________________________________________________________________________
Weepah 1986: 200,000 tons, 0.1 opt Au, 1930s: N/A Wyman Formation Cretaceous (Weepah district) 0.4 opt Ag 1986-87: 58,000 oz Au
_________________________________________________________________________________________________________
EUREKA COUNTY
_________________________________________________________________________________________________________
Afgan 1996: 80,000 oz Au drill-indicated resource Webb Formation (Antelope district) 1999: 2,800,000 tons, 0.037 opt Au oxide resource 2004: 1,850,000 tons, 0.027 opt Au (indicated resource) 1,290,000 tons, 0.026 opt Au (inferred resource) 2011 (oxide): 3,206,000 tons, 0.021 opt Au, 66,000 oz Au (indicated resource, 0.006 opt Au cut-off grade) 3,972,000 tons, 0.014 opt Au, 55,000 oz Au (inferred resource, 0.006 opt Au cut-off grade)
_________________________________________________________________________________________________________
Antimony Hill 2002: 20,000 oz at 0.05 opt Au (pre-mine resource) Vinini Formation (Lynn district)
_________________________________________________________________________________________________________
Barrel 1998 (Barrel and Goldbug): 2,917,000 tons, Popovich Fm. (Lynn district) 0.391 oz Au, 1,140,000 oz Au (proven and Rodeo Creek Fm. probable reserve); 1,170,000 tons, 0.337 opt Au (material not in reserve) 2002: 200,000 oz at 0.2 opt Au (pre-mine resource) 2011 underground: 383,000 tons, 0.217 opt Au, 83,000 oz Au
_________________________________________________________________________________________________________
Beast 2002: 50,000 oz at 0.02 opt Au 1994-1999: 8,000,000 Roberts Mountains Eocene (Lynn district) (pre-mine resource) tons, 0.02 opt Au Fm., Eocene rhyolite dikes
_________________________________________________________________________________________________________
Betze-Post 1988: 128,400,000 tons, 0.095 opt Au 1974: 302,807 oz Au Popovich Fm. Eocene (Lynn district) 1999: 135,600,000 tons, 0.153 opt Au 1980-88: 440,000 oz Au Rodeo Creek Fm. (proven and probable reserves); 23,300,000 1989-92: 2,214,508 oz Au, tons, 0.099 opt Au (mineralized material) 92,347 oz Ag 2000: 116,400,000 tons, 0.155 opt Au (proven 1993: 1,439,929 oz Au and probable); 55,900,000 tons, 0.063 opt Au 1994-98: 8,920,871 oz Au, (mineral resource) 372,403 oz Ag 2001: 108,900,000 tons, 0.151 opt Au (proven 1999: 1,130,094 oz Au, and probable); 49,900,000 tons, 0.069 opt Au 65,804 oz Ag (mineral resource) 2000: 1,646,640 oz Au, 2002: 107,100,000 tons, 0.150 opt Au (proven 52,000 oz Ag and probable reserves); 47.6 million tons, 2001: 1,549,975 oz Au, 0.070 opt Au (mineral resource) 261,261 oz Ag 2003: 61,551,000 tons, 0.128 opt Au (proven 2002: 1,409,984 oz Au, Reserves); 48,191,000 tons, 0.162 opt Au 135,716 oz Ag (probable reserves); 14,077,000 tons, 0.059 opt 2003: 1,559,401 oz Au, Au (measured resource); 23,326,000 tons, 115,473 oz Ag 0.061 opt Au (indicated resource); 323,000 tons, 2004: 1,381,315 oz Au, 0.065 opt Au (inferred resource) 130,609 oz Ag 2004: 123,334,000 tons, 0.131 opt Au (proven 2005: 1,514,320 oz Au, and probable reserves); 22,318,000 tons, 114,248 oz Ag 0.050 opt Au (mineral resource) 2006: 1,432,698 oz Au, 2005: 114,512,000 tons, 0.128 opt Au (proven and 121,032 oz Ag probable reserves); 21,115,000 tons, 0.050 opt 2007: 1,215,447 oz Au, Au (measured and indicated resource); 140,923 oz Ag
56
MAJOR PRECIOUS-METAL DEPOSITS, EUREKA COUNTY (continued) _________________________________________________________________________________________________________
Deposit name Reserves/resources Production Host rock Mineralization age
_________________________________________________________________________________________________________
Betze-Post (cont.) 417,000 tons, 0.089 opt Au (inferred resource) 2008: 1,281,450 oz Au, 2006: 105,206,000 tons, 0.125 opt Au (proven and 152,886 oz Ag probable reserves); 20,184,000 tons, 0.050 opt 2009: 901,002 oz Au Au (measured and indicated resource); 120,736 oz Ag 489,000 tons, 0.078 opt Au (inferred resource) 2010: 884,200 oz Au 2007: 94,914,000 tons, 0.128 opt Au (proven and 138,931 oz Ag probable reserves); 34,532,000 tons, 0.052 opt 2011: 721,534 oz Au Au (measured and indicated resource); 94,572 oz Ag 5,014,000 tons, 0.064 opt Au (inferred resource) 2012: 812,707 oz Au 2008: 86,254,000 tons, 0.119 opt Au (proven and 102,700 oz Ag probable reserves); 15,751,000 tons, 0.055 opt 2013: 521,489 oz Au Au (measured and indicated resource); 86,124 oz Ag 479,000 tons, 0.092 opt Au (inferred resource) 2009: 82,902,000 tons, 0.112 opt Au (proven and probable reserves); 16,687,000 tons, 0.052 opt Au (measured and indicated resource); 3,568,000 tons, 0.116 opt Au (inferred resource) 2010: 95,865,000 tons, 0.101 opt Au (proven and probable reserves); 4,694,000 tons, 0.037 opt Au (measured and indicated resource) 1,344,000 tons, 0.065 opt Au (inferred resource) 2011: 97,325,000 tons, 0.096 opt Au, 9,342,000 oz Au (proven and probable reserves); 4,612,000 tons, 0.032 opt Au, 147,000 oz Au (measured and indicated resource); 564,000 tons, 0.055 opt Au, 31,000 oz Au (inferred resource) 2012 (includes all open pit resources at Goldstrike): 94,541,000 tons, 0.094 opt Au, 8,933,000 oz Au (proven and probable reserves); 3,621,000 tons, 0.033 opt Au, 103,000 oz Au (measured and indicated resource); 3,049,000 tons, 0.066 opt Au, 201,000 oz Au (inferred resource) 2013 (includes all open pit resources at Goldstrike): 84,255,000 tons, 0.096 opt Au, 8,122,000 oz Au (proven and probable reserves); 5,909,000 tons, 0.07 opt Au, 413,000 oz Au (measured and indicated resource); 1,081,000 tons, 0.071 opt Au, 77,000 oz Au (inferred resource)
_________________________________________________________________________________________________________
Buckhorn 1984: 5,000,000 tons, 0.044 opt Au, 0.585 opt Ag 1988-93: 109,422 oz Au, basaltic andesite, 14.6 Ma property 1990: 700,000 tons, 0.05 opt Au; 409,887 oz Ag sinter, silicified (Buckhorn district) geologic resource-200,350 oz Au sedimentary rocks 1993: geologic resource-1.1 million tons, 0.11 opt Au
_________________________________________________________________________________________________________
Buckhorn South/ 1989: 2,000,000 tons, 0.056 opt Au, 0.224 opt Ag lower Paleozoic Zeke deposit 1998: 2,400,000 tons, 0.046 opt Au rocks (Buckhorn district)
_________________________________________________________________________________________________________
Cabin Creek 2009-2010 (Feb., 0.012 opt Au cut-off grade) (Antelope district) 3,200,000 tons, 0.024 opt Au (indicated resource); 100,000 tons, 0.015 opt Au (inferred resource) 2011: 2,348,000 tons, 0.026 opt Au, 60,005 oz Au (measured and indicated resource, 0.009 opt Au cut-off grade) 1,117,000 tons, 0.023 opt Au, 25,391 oz Au (inferred resources, 0.009 opt Au cut-off grade)
_________________________________________________________________________________________________________
Carlin North, Newmont (Lynn district)
Blue Star 1987: 1,950,000 tons, 0.066 opt Au 1974-84: intermittent lower Paleozoic Eocene
1989: geologic resource-22,200,000 tons, 1988-2010: included in sandy siltstone 0.030 opt Au Newmont Gold production and carbonate at the end of this section rocks, granodiorite
57
MAJOR PRECIOUS-METAL DEPOSITS, EUREKA COUNTY (continued) _________________________________________________________________________________________________________
Deposit name Reserves/resources Production Host rock Mineralization age
_________________________________________________________________________________________________________
Bobcat (Bobstar) 1988: geologic resource-17,700,000 tons, lower Paleozoic Eocene 0.029 opt Au rocks
Bullion Monarch 1987: 1,000,000 tons, 0.10 opt Au 1977-84: 17,779 oz Au lower Paleozoic Eocene sedimentary rocks
Deep Star 1996: 1,400,000 tons, 0.8765 opt Au 1995: 2,800 oz Au Popovich Eocene proven and probable reserves 1996: 93,400 oz Au Formation 1997-2011: included in Newmont Gold production at the end of this section
Genesis (Silverstar) 1989: geologic resource-35,800,000 tons, 1986: production commenced Ordovician- Eocene
0.044 opt Au 1988-2010: included in Devonian 1990: 32,000,000 tons, 0.047 opt (includes Newmont Gold production limestone, argillite, Blue Star) at the end of this section chert 2004: 1,065,000 oz Au (proven and probable reserves) 2012: 3,000,000 oz Au (reserves)
Genesis Complex 2000:14,100,000 tons, 0.026 opt Au
proven and probable open-pit reserves 2004: 1,065,000 oz Au (proven and probable reserves)
Leeville 2004: 2,612,000 oz Au 2005-2010: included in Roberts Mountains Eocene (proven and probable reserves) Newmont Gold production Formation 2005: 2,433,000 oz Au at the end of this section (proven and probable reserves)
North Lantern 2004: 199,940 oz Au
North Star 1989: geologic resource-6,900,000 tons, 1988: 4,250 oz Au lower Paleozoic Eocene
0.052 opt Au 1989-2010: included in sedimentary rocks 1990: 3,900,000 tons, 0.052 opt Au Newmont Gold production at the end of this section
Post/Goldbug 1996: 25,600,000 tons, 0.190 opt Au 1999-2010: included in lower Paleozoic Eocene proven and probable reserves; 43,600,000 Newmont Gold production sedimentary rocks tons, 0.079 opt Au mineralized material at the end of this section
Deep Post 2000: 3,100,000 tons, 0.814 opt Au proven and included in Newmont Gold
probable underground reserves production at the end of 2004 (includes Deep Star) 1,462,000 oz Au this section (proven and probable reserves) 2005 (includes Deep Star) 942,000 oz Au (proven and probable reserves)
Turf 1996: 2,500,000 tons, 0.367 opt Au included in Newmont Gold Roberts Mountains Eocene mineralized material production at the end of Formation this section
West Leeville 1996: 2,000,000 tons, 0.377 opt Au 1995-96: 272,000 oz Au Roberts Mountains Eocene (Newmont) proven and probable reserves; 581,000 tons 1997-2010: included in Formation
0.354 opt Au mineralized material Newmont Gold production at the end of this section
West Leeville 1996: 7,100,000 tons, 0.425 opt Au Roberts Mountains Eocene
(Newmont-Barrick) proven and probable reserves; 500,000 tons Formation
0.328 opt Au mineralized material
Carlin Mine 1965: 11,000,000 tons, 0.32 opt Au 1965-86: 3,800,000 oz Au
Carlin/Pete/Lantern 1995: 14,800,000 tons, 0.031 opt Au 1994-96: 68,700 oz Au Roberts Mountains Eocene 1996: 13,700,000 tons, 0.046 opt Au 1997-2010: included in Formation proven and probable reserves; 14,700,000 Newmont Gold production tons, 0.046 opt Au mineralized material at the end of this section 2004: 940,040 oz Au (proven and probable reserves) 2005: 1,044,841 oz Au (proven and probable reserves)
Carlin Underground 2004: 163,000 oz Au 2005: 123,000 oz Au (proven and probable reserves)
Carlin North-other 2000: 19,800,000 tons, 0.052 opt Au, proven and probable open-pit reserves
58
MAJOR PRECIOUS-METAL DEPOSITS, EUREKA COUNTY (continued) _________________________________________________________________________________________________________
Deposit name Reserves/resources Production Host rock Mineralization age
_________________________________________________________________________________________________________
Carlin North area 2000: 8,200,000 tons, 0.495 opt Au, proven total and probable underground reserves
Carlin North area, 2001: 32,600,000 tons, 0.044 opt Au, (proven and total open-pit probable reserves); 13,000,000 tons, 0.039 opt Au
(mineralized material)
Carlin North area, 2001: 10,900,000 tons, 0.56 opt Au, (proven and total underground probable reserves); 2,100,000 tons, 0.55 opt Au
(mineralized material)
_________________________________________________________________________________________________________
Carlin South, Newmont (Maggie Creek district)
Chukar Footwall 2001: 278,000 tons, 0.49 opt Au (proven and underground probable reserves); 115,000 tons, 0.46 opt Au
(mineralized material) 2004: 172,000 oz Au (proven and probable reserves) 2005: 256,000 oz Au (proven and probable reserves)
Gold Quarry/Mac/ 1982: 25,100,000 tons, 0.106 opt Au 1981: 6,000 oz Au See below Eocene Tusc and 150,000,000 tons, 0.036 opt Au 1982: 19,000 oz Au
1987: 197,800,000 tons, 0.042 opt Au 1983: 74,000 oz Au 1990: 212,600,000 tons, 0.042 opt Au, 1984: 68,200 oz Au Ordovician to Eocene geologic resource-534,300,000 tons, 1985: 136,200 oz Au Devonian chert, 0.037 opt Au 1986: 309,800 oz Au shale, siltstone, 1996: 174,800,000 tons, 0.046 opt Au 1987: 446,600 oz Au and impure carbonate (proven and probable reserves); 51,900,000 1988-93: included in rocks; in part, tons, 0.058 opt Au (mineralized material) Newmont Gold production Vinini Formation 2004: 5,984,000 oz 1994-96: 2,978,000 oz Au (proven and probable reserves) 1997-2010: included in 2005: 6,554,297 oz Newmont Gold production (proven and probable reserves) at the end of this section
Mike 1999: 408,000,00 tons, 0.006 opt Au, 151,000,000 tons, 0.10 % Cu 19,000,000 tons, 1.00 % Zn (drill-indicated mineral inventory)
Tusc 1988: geologic resource-15.8 million tons, included in Newmont Gold lower Paleozoic Eocene
0.059 opt Au production at the end of sedimentary rocks 1990: 13,300,000 tons, 0.062 opt Au this section
Carlin South area 2000: 75,200,000 tons, 0.059 opt Au (proven and probable open-pit reserves)
Carlin South 2001: 61,300,000 tons, 0.062 opt Au proven open-pit and probable reserves; 24,600,000 tons,
0.028 opt Au (mineralized material)
_________________________________________________________________________________________________________
Carlin North and South combined (includes all Newmont’s Carlin properties)
Carlin open pit 2002: 181,800,000 tons, 0.042 opt Au (proven 2004-2011: included in Eocene and probable reserves); 9,500,000 tons, 0.028 Newmont Gold production opt Au (measured and indicated mineralized) at the end of this section material; 9,300,000 tons, 0.035 opt Au (inferred mineralized material) 2003: 17,500,000 tons, 0.052 opt Au (proven reserves); 203,300,000 tons, 0.044 (probable reserves); 1,000,000 tons 0.035 (measured material); 11,200,000 tons 0.024 (indicated material); 10,400,000 tons 0.034 opt Au (inferred material) 2004: 201,600,000 tons, 0.047 opt Au (proven and probable reserves); 13,200,000 tons, 0.022 opt Au (indicated material); 7,700,000 tons, 0.034 opt Au (inferred material) 2005: 238,300,000 tons, 0.043 opt Au (proven and probable reserves); 28,100,000 tons, 0.04 opt Au (measured and indicated resource); 4,200,000 tons, 0.024 opt Au (inferred resource) 2006: 271,600,000 tons, 0.042 opt Au (proven and probable reserves); 35,100,000 tons, 0.035 opt Au (measured and indicated resource); 6,300,000 tons, 0.022 opt Au (inferred resource) 2007: 213,500,000 tons, 0.045 opt Au (proven and probable reserves); 14,600,000 tons, 0.020 opt Au (measured and indicated resource); 3,700,000

59
MAJOR PRECIOUS-METAL DEPOSITS, EUREKA COUNTY (continued) _________________________________________________________________________________________________________
Deposit name Reserves/resources Production Host rock Mineralization age
_________________________________________________________________________________________________________
Carlin open pit tons, 0.037 opt Au (inferred resource) (cont.) 2008: 202,400,000 tons, 0.045 opt Au (proven and
probable reserves); 88,400,000 tons, 0.040 opt Au (measured and indicated resource); 21,100,000 tons, 0.023 opt Au (inferred resource) 2009: 259,300,000 tons, 0.044 opt Au (proven and probable reserves); 28,800,000 tons, 0.021 opt Au (measured and indicated resource); 10,400,000 tons, 0.034 opt Au (inferred resource) 2010: 263,500,000 tons, 0.043 opt Au (proven and probable reserve, 75% recovery); 91,800,000 tons, 0.020 opt Au (measured and indicated resource) 22,100,000 tons, 0.034 opt Au (inferred resource) 2011: 331,700,000 tons, 0.038 opt Au (proven and probable reserve, 77% recovery); 112,600,000 tons, 0.026 opt Au (measured and indicated resource) 15,300,000 tons, 0.02 opt Au (inferred resource) 2012: 313,200,000 tons, 0.037 opt Au, 11,650,000 oz Au (proven and probable reserve, 74% recovery); 88,900,000 tons, 0.027 opt Au, 2,370,000 oz Au (measured and indicated resource); 18,900,000 tons, 0.018 opt Au, 350,000 oz Au (inferred resource) 2013: 271,600,000 tons, 0.036 opt Au, 9,730,000 oz Au (proven and probable reserve, 76% recovery); 83,800,000 tons, 0.019 opt Au (mineralized material) [NI43-101 compliant]
Carlin underground 2002: 10,000,000 tons, 0.57 opt Au (proven and 2004-2011: included in Eocene probable reserves); 2,600,000 tons, 0.50 opt Au Newmont Gold gold production (measured and indicated mineralized material); at the end of this section 200,000 tons, 0.53 opt Au (inferred mineralized Material) 2003: 2,700,000 tons, 0.670 opt Au (proven reserves); reserves); 6,100,000 tons, 0.500 opt Au (probable 3,700,000 tons 0.480 opt Au (inferred material) 2004: 8,700,000 tons, 0.510 opt Au (proven and probable reserves); 100,000 tons, 0.260 opt Au (indicated material); 3,900,000 tons, 0.470 opt Au (inferred material) 2005: 7,700,000 tons, 0.49 opt Au (proven and probable reserves); 300,000 tons, 0.33 opt Au (measured and indicated resource); 3,700,000 tons, 0.46 opt Au (inferred resource) 2006: 7,400,000 tons, 0.44 opt Au (proven and probable reserves); 1,100,000 tons, 0.28 opt Au (measured and indicated resource); 3,000,000 tons, 0.47 opt Au (inferred resource) 2007: 7,200,000 tons, 0.388 opt Au (proven and probable reserves); 110,000 tons, 0.482 opt Au (measured and indicated resource); 2,600,000 tons, 0.480 opt Au (inferred resource) 2008: 11,700,000 tons, 0.313 opt Au (proven and probable reserves); 340,000 tons, 0.330 opt Au (measured and indicated resource); 3,100,000 tons, 0.327 opt Au (inferred resource) 2009: 9,700,000 tons, 0.311 opt Au (proven and probable reserves); 810,000 tons, 0.180 opt Au (measured and indicated resource); 7,400,000 tons, 0.289 opt Au (inferred resource) 2010: 14,600,000 tons, 0.307 opt Au, 12,620,000 oz Au (proven and probable reserve, 88% recovery) 4,200,000 tons, 0.290 opt Au (measured and indicated resource); 1,300,000 tons, 0.345 opt Au (inferred resource) 2011: 18,000,000 tons, 0.282 opt Au, 5,090,000 oz Au (proven and probable reserve, 88% recovery) 7,600,000 tons, 0.241 opt Au (measured and indicated resource); 1,300,000 tons, 0.264 opt Au (inferred resource) 2012: 23,500,000 tons, 0.265 opt Au, 6,230,000 oz Au (proven and probable reserve, 86% recovery); 1,300,000 tons, 0.18 opt Au, 240,000 oz Au (measured and indicated resource); 4,000,000 tons, 0.26 opt Au, 1,020,000 oz Au (inferred resource)

60
MAJOR PRECIOUS-METAL DEPOSITS, EUREKA COUNTY (continued) _________________________________________________________________________________________________________
Deposit name Reserves/resources Production Host rock Mineralization age
_________________________________________________________________________________________________________
Carlin underground 2013: 23,900,000 tons, 0.252 opt Au, 6,010,000 oz (cont.) Au (proven and probable reserve, 85% recovery);
1,900,000 tons, 0.195 opt Au (mineralized material) [NI43-101 compliant]
_________________________________________________________________________________________________________
Gold Bar 1984: 2,800,000 tons, 0.09 opt Au 1987-90: 238,262 oz Au Devonian Nevada Eocene? (Antelope district) 1990: mined out in December 1991: 80,727 oz Au, Formation
1994: 240,000 oz Au 3,000 oz Ag 1995: 190,000 oz Au 1992-94: 155,080 oz Au 2001: 473,000 oz Au in 6 deposits 2002: 3,600,00 tons, 0.100 opt Au (resource) 2009 (Feb.): 21,500,000 tons, 0.032 opt Au (measured and indicated resource, 0.012 opt Au cut-off grade, Gold Pick and Gold Ridge deposits); 8,700,000 tons, 0.021 opt Au (inferred resources, 0.012 opt Au cut-off grade, Gold Pick and Gold Ridge deposits) 2010: 33,300,000 tons, 0.027 opt Au (measured and indicated and resource, 0.012 opt Au cut-off grade, Gold Pick and Gold Ridge deposits); 1,200,000 tons, 0.016 opt Au (inferred resource, 0.012 opt Au Au cut-off grade, Gold Pick and Gold Ridge deposits) 2011: 21,486,000 tons, 0.028 opt Au, 592,928 oz Au (measured and indicated resource, 0.009 opt Au cut-off grade, Cabin Creek, Gold Pick, and Gold Ridge deposits); 7,758,000 tons, 0.027 opt Au, 212,168 oz Au (inferred resources, 0.009 opt Au cut-off grade, Cabin Creek, Gold Pick, and Gold Ridge deposits)
_________________________________________________________________________________________________________
Gold Canyon 1992: reserves-86,500 oz Au, reported with Gold Bar Devonian Upper Eocene? (Antelope district) geologic resource-131,000 oz Au Denay Limestone 1993: 770,000 tons, 0.080 opt Au Formation 2001: see Gold Bar 2002: 2,500,000 tons, 0.056 opt Au resource
_________________________________________________________________________________________________________
Gold Pick 1988: 10,000,000 tons, 0.06 opt Au reported with Gold Bar Devonian Eocene? (Antelope district) 1993: 1,400,000 tons, 0.079 opt Au McColley Canyon 2001: see Gold Bar Formation 2002: 5,000,000 tons, 0.057 opt Au measured mineral resource 2005: 7,874,000 tons, 0.041 opt Au (indicated resource) 2011: 16,553,000 tons, 0.028 opt Au, 459,165 oz Au (measured and indicated resource, 0.009 opt Au cut-off grade); 5,649,000 tons, 0.029 opt Au, 161,761 oz Au (inferred resource, 0.009 opt Au cut-off grade)
_________________________________________________________________________________________________________
Gold Ridge 1988: 400,000 tons, 0.06 opt Au reported with Gold Bar Devonian Eocene? (Antelope district) 1993: 426,000 tons, 0.059 opt Au McColley Canyon 2001: see Gold Bar Formation 2002: 584,164 tons, 0.046 opt Au resource 2011: 2,585,000 tons, 0.028 opt Au, 73,100 oz Au (measured and indicated resource, 0.009 opt Au cut-off grade) 992,000 tons, 0.025 opt Au 25,016 oz Au (inferred resource, 0.009 opt Au cut-off grade)
_________________________________________________________________________________________________________
Goldrush 2011 (Red Hill/Goldrush): 11,221,000 tons, (Cortez district) 0.113 opt Au, 1,273,000 oz Au (indicated resource); 41,290,000 tons 0.139 opt Au, 5,748,000 oz Au (inferred resource) 2012: 65,914,000 tons, 0.127 opt Au, 8,367,000 oz Au (measured and indicated resource); 43,183,000 tons, 0.132 opt Au, 5,679,000 oz Au (inferred resource)

61
MAJOR PRECIOUS-METAL DEPOSITS, EUREKA COUNTY (continued) _________________________________________________________________________________________________________
Deposit name Reserves/resources Production Host rock Mineralization age
_________________________________________________________________________________________________________
Goldrush (cont.) 2013: 75,540,000 tons, 0.132 opt Au, 9,960,000 oz Au (measured and indicated resource); 39,472,000 tons, 0.141 opt Au, 5,555,000 oz Au (inferred resource)
_________________________________________________________________________________________________________
Goldstone 1988: 1,700,000 tons, 0.08 opt Au reported with Gold Bar Devonian Upper Eocene? (Antelope district) 1993: 130,928 tons, 0.104 opt Au Denay Limestone
2001: see Gold Bar Formation
_________________________________________________________________________________________________________
Horse Canyon 1984: 3,940,000 tons, 0.055 opt Au 1984: 40,000 oz Au Wenban 35 Ma? (Cortez district) 1988: included in Cortez Joint Venture figures 1988-93: included with Limestone Cortez Joint Venture
_________________________________________________________________________________________________________
Hunter 2009 (Feb., 0.013 opt Au cut-off grade) (Antelope district) 500,000 tons, 0.031 opt Au (indicated
resource); 100,000 tons, 0.015 opt Au (inferred resource)
_________________________________________________________________________________________________________
Lookout Mountain 2011: 20,745,000 tons, 0.019 opt Au 1987: 180,000 tons, Hamburg Dolomite (Eureka district) 390,000 oz Au (measured and indicated 0.12 opt Au, 81% recovery resource, 0.006 opt Au oxidized cut-off grade, 0.03 opt unoxidized cut-off grade) 18,385,000, 0.012 opt Au, 221,000 oz Au (inferred resource, 0.006 opt Au oxidize cut-off grade, 0.03 opt unoxidized cut-off grade) 2013: 28,940,000 tons, 0.018 opt Au 508,000 oz Au (measured and indicated resource, 0.006 opt Au oxidized cut-off grade, 0.03 opt unoxidized cut-off grade) 11,790,000, 0.012 opt Au, 141,000 oz Au (inferred resource, 0.006 opt Au oxidized cut-off grade, 0.03 opt unoxidized cut-off grade)
_________________________________________________________________________________________________________
North Post 2011 underground: 3,348,000 tons, 0.244 opt (Lynn district) Au, 816,000 oz Au
_________________________________________________________________________________________________________
Ratto Canyon 1984: ~200,000 oz Au 1987-88: 17,000 oz Au Dunderberg Shale, Eocene (Lookout Mountain) (entire Ratto Ridge area): Hamburg Dolomite (Eureka district) 2006: 836,000 tons, 0.24 opt Au
(measured and indicated resource) 2010: 13,640,000 tons, 0.021 opt Au (measured and indicated resource) 16,420,000 tons, 0.012 opt Au (inferred resource)
_________________________________________________________________________________________________________
Rock Creek 1997: 800,000 tons, 0.045 opt Au Tertiary latite tuff (Eureka-Lander Co. line)
_________________________________________________________________________________________________________
Rodeo Projects 1998: 2,900,000 tons, 0.487 opt Au included with Meikle Eocene (Rodeo, Griffin, proven and probable reserves; 5,800,000 tons, production, Elko County Goldbug, North Betze) 0.302 opt Au (mineralized material) (Lynn district) 1999: 5,800,000 tons, 0.466 opt Au, (proven and probable reserves); 13,000,000 tons, 0.270 opt Au (mineralized material)
2000: 9,200,000 tons, 0.414 opt Au (proven and Probable); 7,400,000 tons, 0.333 opt Au (mineral resource) 2005-2010: reserves are combined with Meikle reserves
_________________________________________________________________________________________________________
Ruby Hill 1994: geologic resource-20,000,000 tons, 1997-98: 133,100 oz Au, Goodwin Limestone (Eureka district) 0.08 opt Au 8,686 oz Ag 1995: 7,620,000 tons, 0.099 opt Au 2000: 125,193 oz Au, 1999: 3,770,000 tons, 0.110 opt Au 7,984 oz Ag (proven and probable); 7,330,000 tons, 1999: 123,841 oz Au, 0.072 opt Au (mineralized material) 7,688 oz Ag

62
MAJOR PRECIOUS-METAL DEPOSITS, EUREKA COUNTY (continued) _________________________________________________________________________________________________________
Deposit name Reserves/resources Production Host rock Mineralization age
_________________________________________________________________________________________________________
Ruby Hill (cont.) 2000: 2,700,000 tons, 0.105 opt Au 2001: 134,737 oz Au, (proven and probable reserves); 7,300,000 9,315 oz Ag tons, 0.072 opt Au (mineralized material) 2002: 135,448 oz Au, 2004: (East Archimedes) 17,093,000 tons, 9,750 oz Ag 0.059 opt Au proven and probable reserves; 2003: 18,134 oz Au, 3,049,000 tons, 0.061 opt Au mineral resource 2,441 oz Ag 2006: (East Archimedes) 19,479,000 tons, 2004: 6,057 oz Au, 0.055 opt Au (proven and probable reserves); 1,868 oz Ag 601,000 tons, 0.088 opt Au (measured and 2007:142,856 oz Au, indicated resource) 8,368 oz Ag 2007: (East Archimedes) 18,763,000 tons, 2008: 102,553 oz Au, 0.055 opt Au (proven and probable reserves); 7,572 oz Ag 3,202,000 tons, 0.076 opt Au (measured and 2009: 103,523 oz Au, 39,110 oz Ag indicated resource); 6,000 tons, 0.333 opt Au 2010: 81,382 oz Au, 43,276 oz Ag (inferred resource) 2011: 127,089 oz Au, 42,754 oz Ag 2008: (East Archimedes) 18,844,000 tons, 2012: 41,242 oz Au, 32,124 oz Ag 0.044 opt Au (proven and probable reserves); 2013: 91,074 oz Au, 76,283 oz Ag 111,919,000 tons, 0.04 opt Au measured and (indicated resource); 3,495,000 tons, 0.037 opt Au (inferred resource) 2009: 13,933,000 tons, 0.050 opt Au (proven and probable reserves); 8,960,000 tons, 0.057 opt Au (measured and indicated resource); 2,928,000 tons, 0.051 opt Au, (inferred resource) 2010: 17,182,000 tons, 0.065 opt Au (proven and probable reserves); 61,530,000 tons, 0.023 opt Au (measured and indicated resource); 12,885,000 tons, 0.024 opt Au (inferred resource) 2011: 16,778,000 tons, 0.058 opt Au, 978,000 oz Au (proven and probable reserves); 107,626,000 tons, 0.021 opt Au, 2,245,000 oz Au (measured and indicated resource); 5,779,000 tons, 0.034 opt Au 196,000 oz Au (inferred resource) 2012: 7,823,000 tons, 0.042 opt Au, 326,000 oz Au (proven and probable reserves); 172,646,000 tons, 0.02 opt Au, 3,463,000 oz Au (measured and indicated resource); 5,152,000 tons, 0.043 opt Au, 220,000 oz Au (inferred resource) 2013: 4,963,000 tons, 0.028 opt Au, 140,000 oz Au (proven and probable reserves); 178,428,000 tons, 0.02 opt Au 3,612,000 oz Au (measured and indicated resource); 18,343,000 tons, 0.04 opt Au 220,000 oz Au (inferred resource)
_________________________________________________________________________________________________________
Tonkin Springs 1983: 1,840,000 tons, 0.089 opt Au, 1987-88: 10,265 oz Au Vinini Formation Eocene? (Antelope district) 0.204 opt Ag 1989-90: 3,821 oz Au, 1987: oxide-1,500,000 tons, 0.05 opt Au; 1,872 oz Ag sulfide-2,500,000 tons, 0.09 opt Au 1991: 9,000,000, 0.05 opt Au 1999: 30,700,000 tons, 0.045 opt Au (resource) 2006: 29,672,000 tons, 0.043 opt Au (measured and indicated resource); 3,466,000 tons, 0.044 opt Au, (inferred resource) 2008 (May): 35,584,000 tons, 0.041 opt Au (measured and indicated resource) 9,290,000 tons, 0.033 opt Au, (inferred resource)
_________________________________________________________________________________________________________
Mineral Ridge 1988: 3,000,000 tons, 0.03 opt Au 1908-16: 24,000 oz Au Hamburg Dolomite Eocene or (Eureka district) 1995: mined out 1975-84: 90,000 oz Au Oligocene 1988: 6,380 oz Au, 59 oz Ag
_________________________________________________________________________________________________________
HUMBOLDT COUNTY
_________________________________________________________________________________________________________
Adelaide Crown 1989: south pit-585,000 tons, 1.313 opt Ag, 1990-91: 4,917 oz Au, Preble Formation Tertiary (Gold Run district) 0.043 opt Au; additional area: 53,474 oz Ag 165,000 tons, 0.015 opt Au, 1.10 opt Ag
_________________________________________________________________________________________________________
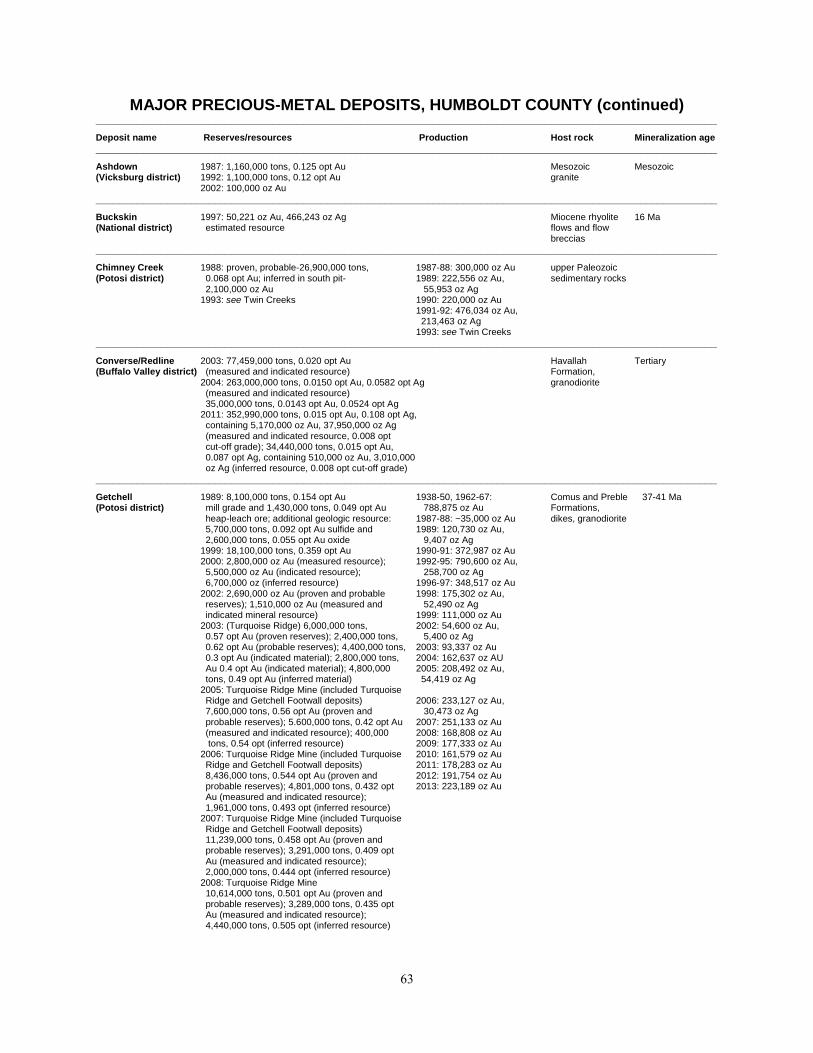
63
MAJOR PRECIOUS-METAL DEPOSITS, HUMBOLDT COUNTY (continued) _________________________________________________________________________________________________________
Deposit name Reserves/resources Production Host rock Mineralization age
_________________________________________________________________________________________________________
Ashdown 1987: 1,160,000 tons, 0.125 opt Au Mesozoic Mesozoic (Vicksburg district) 1992: 1,100,000 tons, 0.12 opt Au granite 2002: 100,000 oz Au
_________________________________________________________________________________________________________
Buckskin 1997: 50,221 oz Au, 466,243 oz Ag Miocene rhyolite 16 Ma (National district) estimated resource flows and flow breccias
_________________________________________________________________________________________________________
Chimney Creek 1988: proven, probable-26,900,000 tons, 1987-88: 300,000 oz Au upper Paleozoic (Potosi district) 0.068 opt Au; inferred in south pit- 1989: 222,556 oz Au, sedimentary rocks 2,100,000 oz Au 55,953 oz Ag 1993: see Twin Creeks 1990: 220,000 oz Au 1991-92: 476,034 oz Au, 213,463 oz Ag 1993: see Twin Creeks
_________________________________________________________________________________________________________
Converse/Redline 2003: 77,459,000 tons, 0.020 opt Au Havallah Tertiary (Buffalo Valley district) (measured and indicated resource) Formation, 2004: 263,000,000 tons, 0.0150 opt Au, 0.0582 opt Ag granodiorite (measured and indicated resource) 35,000,000 tons, 0.0143 opt Au, 0.0524 opt Ag 2011: 352,990,000 tons, 0.015 opt Au, 0.108 opt Ag, containing 5,170,000 oz Au, 37,950,000 oz Ag (measured and indicated resource, 0.008 opt cut-off grade); 34,440,000 tons, 0.015 opt Au, 0.087 opt Ag, containing 510,000 oz Au, 3,010,000 oz Ag (inferred resource, 0.008 opt cut-off grade)
_________________________________________________________________________________________________________
Getchell 1989: 8,100,000 tons, 0.154 opt Au 1938-50, 1962-67: Comus and Preble 37-41 Ma (Potosi district) mill grade and 1,430,000 tons, 0.049 opt Au 788,875 oz Au Formations, heap-leach ore; additional geologic resource: 1987-88: ~35,000 oz Au dikes, granodiorite 5,700,000 tons, 0.092 opt Au sulfide and 1989: 120,730 oz Au, 2,600,000 tons, 0.055 opt Au oxide 9,407 oz Ag 1999: 18,100,000 tons, 0.359 opt Au 1990-91: 372,987 oz Au 2000: 2,800,000 oz Au (measured resource); 1992-95: 790,600 oz Au, 5,500,000 oz Au (indicated resource); 258,700 oz Ag 6,700,000 oz (inferred resource) 1996-97: 348,517 oz Au 2002: 2,690,000 oz Au (proven and probable 1998: 175,302 oz Au, reserves); 1,510,000 oz Au (measured and 52,490 oz Ag indicated mineral resource) 1999: 111,000 oz Au 2003: (Turquoise Ridge) 6,000,000 tons, 2002: 54,600 oz Au, 0.57 opt Au (proven reserves); 2,400,000 tons, 5,400 oz Ag 0.62 opt Au (probable reserves); 4,400,000 tons, 2003: 93,337 oz Au 0.3 opt Au (indicated material); 2,800,000 tons, 2004: 162,637 oz AU Au 0.4 opt Au (indicated material); 4,800,000 2005: 208,492 oz Au, tons, 0.49 opt Au (inferred material) 54,419 oz Ag 2005: Turquoise Ridge Mine (included Turquoise Ridge and Getchell Footwall deposits) 2006: 233,127 oz Au, 7,600,000 tons, 0.56 opt Au (proven and 30,473 oz Ag probable reserves); 5.600,000 tons, 0.42 opt Au 2007: 251,133 oz Au (measured and indicated resource); 400,000 2008: 168,808 oz Au tons, 0.54 opt (inferred resource) 2009: 177,333 oz Au 2006: Turquoise Ridge Mine (included Turquoise 2010: 161,579 oz Au Ridge and Getchell Footwall deposits) 2011: 178,283 oz Au 8,436,000 tons, 0.544 opt Au (proven and 2012: 191,754 oz Au probable reserves); 4,801,000 tons, 0.432 opt 2013: 223,189 oz Au Au (measured and indicated resource); 1,961,000 tons, 0.493 opt (inferred resource) 2007: Turquoise Ridge Mine (included Turquoise Ridge and Getchell Footwall deposits) 11,239,000 tons, 0.458 opt Au (proven and probable reserves); 3,291,000 tons, 0.409 opt Au (measured and indicated resource); 2,000,000 tons, 0.444 opt (inferred resource) 2008: Turquoise Ridge Mine 10,614,000 tons, 0.501 opt Au (proven and probable reserves); 3,289,000 tons, 0.435 opt Au (measured and indicated resource); 4,440,000 tons, 0.505 opt (inferred resource)

64
MAJOR PRECIOUS-METAL DEPOSITS, HUMBOLDT COUNTY (continued) _________________________________________________________________________________________________________
Deposit name Reserves/resources Production Host rock Mineralization age
_________________________________________________________________________________________________________
Getchell (cont.) 2009: Turquoise Ridge Mine 10,680,000 tons, 0.507 opt Au (proven and probable reserves); 2,307,000 tons, 0.431 opt Au (measured and indicated resource); 5,033,000 tons, 0.456 opt (inferred resource) 2010 Turquoise Ridge Mine: 12,339,000 tons, 0.456 opt Au (proven and probable reserve, 92% recovery); 85,625,000 tons, 0.131 opt Au (measured and indicated resource); 43,427,000 tons, 0.160 opt Au (inferred resource) 2011 Turquoise Ridge Mine: 15,981,000 tons, 0.442 opt Au, 7,054,000 oz Au, (proven and probable reserve, 92% recovery); 83,192,000 tons, 0.122 opt Au, 10,188,000 oz Au (measured and indicated resource); 33,992,000 tons, 0.13 opt Au, 4,404,000 oz Au (inferred resource) 2012 Turquoise Ridge Mine: 20,358,000 tons, 0.381 opt Au, 7,755,000 oz Au, (proven and probable reserve, 92% recovery); 80,690,000 tons, 0.123 opt Au, 9,912,000 oz Au (measured and indicated resource); 39,014,000 tons, 0.131 opt Au, 5,089,000 oz Au (inferred resource) 2013 Turquoise Ridge Mine: 13,337,000 tons, 0.51 opt Au, 6,760,000 oz Au, (proven and probable reserve, 92% recovery); 120,695,000 tons, 0.127 opt Au, 15,317,000 oz Au (measured and indicated resource); 49,508,000 tons, 0.15 opt Au, 7,421,000 oz Au (inferred resource)
_________________________________________________________________________________________________________
Hycroft 1988: 25,000,000 tons, 0.025 opt Au 1988: 75,800 oz Au Camel 1-2 Ma (formerly Crofoot/Lewis) 1999: 23,800,000 tons, 0.0204 opt Au 1989-98: 868,544 oz Au, conglomerate, (Sulphur district) (proven and probable reserves); 2,300,000 2,717,170 oz Ag rhyolite dikes tons, 0.0177 opt Au (indicated reserves) 1999: 40,075 oz Au, 2000: 41,900,000 tons, 0.0196 opt Au (measured 183,190 oz Ag and indicated resource); 14,100,000 tons, 2000: 13,493 oz Au, 0.0152 opt Au (inferred resource) 38,418 oz Ag 2004: 47,479,000 tons, 0.016 opt Au (measured 2001: 3,232 oz Au, and indicated); 12,029,000 tons, 0.011 opt Au 2,000 oz Ag (inferred resource) 2002: 1,771 oz Au, 2005: 33,320,000 tons, 0.02 opt Au (proven 217 oz Ag and probable reserves); 52,700,000 tons 2003: 644 oz Au, 0.019 opt Au (measured and indicated resource); 100 oz Ag 8.700,000 tons, 0.015 opt Au (inferred resource) 2004: 61 oz Au 2007: 33,320,000 tons, 0.020 opt Au (proven and 2008: 1,000 oz Au, probable reserves, January 2008); 19,780,000 3,000 oz Ag tons, 0.018 opt Au (measured and indicated 2009: 53,189 oz Au, resource, January 2008); 283,392,000 tons, 65,753 oz Ag 0.019 opt Au (inferred resource, May 2008) 2010: 102,483 oz Au, 2008 (October 2008): 73,159,508 tons, 0.016 opt 233,974 oz Ag Au (proven and probable reserves; 141,300,000 2011: 104,002 oz Au, tons, 0.014 opt Au (measured and indicated 479,440 oz Ag resource, 0.005 opt Au cut-off grade); 2012: 114,705 oz Au, 180,200,000 tons, 0.012 opt Au (oxide inferred 696,114 oz Ag resource, 0.005 opt Au cut-off grade) 2013: 181,941 oz Au 199,400,000 tons, 0.20 opt Au (sulfide inferred 858,073 oz Ag resource, 0.013 opt Au cut-off grade) 2010: 177,228,000 tons, 0.014 opt Au, 0.18 opt Ag (proven and probable oxide reserves); 366,991,000 tons, 0.013 opt Au, 0.22 opt Ag
(measured and indicated oxide resource) 143,927,000 tons, 0.018 opt Au, 0.72 opt Ag (measured and indicated sulfide resource); 95,510,000 tons, 0.011 opt Au, 0.33 opt Ag (inferred oxide resource); 148,804,000 tons, 0.017 opt Au, 0.85 opt Ag (inferred sulfide resource) 2010 (year-end): 196,000,000 tons, 0.013 opt Au, 0.25 opt Ag (proven and probable oxide heap leach reserves); 720,000,000 tons, 0.007 opt Au, 0.15 opt Ag (measured and indicated oxide and transitional heap leach resource); 620,000,000 tons, 0.014 opt Au, 0.71 opt Ag (measured and indicated oxide, transitional and sulfide mill resource); 181,000,000 tons, 0.015 opt Au, 0.56

65
MAJOR PRECIOUS-METAL DEPOSITS, HUMBOLDT COUNTY (continued) _________________________________________________________________________________________________________
Deposit name Reserves/resources Production Host rock Mineralization age
_________________________________________________________________________________________________________
Hycroft (cont.) opt Ag (inferred oxide, transitional and sulfide resource) 2011: 1,134,669,000 tons, 0.011 opt Au, 12,651,000 oz Au, 0.42 opt Ag, 481,881,000 oz Ag (proven and probable reserves, 0.004 opt Au heap leach cut-off grade, 0.01 opt Au mill cut-off grade); 939,619,000 tons, 0.009 opt Au, 8,170,000 oz Au, 0.25 opt Ag, 236,851,000 oz Ag (measured and indicated resource, 0.004 opt Au heap leach cut-off grade, 0.01 opt Au mill cut-off grade); 534,938,000 tons, 0.01 opt Au, 0.253 opt Ag (inferred resource, 0.004 opt Au heap leach cut-off grade, 0.01 opt Au mill cut-off grade) 2012: 1,108,078,000 tons, 0.011 opt Au, 11,875,000 oz Au, 0.46 opt Ag, 509,559,000 oz Ag (proven and probable reserves, 0.005 opt Au heap leach cut-off grade, 0.01 opt Au mill cut-off grade); 1,596,780,000 tons, 0.008 opt Au, 12,429,000 oz Au, 0.23 opt Ag, 360,148,000 oz Ag (measured and indicated resource, 0.004 opt Au heap leach cut-off grade, 0.009 opt Au mill cut-off grade); 628,251,000 tons, 0.01 opt Au, 0.26 opt Ag (inferred resource, 0.004 opt Au heap leach cut-off grade, 0.01 opt Au mill cut-off grade) 2013: 951,001,000 tons, 0.011 opt Au, 10,556,000 oz Au, 0.49 opt Ag, 467,146,000 oz Ag (proven and probable reserves); 1,587,969,000 tons, 0.008 opt Au, 12,375,000 oz Au, 0.23 opt Ag, 369,911,000 oz Ag (measured and indicated resource); 627,093,000 tons, 0.01 opt Au, 0.26 opt Ag (inferred resource)
_________________________________________________________________________________________________________
Lone Tree 1990: 5,400,000 tons oxide mill ore, 1991-99: 546,335 oz Au Havallah 38 Ma (Buffalo Mountain 0.159 opt Au, 5.700,000 tons heap-leach 1995: 240,000 oz Au, Formation, district) ore, 0.025 opt Au and 1.200,000 oz Au 11,000 oz Ag Antler sequence, in sulfide ore 1996-97: 536,820 oz Au and dacite 1994: 4,000,000 oz Au 1998: 257,702 oz Au, porphyry 2000: 40,800,000 tons, 0.060 opt Au proven 27,484 oz Ag and probable reserves (Lone Tree Complex) 1999: 191,975 oz Au, 2001: 29,200,000 tons, 0.065 opt Au (proven 35,617 oz Ag and probable reserves); 7,900,000 tons, 2000: 281,022 oz Au, 0.032 opt Au (mineralized material) 38,346 oz Ag 2002: 21,000,000 tons, 0.069 opt Au (proven 2001: 260,518 oz Au, and probable reserves); 2,000,000 tons, 29,974 oz Ag 0.057 opt Au (measured and indicated 2002: 327,160 oz Au, mineralized material); 1,000,000 tons, 65,905 oz Ag 0.047 opt Au inferred mineralized material 2003: 434,704 oz Au, 2003: 3,300,000 tons, 0.092 opt Au (proven 80,094 oz Ag reserves); 13,000,000 tons, 0.084 opt Au 2004: 497,065 oz Au, (probable reserves); 2,100,000 tons, 0.054 opt 140,144 oz Ag Au (indicated material); 600,000 tons, 0.054 opt 2005: 339,187 oz Au, Au (inferred material) 46,934 oz Ag 2004: 14,000,000 tons, 0.063 opt Au (proven 2006: 357,787 oz Au, and probable reserves); 3,400,000 tons, 26,601 oz Ag 0.044 opt Au (indicated material); 200,000 tons, 2007: 182,768 oz Au, 0.116 opt Au (inferred material) 37,172 oz Ag
_________________________________________________________________________________________________________
Lone Tree 2005: 4,000,000 tons, 0.080 opt Au (proven and 2008: 16,775 oz Au probable reserves); 3,000,000 tons, 0.032 opt Au 1,897 oz Ag (measured and indicated resource) 2009: 12,011 oz Au 2007: 4,200,000 tons, 0.022 opt Au (measured 2,309 oz Ag and indicated resource) 2010: 1,313 oz Au 2012: 2,200,000 tons, 0.023 opt Au, 50,000 oz Au 2011: 19,619 oz Au
(indicated resource); 5,000,000 tons, 0.032 opt 28 oz Ag Au, 80,000 oz Au (inferred resource) 2012: 29,738 oz Au 2013: 2,500,000 tons, 0.023 opt Au (mineralized 5,789 oz Ag material) 2013: 22,931 oz Au 4,970 oz Ag
_________________________________________________________________________________________________________
Marigold 1987: 8,000,000 tons, 0.0935 opt Au 1989-93: 322,219 oz Au, Paleozoic chert, (Battle Mountain 1990: 4,300,000 tons, 0.105 opt Au 9,784 oz Ag argillite, and district) mill ore, 7,600,000 tons, 0.026 opt Au 1994-98: 363,771 oz Au carbonate rocks heap-leach ore 1999: 74,000 oz Au

66
MAJOR PRECIOUS-METAL DEPOSITS, HUMBOLDT COUNTY (continued) _________________________________________________________________________________________________________
Deposit name Reserves/resources Production Host rock Mineralization age
_________________________________________________________________________________________________________
Marigold (cont.) 1999: 19,090,000 tons, 0.032 opt Au 2000: 68,000 oz Au 2000: 30,200,000 tons, 0.035 opt Au 2001: 84,784 oz Au, (proven and probable reserves); 20,700,000 401 oz Ag tons, 0.029 opt Au measured and 2002: 83,321 oz Au, (indicated resource) 1,281 oz Ag 2001: 75,500,000 tons, 0.027 opt Au (proven 2003: 142,100 oz Au, and probable reserves); 109,900,000 tons, 2,080 oz Ag 0.014 opt Au (measured and indicated resource) 2004: 141,304 oz Au, 2002: 79,100,000 tons, 0.026 opt Au (proven 2,354 oz Ag and probable reserves); 129,700,000 tons, 2005: 205,663 oz Au, 0.014 opt Au (mineral resource) 1,723 oz Ag 2003: 9,366,000 tons, 0.031 opt Au (proven 2006: 149,805 oz Au, Reserves); 83,909,000 tons, 0.023 opt Au 1,986 oz Ag (probable reserves); 19,937,000 tons, 0.020 opt 2007: 140,840 oz Au, Au (measured reserves); 20,069,000 tons, 2,233 oz Ag 0.020 opt Au (indicated resource); 177,450,000 2008: 144,106 oz Au, tons, 0.014 opt Au (inferred resource) 5,037 oz Ag 2004: 71,218,500 tons, 0.023 opt Au (proven and 2009: 146,842 oz Au, probable reserves); 18,043,500 tons, 0.022 opt Au 4,239 oz Ag (measured and indicated resource); 21,000,000 2010: 136,754 oz Au, tons, 0.014 opt Au (inferred resource) 3,729 oz Ag 2005: 98,210,000 tons, 0.021 opt Au (proven and 2011: 153,741 oz Au, probable reserves); 157,480,000 tons, 0.020 opt 4,162 oz Ag Au (measured and indicated resource, includes 2012: 144,382 oz Au, reserves); 163,230,000 tons, 0.013 opt Au 2,729 oz Ag (inferred resource) 2013: 161,062 oz Au 2006: 102,870,000 tons, 0.021 opt Au (proven and 3,394 oz Ag probable reserves); 94,587,000 tons, 0.018 opt Au (measured and indicated resource); 88,212,000 tons, 0.011 opt Au (inferred resource) 2007: 84,660,000 tons, 0.020 opt Au (proven and probable reserves); 46,410,000 tons, 0.020 opt Au (measured and indicated resource); 122,530,000 tons, 0.013 opt Au (inferred resource) 2008: 69,600,000 tons, 0.020 opt Au (proven and probable reserves); 42,660,000 tons, 0.016 opt Au (measured and indicated resource); 44,810,000 tons, 0.013 opt Au (inferred resource) 2009: 150,000,000 tons, 0.016 opt Au (proven and probable reserves) 42,190,000 tons, 0.015 opt Au (indicated resource); 75,000,000 tons, 0.015 opt Au (inferred resource) 2010: 143,529,000 tons, 0.016 opt Au (proven and probable reserves); 80,526,000 tons, 0.014 opt Au (indicated resource); 46,638,000 tons, 0.014 opt Au (inferred resource) 2011: 226,889,000 tons, 0.015 opt Au (proven and probable reserves); 32,935,000 tons, 0.012 opt Au (measured and indicated resource); 11,037,000 tons, 0.013 opt Au (inferred resource) 2012: 324,770,000 tons, 0.015 opt Au 4,920,000 oz Au (proven and probable reserves); 50,130,000 tons, 0.012 opt Au, 621,000 oz Au (measured and indicated resource); 89,559,000 tons, 0.012 opt Au, 1,113,000 oz Au (inferred resource) 2013: 264,585,000 tons, 0.016 opt Au 4,167,000 oz Au (proven and probable reserves); 37,000,000 tons, 0.013 opt Au, 474,000 oz Au (measured and indicated resource); 25,014,000 tons, 0.013 opt Au, 324,000 oz Au (inferred resource)
_________________________________________________________________________________________________________
North Stonehouse 1991: 2,500,000 tons, 0.103 oz Au mill ore Havallah 39 Ma (Buffalo Mountain Formation and district) porphyry dikes
_________________________________________________________________________________________________________
Pinson 1980: 3,245,000 tons, 0.119 opt Au 1980: 56,000 oz Au Comus Formation Eocene? (Potosi district) 1989: 480,000 oz Au 1986-88: 189,864 oz Au 1996: 2,600,000 tons, 0.072 opt Au 1989: 72,489 oz Au 2005: 1,692,000 tons, 0.421 opt Au (includes Preble) (measured and indicated resource) 1990-91: 112,022 oz Au

67
MAJOR PRECIOUS-METAL DEPOSITS, HUMBOLDT COUNTY (continued) _________________________________________________________________________________________________________
Deposit name Reserves/resources Production Host rock Mineralization age
_________________________________________________________________________________________________________
Pinson (cont.) 3,097,000 tons, 0.34 opt Au 1992-94: 145,210 oz Au, (inferred resource) 12,700 oz Ag 2006: (includes Range Front, Ogee and 1995: 44,854 oz Au CX-West zones) 1996-98: 128,935 oz Au, 2,505,000 tons, 0.454 opt Au 7,990 oz Ag (measured and indicated resource) 1999: 11,975 oz Au, 442 oz Ag 3,374,500 tons, 0.340 opt Au 2000: 1,116 oz Au, 31 oz Ag (inferred resource) 2001: 679 oz Au 2012: 1,738,738 tons, 0.369 opt Au, 642,236 2012: 1,378 oz Au oz Au (proven and probable, 2013: 5,183 oz Au cut-off grade, 0.2 opt Au); (open pit): 25,466,300 tons, 0.039 opt Au, 981,700 oz Au (measured and indicated resource, 0.01 opt Au cut-off grade, Mag Pit and South Zone deposits); 824,000 tons 0.034 opt Au, 28,300 oz Au (inferred resource, 0.01 opt Au cut-off grade, Mag Pit and South Zone deposits) (underground): 2,919,800 tons, 0.368 opt Au, 1,078,000 oz Au (measured and indicated resource, 0.2 opt Au cut-off grade); 2,236,200 tons, 0.378 opt Au, 845,000 oz Au (inferred resource, 0.2 opt Au cut-off grade)
_________________________________________________________________________________________________________
Preble 1985: 1,800,000 tons, 0.062 opt Au 1985: 17,000 oz Au Preble Formation Eocene? (Potosi district) 1986: 3,160,000 tons, 0.093 opt Au heap leach, 1987: 28,000 oz Au 80,000 tons, 0.242 opt Au mill grade 1988: 18,828 oz Au 1989: 15,110 oz Au 1989: included with Pinson 1990: 1,161 oz Au
_________________________________________________________________________________________________________
Rabbit Creek 1989: 4,100,000 oz Au (additional geologic 1990-92: 296,000 oz Au Ordovician Eocene? (Potosi district) resource of 100,000 Au in refractory material) 1993: see Twin Creeks 1992: reserves-3,260,000 oz Au 1993: see Twin Creeks
_________________________________________________________________________________________________________
Sandman 2007: 8,033,000 tons, 0.034 opt Au (Tenmile district) (measured and indicated resource)
1,418,000 tons, 0.027 opt Au (inferred resource) 2012: 1,300,000 tons, 0.036 opt Au, 0.199 opt Ag, 50,000 oz Au, 300,000 oz Ag (indicated resource) 1,100,000 tons, 0.063 opt Au, 0.167 opt Ag, 70,000 oz Au, 200,000 oz Ag (inferred resource) 2013: 1,300,000 tons, 0.036 opt Au, 0.2 opt Ag (mineralized material) [NI43-101 compliant]
_________________________________________________________________________________________________________
Sleeper 1985: 4,200,000 tons, 0.13 opt Au, 0.73 opt Ag 1986: 128,000 oz Au, Miocene “latite” 16.1 Ma (Awakening district) 1989: 1,975,000 oz Au 94,000 oz Ag flows and dikes,
1990: 44,100,000 tons, 0.038 opt Au, 0.152 opt Ag 1987-88: 389,106 oz Au silicic ash-flow tuff, 1999: 2,100,000 oz Au at average grade 1989-96: 1,149,054 oz Au, Triassic slate and of 0.025 opt Au; 18,100,000 oz Ag at average 1,838,791 oz Ag phyllite grade of 0.208 opt Ag 2001: 90 oz Au, 197 oz Ag 2008: 29,718,000 tons, 0.025 opt Au 2002: 130 oz Au, 263 oz Ag (indicated resource) 22,046,000 tons, 0.017 opt Au 2011(oxide): 47,167,350 tons, 0.011 opt Au, 511,872 oz Au, 0.12 opt Ag, 5,781,121 oz Ag (measured and indicated resource, 0.006 opt Au cut-off grade) 14,541,139 tons, 0.009 opt Au, 136,145 oz Au, 0.1 opt Ag, 1,450,516 oz Ag (inferred resource, 0.006 opt Au cut-off grade) 2011 (sulfide): 143,269,803 tons, 0.015 opt Au, 2,113,527 oz Au, 0.14 opt Ag, 19,556,454 oz Ag (measured and indicated resource, 0.007 opt Au cut-off grade) 75,409,000 tons, 0.013 opt Au, 0.09 opt Ag (inferred resource, 0.006 opt Au cut-off grade)

68
MAJOR PRECIOUS-METAL DEPOSITS, HUMBOLDT COUNTY (continued) _________________________________________________________________________________________________________
Deposit name Reserves/resources Production Host rock Mineralization age
_________________________________________________________________________________________________________
Sleeper (cont.) 2012 (oxide): 79,798,000 tons, 0.008 opt Au, 659,000 oz Au, 0.11 opt Ag, 8,588,000 oz Ag (measured and indicated resource, 0.003 opt Au cut-off grade) 32,667,000 tons, 0.007 opt Au, 214,000 oz Au, 0.093 opt Ag, 3,030,000 oz Ag (inferred resource, 0.003 opt Au cut-off grade) 2012 (sulfide): 280,614,000 tons, 0.01 opt Au, 2,820,000 oz Au, 0.11 opt Ag, 32,018,000 oz Ag (measured and indicated resource, 0.003 opt Au cut-off grade) 188,960,000 tons, 0.008 opt Au, 1,532,000 oz Au, 0.083 opt Ag, 15,708,000 oz Ag (inferred resource, 0.003 opt Au cut-off grade) 2012 (alluvial): 168,000 tons, 0.059 opt Au 10,000 oz Au; (mine dumps): 24,707,000 tons, 0.009 opt Au, 216,000 oz Au, 0.07 opt Ag, 1,712,000 oz Ag (inferred resource, 0.003 opt Au cut-off grade)
_________________________________________________________________________________________________________
Trenton Canyon 1994 oxide resource: 14,600,000 tons, 2000: included with Lone Tree (includes Valmy and 0.035 opt Au, (517,000 oz Au) 2001: 24,228 oz Au, 2,996 oz Ag North Peak) 1999: 995,000 tons, 0.021 opt Au (North Peak); 2002: 3,685 oz Au, 742 oz Ag (Buffalo Valley district) 10,800,000 tons, 0.022 opt Au (Valmy) 2006: 1,937 oz Au, 38 oz Ag 2007: 1,768 oz Au, 360 oz Ag
_________________________________________________________________________________________________________
Trout Creek 1989: 50,000 oz Au (Battle Mountain district)
_________________________________________________________________________________________________________
Twin Creeks 1993: 5,700,000 oz Au 1993-98: 3,338,026 oz Au, Paleozoic 41-43 Ma (Chimney and 1999: 87,100,000 tons, 1,317,456 oz Ag Rabbit Creeks) 0.079 opt Au (proven and probable) 1999: 879,453 oz Au, (Potosi district) 2000: 75,200,000 tons, 0.086 opt Au 119,191 oz Ag (proven and probable) 2000: 779,075 oz Au, 2002: 47,600,000 tons, 0.081 opt Au (proven and 103,909 oz Ag probable reserves); 55,000,000 tons, 0.057 opt 2001: 831,962 oz Au, Au (measured and indicated mineralized material); 95,721 oz Ag 1,800,000 tons, 0.046 opt Au (inferred 2002: 786,313 oz Au, mineralized material) 158,401 oz Ag 2003: 14,000,000 tons, 0.085 opt Au (proven 2003: 697,607 oz Au, reserves); 48,200,000 tons, 0.074 opt Au 128,535 oz Ag (probable reserves); 8,000,000 tons, 0.051 opt 2004: 352,810 oz Au, Au (measured material); 34,800,000 tons, 0.051 99,472 oz Ag opt Au (indicated material); 1,700,000 tons, 2005: 267,620 oz Au, 0.041 opt Au (inferred material) 144,172 oz Ag 2004: 61,800,000 tons, 0.075 opt Au (proven and 2006: 354,484 oz Au, probable reserves); 15,300,000 tons, 0.077 opt 43,467 oz Ag Au (indicated material); 800,000 tons, 0.043 opt 2007: 488,457 oz Au, Au (inferred material) 99,344 oz Ag 2005: 61,200,000 tons, 0.074 opt Au (proven and 2008: 512,190 oz Au, probable reserves); 19,900,000 tons, 0.049 opt 57,913 oz Ag Au (measured and indicated resource); 2009: 437,830 oz Au, 3,100,000 tons, 0.033 opt Au (inferred resource) 84,159 oz Ag 2006: 64,800,000 tons, 0.077 opt Au (proven and 2010: 452,744 oz Au, 211,935 oz Ag probable reserves); 25,000,000 tons, 0.058 opt 2011: 484,449 oz Au, 290,802 oz Ag Au (measured and indicated resource); 2012: 408,751 oz Au, 79,574 oz Ag 3,100,000 tons, 0.033 opt Au (inferred resource) 2013: 406,847 oz Au, 88,184 oz Ag 2007: 52,100,000 tons, 0.078 opt Au (proven and probable reserves); 21,000,000 tons, 0.063 opt Au (measured and indicated resource); 2,600,000 tons, 0.030 opt Au (inferred resource) 2008: 51,700,000 tons, 0.077 opt Au (proven and probable reserves); 31,100,000 tons, 0.051 opt Au (measured and indicated resource); 10,800,000 tons, 0.018 opt Au (inferred resource) 2009: 50,200,000 tons, 0.077 opt Au (proven and probable reserves); 35,000,000 tons, 0.050 opt Au (measured and indicated resource); 11,300,000 tons, 0.018 opt Au (inferred resource) 2010: 57,800,000 tons, 0.076 opt Au (proven and probable reserve, 79% recovery); 37,900,000 tons, 0.039 opt Au (measured and indicated resource); 12,000,000 tons, 0.0194 opt Au (inferred resource

69
MAJOR PRECIOUS-METAL DEPOSITS, HUMBOLDT COUNTY (continued) _________________________________________________________________________________________________________
Deposit name Reserves/resources Production Host rock Mineralization age
_________________________________________________________________________________________________________
Twin Creeks (cont.) 2011: 48,700,000 tons, 0.078 opt Au (proven and probable reserve, 80% recovery); 46,000,000 tons, 0.045 opt Au (measured and indicated resource); 13,500,000 tons, 0.026 opt Au (inferred resource) 2012: 58,300,000 tons, 0.058 opt Au, 3,400,000 oz Au (proven and probable reserve, 80% recovery); 41,900,000 tons, 0.059 opt Au, 2,470,000 oz Au (measured and indicated resource); 3,900,000 tons, 0.061 opt Au 240,000 oz Au (inferred resource) 2013: 39,400,000 tons, 0.06 opt Au, 2,360,000 oz Au (proven and probable reserve, 73% recovery); 32,000,000 tons, 0.069 opt Au (mineralized material) [NI43-101 compliant]
_________________________________________________________________________________________________________
Winnemucca Mountain 1998: 130,000 to 140,000 oz Au proven, (Winnemucca district) 300,000 oz Au indicated
_________________________________________________________________________________________________________
LANDER COUNTY
_________________________________________________________________________________________________________
Austin Gold Venture 1986: 1,750,000 tons, 0.16 opt Au 1986-88: 141,000 oz Au Antelope Valley Cretaceous or (Birch Creek district) 1989: mined out 1989: 50,000 oz Au Limestone Tertiary 1999: 154,000 oz Au resource
_________________________________________________________________________________________________________
Battle Mountain 1992: 500,000 oz Au 1994-98: 274,741 oz Au, Eocene Complex 1995: resource (overall Battle Mountain 632,739 oz Ag (Battle Mountain complex)-60,200,000 tons, 0.036 opt Au, 1999: 8,322 oz Au, district) including reserves-46,600,000 tons, 19,526 oz Ag
0.040 opt Au 2000: 1,509 oz Au, 1999 (Phoenix): 5,680,000 oz Au (proven and 1,756 oz Ag Probable); 1.500,000 oz Au (additional 2001: see Phoenix Mineralization) 2000: 175.200,000 tons, 0.034 opt Au proven and probable reserves
_________________________________________________________________________________________________________
Buffalo Valley 1988: 1,500,000 tons, 0.05 opt Au 1988-90: 39,668 oz Au Eocene? Gold Project 1994: 4,800,000 tons, 0.07 opt Au (Buffalo Valley 1997: 600,106 oz Au resource; district) 100,797 oz Au, other mineralized material 2010: 18,300,000 tons, 0.020 opt Au (indicated resource); 900,000 tons, 0.017 opt Au (inferred resource) 2011: 16,500,000 tons, 0.019 opt Au (indicated resource); 2,900,000 tons, 0.014 opt Au (inferred resource) 2012: 23,100,000 tons, 0.063 opt Au 470,000 oz Au (indicated resource); 715,000 tons, 0.035 opt Au 14,300 oz Au (inferred resource) 2013: 22,100,000 tons, 0.019 opt Au (mineralized material)
_________________________________________________________________________________________________________
Cortez Joint Venture 1968: 3,600,000 tons, 0.279 opt Au 1942-84: 2.400,000 tons, 0.13 Roberts Mountains (Bullion district) (Cortez deposit) opt Au; 2,000,000 tons, Formation, Wenban CJV includes original 1987: 4,800,000 tons, 0.105 opt Au 0.041opt Au leached. Little Limestone, Valmy Cortez Mine, Pipeline, 1999: 189,400,000 tons, 0.050 opt Au Gold Acres: 800,000 tons, Formation, quartz South Pipeline, (proven and probable); 119,100,000 tons, 0.124 opt Au porphyry dikes Gold Acres 0.035 opt Au mineralized material 1988: 42,322 oz Au (2007 and on 2000: 151,300,000 tons, 0.047 opt Au (includes Horse Canyon) includes Cortez Hills) (proven and probable); 60,000,000 tons, 1989: 39,993 oz Au,12,234 oz Ag 0.047 opt Au (mineralized material) (includes Horse Canyon)

70
MAJOR PRECIOUS-METAL DEPOSITS, LANDER COUNTY (continued) _________________________________________________________________________________________________________
Deposit name Reserves/resources Production Host rock Mineralization age
_________________________________________________________________________________________________________
Cortez Joint Venture 2001: 191,100,000 tons, 0.044 opt Au 1990-91: 107,445 oz Au, (cont.) (proven and probable); 76,600,000 tons, 16,750 oz Ag 0.040 opt Au (resource) 1992-93: 141,850 oz Au 2002: 229,300,000 tons, 0.034 opt Au 1995-98: 1,817,273 oz Au (proven and probable reserves); 31,332 oz Ag 281,700,000 tons, 0.025 opt Au (measured 1999: 1,328,525 oz Au and indicated mineral resource) 2000: 1,009,992 oz Au 2003: 88,131,000 tons, 0.061 opt Au (proven 2001: 1,184,732 oz Au reserves); 49,623,000 tons, 0.045 opt Au 2002: 1,081,677 oz Au (probable reserves); 44,617,000 tons, 0.046 opt 2003: 1,065,402 oz Au
(measured resource); 130,580,000 tons, 0.027 2004: 1,051,197 oz Au opt Au indicated resource; 18,023,000 tons, 2005: 915,889 oz Au,
0.047 opt Au (inferred resource) 52,160 oz Ag 2004: 193,560,000 tons, 0.046 opt Au (proven 2006: 408,255 oz Au, and probable reserves); 188,860,000 tons, 25,065 oz Ag 0.028 opt Au (measured and indicated); 2007: 534,173 oz Au, 20,500,000 tons, 0.024 opt Au inferred resource 47,240 oz Ag 2005 (Sept 1): 275,800,000 tons, 0.040 opt Au 2008: 464,253 oz Au (6,804 oz Au from Cortez Hills), (proven and probable reserves); 309,000,000 69,278 oz Ag tons, 0.033 opt Au (measured and indicated 2009: 517,512 oz Au, 74,080 oz Ag resource); 39,200,000 tons, 0.058 opt Au 2010 (open pit): 791,978 oz Au, 45,477 oz Ag (inferred resource) 2010 (underground): 47,988 oz Au 2006: 184,000,000 tons, 0.061 opt Au (proven 2011 (open pit): 1,119,910 oz Au, 19,721 oz Ag and probable reserves); 44,470,000 tons, 2011 (underground): 301,129 oz Au, 4,775 oz Ag 0.041 opt Au (measured and indicated resource); 2012 (open pit): 939,004 oz Au, 25,155 oz Ag 6,540,000 tons, 0.131 opt Au (inferred resource) 2012 (underground): 430,962 oz Au, 9,986 oz Ag 2007: 144,090,000 tons, 0.080 opt Au (proven 2013 (open pit, includes Pipeline): 825,196 oz Au, and probable reserves); 76,240,000 tons, 22,187 oz Ag 0.045 opt Au (measured and indicated resource); 2013 (underground): 545,852 oz Au, 13,666 oz Ag 19,340,000 tons, 0.153 opt Au (inferred resource) 2008: 222,125,000 tons, 0.060 opt Au (proven and probable reserves); 81,088,000 tons, 0.046 opt Au (measured and indicated resource); 29,912,000 tons, 0.129 opt Au (inferred resource) 2009: 243,669,000 tons, 0.058 opt Au (proven and probable reserves); 46,622,000 tons, 0.074 opt Au (measured and indicated resource); 30,128,000 tons, 0.144 opt Au (inferred resource) 2010: 317,081,000 tons, 0.046 opt Au (proven and probable reserves); 60.463,000 tons, 0.072 opt Au (measured and indicated resource); 50,337,000 tons, 0.103 opt Au (inferred resource) 2010: 317,081,000 tons, 0.046 opt Au (proven and probable reserves); 60.463,000 tons, 0.072 opt Au (measured and indicated resource); 50,337,000 tons, 0.103 opt Au (inferred resource) 2010: 317,081,000 tons, 0.046 opt Au (proven and probable reserves); 60.463,000 tons, 0.072 opt Au (measured and indicated resource); 50,337,000 tons, 0.103 opt Au (inferred resource) 2011: 306,879,000 tons, 0.047 opt Au, 14,488,000 oz Au (proven and probable reserves); 54,391,000,000 tons, 0.069 opt Au, 3,757,000 oz Au (measured and indicated resource); 21,881,00000,000 tons, 0.074 opt Au, 1,615,000 oz Au (inferred resource) 2012: 306,190,000 tons, 0.049 opt Au 15,058,000 oz Au (proven and probable reserves); 50,943,000 tons, 0.053 opt Au, 2,701,000 oz Au (measured and indicated resource); 25,174,000 tons, 0.065 opt Au, 1,633,000 oz Au (inferred resource) 2013: 207,710,000 tons, 0.053 opt Au 11,024,000 oz Au (proven and probable reserves); 100,465,000 tons, 0.049 opt Au, 4,914,000 oz Au (measured and indicated resource); 17,344,000 tons, 0.054 opt Au, 939,000 oz Au (inferred resource)
_________________________________________________________________________________________________________

71
MAJOR PRECIOUS-METAL DEPOSITS, LANDER COUNTY (continued) _________________________________________________________________________________________________________
Deposit name Reserves/resources Production Host rock Mineralization age
_________________________________________________________________________________________________________
Cortez Hills 2005 (Sept 1): 71,300,000 tons, 0.079 opt Au 2010-2013: Production Roberts Mountains 5,545,000 oz Au (proven and probable reserves); combined with Cortez Formation, Wenban 5.7500,000 tons, 0.42 opt Au, 2,421,667 oz Au Joint Venture Limestone (measured and indicated resource, underground); 13,800,000 tons, 0.13 opt Au, 1,856,667 oz Au (inferred resource, open pit and underground) 2006: 8.500,000 oz Au (proven and probable reserves)
_________________________________________________________________________________________________________
Cortez Hills (cont.) 2008 (Nov.): 15,620,000 tons, 0.127 opt Au, 1,983,740 oz Au (proven reserve); 128,150,000 tons, 0.074 opt Au, 9,483,000 oz Au (probable reserve) 2010 (open pit): 31,531,000 tons, 0.139 opt Au (proven and probable reserve) 2010 (underground, breccia zone): 2,251,000 tons, 0.595 opt Au (proven and probable reserve) 2010 (underground, middle zone): 3,173,000 tons, 0.370 opt Au (proven and probable reserve) 2011 (open pit): 32,591,000 tons, 0.131 opt Au, 4,275,000 oz Au (proven and probable reserve, 0.004-0.075 opt Au cut-off grade); 237,000 tons, 0.08 opt Au, 19,000 oz Au (measured and indicated resource); 1,351,000 tons, 0.025 opt gold, 33,000 oz Au (inferred resource) (underground): 6,516,000 tons, 0.446 opt Au, 2,908,000 oz Au (proven and probable reserve, 0.004-0.075 opt Au cut-off grade); 6,476,000 tons, 0.379 opt Au, 2,456,000 oz Au (measured and indicated resource); 3,197,000 tons, 0.337 opt gold, 1,078,000 oz Au (inferred resource)
_________________________________________________________________________________________________________
Cortez NW Deeps 2011: 4,689,000 tons, 0.047 opt Au, Roberts Mountains (Bullion district) 218,000 oz Au (measured and indicated Formation, Hanson resource); 3,951,000 tons, 0.065 opt gold, Creek Formation 259,000 oz Au (inferred resource)
_________________________________________________________________________________________________________
Crescent Pit 1994: 1,970,000 tons mill grade, 0.125 opt Au, 2.200,000 tons heap-leach, 0.029 opt Au 1997: included in Cortez Joint Venture
_________________________________________________________________________________________________________
Crescent Valley 1994: placer reserves-8,000,000 cu yd, 0.031 oz Au/cu yd (Bullion district) 1995: placer resource-6,000,000 cu yd, 0.03 oz Au/cu yd
_________________________________________________________________________________________________________
Crossroads 2010: 125,842,000 tons, 0.027 opt Au (Bullion district) (proven and probable reserve) 2011:129,391,000 tons, 0.03 opt Au, 3,937,000 oz Au (proven and probable reserve, 0.004-0.075 opt Au cut-off grade); 23,895,000 tons, 0.015 opt Au, 370,000 oz Au (measured and indicated resource); 7,273,000 tons, 0.015 opt gold, 112,000 oz Au (inferred resource)
_________________________________________________________________________________________________________
Dean 1995: proven reserves-11,000 oz Au (Lewis district) possible to probable resource-240,000 oz Au
_________________________________________________________________________________________________________
Elder Creek 1989: 91,500 oz Au 1990-91: 20,102 oz Au Valmy Formation Cretaceous or Project/Shoshone 1990: 1,500,000 tons, 0.041 opt Au Eocene (Lewis district)
_________________________________________________________________________________________________________
Fire Creek (northeast 1982: 350,000 tons, 0.06 opt Au 1983-84: 767 oz Au basaltic andesite Miocene of Bullion district) 2005 (May): 1,779,196 tons, 0.328 opt Au 2012: 191 oz Au, 286 oz Ag (indicated resource) 2006: 1,961,195 tons, 0.576 opt Au (indicated resource) 2008 (April): 2,654,650 tons, 0.479 opt Au (indicated resource, 0.233 opt Au cut-off grade); 1,184,202 tons, 0.396 opt Au (inferred resource, 0.233 opt Au cut-off grade)
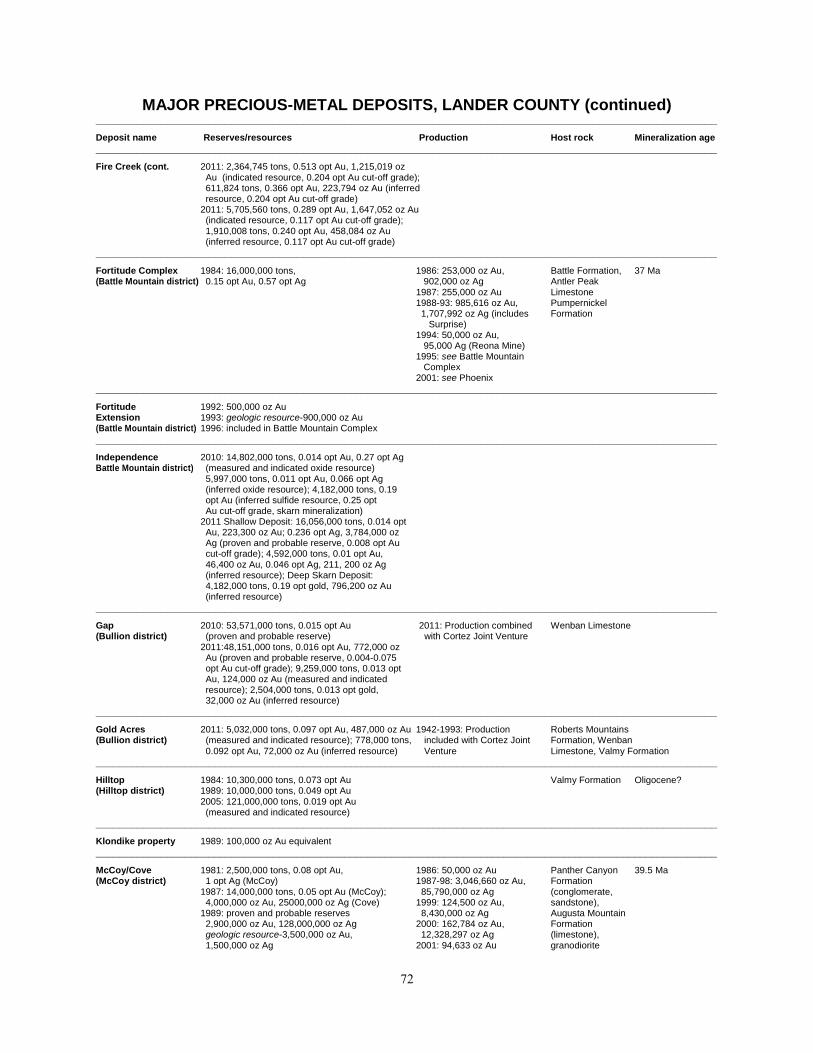
72
MAJOR PRECIOUS-METAL DEPOSITS, LANDER COUNTY (continued) _________________________________________________________________________________________________________
Deposit name Reserves/resources Production Host rock Mineralization age
_________________________________________________________________________________________________________
Fire Creek (cont. 2011: 2,364,745 tons, 0.513 opt Au, 1,215,019 oz Au (indicated resource, 0.204 opt Au cut-off grade); 611,824 tons, 0.366 opt Au, 223,794 oz Au (inferred resource, 0.204 opt Au cut-off grade) 2011: 5,705,560 tons, 0.289 opt Au, 1,647,052 oz Au (indicated resource, 0.117 opt Au cut-off grade); 1,910,008 tons, 0.240 opt Au, 458,084 oz Au (inferred resource, 0.117 opt Au cut-off grade)
_________________________________________________________________________________________________________
Fortitude Complex 1984: 16,000,000 tons, 1986: 253,000 oz Au, Battle Formation, 37 Ma (Battle Mountain district) 0.15 opt Au, 0.57 opt Ag 902,000 oz Ag Antler Peak 1987: 255,000 oz Au Limestone 1988-93: 985,616 oz Au, Pumpernickel 1,707,992 oz Ag (includes Formation Surprise) 1994: 50,000 oz Au, 95,000 Ag (Reona Mine) 1995: see Battle Mountain Complex 2001: see Phoenix
_________________________________________________________________________________________________________
Fortitude 1992: 500,000 oz Au Extension 1993: geologic resource-900,000 oz Au (Battle Mountain district) 1996: included in Battle Mountain Complex
_________________________________________________________________________________________________________
Independence 2010: 14,802,000 tons, 0.014 opt Au, 0.27 opt Ag Battle Mountain district) (measured and indicated oxide resource) 5,997,000 tons, 0.011 opt Au, 0.066 opt Ag (inferred oxide resource); 4,182,000 tons, 0.19 opt Au (inferred sulfide resource, 0.25 opt Au cut-off grade, skarn mineralization) 2011 Shallow Deposit: 16,056,000 tons, 0.014 opt Au, 223,300 oz Au; 0.236 opt Ag, 3,784,000 oz Ag (proven and probable reserve, 0.008 opt Au cut-off grade); 4,592,000 tons, 0.01 opt Au, 46,400 oz Au, 0.046 opt Ag, 211, 200 oz Ag (inferred resource); Deep Skarn Deposit: 4,182,000 tons, 0.19 opt gold, 796,200 oz Au (inferred resource)
_________________________________________________________________________________________________________
Gap 2010: 53,571,000 tons, 0.015 opt Au 2011: Production combined Wenban Limestone (Bullion district) (proven and probable reserve) with Cortez Joint Venture 2011:48,151,000 tons, 0.016 opt Au, 772,000 oz Au (proven and probable reserve, 0.004-0.075 opt Au cut-off grade); 9,259,000 tons, 0.013 opt Au, 124,000 oz Au (measured and indicated resource); 2,504,000 tons, 0.013 opt gold, 32,000 oz Au (inferred resource)
_________________________________________________________________________________________________________
Gold Acres 2011: 5,032,000 tons, 0.097 opt Au, 487,000 oz Au 1942-1993: Production Roberts Mountains (Bullion district) (measured and indicated resource); 778,000 tons, included with Cortez Joint Formation, Wenban
0.092 opt Au, 72,000 oz Au (inferred resource) Venture Limestone, Valmy Formation
_________________________________________________________________________________________________________
Hilltop 1984: 10,300,000 tons, 0.073 opt Au Valmy Formation Oligocene? (Hilltop district) 1989: 10,000,000 tons, 0.049 opt Au 2005: 121,000,000 tons, 0.019 opt Au (measured and indicated resource)
_________________________________________________________________________________________________________
Klondike property 1989: 100,000 oz Au equivalent
_________________________________________________________________________________________________________
McCoy/Cove 1981: 2,500,000 tons, 0.08 opt Au, 1986: 50,000 oz Au Panther Canyon 39.5 Ma (McCoy district) 1 opt Ag (McCoy) 1987-98: 3,046,660 oz Au, Formation 1987: 14,000,000 tons, 0.05 opt Au (McCoy); 85,790,000 oz Ag (conglomerate, 4,000,000 oz Au, 25000,000 oz Ag (Cove) 1999: 124,500 oz Au, sandstone), 1989: proven and probable reserves 8,430,000 oz Ag Augusta Mountain 2,900,000 oz Au, 128,000,000 oz Ag 2000: 162,784 oz Au, Formation geologic resource-3,500,000 oz Au, 12,328,297 oz Ag (limestone), 1,500,000 oz Ag 2001: 94,633 oz Au granodiorite

73
MAJOR PRECIOUS-METAL DEPOSITS, LANDER COUNTY (continued) _________________________________________________________________________________________________________
Deposit name Reserves/resources Production Host rock Mineralization age
_________________________________________________________________________________________________________
McCoy/Cove (cont.) 1999: 11,800,000 tons, 0.043 opt Au, 6,451,425 oz Ag 2.387 opt Ag proven and probable reserves; 2002: 33,142 oz Au, 100,000 tons, 0.350 opt Au, 2.0 opt Ag 1,987,421 oz Ag other mineralization 2003: 4,699 oz Au, 2000: 4,700,000 tons, 0.034 opt Au, 2.309 opt Ag 706 oz Ag proven and probable reserves 2004: 8,454 oz Au, 2001: 430,000 tons, 0.031 opt Au, 2.624 opt Ag 64,335 oz Ag proven and probable reserves 2005: 2,740 oz Au, 776 oz Ag 2010 (Helen Zone): 684,855 tons, 0.77 opt Au 2006: 2,939 oz Au, 596 oz Ag
(inferred resource) 2011 (Helen Zone): 391,600 tons, 0.59 opt Au
(inferred resource) 2013 (Helen Zone): 468,600 tons, 0.31 opt Au, 143,100 oz Au (indicated resource, 0.17 opt Au cut-off grade); 973,600 tons, 0.29 opt Au, 278,700 oz Au (inferred resource, 0.17 opt Au cut-off grade)
_________________________________________________________________________________________________________
Mud Springs 1993: geologic resource-42,000 oz Au (Bald Mtn. Zone) (Bullion district)
_________________________________________________________________________________________________________
Mule Canyon 1992: 8,500,000 tons, 0.136 opt Au 1996: 6,743 oz Au basalt and basaltic 15-16 Ma (Argenta district) 1996: 9,000,000 tons, 0.112 opt Au 1999: 55,392 oz Au, andesite 10,022 oz Ag 2000: 40,027 oz Au, 5,856 oz Ag 2001: 33,616 oz Au, 3,100 oz Ag 2002: 13,444 oz Au, 2,708 oz Ag 2003: 8,086 oz Au, 1,490 oz Ag 2004: 2,289 oz Au, 645 oz Ag 2005: 47,896 oz Au, 5,449 oz Ag 2006: 30,732 oz Au, 3,248 oz Ag 2007: 22,466 oz Au, 4,565 oz Ag
_________________________________________________________________________________________________________
Pediment 2010: 47,316,000 tons, 0.024 opt Au (Cortez district) (proven and probable reserve) 2011: 49,469,000 tons, 0.024 opt Au, 1,163,000 oz Au (proven and probable reserve, 0.004-0.075 opt Au cut-off grade); 805,000 tons, 0.008 opt Au, 6,000 oz Au (inferred resource)
_________________________________________________________________________________________________________
Phoenix 2001: 174,200,000 tons, 0.034 opt Au 2001: 5,641 oz Au, 6,468 oz Ag Eocene (Battle Mountain (proven and probable reserves); 156.3 2002: 6,134 oz Au, 1,236 oz Ag district) 00,000 tons, 0.17% Cu (proven and 2003: 5,444 oz Au, 1,003 oz Ag probable reserves); 73,800,000 tons, 2004: 7,887 oz Au, 2,224 oz Ag 0.026 opt Au mineralized material; 2005: 6,406 oz Au, 1,156 oz Ag 99,600,000 tons, 0.14% Cu 2006: 67,394 oz Au, (mineralized material) 38,112 oz Ag, 2002: 174,200,000 tons, 0.034 opt Au 6,235,096 lbs Cu (probable reserves); 156,300,000 tons, 2007: 181,313 oz Au, 0.16 % Cu (probable reserves); 1,.500,000 664,787 oz Ag, tons, 0.033 opt Au (measured and indicated 10,808,206 lbs Cu mineralized material); 72,300,000 tons, 2008: 175,259 oz Au, 0.026 opt Au (inferred mineralized material); 1,040,563 oz Ag 63.500,000 tons, 0.14 % Cu (inferred 15,853,706 lbs Cu mineralized material) 2009: 218,732 oz Au 2003: 175,700,000 tons, 0.035 opt Au 1,212,153 oz Ag (probable reserves); 94,700,000 tons, 23,733,389 lbs Cu 0.022 opt Au (indicated material); 2010: 214,142 oz Au 18,900,000 tons, 0.029 opt Au (inferred material); 921,350 oz Ag 85,200 tons, 0.12% Cu (indicated material); 19,008,818 lbs Cu 14,300 tons, 0.11% Cu (inferred material) 2011: 205,658 oz Au 2004: 248,000,000 tons, 0.034 opt Au (proven and 1,152,312 oz Ag probable reserves); 33,900,000 tons, 0.022 opt Au 23,897,865 ibs Cu.

74
MAJOR PRECIOUS-METAL DEPOSITS, LANDER COUNTY (continued) _________________________________________________________________________________________________________
Deposit name Reserves/resources Production Host rock Mineralization age
_________________________________________________________________________________________________________
Phoenix (cont.) (indicated material); 34,900,000 tons, 0.028 opt Au 2012: 158,843 oz Au (inferred material); 216,700,000 tons, 0.15% Cu 1,325,200 oz Ag probable; 32,000,000 tons, 0.21% Cu (indicated); 27,809,189 lbs Cu 29,800,000 tons, 0.17% Cu (inferred) 2013: 202,055 oz Au 2005: 308,.400,000 tons, 0.029 opt Au (proven and 1,550,346 oz Ag probable reserves); 22,200,000 tons, 0.023 opt Au 29,815,908 oz Cu (measured and indicated resource); 16.500,000 tons, 0.026 opt Au (inferred resource) 2006: 295,200,000 tons, 0.027 opt Au (proven and probable reserves); 92,800,000 tons, 0.017 opt Au (measured and indicated resource) 23,200,000 tons, 0.022 opt Au (inferred resource) 2007: 278,100,000 tons, 0.027 opt Au (proven and probable reserves); 92,800,000 tons, 0.017 opt Au (measured and indicated resource); 22,900,000 tons, 0.022 opt Au (inferred resource) 2008: 299,800,000 tons, 0.021 opt Au (proven and probable reserves); 61,600,000 tons, 0.015 opt Au (indicated resource); 34,000,000 tons, 0.019 opt Au (inferred resource) 2009: 285,000,000 tons, 0.020 opt Au (probable reserves); 158,400,000 tons, 0.013 opt Au (indicated resource); 35,400,000 tons, 0.015 opt Au (inferred resource) 2010: 329,800,000 tons, 0.018 opt Au (probable reserve, 73% recovery); 150,900,000 tons, 0.013 opt Au (indicated resource); 54,300,000 tons, 0.015 opt Au (inferred resource) 2011: 447,100,000 tons, 0.016 opt Au, 7,250,000 oz Au; 450,300,000 tons, 0.244 opt Ag, 109,980,000 oz Ag (proven and probable reserve 36% recovery: Au 72%, Ag 36%); 216,400,000 tons, 0.012 opt Au, 0.173 opt Ag (indicated resource); 132,300,000 tons, 0.012 opt Au, 0.197 opt Ag (inferred resource) 2012: 439,900,000 tons, 0.017 opt Au, 7,430,000 oz Au, 443,200,000 tons, 0.254 opt Ag, 112,580,000 oz Ag (proven and probable reserve, recovery: Au 73%, Ag 36%); 198,100,000 tons, 0.013 opt Au, 0.186 opt Ag, 2,520,000 oz Au, 36,900,000 oz Ag (measured and indicated resource); 117,200,000 tons, 0.012 opt Au, 0.202 opt Ag, 1,390,000 oz Au, 23,700,000 oz Ag (inferred resource); stockpiles: 2,300,000 tons, 0.089 opt Ag, 200,000 oz Ag (inferred resource) 2013: 335,800,000 tons, 0.017 opt Au, 5,660,000 oz Au, 339,100,000 tons, 0.24 opt Ag, 80,280,000 oz Ag (proven and probable reserve, recovery: Au 73%, Ag 36%); 174,800,000 tons, 0.011 opt Au, 0.21 opt Ag (mineralized material) [NI43-101 compliant]
_________________________________________________________________________________________________________
Pipeline 1991: geologic resource-11,300,000 tons, 1996-2009, 2013: included Roberts Mountains Eocene? (Bullion district) 0.237 opt Au in Cortez Joint Venture Formation 1996: 136,700,000 tons, 8,700,000 oz Au (measured resource, includes South Pipeline) 1997: included in Cortez Joint Venture 2010: 41,453,000 tons, 0.017 opt Au (proven and probable reserve) 2011: 35,704,000 tons, 0.02 opt Au, 707,000 oz Au (proven and probable reserve, 0.004-0.075 opt Au cut-off grade, Pipeline/South Pipeline);
4,803,000 tons, 0.018 opt Au, 84,000 oz Au (measured and indicated resource); 2,022,000 tons, 0.012 opt gold, 24,000 oz Au (inferred resource)
_________________________________________________________________________________________________________
Robertson 1988: 11,000,000 tons, 0.04 opt Au 1989: 3,700 oz Au Valmy Formation early Oligocene (Bullion district) 1999: Porphyry zone, 254,678 oz Au (proven and probable reserves); Lucky Boy, 33,000 oz Au (measured); Altenburg Hill, 21,300 oz Au (measured); Widows Mine, 37,300 oz Au (inferred); Gold Pan, 91,400 oz Au (measured) 2005-2006: 22,900,000 tons, 0.031 opt Au (measured and indicated resource) 9,408,000 tons, 0.046 opt Au (inferred resource)

75
MAJOR PRECIOUS-METAL DEPOSITS, LANDER COUNTY (continued) _________________________________________________________________________________________________________
Deposit name Reserves/resources Production Host rock Mineralization age
_________________________________________________________________________________________________________
Robertson (cont.) 2007: 91,300,000 tons, 0.025 opt Au (inferred resource) 2009: 178,924,188 tons, 0.0189 opt Au (inferred resource, used higher gold price than in 2007) 2011: 191,725,418 tons, 0.0143 opt Au 2,741,673 oz Au (inferred resource, 0.0067 opt Au cut-off grade)
_________________________________________________________________________________________________________
Slaven Canyon property 1994: 50,000 oz Au (Bateman Canyon 2002: 1,600,000 tons, 0.043 opt Au district)
_________________________________________________________________________________________________________
South Pipeline 1992: 900,000 tons, 0.082 opt Au Roberts Mountains Eocene? (Bullion district) 1994: geologic resource-76.500,000 tons, Formation 0.048 opt Au 1996: see Pipeline 1997: included in Cortez Joint Venture 2011: see Pipeline
_________________________________________________________________________________________________________
Surprise 1987: 225,000 oz Au 1987: 2,000 oz Au skarn 37 Ma (Battle Mountain 1988-91: production and reserves included district) in Fortitude figures 1994: mined out
_________________________________________________________________________________________________________
Toiyabe 1988: 813,400 tons, 0.066 opt Au 1988: 32,000 oz Au, lower Paleozoic Eocene? 2009: 4,975,000 tons, 0.035 opt Au 10,300 oz Ag calcareous (indicated resource) 1990-91: 20,480 oz Au, siltstone 15,125 oz Ag
_________________________________________________________________________________________________________
Victorine 1992: 915,000 tons, 0.304 opt Au Cambrian to (Kingston district) 1995: proven and probable reserves- Ordovician 256,000 tons, 0.36 opt Au, plus Broad Canyon additional geologic resource-31,160 oz Au sequence 2000: 120,000 oz Au proven and probable reserves; 200,000 oz Au possible reserves
_________________________________________________________________________________________________________
LINCOLN COUNTY
_________________________________________________________________________________________________________
Atlanta gold property 1980: 1,100,000 tons, 0.08 opt Au, 1954: 22,000 tons ore Pogonip Group, early Miocene (Atlanta district) 1.6 opt Ag 1960s: 27,000 tons ore Ely Springs and 1996: 300,000 oz Au, 3,000,000 oz Ag 1975-1985: 1,500,000 tons, Laketown 2011 Main Zone: 6,391,000 tons, 0.047 opt Au, 0.09 opt Au, 1.25 opt Ag Dolomites, 302,797 oz Au, 0.25 opt Ag, 1,569,689 oz Ag 1980: 88,000 oz Au, Oligocene silicic (indicated resource, 0.015 opt Au cut-off grade) 1,710,000 oz Ag tuff, dacite dikes 4,330,227 tons, 0.031 opt Au, 133,662 oz Au, 0.56 opt Ag, 2,404,717 oz Ag (inferred resource, 0.015 opt Au cut-off grade) East-West Zones: 1,610,800 tons, 0.046 opt Au, 73,072 oz Au, 0.13 opt Ag, 212,154 oz Ag (indicated resource, 0.015 opt Au cut-off grade) 830,783 tons, 0.039 opt Au, 32,479 oz Au, 0.23 opt Ag, 190,083 oz Ag (inferred resource, 0.015 opt Au cut-off grade) 2012: 15,503,000 tons, 0.035 opt Au, 572,100 oz, Au, 0.38 opt Ag, 5,893,500 oz Ag (measured and indicated resources, 0.015 opt Au cut-off grade) 18,538,000 tons, 0.029 opt Au, 544,300 oz,Au, 0.213 opt Ag, 3,955,400 oz Ag (inferred resources, 0.015 opt Au cut-off grade)
_________________________________________________________________________________________________________
Caliente property 1997: geologic reserves-50,000 tons, Tertiary diorite (Pennsylvania district) 0.03 opt Au, 0.80 opt Ag; geologic Tertiary andesite
_________________________________________________________________________________________________________
Easter and 1994: geologic resource-3,360,000 tons, Cambrian quartzite Miocene Delamar Project 0.069 opt Au (Delamar district) 1995: 1,500,000 tons, 0.069 opt Au

76
MAJOR PRECIOUS-METAL DEPOSITS, LINCOLN COUNTY (continued) _________________________________________________________________________________________________________
Deposit name Reserves/resources Production Host rock Mineralization age
_________________________________________________________________________________________________________
Easter and Delamar 2010 (Easter project): 2,640,000 tons, 0.0386 (cont.) opt Au, 0.408 opt Ag (indicated resource)
200,000 tons, 0.0333 opt Au, 0.350 opt Ag (inferred resource)
_________________________________________________________________________________________________________
Gold Spring 2012: (Grey Eagle Zone): 3,196,276 tons, 0.02 Miocene latite to (Eagle Valley district) opt Au 62,482 Au, 0.02 opt Ag, 632,617 oz Ag andesite
(inferred resource, 0.009 opt Au equivalent cut-off grade ) 2014: (Grey Eagle Zone): 8,450,000 tons, 0.018 opt Au, 150,000 oz Au, 0.2 opt Ag, 1,695,000 oz Ag (measured and indicated resource, 0.006 opt Au cut-off grade); 3,557,000 tons, 0.017 opt Au 65,000 Au, 0.198 opt Ag, 78,000 oz Ag (inferred resource, 0.006 opt Au equivalent cut-off grade)
_________________________________________________________________________________________________________
LYON COUNTY
_________________________________________________________________________________________________________
Dayton Resource Area 2010: 4,970,000 tons, 0.034 opt Au, 0.244 opt Ag Santiago Canyon (Comstock Mine (measured and indicated resource) tuff; Alta Formation Project) 1,210,000 tons, 0.026 opt Au, 0.298 opt Ag (Silver City District) (inferred resource) 2011 (Alhambra, Dayton, and Kossuth Mines): 8,330,000 tons, 0.029 opt Au, 0.213 opt Ag (measured and indicated resource, 0.007 opt Au, cut-off grade); 8,590,000 tons, 0.024 opt Au, 0.131 opt Ag (inferred resource, 0.007 opt Au, cut-off grade)
_________________________________________________________________________________________________________
Fire Angel 1989: 5,600 oz Au, geologic resource– (Como district) 148,500 oz Au
_________________________________________________________________________________________________________
Hercules 1997 (Hydra-Hercules): 259,329 oz Au, 1,956,511 oz Ag Tertiary andesite (Como district) 2012: 7,703,522 tons, 0.0125 opt Au, 96,525 oz Au, 0.107 opt Ag, 821,581 oz Ag (indicated resource) 31,121,649 tons, 0.0121 opt Au, 377,506 oz Au, 0.135 opt Ag, 4,211,693 oz Ag (inferred resource)
_________________________________________________________________________________________________________
Pine Grove 1994: 2,500,000 tons, 0.061 opt Au (Wilson district) 2008 (0.010 opt Au cut-off grade):
2,738,000 tons, 0.25 opt Au (inferred resource, Wilson deposit) 3,321,000 tons, 0.075 opt Au) (inferred resource, Wheeler deposit)
2011 (0.010 opt Au cut-off grade, Wilson and Wheeler deposits): 5,316,000 tons, 0.033 opt Au (indicated resource); 4,136,000 tons, 0.028 opt Au (inferred resource) 2012 Wheeler: 2,867,000 tons, 0.038 opt Au, 109,900 oz Au (measured and indicated Resource, 0.007 opt Au cut-off grade) 96,000 tons, 0.027 opt Au, 7,500 oz Au (inferred resource, 0.007 opt Au cut-off grade)
Wilson: 3,189,000 tons, 0.03 opt Au, 96,100 oz Au (measured and indicated Resource, 0.007 opt Au cut-off grade) 732,000 tons, 0.026 opt Au, 34,300 oz Au (inferred resource, 0.007 opt Au cut-off grade)
_________________________________________________________________________________________________________
Rockland Mine 1965: 100,000 tons, $40 per ton (proven and 1870-1934 intermittently: Rhyolite and diorite (Wilson district) indicated reserves) 45,787 tons at $380,611
_________________________________________________________________________________________________________
South Comstock 1994: 3,000,000 tons, 0.05 opt Au Joint Venture 1995: 100,000 oz Au (Silver City district)
_________________________________________________________________________________________________________

77
MAJOR PRECIOUS-METAL DEPOSITS, LYON COUNTY (continued) _________________________________________________________________________________________________________
Deposit name Reserves/resources Production Host rock Mineralization age
_________________________________________________________________________________________________________
Talapoosa 1988: 2,500,000 tons, 0.041 opt Au, Kate Peak Miocene (Talapoosa district) 0.53 opt Ag oxide Formation
14,900,000 tons, 0.03 opt Au, 0.49 opt Ag sulfide 1995: geologic resource-45,000,000 tons, 0.025 opt Au and 0.33 opt Ag, including proven and probable reserves of 29,900,000 tons, 0.026 opt Au and 0.4 opt Ag
2010 Bear Creek Zone (sulfide): 20,130,000 tons, 0.027 opt Au, 549,000 oz Au, 0.35 opt Ag, 7,053,000 oz Ag (measured and indicated resource, 0.015 opt Au cut-off grade); 10,401,000 tons, 0.027 opt Au, 277,000 oz Au, 0.326 opt Ag, 3,391,000 oz Ag (inferred resource, 0.015 opt Au cut-off grade); Main Zone (oxide): 2,921,000 tons, 0.028 opt Au, 83,000 oz Au, 0.4 opt Ag, 1,169,000 oz Ag (measured and indicated resource, 0.015 opt Au cut-off grade); 2,194,000 tons, 0.03 opt Au, 49,000 oz Au, 0.391 opt Ag, 858,000 oz Ag (inferred resource, 0.015 opt Au cut-off grade) 2013: 31,264,470 tons, 0.032 opt Au, 1,012,802 oz Au, 0.437 opt Ag, 13,649,358 oz Ag (measured and indicated resource, 0.013 opt Au cut-off grade); 11,198,000 tons, 0.021 opt Au, 233,532 oz Au, 0.194 opt Ag, 10,158,000 oz Ag (inferred resource, 0.013 opt Au cut-off grade)
_________________________________________________________________________________________________________
MINERAL COUNTY
_________________________________________________________________________________________________________
Aurora Mine 1989: 347,000 tons, 0.253 opt Au 1989-90: 25,656 oz Au, andesite, rhyolite 10 Ma (Aurora district) 1996: 900,000 tons, 0.1 opt Au 34,562 oz Ag 2003: see Esmeralda 1991: 15,000 oz Au 1992-93: 23,600 oz Au, 52,200 oz Ag 1995: 15,000 oz Au, 35,000 oz Ag 1996: 10,374 oz Au 1997-98: 15,414 oz Au, 7,287 oz Ag
_________________________________________________________________________________________________________
Aurora 1983: 1,500,000 tons, 0.129 opt Au, 1930s: 100,000 oz Au andesite, rhyolite 10 Ma Partnership 0.3 opt Ag 1983: 10,000 oz Au (Aurora district) 1995: 230,000 tons, 0.208 opt Au 1988: 10,302 oz Au (in portion of Humboldt vein system) 1989: 27,825 oz Au, 2003: see Esmeralda 26,000 oz Ag 1991-96: 157,796 oz Au, 318,933 oz Ag
_________________________________________________________________________________________________________
Borealis 1981: 2,100,000 tons, 0.08 opt Au, 0.5 opt Ag 1981-84: 170,000 oz Au rhyolite flow 5 Ma (Borealis district) 1988: 1,792,000 tons, 0.046 oz Au/ton 1986-88: 116,256 oz Au dome, andesite 2000: 33,400,000 tons, 0.044 opt Au, 1989-90: 107,495 oz Au flows, breccias, 0.22 opt Ag cumulative resource 52,401 oz Ag volcaniclastic 2005 (May): 44,700,000 tons, 0.03 opt Au 2011: 3,171 oz Au rocks (measured and indicated resource) 1,992 oz Ag 34,800,000 tons, 0.02 opt Au 2012: 32,066 oz Au (inferred resource) 13,871 oz Ag 2006: 8,235,000 tons, 0.022 opt Au, 0.158 opt Ag 2013: 10,556 oz Au (measured and indicated resource, oxide) 21,187 oz Ag 35,157,000 tons, 0.032 opt Au, 0.164 opt Ag (measured and indicated resource, oxide, partially oxidized, sulfides) 16,909,000 tons, 0.028 opt Au, 0.106 opt Ag (inferred resource, oxide, partially oxidized, and sulfides) 2008: 29,560,000 tons, 0.045 opt Au, 0.273 opt Ag (measured and indicated resource, combined sulfide, partially oxidized and oxide); 36,161,000
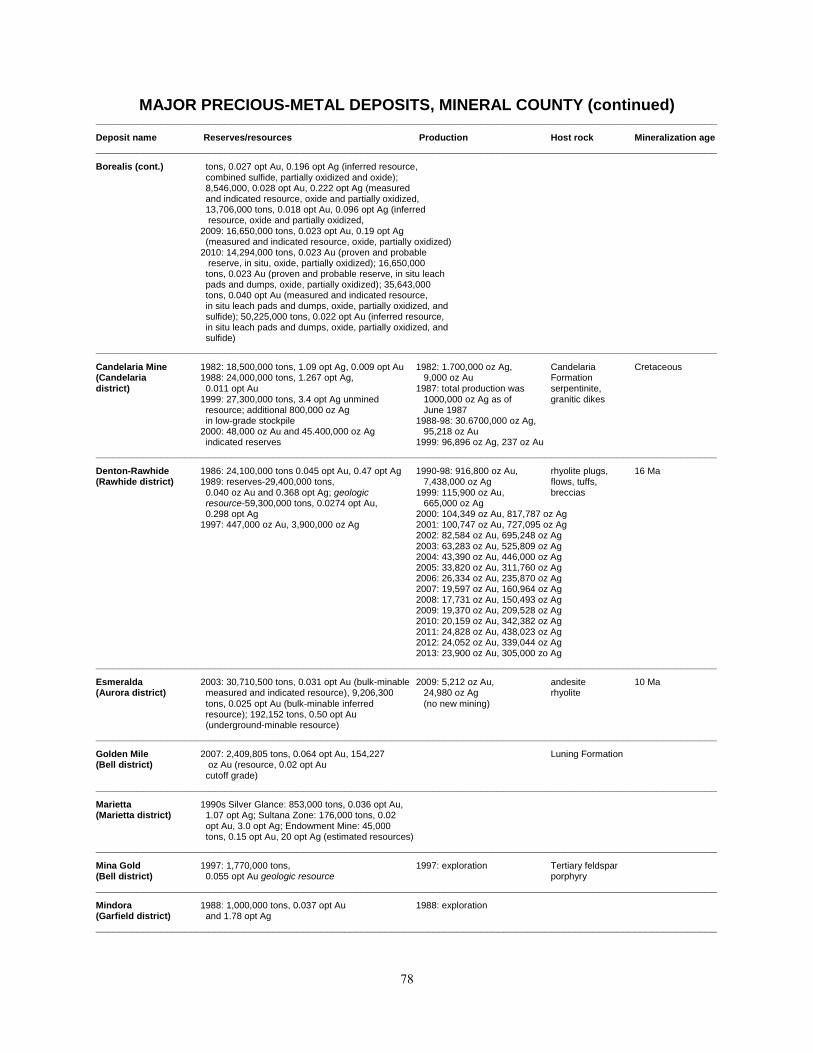
78
MAJOR PRECIOUS-METAL DEPOSITS, MINERAL COUNTY (continued) _________________________________________________________________________________________________________
Deposit name Reserves/resources Production Host rock Mineralization age
_________________________________________________________________________________________________________
Borealis (cont.) tons, 0.027 opt Au, 0.196 opt Ag (inferred resource, combined sulfide, partially oxidized and oxide); 8,546,000, 0.028 opt Au, 0.222 opt Ag (measured and indicated resource, oxide and partially oxidized, 13,706,000 tons, 0.018 opt Au, 0.096 opt Ag (inferred resource, oxide and partially oxidized, 2009: 16,650,000 tons, 0.023 opt Au, 0.19 opt Ag (measured and indicated resource, oxide, partially oxidized) 2010: 14,294,000 tons, 0.023 Au (proven and probable reserve, in situ, oxide, partially oxidized); 16,650,000 tons, 0.023 Au (proven and probable reserve, in situ leach pads and dumps, oxide, partially oxidized); 35,643,000 tons, 0.040 opt Au (measured and indicated resource, in situ leach pads and dumps, oxide, partially oxidized, and sulfide); 50,225,000 tons, 0.022 opt Au (inferred resource, in situ leach pads and dumps, oxide, partially oxidized, and sulfide)
_________________________________________________________________________________________________________
Candelaria Mine 1982: 18,500,000 tons, 1.09 opt Ag, 0.009 opt Au 1982: 1.700,000 oz Ag, Candelaria Cretaceous (Candelaria 1988: 24,000,000 tons, 1.267 opt Ag, 9,000 oz Au Formation district) 0.011 opt Au 1987: total production was serpentinite, 1999: 27,300,000 tons, 3.4 opt Ag unmined 1000,000 oz Ag as of granitic dikes resource; additional 800,000 oz Ag June 1987 in low-grade stockpile 1988-98: 30.6700,000 oz Ag, 2000: 48,000 oz Au and 45.400,000 oz Ag 95,218 oz Au indicated reserves 1999: 96,896 oz Ag, 237 oz Au
_________________________________________________________________________________________________________
Denton-Rawhide 1986: 24,100,000 tons 0.045 opt Au, 0.47 opt Ag 1990-98: 916,800 oz Au, rhyolite plugs, 16 Ma (Rawhide district) 1989: reserves-29,400,000 tons, 7,438,000 oz Ag flows, tuffs, 0.040 oz Au and 0.368 opt Ag; geologic 1999: 115,900 oz Au, breccias resource-59,300,000 tons, 0.0274 opt Au, 665,000 oz Ag 0.298 opt Ag 2000: 104,349 oz Au, 817,787 oz Ag 1997: 447,000 oz Au, 3,900,000 oz Ag 2001: 100,747 oz Au, 727,095 oz Ag 2002: 82,584 oz Au, 695,248 oz Ag 2003: 63,283 oz Au, 525,809 oz Ag 2004: 43,390 oz Au, 446,000 oz Ag 2005: 33,820 oz Au, 311,760 oz Ag 2006: 26,334 oz Au, 235,870 oz Ag 2007: 19,597 oz Au, 160,964 oz Ag 2008: 17,731 oz Au, 150,493 oz Ag 2009: 19,370 oz Au, 209,528 oz Ag 2010: 20,159 oz Au, 342,382 oz Ag 2011: 24,828 oz Au, 438,023 oz Ag 2012: 24,052 oz Au, 339,044 oz Ag 2013: 23,900 oz Au, 305,000 zo Ag
_________________________________________________________________________________________________________
Esmeralda 2003: 30,710,500 tons, 0.031 opt Au (bulk-minable 2009: 5,212 oz Au, andesite 10 Ma (Aurora district) measured and indicated resource), 9,206,300 24,980 oz Ag rhyolite
tons, 0.025 opt Au (bulk-minable inferred (no new mining) resource); 192,152 tons, 0.50 opt Au (underground-minable resource)
_________________________________________________________________________________________________________
Golden Mile 2007: 2,409,805 tons, 0.064 opt Au, 154,227 Luning Formation (Bell district) oz Au (resource, 0.02 opt Au cutoff grade)
_________________________________________________________________________________________________________
Marietta 1990s Silver Glance: 853,000 tons, 0.036 opt Au, (Marietta district) 1.07 opt Ag; Sultana Zone: 176,000 tons, 0.02 opt Au, 3.0 opt Ag; Endowment Mine: 45,000 tons, 0.15 opt Au, 20 opt Ag (estimated resources)
_________________________________________________________________________________________________________
Mina Gold 1997: 1,770,000 tons, 1997: exploration Tertiary feldspar (Bell district) 0.055 opt Au geologic resource porphyry
_________________________________________________________________________________________________________
Mindora 1988: 1,000,000 tons, 0.037 opt Au 1988: exploration (Garfield district) and 1.78 opt Ag
_________________________________________________________________________________________________________

79
MAJOR PRECIOUS-METAL DEPOSITS, MINERAL COUNTY (continued) _________________________________________________________________________________________________________
Deposit name Reserves/resources Production Host rock Mineralization age
_________________________________________________________________________________________________________
Santa Fe 1984: 8,000,000 tons, 0.032 opt Au, 0.26 opt Ag 1989-95: 345,499 oz Au, Luning Formation Miocene (Santa Fe district) 1990: 6,800,000 tons, 0.035 opt Au 710,629 oz Ag and 0.241 opt Ag
_________________________________________________________________________________________________________
Silver Gulch 2006: 853,000 tons, 0.036 opt Au, 1.09 opt Ag Dunlap Formation Tertiary (Marietta district) (calculated resource)
_________________________________________________________________________________________________________
Sultan Group 1990: 176,000 tons, 0.02 opt Au, 3 opt Ag (Marietta district) (resource)
_________________________________________________________________________________________________________
NYE COUNTY _________________________________________________________________________________________________________
Deposit name Reserves/resources Production Host rock Mineralization age
_________________________________________________________________________________________________________
Baxter Springs 1988: 1,000,000 tons, 0.050 opt Au (Manhattan district) 1990: geologic resource-5,000,000 tons 0.050 opt Au
_________________________________________________________________________________________________________
Bruner property, 1992: geologic resource-15,000,000 tons, 1993: exploration Tertiary volcanic Miocene Duluth zone 0.026 opt Au rocks (Bruner district)
_________________________________________________________________________________________________________
Bullfrog 1989: 18,600,000 tons, 0.097 opt Au 1989-98: 2,237,484 oz Au, rhyolitic 9.5 Ma (Bullfrog district) 1996: 10,200,000 tons, 0.062 opt Au 2,935,484 oz Ag ash-flow tuff proven and probable reserves; 3,700,000 1999: 76,159 oz Au, tons, 0.040 opt Au mineralized material 90,967 oz Ag
_________________________________________________________________________________________________________
Cimmaron 2004: 1,730,600 tons, 0.035 opt Au (San Antone district) inferred material
_________________________________________________________________________________________________________
Corcoran Canyon 2004: 1,774,700 tons, 0.025 opt Au, rhyolitic (Barcelona district) 5.11 opt Ag indicated and inferred material ash-flow tuff
_________________________________________________________________________________________________________
Daisy 1993: 4,700,000 tons, 0.024 opt Au 1997-98: 64,504 oz Au Cambrian 11-13 Ma(?) (Bare Mountain geologic resource-430,000 oz Au 1999: 30,660 oz Au Bonanza King, district) 1998: 4,200,000 tons, 0.033 opt Au proven 2000: 8,740 oz Au Nopah, and and probable reserves 2001: 347 oz Au Carrara Formations
_________________________________________________________________________________________________________
Gold Bar 1987: 1,230,000 tons Au ore silicic volcanic Miocene (Bullfrog district) 1993: idle rocks
_________________________________________________________________________________________________________
Golden Arrow 1997: 12,400,000 tons, 0.039 opt Au Tertiary rhyolite (Golden Arrow district) resource tuff 2009: 12,172,000 tons, 0.024 opt Au, 0.33 opt Ag (measured and indicated resource, oxide and sulfide); 3,790,000 tons, 0.013 opt Au, 0.33 opt Ag (inferred resource, oxide and sulfide); 6,736,000 tons, 0.019 opt Au, 0.23 opt Ag (measured and indicated resource, oxide) 2,040,000 tons, 0.009 opt Au, 0.25 opt Ag (inferred resource, oxide)
_________________________________________________________________________________________________________
Gold Hill property 1998: 306,620 oz Au, 4,871,890 oz Ag 2012: included with rhyolite 26 Ma(?) (Round Mt. district) potential resource Round Mountain ash-flow tuff 2003: (included in Round Mt.)
_________________________________________________________________________________________________________
Gold Wedge property 2002: 104,706 oz Au, 0.494 opt Au 2008: 406 oz dore (Manhattan district) measured resource; 47,052 oz Au, 0.583 opt Au indicated resource; 394,626 oz Au, 0.494 opt Au inferred resource 2005: 333,000 tons, 0.310 opt Au (measured and indicated resource)
_________________________________________________________________________________________________________

80
MAJOR PRECIOUS-METAL DEPOSITS, NYE COUNTY (continued) _________________________________________________________________________________________________________
Deposit name Reserves/resources Production Host rock Mineralization age
_________________________________________________________________________________________________________
Longstreet property 1989: 400,000 tons, 0.024 opt Au, rhyolitic volcanic Oligocene (Longstreet district) geologic resource-9.600,000 tons, rocks
0.024 opt Au 2011: 4,369,836 tons, 0.024 opt Au, 103,969 oz Au, 0.66 opt Ag, 2,879,683 oz Ag (indicated resource, 0.01 opt AuEq cut-off grade); 867,050 tons, 0.024 opt Au, 20,809 oz Au, 0.66 opt Ag, 606,935 oz Ag (inferred resource, 0.01 opt AuEq cut-off grade) 2013: 4,844,000 tons, 0.019 opt Au, 90,900 oz Au, 0.456 opt Ag, 2,210,000 oz Ag (in-pit indicated resource, 0.004 opt cut-off grade); 336,000 tons 0.014 opt Au, 4,750 oz Au, 0.425 opt Ag, 142,700 oz Ag (in-pit inferred resource, 0.004 opt cut-off
grade)
_________________________________________________________________________________________________________
Manhattan property 1989: geologic resource-100,000 tons, Cambrian (Manhattan district) 0.50 opt Au Gold Hill Formation 1997: 1,700,000 tons, 0.13 opt Au (proven and probable)
_________________________________________________________________________________________________________
Midway 1997: 270,000 oz Au (preliminary resource) Ordovician (Rye Patch district) 2005: 5,526,000 tons, 0.039 opt Au (inferred resource) Palmetto Formation Midway (cont.) 2011: 114,000 tons, 0.3017 opt Au, 34,394 oz Au Tertiary volcanic (inferred resource, 0.1 opt Au cut-off grade) rocks
_________________________________________________________________________________________________________
Montgomery 1988: 3,100,000 tons, 0.072 opt Au, rhyolitic 9.5 Ma Shoshone 0.240 opt Ag ash-flow tuff (Bullfrog district)
_________________________________________________________________________________________________________
Nevada Mercury 1994: geologic resource-50,000 oz Au (Bare Mountain district)
_________________________________________________________________________________________________________
North Bullfrog 2008: 2,226,600 tons, 0.026 opt Au (indicated Miocene Crater (Bullfrog district) resource); 1,047,200 tons, 0.023 opt Au Flat Tuff
(inferred resource) 2011: 26,268,000 tons, 0.0085 opt Au, 223,880 oz Au, 0.011 opt Ag, 300,460 oz Ag (Jolly Jane and Mayflower oxide indicated resource, 0.003 opt Au cut-off grade) 515,380,000 tons, 0.0055 opt Au, 2,834,566 oz Au, 0.023 opt Ag, 12,007,678 oz Ag (Connection oxide and Mayflower and Sierra Blanca oxide and unoxidized inferred resource, 0.003 opt Au cut-off grade) 2012: 40,465,000 tons, 0.008 opt Au, 307,860 oz Au, 0.011 opt Ag, 443,230 oz Ag (Jolly Jane and Mayflower oxide indicated resource, 0.003 opt Au cut-off grade) 243,230,000 tons, 0.0053 opt Au, 1,288,970 oz Au, 0.023 opt Ag, 5,760,000
oz Ag (Connection Jolly Jane, Mayflower, and Sierra Blanca oxide inferred resource, 0.003 opt Au cut-off grade)
2014: Total: 28,352,000 tons, 0.008 opt Au, 240,000 oz Au, 0.013 opt Ag, 372,000 oz Ag (indicated resource); 205,011,000 tons, 0.006 opt Au,1,120,000 oz Au, 0.019 opt Ag, 4,092,000 oz Ag (inferred resource); Yellowjacket: 4,070,000 tons, 0.03 opt Au, 123,000 oz Au, 0.16 opt Ag, 655,000 oz Ag (indicated resource, 0.008 opt Au cut-off grade, 84% Au recovery); 20,287,000 tons, 0.027 opt Au, 555,000 oz Au, 0.18 opt 3,648,000 oz Ag (inferred resource, 0.008 opt Au cut-off grade, 84% Au recovery); Sierra Blanca: 1,019,000 tons, 0.006 opt Au, 6,000 oz Au, 0.038 opt Ag, 39,000 oz Ag, (indicated resource, 0.004 opt Au cut-off grade, 80% Au recovery); 195,904,000 tons, 0.006 opt Au,1,066,000 oz Au, 0.02 opt Ag, 3,943,000 oz Ag (inferred resource, 0.004 opt Au cut-off grade, 80% Au recovery); Mayflower: 6,024,000 tons, 0.013 opt Au, 81,000 oz Au, 0.012 opt Ag, 71,000 oz Ag (indicated resource, 0.006 opt Au cut-off grade, 85.1% Au recovery); 34,000 tons, 0.006 opt Au, 0.007 opt Ag (inferred resource, 0.006 opt Au cut-off grade,

81
MAJOR PRECIOUS-METAL DEPOSITS, NYE COUNTY (continued) _________________________________________________________________________________________________________
Deposit name Reserves/resources Production Host rock Mineralization age
_________________________________________________________________________________________________________
North Bullfrog (cont.) 85.1% Au recovery); Jolly Jane: 21,310,000 tons, 0.007 Opt Au, 150,000 oz Au, 0.012 opt Ag, 262,000 oz Ag (indicated resource, 0.004 opt Au cut-off grade, 72% Au recovery); 9,073,000 tons, 0.006 opt Au, 54,000 oz Au, 0.016 opt Ag, 149,000 oz Ag (inferred resource, 0.004 opt Au cut-off grade, 72% Au recovery)
_________________________________________________________________________________________________________
Northumberland 1988: 12,000,000 tons, 0.06 opt Au 1939-42: 32,700 oz Au Roberts Mountains (Northumberland 2005 (July): 30,910,000 tons, 0.067 opt Au 1981-84: 950,000 tons/year and Hanson Creek district) (measured and indicated resource) 1988: 29,667 oz Au, Formations, 4,381,000 tons, 0.091 opt Au (inferred resource) 130,394 oz Ag granodiorite, tonalite, 2008 (June): 36,518,000 tons, 0.06 opt 1981-1990: ~230,000 oz Au, quartz porphyry Au (measured and indicated resource); 485,000 oz Ag dikes Au (measured and indicated resource); 7,418,000 tons, 0.10 opt Au (inferred resource)
_________________________________________________________________________________________________________
Paradise Peak/ 1984: 10,000,000 tons, 0.1 opt Au, 3 opt Ag 1986-88: 560,000 oz Au, rhyolite and Miocene Ketchup Flats pit 1989: 5,220,000 tons, 0.09 opt Au, 8,500,000 oz Ag andesite flows, (Fairplay district) 3.62 opt Ag, mill ore; 11.5200,000 tons, 1989-94: 1,054,084 oz Au, ash-flow and 0.036 opt Au, 0.445 opt Ag, leachable 15,600,000 oz Ag air-fall tuffs 1996: 5,000,000 tons, 0.022 opt Au, 0.2 opt Ag (Ketchup Flats)
_________________________________________________________________________________________________________
Reward property 1998: 77,500 oz Au Cambrian (Bare Mountain 2007: 5,181,340 tons, 0.0266 opt Au (proven Wood Canyon district) and probable reserves); 6,423,571 tons, 0.0245 Formation opt Au (measured and indicated resource) 2009: 7,147,721 tons, 0.0243 opt Au (proven and probable reserves) 2010: 7,709,000 tons, 0.023 opt Au (proven and probable reserves) 2011: 11,856,200 tons, 0.0224 opt Au, 265,800 oz Au (proven and probable reserves) 18,055,000 tons, 0.0201 opt Au, 362,000 oz Au (measured and indicated resource, 0.006 opt Au cut-off grade) 4,757,000 tons, 0.0138 opt Au, 65,600 oz Au (inferred resource, 0.006 opt Au cut-off grade) 2012: 12,347,000 tons, 0.022 opt Au, 269,248 oz Au (proven and probable reserves) 18,055,000 tons, 0.02 opt Au, 362,600 oz Au (measured and indicated resource, 0.006 opt Au cut-off grade) 4,757,000 tons, 0.014 opt Au, 65,600 oz Au (inferred resource, 0.006 opt Au cut-off grade) 2013: 10,731,000 tons, 0.023 opt Au, 249,516 oz Au (proven and probable reserves) 20,294,000 tons, 0.019 opt Au, 387,900 oz Au (measured and indicated resource) 7,071,000 tons, 0.015 opt Au, 106,400 oz Au (inferred resource)
_________________________________________________________________________________________________________
Round Mountain 1977: 12,000,000 tons, 0.061 opt Au, 0.07 opt Ag 1977-84: 313,480 oz Ag, rhyolite 26 Ma (Smoky Valley) 1989: geologic resource-27100,000 tons, 160,419 oz Ag ash-flow tuff (Round Mountain 0.032 opt Au 1987-88: 424,300 oz Au district) 1999: 320,000,000 tons, 0.018 opt Au 1989: 386,227 oz Au, (proven and probable reserves); 211,297 oz Ag 126,000,000 tons, 0.016 opt Au 1990: 483,192 oz Au, (mineralized material) 236,600 oz Ag 2000: 273,200,000 tons, 0.019 opt Au (includes Manhattan) (proven and probable reserves); 1991-98: 3,248,946 oz Au, 18,700,000 tons, 0.022 opt Au 2,607,892 oz Ag (mineralized material) 1999: 541,808 oz Au, 2002: 192,100,000 tons, 0.020 opt Au 464,415 oz Ag (proven and probable reserves); 54.600,000 2000: 640,133 oz Au, tons, 0.012 opt Au (mineral resource) 424,530 oz Ag 2003: 129,866,000 tons, 0.017 opt Au (proven 2001: 746,949 oz Au, reserves); 49,838,000 tons, 0.020 opt Au 509,121 oz Ag (probable reserves); 21,000,000 tons, 0.013 opt 2002: 755,493 oz Au, Au (measured resource); 54,440,000 tons, 0.018 627,579 oz Ag opt Au (indicated resource); 19,580,000 tons, 2003: 784,587 oz Au,

82
MAJOR PRECIOUS-METAL DEPOSITS, NYE COUNTY (continued) _________________________________________________________________________________________________________
Deposit name Reserves/resources Production Host rock Mineralization age
_________________________________________________________________________________________________________
Round Mountain (cont.) 0.018 opt Au (inferred resource, includes 761,333 oz Ag Gold Hill) 2004: 762,966 oz Au, 2004: 433,400,000 tons, 0.018 opt Au (proven and 773,950 oz Ag probable reserves); 64,000,000 tons, 0.015 opt 2005: 736,886 oz Au, Au (mineral resource) 636,361 oz Ag 2005: 275,608,000 tons, 0.017 opt Au (proven and 2006: 657,911 oz Au, probable reserves); 35,412,000 tons, 0.017 opt 644,017 oz Ag Au (measured and indicated resource); 2007: 587,445 oz Au, 35,374,000 tons, 0.013 opt Au (inferred resource) 955,681 oz Ag 2006: 226,084,000 tons, 0.017 opt Au (proven and 2008: 477,499 oz Au, probable reserves); 26,134,000 tons, 0.019 opt 931,368 oz Ag Au (measured and indicated resource); 2009: 414,941 oz Au, 32,898,000 tons, 0.013 opt Au (inferred resource) 850,878 oz Ag 2007: 141,736,000 tons, 0.018 opt Au (proven and 2010: 358,614 oz Au, probable reserves); 30,632,000 tons, 0.022 opt 651,457 oz Ag Au (measured and indicated resource); 2011: 360,020 oz Au, no released inferred resource 644,329 oz Ag 2008: 185,162,000 tons, 0.018 opt Au (proven and 2012: 367,595 oz Au, probable reserves); 57,140,000 tons, 0.019 opt 926,284 oz Ag Au (measured and indicated resource); 2013: 314,886 oz Au, 12,982,000 tons, 0.012 opt Au (inferred resource) 636,564 oz Ag 2009: 157,614,000 tons, 0.019 opt Au (proven and probable reserves); 87,824,000 tons, 0.021 opt Au (measured and indicated resource); 57,208,000 tons, 0.017 opt Au (inferred resource) 2010: 146,034,000 tons, 0.018 opt Au (proven and probable reserves); 101,736,000 tons, 0.022 opt Au (measured and indicated resource); 49,740,000 tons, 0.018 opt Au (inferred resource) 2011: 165,376,000 tons, 0.017 opt Au, 2,822,000 oz Au (proven and probable reserves); 166,840,000 tons, 0.016 opt Au 2,672,000 oz Au (measured and indicated resource); 77,694,000 tons, 0.012 opt Au 928,000 oz Au (inferred resource) 2012: 141,356,000 tons, 0.018 opt Au, 2,485,000 oz Au (proven and probable reserves); 88,586,000 tons, 0.021 opt Au, 1,850,000 oz Au (measured and indicated resource); 56,246,000 tons, 0.015 opt Au 310,000 oz Au (inferred resource) 2013: 92,917,000 tons, 0.02 opt Au, 1,838,000 oz Au; 13,481,000 tons, 0.25 opt Ag, 3,412,000 oz Ag (proven and probable reserves); 84,028,000 tons, 0.022 opt Au, 1,806,000 oz Au; 6,433,000 tons, 0.2 opt Ag, 1,258,000 oz Ag (measured and indicated resource); 54,048,000 tons, 0.016 opt Au, 866,000 oz Au; 278,000 tons, 0.09 opt Ag, 24,000 oz Ag (inferred resource)
_________________________________________________________________________________________________________
Sterling 1983: 200,000 tons, 0.20 opt Au 1983-88: 75,900 oz Au Wood Canyon and 14 Ma (Bare Mountain 1989: 469,000 tons, 0.21 opt Au 1990-91: 24,841 oz Au Bonanza King district) 1996: 129,000 tons, 0.245 opt Au 1995-98: 36,811 oz Au Formations 2006: 214,554 tons, 0.216 opt Au 1999: 3,093 oz Au 2012: 144 Zone: 509,712 tons, 0.133 opt Au, 2012: 12,000 oz Au 67,792 oz Au (measured and indicated 2013: 7,500 oz Au resource, 0.07 opt Au cut-off grade); Panama Zone: 103,040 tons, 0.082 opt Au, 8,449 oz
Au (measured and Indicated resource, 0.02 Au cut-off grade)
_________________________________________________________________________________________________________
South Monitor 1996: 250,000 oz Au Tertiary volcanic (west of Ellendale 1997: 14,000,000 tons, 0.026 opt Au, 0.12 opt Ag rock district)
_________________________________________________________________________________________________________
Sullivan 1987: 10,200,000 tons, 0.039 opt Au, Mesozoic Mesozoic (Fairplay district) 0.086 opt Ag and 0.37% Cu granodiorite and 1995: proven and possible-17,000,000 tons metavolcanic rocks of 0.34% Cu, 0.0255 opt Au, + 8,500,000 tons of 0.32% Cu
_________________________________________________________________________________________________________

83
MAJOR PRECIOUS-METAL DEPOSITS, NYE COUNTY (continued) _________________________________________________________________________________________________________
Deposit name Reserves/resources Production Host rock Mineralization age
_________________________________________________________________________________________________________
Summit 1996: 100,000 tons, 0.07 opt Au, 1990: 8,800 oz Au Triassic dolomite (Union district) 2012: 200,000 tons, 0.035 opt Au (open pit and limestone
resource)
_________________________________________________________________________________________________________
PERSHING COUNTY
_________________________________________________________________________________________________________
Bunce 1989: geologic reserves-600,000 tons, 0.04 opt Au rhyolite Miocene? (Velvet district) 1990: 500,000 tons, 0.04 opt Au
_________________________________________________________________________________________________________
Colado Gold 1997: 15,000,000 tons, 0.022 opt Au Triassic-Jurassic (Willard district) resource metasedimentary 2007 (May 2008): 22,707,000 tons, 0.012 opt Au rocks (oxide, measured and indicated resource); 594,000 tons, 0.070 opt Au (sulfide, measured and indicated resource); 79,129,000 tons, 0.015 opt Au (inferred resource)
_________________________________________________________________________________________________________
Florida Canyon/ 1987: 22,000,000 tons, 0.023 opt Au 1987-88: 109,300 oz Au Grass Valley 2 Ma Standard 1988: 37,000,000 tons, 0.023 opt Au 1989-98: 1,146,148 oz Au, Formation (Imlay district) 1997: reserves-45,500,000 tons, 0.024 opt Au 610,326 oz Ag proven and probable mineralized material- 1999: 139,590 oz Au, 122,800,000 tons, 0.022 opt Au 111,232 oz Ag 2002: 20,000,000 tons, 0.017 opt Au 2000: 173,623 oz Au, (proven and probable reserves) 129,361 oz Ag 2003: 374,393 oz Au (proven 2001: 121,206 oz Au, and probable reserves) 98,645 oz Ag 2004: 16,792,000 tons, 0.016 opt Au 2002: 121,516 oz Au, (proven and probable reserves) 72,567 oz Ag 2010 reserve: 832,000 oz Au; 2003: 101,811 oz Au, 60,065 oz Ag resource: 746,700 oz Au 2004: 73,082 oz Au, 60,405 oz Ag (includes Standard) 746,700 oz Au (“resource”) 2005 (Florida Canyon): 29,186 oz Au, 7,571 oz Ag 2012: 1,124,800 oz Au (reserves) 2005 (Standard): 21,522 oz Au, 51,751 oz Ag 761,000 oz Au (resources) 2006 (Florida Canyon): 16,061 oz Au, 12,423 oz Ag 2006 (Standard): 46,070 oz Au, 64,497 oz Ag 2007 (Florida Canyon): 31,916 oz Au, 28,152 oz Ag 2007 (Standard): 11,814 oz Au, 24,735 oz Ag 2008 (Florida Canyon): 47,095 oz Au, 40,745 oz Ag 2008 (Standard): 2,625 oz Au, 3,644 oz Ag 2009 (Florida Canyon): 44,814 oz Au, 39,760 oz Ag 2009 (Standard): 1,510 oz Au, 3,270 oz Ag 2010 (Florida Canyon): 54,975 oz Au, 39,903 oz Ag
_________________________________________________________________________________________________________
Goldbanks Project 1994: 900,000 oz Au (Goldbanks district) 1996: 80,800,000 tons, 0.019 opt Au (proven and probable reserves); 7.400,000 tons, 0.014 opt Au (possible reserves); 106.800,000 tons, 0.028 opt (Au drill indicated resource) 2000: 569,000 oz Au and 1,700,000 oz Ag indicated reserves 2006: 28,310,000 tons, 0.02 opt Au (inferred resource, Main and KW zones)
_________________________________________________________________________________________________________
Lincoln Hill 2010: 17,215,000 tons, 0.02 opt Au, 0.5 opt Ag (Rochester district) 2012: Oxide: 3,846,000 tons, 0.012 opt Au, 47,000 oz Au, 0.34 opt Ag, 1,292,000 oz Ag (measured resource, 0.003 opt Au cut-off grade); 19,985,000 tons, 0.011 opt Au, 221,000 oz Au, 0.29 opt Ag, 5,648,000 oz Ag (indicated resource, 0.003 opt Au cut-off grade); Sulfide: 395,000 tons, 0.015 opt Au 6,000 oz Au, 0.56 opt Ag, 219,000 oz Ag (measured resource, 0.006 opt Au cut-off grade); 4,878,000 tons, 0.012 opt Au, 60,000 oz Au, 0.5 opt Ag, 2,457,000 oz Ag (indicated resource, 0.006 opt Au cut-off grade); Oxide: 8,412,000 tons, 0.008 opt Au, 66,000 oz Au, 0.24 opt Ag, 2,017,000 oz Ag (inferred resource, 0.003 opt Au cut-off grade); Sulfide: 7,227,000 tons, 0.014 opt Au, 99,000 oz Au, 0.57 opt Ag, 4,138,000 oz Ag (inferred resource, 0.006 opt Au cut-off grade)
_________________________________________________________________________________________________________

84
MAJOR PRECIOUS-METAL DEPOSITS, PERSHING COUNTY (continued) _________________________________________________________________________________________________________
Deposit name Reserves/resources Production Host rock Mineralization age
_________________________________________________________________________________________________________
Nevada Packard 2000: 9,500,000 equivalent oz Ag (reserve) 1913-23: 241,266 tons ore Weaver Rhyolite (Rochester district) 2013: 35,372,000 tons, 0.56 opt Ag, 19,633,000 valued at $1,559,319 oz Ag, 0.002 opt Au, 88,000 oz Au (measured 1981-83: 100,000 oz Ag and indicated resource); 6,806,000 tons, 0.47 opt Ag, 3,228,000 oz Ag, 0.003 opt Au, 20,000 oz Au (inferred resource)
_________________________________________________________________________________________________________
Relief Canyon 1983: 9,000,000 tons, 0.032 opt Au 1984: 24,500 oz Au Natchez Pass Tertiary (Antelope Springs 1988: ~ 1,300,000 tons, 0.03 opt Au 1987-88: 82,000 oz Au Limestone, Grass district) 1996: 8,600,000 tons, 0.022 opt Au 1989-90: 34,266 oz Au, Valley Formation 2013: 32,541,000 tons, 0.017 opt Au 39,235 oz Ag (mineralized material) 2009: 92 oz Au, 342 oz Ag 2014 oxide: 26,698,000 tons, 0.022 opt Au, 534,000 oz Au (measured and indicated resources); 10,124,000 tons, 0.015 opt Au, 157,000 oz Au (inferred resource); Sulfide: 250,000 tons, 0.071 opt Au, 18,000 oz Au (indicated resource); 163,000 tons, 0.048 opt Au, 8,000 oz Au (inferred resource)
_________________________________________________________________________________________________________
Rochester 1981: 75,000,000 tons, 1.5 opt Ag 1986-98: 810,329 oz Au, Koipato Group, Late Cretaceous (Rochester district) 1989: geologic resource-94,500,000 tons, 59.300,000 oz Ag Weaver Rhyolite, 0.012 opt Au, 1.40 opt Ag 1999: 70,396 oz Au, Rochester Rhyolite 1997: 74,200,000 oz Ag, 6.200,000 oz Ag 603,000 oz Au 2000: 75,886 oz Au, 2000: 50,000,000 oz Ag, 410,000 oz 6,678,274 oz Ag Au (includes Nevada Packard) 2001: 81,200 oz Au, 2001: 51,400,000 tons, 0.85 opt Ag, 6,478,916 oz Ag 0.007 opt Au (proven and probable reserves); 2002: 71,905 oz Au, 61,800,000 tons, 0.75 opt Ag, 0.005 opt Au 6,417,792 oz Ag (mineralized material) 2003: 52,363 oz Au, 2002: 46,900,000 tons, 0.008 opt Au, 0.85 opt Ag 5,585,385 oz Ag (proven and probable reserves); 33,800,000 tons, 2004: 69,456 oz Au, 0.009 opt Au, 0.77 opt Ag (mineralized material) 5,669,073 oz Ag (includes Nevada Packard) 2005: 70,298 oz Au, 2003: 32,700,000 tons, 0.01 opt Au, 0.91 opt Ag 5,720,489 oz Ag proven and probable reserves; 40,300,000 tons, 2006: 71,891 oz Au, 0.01 opt Au, 0.77 opt Ag mineralized material 5,113,504 oz Ag 2004: 21,453,000 tons, 0.010 opt Au, 0.87 opt Ag 2007: 50,408 oz Au, proven reserves; 2,545,000 tons, 0.010 opt Au, 4,614,779 oz Ag 0.81 opt Ag probable reserves; 26,205,000 tons, 2008: 21,041 oz Au, 0.010 opt Au, 0.81 opt Ag measured resource; 3,033,720 oz Ag 8,551,000 tons, 0.010 opt Au, 0.96 opt Ag 2009: 12,633 oz Au, indicated resource; 308,000 tons, 0.003 opt Au, 2,181,788 oz Ag 1.73 opt Ag inferred resources 2010: 9,641 oz Au, 2005: 10,168,000 tons, 0.011 opt Au, 0.86 opt Ag 2,023,423 oz Ag (probable reserves); 15,646,000 tons, 0.010 2011: 6,276 oz Au, opt Au, 1.03 opt Ag (measured and indicated 1,392,433 oz Ag resource) 2012: 38,071 oz Au, 2006: 3,720,000 tons, 0.007 opt Au, 0.66 opt Ag 2,801,501 oz Ag (proven reserves); 15,235,000 tons, 0.010 opt 2013: 30,860 oz Au Au, 0.94 opt Ag (measured and indicated 2,798,937 oz Ag resource) 2007: 32,664,000 tons, 0.010 opt Au, 0.86 opt Ag (measured and indicated resource) 2008: 114,058,000 tons, 0.005 opt Au, 0.54 opt Ag (measured and indicated resource) 2010: 48,271,000 tons, 0.005 opt Au, 0.57 opt Ag (proven and probable reserve); 215,602,900 tons, 0.003 opt Au, 0.44 opt Ag (measured and indicated resource); 21,984,300 tons, 0.003 opt Au, 0.65 opt Ag (inferred resource) 2012: 79,923,000 tons, 0.56 opt Ag, 44,896,000 oz Ag, 0.004 opt Au, 308,000 oz Au (proven and probable reserve); 264,283,000 tons, 0.46 opt Ag, 120,717,000 oz Ag, 0.003 opt Au, 865,000 oz Au (measured and indicated resource) 45,643,300 tons, 0.6 opt Ag, 27,201,000 oz Ag, 0.003 opt Au, 123,000 oz Au (inferred resource)
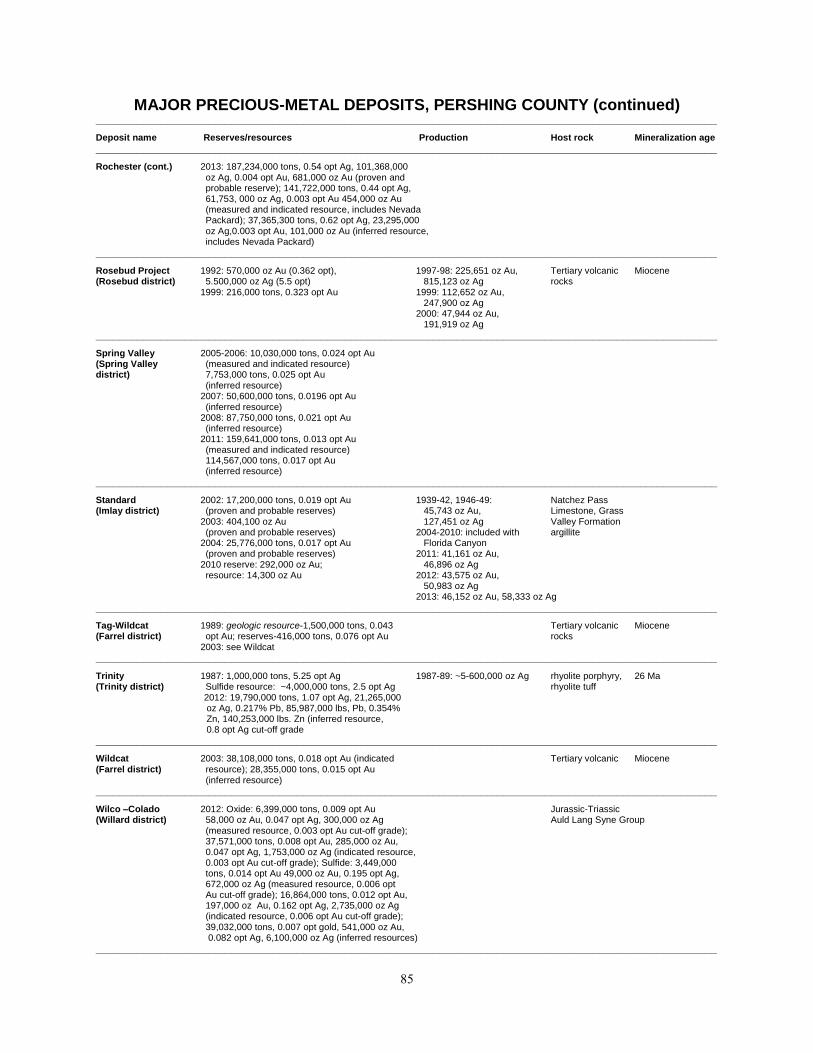
85
MAJOR PRECIOUS-METAL DEPOSITS, PERSHING COUNTY (continued) _________________________________________________________________________________________________________
Deposit name Reserves/resources Production Host rock Mineralization age
_________________________________________________________________________________________________________
Rochester (cont.) 2013: 187,234,000 tons, 0.54 opt Ag, 101,368,000 oz Ag, 0.004 opt Au, 681,000 oz Au (proven and probable reserve); 141,722,000 tons, 0.44 opt Ag, 61,753, 000 oz Ag, 0.003 opt Au 454,000 oz Au (measured and indicated resource, includes Nevada Packard); 37,365,300 tons, 0.62 opt Ag, 23,295,000 oz Ag,0.003 opt Au, 101,000 oz Au (inferred resource, includes Nevada Packard)
_________________________________________________________________________________________________________
Rosebud Project 1992: 570,000 oz Au (0.362 opt), 1997-98: 225,651 oz Au, Tertiary volcanic Miocene (Rosebud district) 5.500,000 oz Ag (5.5 opt) 815,123 oz Ag rocks 1999: 216,000 tons, 0.323 opt Au 1999: 112,652 oz Au, 247,900 oz Ag 2000: 47,944 oz Au, 191,919 oz Ag
_________________________________________________________________________________________________________
Spring Valley 2005-2006: 10,030,000 tons, 0.024 opt Au (Spring Valley (measured and indicated resource) district) 7,753,000 tons, 0.025 opt Au (inferred resource) 2007: 50,600,000 tons, 0.0196 opt Au (inferred resource) 2008: 87,750,000 tons, 0.021 opt Au (inferred resource)
2011: 159,641,000 tons, 0.013 opt Au (measured and indicated resource) 114,567,000 tons, 0.017 opt Au (inferred resource)
_________________________________________________________________________________________________________
Standard 2002: 17,200,000 tons, 0.019 opt Au 1939-42, 1946-49: Natchez Pass (Imlay district) (proven and probable reserves) 45,743 oz Au, Limestone, Grass 2003: 404,100 oz Au 127,451 oz Ag Valley Formation (proven and probable reserves) 2004-2010: included with argillite 2004: 25,776,000 tons, 0.017 opt Au Florida Canyon (proven and probable reserves) 2011: 41,161 oz Au, 2010 reserve: 292,000 oz Au; 46,896 oz Ag resource: 14,300 oz Au 2012: 43,575 oz Au, 50,983 oz Ag 2013: 46,152 oz Au, 58,333 oz Ag
_________________________________________________________________________________________________________
Tag-Wildcat 1989: geologic resource-1,500,000 tons, 0.043 Tertiary volcanic Miocene (Farrel district) opt Au; reserves-416,000 tons, 0.076 opt Au rocks 2003: see Wildcat
_________________________________________________________________________________________________________
Trinity 1987: 1,000,000 tons, 5.25 opt Ag 1987-89: ~5-600,000 oz Ag rhyolite porphyry, 26 Ma (Trinity district) Sulfide resource: ~4,000,000 tons, 2.5 opt Ag rhyolite tuff
2012: 19,790,000 tons, 1.07 opt Ag, 21,265,000 oz Ag, 0.217% Pb, 85,987,000 lbs, Pb, 0.354% Zn, 140,253,000 lbs. Zn (inferred resource, 0.8 opt Ag cut-off grade _________________________________________________________________________________________________________
Wildcat 2003: 38,108,000 tons, 0.018 opt Au (indicated Tertiary volcanic Miocene (Farrel district) resource); 28,355,000 tons, 0.015 opt Au (inferred resource)
_________________________________________________________________________________________________________
Wilco –Colado 2012: Oxide: 6,399,000 tons, 0.009 opt Au Jurassic-Triassic (Willard district) 58,000 oz Au, 0.047 opt Ag, 300,000 oz Ag Auld Lang Syne Group (measured resource, 0.003 opt Au cut-off grade); 37,571,000 tons, 0.008 opt Au, 285,000 oz Au, 0.047 opt Ag, 1,753,000 oz Ag (indicated resource, 0.003 opt Au cut-off grade); Sulfide: 3,449,000 tons, 0.014 opt Au 49,000 oz Au, 0.195 opt Ag, 672,000 oz Ag (measured resource, 0.006 opt Au cut-off grade); 16,864,000 tons, 0.012 opt Au, 197,000 oz Au, 0.162 opt Ag, 2,735,000 oz Ag (indicated resource, 0.006 opt Au cut-off grade); 39,032,000 tons, 0.007 opt gold, 541,000 oz Au, 0.082 opt Ag, 6,100,000 oz Ag (inferred resources)
_________________________________________________________________________________________________________
86
MAJOR PRECIOUS-METAL DEPOSITS, PERSHING COUNTY (continued) _________________________________________________________________________________________________________
Deposit name Reserves/resources Production Host rock Mineralization age
_________________________________________________________________________________________________________
Wilco –Section Line 2012: Oxide: 12,279,000 tons, 0.011 opt Au Jurassic-Triassic (Willard district) 140,000 oz Au, 0.113 opt Ag, 1,393,000 oz Ag Auld Lang Syne Group (measured resource, 0.003 opt Au cut-off grade); 23,676,000 tons, 0.008 opt Au, 193,000 oz Au, 0.081 opt Ag, 1,906,000 oz Ag (indicated resource, 0.003 opt Au cut-off grade); Sulfide: 5,558,000 tons, 0.015 opt Au 81,000 oz Au, 0.128 opt Ag, 710,000 oz Ag (measured resource, 0.006 opt Au cut-off grade); 20,024,000 tons, 0.014 opt Au, 274,000 oz Au, 0.126 opt Ag, 2,517,000 oz Ag (indicated resource 0.006 opt Au cut-off grade); 18,947,000 tons, 0.014 opt gold, 258,000 oz Au, 0.154 opt Ag, 2,917,000 oz Ag (inferred resources)
_________________________________________________________________________________________________________
Willard 2007: 17,295,000 tons, 0.016 opt Au Late 1980s to early 1990s: Jurassic-Triassic 6 Ma (Willard district) (oxide, measured and indicated resource) ~90,000 oz Au Grass Valley
448,000 tons, 0.070 opt Au Formation (sulfide, measured and indicated resource) 20,849,000 tons, 0.015 opt Au (inferred resource)
________________________________________________________________________________________________________
STOREY COUNTY
_________________________________________________________________________________________________________
Comstock heap 1992: 475,000 tons, 0.072 opt Au, 0.60 opt Ag leach project 1996: 100,000 oz Au, 1.200,000 oz Ag (Comstock district)
_________________________________________________________________________________________________________
Comstock Mine Project 2011 (Lucerne and Dayton Resource Areas): 2004-2013: Production Santiago Canyon (Comstock/Silver City 51,260,000 tons, 0.029 opt Au, 1,508,000 oz under Lucerne Resource tuff; Alta Formation districts) Au, 0.28 opt Ag, 14,360,000 oz Ag (measured and Area indicated resource, 0.007 opt Au, cut-off grade) 33,580,000 tons, 0.026 opt Au, 881,000 oz Au, 0.179 opt Ag, 6,030,000 oz Ag (inferred resource, 0.007 opt Au, cut-off grade) 2013: 61,880,000 tons, 0.029 opt Au, 1,824,000 oz Au, 0.276 opt Ag, 17,100,000 oz Ag (measured and indicated resource, 0.007 opt Au, cut-off grade); 34,890,000 tons, 0.022 opt Au 758,000 oz Au, 0.166 opt Ag, 5,790,000 oz Ag (inferred resource, 0.007 opt Au, cut-off grade)
_________________________________________________________________________________________________________
Flowery 1989: 100,000 tons, 0.037 opt Au 1988: 836 oz Au, 9,473 oz Ag Alta Formation 12 Ma (Golden Eagle) 1993: 362,000 tons, 0.064 opt Au, 1990: 6,000 oz Au, (Comstock district) 0.97 opt Ag, geologic resource-88,128 70,000 oz Ag oz Au and 100,000 oz Ag 1992-97: 16,949 oz Au, 195,701 oz Ag
_________________________________________________________________________________________________________
Lucerne Resource 2010 (Billy the Kid and Lucerne Mines: 26,540,000 2004: 2,836 oz Au, Santiago Canyon Area (Comstock Mine tons, 0.028 opt Au, 0.354 opt Ag (measured and 12,695 oz Ag tuff; Alta Formation Project/Hartford Hill indicated resource) 12,660,000 tons, 0.023 2005: 5,715 oz Au, Complex) opt Au, 0.252 opt Ag (inferred resource) 26,488 oz Ag (Comstock district) 2011 (Billy the Kid, Hartford, and Lucerne Mines): 2006: 5,000 oz Au, 42,930,000 tons, 0.03 opt Au, 0.293 opt Ag 20,000 oz Ag (estimated) (measured and indicated resource, 0.007 opt Au, 2012: 2,588 oz Au, cut-off grade); 26,990,000 tons, 0.027 opt Au, 26,738 oz Ag 0.196 opt Ag (inferred resource, 0.007 opt Au, 2013: 17,739 oz Au,
cut-off grade) 186,482 oz Ag
_________________________________________________________________________________________________________
Oliver Hills 1990: 3,370,000 tons, 0.054 opt Au, 1991: 573 oz Au, 6,947 oz Ag (Comstock district) 1.2 opt Ag 1993: 400,000 tons, 0.05 opt Au, 0.5 opt Ag, geologic resource-225,000 oz Au and 2.2500,000 oz Ag
_________________________________________________________________________________________________________

87
WASHOE COUNTY
_________________________________________________________________________________________________________
Mountain View 1995: 19,500,000 tons, 0.027 opt Au rhyolite Miocene Gold Project 1998: 10,700,000 tons, 0.055 opt Au (Deephole district) 2002: 23,219,000 tons, 0.013 opt Au indicated resource; 4..46600,000 tons, 0.039 opt Au inferred resource
_________________________________________________________________________________________________________
Olinghouse 1994: geologic resource-500,000 opt Au, 1998: 2,912 oz Au, Miocene andesite Miocene (Olinghouse district) 0.057 opt Au 1,879 oz Ag 1997: 512,800 oz Au proven and probable 1999: 28,655 oz Au, reserves, 0.042 opt Au 17,598 oz Ag
_________________________________________________________________________________________________________
Hog Ranch 1984: 2,500,000 tons, 0.085 opt Au 1986-87: 80,000 oz Au rhyolite, 15-16 Ma (Leadville district) 1988: 5,500,000 tons, 0.064 opt Au 1988-95: 118,045 oz Au, explosion breccia (proven and probable reserves); 20,100,000 25,400 oz Ag sinter tons, 0.029 opt Au (geologic resource) 2003: 1,598,350 tons, 0.033 opt Au (indicated); 440,924 tons, 0.054 opt Au (inferred)
_________________________________________________________________________________________________________
Wind Mountain 1988: 15,000,000 tons, 0.021 opt Au, 0.42 opt Ag 1989: 30,900 oz Au, Tertiary late Tertiary (San Emidio) 2007: 33,657,553 tons, 0.012 opt Au 335,000 oz Ag sedimentary rocks or Quaternary (measured and indicated resource) 1991: 91,000 oz Au, 9,758,547 tons, 0.009 opt Au (inferred resource) 405,000 oz Ag 2011 Oxide: 58,816,000 tons, 0.1 opt Au, 564,000 1992: 54,690 oz Au, oz Au, 0.25 opt Ag, 14,539,000 oz Ag (indicated 297,403 oz Ag resource, 0.005 opt Au cut-off grade); 19,866,000 1993: 19,570 oz Au, tons, 0.006 opt Au, 125,200 oz Au, 0.17 opt Ag, 92,630 oz Ag 3,443,000 oz Ag (inferred resource, 0.005 opt Au cut-off grade) Mixed and unoxidized: 498,000 tons, 0.12 opt Au, 5,900 oz Au, 0.4 opt Ag, 197,000 oz Ag (indicated resource, 0.01 opt Au cut-off grade); 14,595,000 tons, 0.016 opt Au, 229,100 oz Au, 0.16 opt Ag, 6,672,000 oz Ag (inferred resource, 0.01 opt Au cut-off grade)
_________________________________________________________________________________________________________
WHITE PINE COUNTY
_________________________________________________________________________________________________________
Alligator Ridge 1983: 500,000 tons, 0.09 opt Au 1981-90: 632,057 oz Au, Pilot Shale Mesozoic or (Bald Mountain 1989: 100,000 tons, 0.064 opt Au 84,188 oz Ag early Tertiary district) 1992: 11.500,000 tons, 0.046 opt Au; 1991-92: 27,450 oz Au geologic resource-661,888 oz Au, 1993: included with includes Casino/Winrock Bald Mountain 1994: 40,000 oz Au 1995: idle 1996: included with Bald Mountain
_________________________________________________________________________________________________________
Bald Mountain 1989: 6,700,000 tons, 0.069 opt Au 1986: 50,000 oz Au quartz porphyry, Jurassic? (Bald Mountain 1999: 32,600,000 tons, 0.041 opt Au, (proven 1988-89: 103,731 oz Au Cambrian shale district) and probable reserves); 31,700,000 tons, 1990-93: 287,110 oz Au, and limestone 0.044 opt Au, (mineralized material) 76,745 oz Ag 2000: 509,000 oz Au (proven and probable); 1994: 80,000 oz Au 2,030,000 oz Au (measured and indicated 1995-96: 221,908 oz Au, resource) 62,460 oz Ag 2002: 508,000 oz Au (proven and probable 1997-98: 243,500 oz Au, reserves); 2.0300,000 oz Au (measured 63,416 oz Ag mineral resource) 1999: 105,475 oz Au, 2003: 10,143,000 tons, 0.033 opt Au (proven 18,058 oz Ag
reserves; 8,549,000 tons, 0.040 opt Au (probable 2000: 134,469 oz Au, reserves; 10,371,000 tons, 0.027 opt Au 14,400 oz Ag (measured resource); 10,836,000 tons, 0.043 2001: 108,392 oz Au, opt Au indicated resource; 19,224,000 tons, 18,321 oz Ag 0.029 opt Au inferred resource 2002: 172,328 oz Au, 2004: 21,530,000 tons, 0.044 opt Au proven 21,547 oz Ag and probable reserves; 53,586,000 tons, 2003: 90,602 oz Au, 0.027 opt Au measured and indicated resource; 26,810 oz Ag 10,808,000 tons, 0.018 opt Au inferred resource 2004: 46,685 oz Au, 2005 (includes Alligator Ridge): 105,050,700 tons 27,635 oz Ag 0.032 opt Au (proven and probable reserves) 2005: 77,767 oz Au, 35,000,000 tons 0.023 opt Au (measured and 32,652 oz Ag indicated resource); 14,868,000 tons, 0.026 2006: 277,615 oz Au, opt Au (inferred resource) 32,121 oz Ag

88
MAJOR PRECIOUS-METAL DEPOSITS, WHITE PINE COUNTY (continued) _________________________________________________________________________________________________________
Deposit name Reserves/resources Production Host rock Mineralization age
_________________________________________________________________________________________________________
Bald Mountain (cont.) 2006 (includes Alligator Ridge): 109,922,000 tons, 2007: 125,998 oz Au, 0.031 opt Au (proven and probable reserves); 21,702 oz Ag 23,289,000 tons, 0.035 opt Au (measured and 2008: 103,610 oz Au,15,352 oz Ag and indicated resource); 17,290,000 tons, 2009: 75,037 oz Au, 12,389 oz Ag 0.023 opt Au (inferred resource) 2010: 60,333 oz Au, 15,000 oz Ag 2007 (includes Alligator Ridge): 128,093,000 tons, 2011: 92,818 oz Au, 14,615 oz Ag 0.024 opt Au (proven and probable reserves); 2012: 171,154 oz Au, 40,954 oz Ag 36,493,000 tons, 0.024 opt Au (measured and 2013: 95,497 oz Au, 29,479 oz Ag indicated resource); 24,648,000 tons, 0.017 opt Au (inferred resource) 2008 (includes Alligator Ridge): 57,675,000 tons, 0.018 opt Au (proven and probable reserves) 90,374,000 tons, 0.019 opt Au (measured and indicated resource); 71,004,000 tons, 0.021 opt Au (inferred resource) 2009 (includes Alligator Ridge): 227,346,000 tons, 0.020 opt Au (proven and probable reserves); 99,338,000 tons, 0.012 opt Au (measured and indicated resource); 40,184,000 tons, 0.012 opt Au (inferred resource) 2010 (includes Alligator Ridge): 246,711,000 tons, 0.019 opt Au (proven and probable reserves); 151,944,000 tons, 0.011 opt Au (measured and indicated resource); 60,636,000 tons, 0.011 opt Au (inferred resource) 2011 (includes Alligator Ridge): 307,162,000 tons, 0.017 opt Au, 5,102,000 oz Au (proven and probable reserves); 123,191,000 tons, 0.013 opt Au 1,623,000 oz Au (measured and indicated resource); 72,491,000 tons, 0.011 opt Au, 787,000 oz Au (inferred resource) 2012: 295,559,000 tons, 0.017 opt Au, 5,815,000 oz Au (proven and probable reserves); 125,190,000 tons, 0.012 opt Au, 1,472,000 oz Au (measured and indicated resource); 88,864,000 tons, 0.009 opt Au, 762,000 oz Au (inferred resource) 2013: 135,051,000 tons, 0.018 opt Au, 2,460,000 oz Au (proven and probable reserves); 206,436,000 tons, 0.018 opt Au, 3,579,000 oz Au (measured and indicated resource); 57,515,000 tons, 0.013 opt Au, 758,000 oz Au (inferred resource)
________________________________________________________________________________________________________
Bellview 1988: 277,000 tons, 0.04 opt Au, (White Pine district) geologic resource-1,000,000 tons, 0.036 opt Au
_________________________________________________________________________________________________________
Casino/Winrock 1989: Casino-804,000 tons, 0.054 opt Au; 1990-92: 46,800 oz Au late Paleozoic Eocene (Bald Mountain Winrock 1,300,000 tons, 0.037 opt Au sedimentary rocks district) 1990: Winrock-993,000 tons, 39,000 oz Au 1992: see Alligator Ridge
_________________________________________________________________________________________________________
Golden Butte 1989: 4,230,000 tons, 0.031 opt Au 1989-91: 43,519 oz Au, Chainman Shale Cretaceous (Cherry Creek district) 16,911 oz Ag or Eocene
_________________________________________________________________________________________________________
Gold Rock 1989: 5,680,000 tons, 0.031 opt Au 1990: 11,500 oz Au, Devonian and Eocene (Easy Junior/ 1991: 137,000 oz Au 900 oz Ag Mississippian rocks Nighthawk Ridge) 1997: 510 oz Au, 76 oz Ag (White Pine district) 2011: 14,294,000 tons, 0.022 opt Au, 310,000 oz Au (indicated resource, 0.008 opt Au cut-off grade); 19,724,000 tons, 0.017 opt Au, 331,000 oz Au (inferred resource, 0.008 opt Au cut-off grade) 2014: 24,126,000 tons, 0.021 opt Au, 495,000 oz Au (measured and indicated resource); 35,416,000 tons, 0.017 opt Au, 596,000 oz Au (inferred resource)
_________________________________________________________________________________________________________
Green Springs 1988: 1,250,000 tons, 0.06 opt Au (resource); 1988-91: 63,000 oz Au, upper Joana (White Pine district) 500,000 tons, 0.039 opt Au, (additional resource) 1989-90: 9,000 oz Ag Limestone
_________________________________________________________________________________________________________

89
MAJOR PRECIOUS-METAL DEPOSITS, WHITE PINE COUNTY (continued) _________________________________________________________________________________________________________
Deposit name Reserves/resources Production Host rock Mineralization age
_________________________________________________________________________________________________________
Griffon Gold property 1993: geologic resource-60,000 oz Au 1998: 37,921 oz Au, Mississippian (White Pine district) 1994: geologic resource-50,454 oz Au, 269 oz Ag Chainman Shale 0.039 opt Au 1999: 24,740 oz Au 1995: proven and probable reserves- 2,737,000 tons, 0.025 opt Au 1997: 100,000 oz Au
_________________________________________________________________________________________________________
Horseshoe 1991: 1,500,000 tons, 0.039 opt Au Pilot Shale and 36-38 Ma (Bald Mountain intrusive quartz district) porphyry
_________________________________________________________________________________________________________
Illipah 1987: 57,000 oz Au 1987: ~25,000 oz Au/year Paleozoic Eocene? (Illipah district) 1988: 25,324 oz Au, sedimentary rocks mining ended 1989: 3,874 oz Au, heap-leached
_________________________________________________________________________________________________________
Limousine Butte 1987: 57,000 oz Au 1987: ~25,000 oz Au/year Paleozoic Eocene? (Butte Valley district) 2009 (0.012 opt Au cut-off grade): 1988: 25,324 oz Au, sedimentary rocks 10,600,000 tons, 0.023 opt Au mining ended (measured and indicated resources) 1989: 3,874 oz Au, 2,500,000 tons, 0.020 opt Au heap-leached (inferred resource)
_________________________________________________________________________________________________________
Little Bald Mtn. 1986: 1,000,000 tons, 0.10 opt Au 1985-88: 21,700 oz Au Antelope Valley 35-38 Ma (Bald Mountain 1989: 200,000 tons, 0.13 opt Au; 1989: 5,500 oz Au, Formation district) geologic resource-260,000 tons, 0.127 opt Au 1,500 oz Ag 1993: 140,000 tons, 0.13 opt Au, geologic resource-21,800 oz Au
_________________________________________________________________________________________________________
Mt. Hamilton 1988: 7,700,000 tons, 0.05 opt Au, 0.5 opt Ag 1995-97: 99,500 oz Au, Dunderberg Shale Cretaceous
(White Pine district) 1994: reserve-9,040,000 tons, 0.052 opt Au, 207,500 oz Ag 0.38 opt Ag 1996: 10,800,000 tons, 0.038 opt Au, 0.24 opt Ag 1997: 7,720,000 tons, 0.035 opt Au 2009: 12,617,000 tons, 0.031 opt Au, 0.144 opt Ag (measured and indicated resource); 1,491,000 tons, 0.012 opt Au, 0.122 opt Ag (inferred resource) 2011 (Centennial deposit): 22,527,000 tons, 0.022 opt Au, 487,100 oz Au, 0.134 opt Ag, 3,028,200 oz Ag (proven and probable reserves, 0.006 opt AuEq cut-off grade); 23,650,000 tons, 0.022 opt Au, 526,854 oz Au, 0.133 opt Ag, 3,152,624 oz Ag (measured and indicated resource, 0.006 opt AuEq cut-off grade); 3,454,000 tons, 0.018 opt Au, 60,859 oz Au, 0.079 opt Ag, 273,457 oz Ag (inferred resource, 0.006 opt AuEq cut-off grade) 2012 (Seligman deposit): 6,960,000 tons, 0.022 opt Au, 154,388 oz Au, 0.097 opt Ag, 676,665 oz Ag (indicated resource); 3,770,000 tons, 0.021 opt Au, 78,044 oz Au, 0.144 opt Ag, 543,671 oz Ag (inferred resource) 2013: 31,880,000 tons, 0.022 opt Au, 687,700 oz Au, 0.19 opt Ag, 6,187,900 oz Ag (measured and indicated resource, 0.006 opt Au cut-off grade); 10,330,000 tons, 0.017 opt Au, 178,800 oz Au, 0.16 opt Ag, 1,685,900 oz Ag (inferred resource, 0.006 opt Au cut-off grade)
_________________________________________________________________________________________________________
Pan 1989: 241,000 oz Au Mississippian rocks (Pancake district) 1998: 10,860,000 tons, 0.022 opt Au Drill-indicated and inferred 2003: 17,890,000 tons, 0.019 opt Au indicated resource; 7,986,000 tons, 0.016 opt Au inferred resource 2009 (0.006 opt au cut-off grade: 34,650,000 tons, 0.018 opt Au (measured and indicated resource) 1,600,000 tons, 0.017 opt Au (inferred resource)

90
MAJOR PRECIOUS-METAL DEPOSITS, WHITE PINE COUNTY (continued) _________________________________________________________________________________________________________
Deposit name Reserves/resources Production Host rock Mineralization age
_________________________________________________________________________________________________________
Pan (cont.) 2010 (0.004 opt au cut-off grade: 42,750,352 tons, 0.016 opt Au (measured and indicated resource); 1,600,000 tons, 0.017 opt Au (inferred resource) 2011: 53,253,000 tons, 0.016 opt gold, 864,220 oz Au (proven and probable reserves, 0.006 opt Au cut-off grade); 88,226,224 tons, 0.128 opt Au, 1,129,809 oz Au (measured and indicated resource, 0.004 opt Au cut-off grade); 4,330,080 tons, 0.105 opt Au, 45, 261 oz Au (inferred resource, 0.004 opt Au cut-off grade)
_________________________________________________________________________________________________________
Robinson 1989: 46,000,000 tons, 0.019 opt Au; 1986: 48,000 oz Au, Rib Hill Sandstone, Cretaceous (Robinson district) geologic resource-100,000 oz Au 96,000 oz Ag Riepe Spring 1991: geologic resource-20,000,000 tons 1987-88: 88,957 oz Au Limestone, 0.012 opt Au 1989-90: 153,828 oz Au, intrusions 1999: 194,000,000 tons, 0.59% Cu, 121,340 oz Ag 0.007opt Au, proven and probable reserves 1991: 21,674 oz Au 2003: 146.300,000 tons, 0.687% Cu, 1992: 35,581 oz Au, 0.008 opt Au, proven and probable reserves 55,000 oz Ag 2005: 160,400,000 tons, 0.69% Cu, 0.073 opt Au 1993: 13,432 oz Au (proven and probable reserves) 1996-98: 196,000 oz Au, 610,979,000 tons, 0.55% Cu, 0.0064 opt Au 783,500 oz Ag, (measured resource, 0.2% Cu cut-off) 370,000,000 lbs Cu 171,858,000 tons, 0.44% Cu, 0.0041 opt Au 1999: 26,250 oz Au, (indicated resource, 0.2% Cu cut-off) 153,104 oz Ag, 98,166,000 tons, 0.32% Cu, 0.0015 opt Au 6,200,000 lbs Cu (inferred resource, 0.2% Cu cut-off) 2004: 12,228 oz Au, 2006: 122,401,000 tons, 0.69% Cu, 0.0076 opt Au 27,000,000 lbs Cu (proven and probable reserves) 2005: 80,941 oz Au, 2007: 103,788,000 tons, 0.68% Cu, 0.0067 opt Au 191,479 oz Ag, (proven and probable reserves) 126,000,000 lbs Cu 2008: 121,693,000 tons, 0.54% Cu, 0.0067 opt Au 2006: 75,074 oz Au, (proven and probable reserves) 156,839 oz Ag, 2009: 103,059,000 tons, 0.53% Cu, 0.0062 opt Au 121,319,197 lbs Cu, (proven and probable reserves) 260,000 lbs Mo 2010: 121,250,000 tons, 0.50%Cu, 0.0053 opt Au 2007: 108,118 oz Au, (proven and probable reserves) 179,238 oz Ag, 716,490,000 tons, 0.33% Cu, 0.0044 opt Au 131,986,134 lbs Cu, (measured and indicated resource) 62,033 lbs Mo 154,320,000 tons, 0.29% Cu, 0.0041 opt Au 2008: 137,628 oz Au, (inferred resource) 183,903 oz Ag, 159,684,092 lbs Cu, 78,855 lbs Mo 2009: 99,000 oz Au, 200,819 oz Ag, 122,000,000 lbs Cu, 88,711 lbs Mo 2010: 72,998 oz Au, 245,746 oz Ag, 108,967,015 lbs Cu, 226,688 lbs Mo 2011: 31,969 oz Au, 116,774 oz Ag, 88,893,372 lbs Cu, 1,261,309 lbs Mo 2012: 30,948 oz Au, 225,421 oz Ag, 117,509,548 lbs Cu, 449,001 lbs Mo
2013: 47,452 oz Au, 161,638 oz Ag, 107,898,857 lbs Cu, 1,384,649 lbs Mo
________________________________________________________________________________________________________
Taylor 1980: 10,000,000 tons, 3 opt Ag 1981-1984: 3,800,000 oz Ag, Guilmette and Eocene or (Taylor district) 1988: 5,920,000 tons, 2.7 opt Ag (resource) 3,000 oz Au Joana Limestones, Oligocene 2007: 6,433,000 tons, 2.31 opt Ag rhyolite dikes (measured and indicated resource) 757,000 tons, 2.54 opt Ag (inferred resource) 2013: 8,894,000 tons, 1.89 opt Ag, 16,820,000 oz Ag (measured and indicated resource, 1 opt Ag cut-off grade); 1,716,000 tons, 2.3 opt Ag
91
MAJOR PRECIOUS-METAL DEPOSITS, WHITE PINE COUNTY (continued) _________________________________________________________________________________________________________
Deposit name Reserves/resources Production Host rock Mineralization age
_________________________________________________________________________________________________________
3,941,000 oz Ag (inferred resource,1 opt Ag cut-off grade)
_________________________________________________________________________________________________________
White Pine 1989: 63,000 oz Au, 0.04 opt Au 1989: 20,654 oz Au Pilot Shale Oligocene? (White Pine district)
_________________________________________________________________________________________________________
Yankee 1992: 683,000 oz Au 1990: ~15,000 oz Au Pilot Shale 36-38 Ma? (Bald Mountain 1993: see Bald Mountain 1992: 10,800 oz Au district)
_________________________________________________________________________________________________________
Newmont Gold and Silver Production in the Carlin Trend Production data for individual mines owned by Newmont Gold Co. in the Carlin trend are not available in many cases. Annual production of Newmont operations in the Carlin trend is as follows:
Year Gold (oz) Silver (oz) 1988 895,500 NA 1989 1,467,800 117,400 1990 1,676,000 NA 1991 1,575,700 NA 1992 1,588,000 98,000 1993 1,666,400 175,000 1994 1,554,000 158,000 1995 1,634,500 188,000 1996 1,700,000 322,000 1997 1,819,000 118,000 1998 1,575,391 150,400 1999 1,536,401 255,011 2000 1,865,648 108,111 2001 1,547,247 292,241 2002 1,378,782 277,753 2003 1,122,208 206,767 2004 1,287,674 363,052 2005 1,397,583 227,158 2006 1,310,258 169,212 2007 1,322,001 268,875 2008 1,320,019 149,254 2009 1,172,790 225,431 2010 934,282 69,430 2011 917,973 76,938 2012 987,959 192,333 2013 1,020,791 221,256 NA= not available

92
Other Metallic Deposits by David A. Davis and John L. Muntean
_________________________________________________________________________________________________________
This is a compilation, in progress, of metallic deposits other than gold and silver. Initially, active projects with recently released reserves, resources, and production were included and earlier published data are included as found. The information in this compilation was obtained from the Nevada Division of Minerals and from published reports, articles in mining newsletters, and company websites, annual reports, and press releases. Locations of active mines are shown on page 2, and contact information is listed in the Directory of Mining and Milling Operations. _________________________________________________________________________________________________________
Deposit name Metals Reserves/resources Production _________________________________________________________________________________________________________
CHURCHILL COUNTY _________________________________________________________________________________________________________
Buena Vista Fe 1945: 350,000 tons ore, 54% Fe 1943-1952: 563,000 (Mineral Basin district) 2013: 111,200,000 tons, 18.6% Fe tons ore >57% Fe 20,700,000 tons Fe (probable 1958: 150,000 tons reserve); 148,700,000 tons, 18.8% Fe >56% Fe (indicated resource, 3.1 tons/meter3); 61,000,000 tons, 19.9% Fe (inferred resource, Davis Tube Recovery Analysis, 3.06 tons/meter3) _________________________________________________________________________________________________________
CLARK COUNTY _________________________________________________________________________________________________________
Boulder City Mn 1949: 1,000,000 tons, 7.5% Mn or (Las Vegas district) 15,000,000 tons, 3% Mn (resource) _________________________________________________________________________________________________________
DOUGLAS COUNTY _________________________________________________________________________________________________________
Buckskin Cu, Au 1973: 678,400 tons, averaging 0.15 opt Au, 1918-50 intermittent: est (Buckskin district) 0.45 opt Ag, 1.3% Cu 10,000 tons Au, Cu ore
1978: 561,500 tons, 0.18 opt Au, 0.5 opt Ag, 1.3% Cu
_________________________________________________________________________________________________________
Pine Nut Mo 2007: 82,000,000 tones, 0.06% Mo (Gardnerville district)
_________________________________________________________________________________________________________
ELKO COUNTY _________________________________________________________________________________________________________
Carlin Vanadium V 2010: 28,000,000 tones, 0.515% V2O5 (Carlin district) (inferred resource) _________________________________________________________________________________________________________
Contact Cu 2009: 33,578,000 tons, 0.293% Cu (proven (Contact district) and probable reserve); 89,551,000 tons, 0.268% Cu (measured and indicated resource); 50,520,000 tons, 0.302% Cu (inferred resource) 2012: 215,710,000,000 tons, 0.25% Cu 1,058,998,000 lbs. Cu (measured and indicated resource, 0.1% Cu cut-off grade); 70,921,000,000 tons, 0.24% Cu, 340,421,000,000 lbs. Cu (inferred resource, 0.1% Cu cut-off grade) 2013: 141,094,000 tons, 0.22% Cu 611,748,000 lbs. Cu (proven and probable reserve, 0.07% Cu cut-off grade); 3,340,000 tons, 0.18%, 11,905,000 lbs. Cu (inferred resource, 0.07% Cu cut-off grade)
_________________________________________________________________________________________________________
Hot Spot No. 1 U 1956: 13,200 tons, 0.137% U3O8 (Mountain City district) in eight small deposits (indicated ore)
_________________________________________________________________________________________________________
93
OTHER METALLIC DEPOSITS, ELKO COUNTY (continued) _________________________________________________________________________________________________________
Deposit name Metals Reserves/resources Production _________________________________________________________________________________________________________
Indian Springs W 2007: 10,800,000 tons, 0.171% WO3 (Delano district) (indicated resource); 8.200,000 tons, 0.167% WO3 (inferred resource)
_________________________________________________________________________________________________________
Montrose W 1952: 1,050 tons, 0.25% WO3 (Alder district) (inferred resource)
_________________________________________________________________________________________________________
Rio Tinto Cu 1976 Footwall deposit: 600,000 tons, 1931-1947: 1,109,878 tons, (Mountain City District) 1% copper (one-third mined) 9.7% Cu, 0.3 opt Ag, 0.006
_________________________________________________________________________________________________________
Spruce Mountain Cu, Mo 1984 two areas: 105,000,000 tons and (Spruce Mountain 80,000,000 tons (low grade porphyry district) Cu-Mo resource)
_________________________________________________________________________________________________________
Victoria Cu, Ag 1973: 3,500,000 tons, 2.45% Cu (reserves) 1975-1977: 6,000 tons Cu (Dolly Varden district) 1976 underground: 2,068,650 tons, 3% 1980-1981: 124,575 tons, Cu (proven and probable reserves) 1.56% Cu, 0.32 opt Ag 1981: 1,375,425 tons, 2.15% Cu, 0.35 opt Ag (proven and probable reserves)
_________________________________________________________________________________________________________
ESMERALDA COUNTY _________________________________________________________________________________________________________
Deposit name Metals Reserves/resources Production _________________________________________________________________________________________________________
Black Horse W, Mo 1982: 300,000 tons, 0.05% WO3, 1940-1978 (Intermittant): (Black Horse district) 0.08% Mo 6,000 units WO3
_________________________________________________________________________________________________________
Cucomungo Mo 2006 Basalt Cap Zone: 30,000,000 tons, (Tule Canyon district) 0.11% MoS2 (0.066% Mo, drill-indicated resource); Roper Tunnel Zone: 9,000,000 tons 0.125% to 0.25% MoS2 (0.075% to 0.15% Mo, possible resource)
_________________________________________________________________________________________________________
EUREKA COUNTY _________________________________________________________________________________________________________
Gibellini V 2011: 19,970,000 tons 0.30% V2O5 (Gibellini district) (proven and probable reserves, Gibellini Hill, part of the measured and indicated resource); 23,050,000 tons, 0.29% V2O5 (measured and indicated resource, Gibellini Hill); 14,230,000 tons, 0.17% V2O5 (inferred resource, reduced material)
_________________________________________________________________________________________________________
Mount Hope Mo 2007: 965,926,000 tons 0.068% Mo (proven and (Mount Hope district) probable reserves); 109,641,000 tons, 0.030% Mo (measured and indicated resource); 191,308,000 tons, 0.063% Mo (inferred resource) 2014: 984,602,000 tons 0.07% Sulfide Mo (proven and probable reserves, 0.034% Mo cutoff grade); 65,243,000 tons, 0.033% Sulfide Mo (measured and indicated resource, 0.025% to 0.034% Mo cutoff grade); 111,261,000 tons, 0.056% Sulfide Mo (inferred resource, 0.025% Mo cutoff grade)
_________________________________________________________________________________________________________
94
HUMBOLDT COUNTY _________________________________________________________________________________________________________
Ashdown Mo 1983: 10,000 tons molybdenite on dump 2006: 10,500 lbs Mo (Vicksburg district) 2006 (Sylvia Vein): 21,550 tons, 8% Mo 2007: 247,466 lbs Mo 2008: 202,597 lbs Mo 2009: 214,714 lbs Mo 2010: 189,035 lbs Mo 2011: 648,853 lbs Mo 2012: 44,092 lbs Mo
_________________________________________________________________________________________________________
Cordero Ga 2007: 1000,000 tons, 47.7 ppm Ga (Opalite district) (measured and indicated resource);
6.600,000 tons, 43.7 ppm Ga (inferred resource)
_________________________________________________________________________________________________________
Kings Valley U 2006: 2,978,000 tons, 0.081% U3O8 (Disaster district) (inferred resource)
_________________________________________________________________________________________________________
McDermitt Hg 1982: 1,325,000 tons, 10 lbs per ton Hg 1974-1990: N/A (Opalite district) (measured reserve)
_________________________________________________________________________________________________________
Uranium Lode Star U 1984: 15 to 20,000,000 tons (Virgin Valley district) low grade uranium-bearing material (“submarginal” resource)
_________________________________________________________________________________________________________
LANDER COUNTY _________________________________________________________________________________________________________
Apex U 2006: 1,119,928 tons, 0.07% U3O8 1954-1960, 1963-1966: (Reese River district) (inferred resource) 106,000 lbs. U3O8
_________________________________________________________________________________________________________
Black Eagle Mn 1942: 49,000 tons, 12.27% Mn (assured); (Jersey district) 70,000 tons, 11.96% Mn (assured and probable); 83,500 tons, 11.68% Mn (assured, probable, and possible)
_________________________________________________________________________________________________________
Black Rock Mn 1942: 16,650 tons, 15.1% Mn (assured); 1942-1947: 11,150 tons, 13.5-39.9% Mn (Buffalo Valley district) 30,000 tons, 14.1% Mn (assured and probable); 1950-1953: 10,126 tons ore
42,600 tons, 12.7% Mn (assured, probable, and possible)
_________________________________________________________________________________________________________
Buckingham Mo 1984: 1.1 billion tons, 0.06% MoS2 (Battle Mountain district) (resource)
_________________________________________________________________________________________________________
Phoenix Cu 2007: 279,600,000 tons, 0.13% Cu 2006: 6,235,096 lbs Cu (Battle Mountain district) (proven and probable reserves); 2007: 10,808,206 lbs Cu 91,300,000 tons, 0.16% Cu 2008: 15,853,706 lbs Cu (measured and indicated resource); 2009: 23,733,389 lbs Cu 23,900,000 tons, 0.16% Cu 2010: 19,008,818 lbs Cu (inferred resource) 2011: 23,897,865 lbs Cu 2008: 302,000,000 tons, 0.15% Cu 2012: 27,809,189 lbs Cu (proven and probable reserves); 2013: 29,815,908 oz Cu 91,700,000 tons, 0.20% Cu (See Major Precious Metal Deposits also.) (measured and indicated resource); 95,953,000 tons, 0.23% Cu (inferred resource) 2009: 287,500,000 tons, 0.16% Cu (proven and probable reserves); 199,687,000 tons, 0.18% Cu (measured and indicated resource); 91,815,000 tons, 0.23% Cu (inferred resource) 2010 (non-leach): 332,600,000 tons, 0.15% Cu (probable reserve, 61% recovery) 150,900,000 tons, 0.13% Cu (indicated resource); 56,600,000 tons, 0.12% Cu (inferred resource) 2010 (leach): 132,900,000 tons, 0.23% Cu (probable reserve, 53% recovery) 25,900,000 tons, 0.19% Cu (indicated resource);

95
OTHER METALLIC DEPOSITS, LANDER COUNTY (continued) _________________________________________________________________________________________________________
Deposit name Metals Reserves/resources Production _________________________________________________________________________________________________________
Phoenix (cont.) 45,900,000 tons, 0.22% Cu (inferred resource) 2011 (non-leach): 450,300,000 tons, 0.15% Cu, 1,300,000,000 lbs. Cu (proven and probable reserve, 61% recovery); 216,400,000 tons, 0.09% Cu (indicated resource); 132,300,000 tons, 0.1% Cu (inferred resource) 2011 (leach): 170,200,000 tons, 0.21% Cu, 690,000,000 Cu, (proven and probable reserve, 52% recovery); 14,100,000 tons, 0.2% Cu (indicated resource); 54,100,000 tons, 0.2% Cu (inferred resource) 2012 (non-leach): 443,200,000 tons, 0.15% Cu, 1,290,000,000 lbs Cu, (proven and probable reserve, 61% recovery); 198,100,000 tons, 0.08% Cu, 310,000,000 lbs Cu (measured and indicated resource); 119,600,000 tons, 0.1% Cu, 230,000,000 lbs Cu (inferred resource); (leach): 177,100,000 tons, 0.24% Cu, 850,000,000 lbs Cu, (probable reserve, 58% recovery); 22,300,000 tons, 0.25% Cu 120,000,000 lbs Cu (measured and indicated resource); 16,900,000 tons, 0.2% Cu, 70,000,000 lbs Cu (inferred resource) 2013 (mill): 339,100,000 tons, 0.14% Cu, 940,000,000 lbs Cu, (proven and probable reserve, 62% recovery); (leach): 160,800,000 tons, 0.22% Cu, 710,000,000 lbs Cu, (probable reserve, 57% recovery); (total): 220,500,000 tons, 0.14% Cu (mineralized material) [NI43-101 compliant]
_________________________________________________________________________________________________________
LINCOLN COUNTY _________________________________________________________________________________________________________
Andies Mine Hg 1964: 64,000 tons, 2.13 lbs. per ton (Tem Piute district) (indicated)
_________________________________________________________________________________________________________
Pan American Pb, Zn 1982: 2,196,000 tons, 1.17% Pb, 2.45% Zn, 1947-1978: N/A (Comet district) (proven reserve)
_________________________________________________________________________________________________________
LYON COUNTY _________________________________________________________________________________________________________
Deposit name Metals Reserves/resources Production _________________________________________________________________________________________________________
Ann Mason Cu 2010: 1,409,960,000 tons, 0.336% Cu, (Yerington district) (inferred resource, (0.2% Cu cut-off grade) 315,220,000 tons, 0.485% Cu, (inferred resource, 0.4% Cu cut-off grade) Cu, Mo 2012: 1,253,000,000 tons, 0.33% Cu, 8,150,000,000 lbs. Cu, 0.006% Mo, 150,000,000 lbs. Mo; 0.0006 opt Au, 0.017 opt Ag (indicated resource, 0.2% Cu cut-off grade); 962,000,000 tons, 0.29% Cu, 5,590,000,000 lbs. Cu, 0.004% Mo, 80,000,000 lbs. Mo; 0.0009 opt Au, 0.019 opt Ag (inferred resource, 0.2% Cu cut-off grade)
_________________________________________________________________________________________________________
Blue Hill Cu, Mo 2012: Oxide Zone: 52,290,000 tons, 0.17% (Yerington district) Cu, 179,370,000 lbs. Cu; Mixed Zone: 27,220,000 tons, 0.18% Cu, 98,120,000 lbs. Cu (inferred resource, 0.1% Cu cut-off grade); Sulfide Zone: 54,960,000 tons, 0.23% Cu, 253,460,000 lbs. Cu, 0.005% Mo, 0.0003 opt Au, 0.009 opt Ag (inferred resource, 0.15% Cu cut-off grade)
_________________________________________________________________________________________________________

96
OTHER METALLIC DEPOSITS, LYON COUNTY (continued) _________________________________________________________________________________________________________
Deposit name Metals Reserves/resources Production _________________________________________________________________________________________________________
MacArthur Cu 2008: 57,365,000 tons, 0.239% Cu, (Yerington district) (measured and indicated resource, oxide and chalcocite material) 75,832,000 tons, 0.283% Cu, (inferred resource, oxide and chalcocite material) 2010: 143,721,000 tons, 0.192% Cu (measured and indicated resource, oxide and chalcocite material, 0.12% Cu cut-off grade) 215,043,000 tons, 0.197% Cu (inferred resource, oxide and chalcocite material, 0.12% Cu cut-off grade) 74,090,000 tons, 0.256% Cu (inferred resource, primary sulfide material, 0.15% Cu cut-off grade) 2011: 159,094,000 tons, 0.212% Cu, 675,513,000 lbs. Cu (measured and indicated resource, oxide and chalcocite material, 0.12% Cu cut-off grade) 243,417,000 tons, 0.201% Cu, 979,510,000 lbs. Cu (inferred resource, oxide and chalcocite material, 0.12% Cu cut-off grade) 1,098,000 tons, 0.292% Cu, 6,408,000 lbs. Cu (measured and indicated resource, primary sulfide material, 0.15% Cu cut-off grade) 134,900,000 tons, 0.283% Cu 764,074,000 lbs. Cu (inferred resource, primary sulfide material, 0.15% Cu cut-off grade)
_________________________________________________________________________________________________________
Pumpkin Hollow Cu, Fe, 2007: 342,735,000 tons, 0.579% Cu, 0.0019 opt Au, (Yerington district) 0.0700 opt Ag, 15.67% Fe (measured and indicated resource); 438,164,000 tons, 0.446% Cu, 0.0015 opt Au, 0.0700 opt Ag, 10.23% Fe (inferred resource) Cu 2009 (0.2% Cu cut-off grade): 488,228,000 tons, 0.58% Cu, 0.002 opt Au, 0.069 opt Ag (measured and indicated resource); 440,826,000 tons, 0.42% Cu, 0.001 opt Au, 0.048 opt Ag (inferred resource) Fe 2009 (10% Fe cut-off grade): 306,420,000 tons, 30.04% Fe (measured and indicated resource); 440,138,000 tons, 20.67% Fe (inferred resource) Cu 2010: 531,042,000 tons, 0.55% Cu, 0.003 opt Au, 0.079 opt Ag (total measured and indicated resource, 0.2% Cu cut-off grade) 495,129,000 tons, 0.37% Cu, 0.001 opt Au, 0.044 opt Ag (total inferred resource, 0.2% Cu cut-off grade) 33,544,000 tons, 1.74% Cu, 0.010 opt Au, 0.244 opt Ag (measured and indicated resource, eastern underground deposits, 1% Cu cut-off grade) 249,155,000 tons, 0.6% copper, 0.002 opt gold, 0.067opt Ag (measured and indicated resource, western open pittable deposits, 0.3% Cu cut-off grade) Fe 2010: 340,898,000 tons, 32.59% Fe (measured
and indicated resource, western open pittable deposits, 20% Fe cut-off grade); 29,769,000 tons, 25.6% Fe (inferred resource, western open pittable deposits, 20% Fe cut-off grade)
Cu, Au, 2011 Western open pit deposits: 560,599,000 tons, Ag 0.39% Cu, 4,311,274,000 lbs. Cu, 0.002 opt Au, 1,061,000 oz Au, 0.053 opt Ag, 29,689,000 oz Ag (measured and indicated resource, 0.15% Cu cut-off grade) 387,757,000 tons, 0.3% Cu, 12,288,414,000 lbs. Cu, 0.001opt Au, 385,000 oz
Au, 0.039 opt Ag, 14,960,000 oz Ag (inferred resource,0.15% Cu cut-off grade) Eastern underground deposits: 50,589,000 tons, 1.45% Cu, 1,459,824,000 lbs. Cu, 0.009 opt Au, 449,000 oz Au, 0.213 opt Ag, 10,817,000 oz Ag (measured and indicated resource, 0.75% Cu cut-off grade) 12,098,000 tons, 1.11% Cu, 267,533,000 lbs. Cu, 0.002 opt Au, 24,000 oz Au 0.065 opt Ag, 792,000 oz Ag (inferred resource, 0.75% Cu cut-off grade) Fe 2011: Western open pit deposits: 340,898,000 tons, 32.59% Fe, 71,162,000 tons Fe (measured and indicated resource, western, 20% Fe cut-off grade)
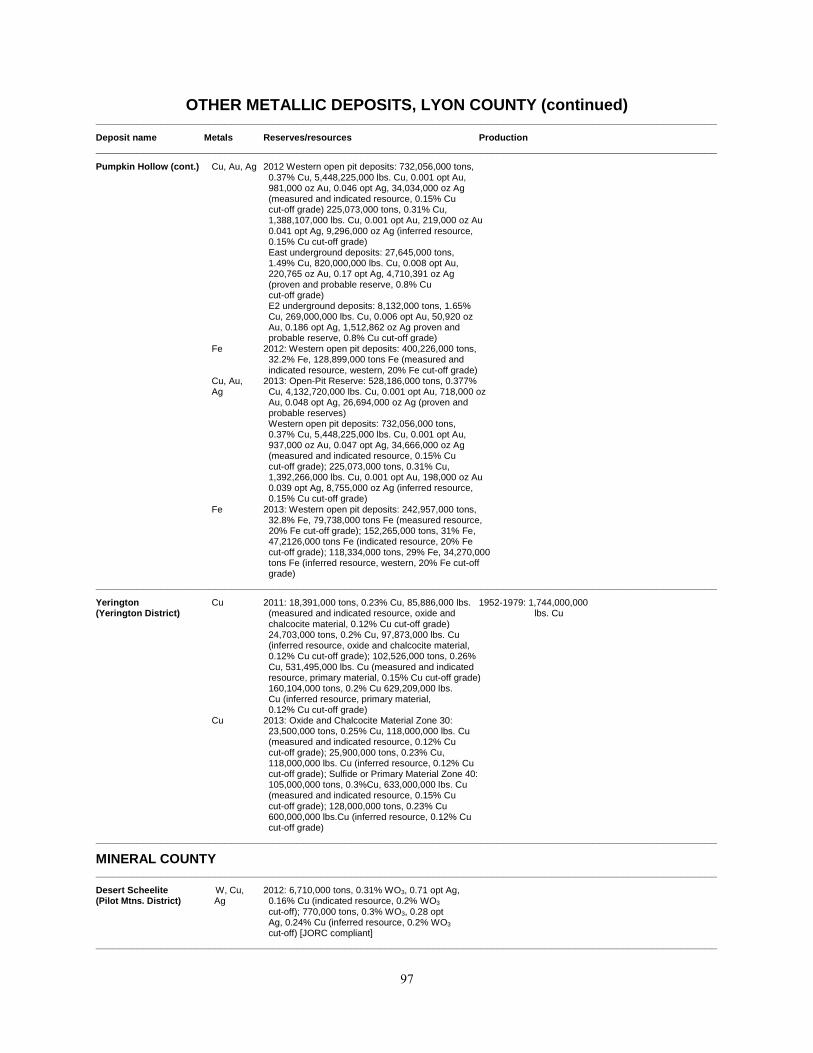
97
OTHER METALLIC DEPOSITS, LYON COUNTY (continued) _________________________________________________________________________________________________________
Deposit name Metals Reserves/resources Production _________________________________________________________________________________________________________
Pumpkin Hollow (cont.) Cu, Au, Ag 2012 Western open pit deposits: 732,056,000 tons, 0.37% Cu, 5,448,225,000 lbs. Cu, 0.001 opt Au, 981,000 oz Au, 0.046 opt Ag, 34,034,000 oz Ag (measured and indicated resource, 0.15% Cu cut-off grade) 225,073,000 tons, 0.31% Cu, 1,388,107,000 lbs. Cu, 0.001 opt Au, 219,000 oz Au 0.041 opt Ag, 9,296,000 oz Ag (inferred resource, 0.15% Cu cut-off grade) East underground deposits: 27,645,000 tons, 1.49% Cu, 820,000,000 lbs. Cu, 0.008 opt Au, 220,765 oz Au, 0.17 opt Ag, 4,710,391 oz Ag (proven and probable reserve, 0.8% Cu cut-off grade) E2 underground deposits: 8,132,000 tons, 1.65% Cu, 269,000,000 lbs. Cu, 0.006 opt Au, 50,920 oz Au, 0.186 opt Ag, 1,512,862 oz Ag proven and probable reserve, 0.8% Cu cut-off grade) Fe 2012: Western open pit deposits: 400,226,000 tons, 32.2% Fe, 128,899,000 tons Fe (measured and indicated resource, western, 20% Fe cut-off grade) Cu, Au, 2013: Open-Pit Reserve: 528,186,000 tons, 0.377% Ag Cu, 4,132,720,000 lbs. Cu, 0.001 opt Au, 718,000 oz Au, 0.048 opt Ag, 26,694,000 oz Ag (proven and probable reserves) Western open pit deposits: 732,056,000 tons, 0.37% Cu, 5,448,225,000 lbs. Cu, 0.001 opt Au, 937,000 oz Au, 0.047 opt Ag, 34,666,000 oz Ag (measured and indicated resource, 0.15% Cu cut-off grade); 225,073,000 tons, 0.31% Cu, 1,392,266,000 lbs. Cu, 0.001 opt Au, 198,000 oz Au 0.039 opt Ag, 8,755,000 oz Ag (inferred resource, 0.15% Cu cut-off grade) Fe 2013: Western open pit deposits: 242,957,000 tons, 32.8% Fe, 79,738,000 tons Fe (measured resource, 20% Fe cut-off grade); 152,265,000 tons, 31% Fe, 47,2126,000 tons Fe (indicated resource, 20% Fe cut-off grade); 118,334,000 tons, 29% Fe, 34,270,000 tons Fe (inferred resource, western, 20% Fe cut-off grade) _________________________________________________________________________________________________________
Yerington Cu 2011: 18,391,000 tons, 0.23% Cu, 85,886,000 lbs. 1952-1979: 1,744,000,000 (Yerington District) (measured and indicated resource, oxide and lbs. Cu chalcocite material, 0.12% Cu cut-off grade) 24,703,000 tons, 0.2% Cu, 97,873,000 lbs. Cu (inferred resource, oxide and chalcocite material, 0.12% Cu cut-off grade); 102,526,000 tons, 0.26% Cu, 531,495,000 lbs. Cu (measured and indicated resource, primary material, 0.15% Cu cut-off grade) 160,104,000 tons, 0.2% Cu 629,209,000 lbs. Cu (inferred resource, primary material, 0.12% Cu cut-off grade) Cu 2013: Oxide and Chalcocite Material Zone 30: 23,500,000 tons, 0.25% Cu, 118,000,000 lbs. Cu (measured and indicated resource, 0.12% Cu cut-off grade); 25,900,000 tons, 0.23% Cu, 118,000,000 lbs. Cu (inferred resource, 0.12% Cu cut-off grade); Sulfide or Primary Material Zone 40: 105,000,000 tons, 0.3%Cu, 633,000,000 lbs. Cu (measured and indicated resource, 0.15% Cu
cut-off grade); 128,000,000 tons, 0.23% Cu 600,000,000 lbs.Cu (inferred resource, 0.12% Cu cut-off grade)
_________________________________________________________________________________________________________
MINERAL COUNTY _________________________________________________________________________________________________________
Desert Scheelite W, Cu, 2012: 6,710,000 tons, 0.31% WO3, 0.71 opt Ag, (Pilot Mtns. District) Ag 0.16% Cu (indicated resource, 0.2% WO3
cut-off); 770,000 tons, 0.3% WO3, 0.28 opt Ag, 0.24% Cu (inferred resource, 0.2% WO3
cut-off) [JORC compliant]
_________________________________________________________________________________________________________

98
OTHER METALLIC DEPOSITS, MINERAL COUNTY (continued) _________________________________________________________________________________________________________
Deposit name Metals Reserves/resources Production _________________________________________________________________________________________________________
Dunlap Cu 1941: 175,000 tons, low grade ore (Pilot Mtns. District)
_________________________________________________________________________________________________________
New York Canyon Cu 2010: 26,250,000 tons, 0.43% Cu (indicated (Santa Fe District) resource, 0.2% Cu cut-off grade), 2,900.000 tons, 0.31% Cu (inferred resource, 0.2% Cu cut-off grade)
_________________________________________________________________________________________________________
Pine Tree Mo, Cu, 2011: 240,840,000 tons, 0.04% MoS2, 173.3 (Pilot Mtns. District) Ag 00,000 lbs. MoS2, 0.09% Cu, 428.700,000
lbs. Cu, 0.044 opt Ag, 10.6800,000 oz Ag (indicated resource, 0.01% MoS2 cut-off grade) 196,760,000 tons, 0.3% MoS2, 106.200,000 lbs. MoS2, 0.09% Cu, 324.400,000 lbs. Cu, 0.039 opt Ag, 7.7800,000 oz Ag (inferred resource, 0.01% MoS2 cut-off grade)
_________________________________________________________________________________________________________
NYE COUNTY _________________________________________________________________________________________________________
B and C Springs Mo, Cu 1983: 131,000,000 tons, 0.12% Mo (Paradise Peak district) 2007 Open pit: 105,902,046 tons, 0.048% Mo, 101,126,000 lbs. Mo., 0.068% Cu, 144,282,000 lbs Cu (indicated resource, $10 cut-off grade at $25/lb. Mo); Underground: 2,846,524 tons, 0.234% Mo, 0.334% Cu (indicated resource, $75 cut-off grade at $25/lb. Mo)
_________________________________________________________________________________________________________
Bisoni McKay V 2008: Area A North: 8,073,844 tons, 0.43% V2O5 (Gibellini District) (indicated resource, 0.3% V2O5 cut-off grade); Area A North: 4,744,214 tons, 0.48% V2O5 (inferred resource, 0.3% V2O5 cut-off grade); Area A South: 5,490,356 tons, 0.48% V2O5 (inferred resource, 0.3% V2O5 cut-off grade)
_________________________________________________________________________________________________________
Liberty Mo 2007 (April 2008): 432,951,000 tons, 0.071% 1982-1991: 50,000,000 tons, (formerly known as Mo, 0.07% Cu (proven and probable reserves); 0.11% Mo Hall-Tonopah) 109,336,000 tons, 0.052% Mo, 0.11% Cu (San Antone district) (measured and indicated resource); 127,200,000 tons, 0.051% Mo, 0.08% Cu (inferred resource) Mo, Cu 2011: 541,420,000 tons, 0.068% Mo, 0.08% Cu (proven and probable reserves, 0.02% Mo cut-off grade) 105,194,000 tons, 0.052% Mo, 0.05% Cu (measured and indicated resource, 0.02% Mo cut-off grade) 252,647,000 tons, 0.04% Mo, 0.13% Cu (inferred resource, 0.02% Mo cut-off grade)
_________________________________________________________________________________________________________
Tonopah Cu 1999: 98,000,000 tons, 0.343% Cu 1999-2001: N/A (San Antone district) (proven reserve); 137,800,000 tons, 0.314% Cu (resource)
_________________________________________________________________________________________________________
PERSHING COUNTY _________________________________________________________________________________________________________
Black Diablo Mn 1942: 75,000 tons, 30% Mn; 75,000 tons, 5-8% Mn 1929-1954: 5,497 long tons, (Black Diablo district) 36.3% Mn; 54,485 long
tons, 28.5% Mn
_________________________________________________________________________________________________________
Fencemaker Sb 1981: 100,000 tons (probable reserve) 1880s: 1 ton Sb metal (Table Mountain district) 400,000 tons (possible reserve) 1940: 2 tons ore, 50% Sb
2012: 34,125 tons, 2.92% Sb 1966-1981: N/A (inferred resource) 2013-2014: 500 tons ore
_________________________________________________________________________________________________________
Gold Banks Hg 1965: 71,000 tons, 5.87 lbs. per ton (probable); (Goldbanks district) 24,000 tons, 8.07 lbs. per ton (possible)
_________________________________________________________________________________________________________
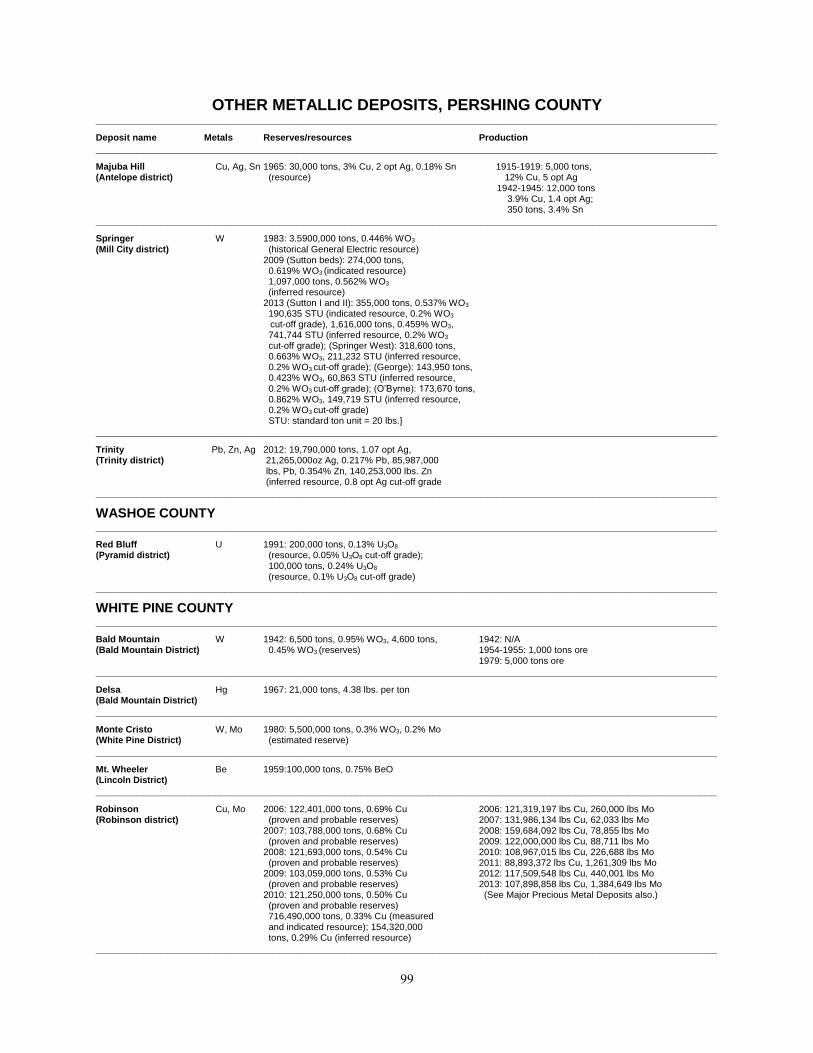
99
OTHER METALLIC DEPOSITS, PERSHING COUNTY _________________________________________________________________________________________________________
Deposit name Metals Reserves/resources Production _________________________________________________________________________________________________________
Majuba Hill Cu, Ag, Sn 1965: 30,000 tons, 3% Cu, 2 opt Ag, 0.18% Sn 1915-1919: 5,000 tons, (Antelope district) (resource) 12% Cu, 5 opt Ag 1942-1945: 12,000 tons 3.9% Cu, 1.4 opt Ag; 350 tons, 3.4% Sn
_________________________________________________________________________________________________________
Springer W 1983: 3.5900,000 tons, 0.446% WO3 (Mill City district) (historical General Electric resource) 2009 (Sutton beds): 274,000 tons,
0.619% WO3 (indicated resource) 1,097,000 tons, 0.562% WO3 (inferred resource)
2013 (Sutton I and II): 355,000 tons, 0.537% WO3 190,635 STU (indicated resource, 0.2% WO3
cut-off grade), 1,616,000 tons, 0.459% WO3, 741,744 STU (inferred resource, 0.2% WO3
cut-off grade); (Springer West): 318,600 tons, 0.663% WO3, 211,232 STU (inferred resource, 0.2% WO3 cut-off grade); (George): 143,950 tons, 0.423% WO3, 60,863 STU (inferred resource, 0.2% WO3 cut-off grade); (O’Byrne): 173,670 tons, 0.862% WO3, 149,719 STU (inferred resource, 0.2% WO3 cut-off grade) STU: standard ton unit = 20 lbs.]
_________________________________________________________________________________________________________
Trinity Pb, Zn, Ag 2012: 19,790,000 tons, 1.07 opt Ag, (Trinity district) 21,265,000oz Ag, 0.217% Pb, 85,987,000 lbs, Pb, 0.354% Zn, 140,253,000 lbs. Zn (inferred resource, 0.8 opt Ag cut-off grade
_________________________________________________________________________________________________________
WASHOE COUNTY _________________________________________________________________________________________________________
Red Bluff U 1991: 200,000 tons, 0.13% U3O8 (Pyramid district) (resource, 0.05% U3O8 cut-off grade);
100,000 tons, 0.24% U3O8 (resource, 0.1% U3O8 cut-off grade)
_________________________________________________________________________________________________________
WHITE PINE COUNTY _________________________________________________________________________________________________________
Bald Mountain W 1942: 6,500 tons, 0.95% WO3, 4,600 tons, 1942: N/A (Bald Mountain District) 0.45% WO3 (reserves) 1954-1955: 1,000 tons ore 1979: 5,000 tons ore
_________________________________________________________________________________________________________
Delsa Hg 1967: 21,000 tons, 4.38 lbs. per ton (Bald Mountain District)
_________________________________________________________________________________________________________
Monte Cristo W, Mo 1980: 5,500,000 tons, 0.3% WO3, 0.2% Mo (White Pine District) (estimated reserve)
_________________________________________________________________________________________________________
Mt. Wheeler Be 1959:100,000 tons, 0.75% BeO (Lincoln District)
_________________________________________________________________________________________________________
Robinson Cu, Mo 2006: 122,401,000 tons, 0.69% Cu 2006: 121,319,197 lbs Cu, 260,000 lbs Mo (Robinson district) (proven and probable reserves) 2007: 131,986,134 lbs Cu, 62,033 lbs Mo 2007: 103,788,000 tons, 0.68% Cu 2008: 159,684,092 lbs Cu, 78,855 lbs Mo (proven and probable reserves) 2009: 122,000,000 lbs Cu, 88,711 lbs Mo 2008: 121,693,000 tons, 0.54% Cu 2010: 108,967,015 lbs Cu, 226,688 lbs Mo (proven and probable reserves) 2011: 88,893,372 lbs Cu, 1,261,309 lbs Mo 2009: 103,059,000 tons, 0.53% Cu 2012: 117,509,548 lbs Cu, 440,001 lbs Mo (proven and probable reserves) 2013: 107,898,858 lbs Cu, 1,384,649 lbs Mo 2010: 121,250,000 tons, 0.50% Cu (See Major Precious Metal Deposits also.) (proven and probable reserves) 716,490,000 tons, 0.33% Cu (measured and indicated resource); 154,320,000 tons, 0.29% Cu (inferred resource) _________________________________________________________________________________________________________

100
Industrial Minerals by David A. Davis
The total value of industrial minerals produced in Nevada in 2013 was estimated to be $420,000,000, an increase of 7% from 2012. Minus the value of aggregate, the total value was $270,000,000, an increase of 18%. In decreasing order of estimated value, Nevada industrial minerals with production values of more than $10,000,000 were aggregate, barite, diatomite, lime and limestone, gypsum, dimension stone/landscape rock, lithium, and silica, and dimension stone. Industrial mineral commodities with production values of less than $10,000,000 were clay, magnesia, perlite, dolomite, cement, iron oxide, salt, and opal. Zeolite was processed in Nevada but mined in California, and as such was not included in the estimate of total industrial mineral value reported above. Data used for these estimates, and data reported for individual commodities below, were obtained from the Nevada Division of Minerals (NDOM), the Nevada Department of Taxation, the U.S. Bureau of Land Management (BLM), the U.S. Geological Survey (USGS) or directly from companies that produced the commodities. Data are given in short tons unless otherwise noted. USGS data cited are from commodity reports on the agency’s website at www.minerals.usgs.gov/minerals/pubs/commodity.
Aggregate (Sand and Gravel, Crushed Stone)
According to the USGS, domestic production of construction sand and gravel increased 4% in to an estimated 934,000,000 tons valued at $6,700,000,000, and crushed stone was about the same as 2012, an estimated 1,300,000,000 tons valued at $11,800,000,000. The average domestic price of construction sand and gravel increased less than 1% to $7.08 per ton in 2013. The average price of crushed stone increased slightly to $8.85 per ton in 2013.
According to the USGS, Nevada produced an estimated 10,814,000 tons of construction sand and gravel valued at $69,400,000, and an estimated 8,752,000 tons of crushed stone valued at $80,700,000. This represents decreases of 20% in the production and 18% in value of construction sand and gravel compared to 2012, while the production and value of crushed stone increased 15% and 14%, respectively. The total production value of $150,100,000 makes construction aggregate the fifth most valuable commodity produced in the state.
An estimated 10,000,000 tons of construction aggregate was produced in the Las Vegas area with sand and gravel operations accounting for about 64% of the aggregate production. The Lone Mountain area in northwest Las Vegas remained the most important source, producing about a third of the sand and gravel in the Las Vegas area. Significant production also came from sand and gravel pits and stone quarries south and northeast of Las Vegas and in Ivanpah Valley southwest of Las Vegas. Portable crushers
at construction sites were also important producers of base aggregate in Las Vegas.
The major producers in the Las Vegas area were Aggregate Industries, Las Vegas Paving Corp., Impact Sand and Gravel, Nevada Ready Mix Corp., Wells Cargo, and Boulder Sand and Gravel. Las Vegas Paving, a major producer of asphalt concrete, produced sand and gravel from their Blue Diamond, Lone Mountain, and Primm pits. The company also produced crushed stone from the Apex landfill about 10 miles northeast of Las Vegas. Nevada Ready Mix, a subsidiary of the Mitsubishi Corporation, mined most of its aggregate from a series of pits in alluvium in the Lone Mountain area, with minor production coming from quarries in adjacent bedrock. Aggregate Industries, through their subsidiary Frehner Inc., mined and crushed limestone from its Sloan property a few miles south of Las Vegas. Community pits and other aggregate mining facilities administered by the BLM and operated by a number of companies, annually account for between 10% and 20% of the total production of the Las Vegas and adjacent southern Nevada area.
Annual production at the Lone Mountain area peaked at more than 10,000,000 tons in 2005 and 2006, but have since significantly declined since the downturn in construction. Lately, however, increased sales and interest is resulting in the BLM considering issuing new contracts through competitive bidding. Six contracts with the BLM for material from the Lone Mountain area are due to expire in August 2014, and companies have been requesting information.
The Cind-R-Lite Block Company shipped lightweight aggregate to the Las Vegas market from their cinder operation in a Quaternary basaltic cinder cone near Amargosa Valley in Nye County. Most of the material shipped was minus 3/8-inch aggregate for the manufacture of cinder blocks and pavers. Cind-R-Lite has two manufacturing sites in the Las Vegas Valley and one in the Amargosa Valley.
In 2006, Service Rock Products Corporation of California submitted an application to the BLM to build and operate an aggregate pit called the Sloan Aggregate mine in N/2, section 32, T23S, R61E. In 2007, CEMEX submitted an application to build and operate an aggregate pit called the Mohave Minerals project in S/2, section 29, T23S, R61E. The mining from the two pits, expected to eventually grow into one large 2,500-foot deep pit covering about 640 acres, is expected to produce 100,000,000 tons of mostly limestone and dolomite over a 20- to 30-year period. The size of the operations required competitive bidding for the sites. The project was strongly opposed by local residents, most of who lived in several housing developments within five miles of the proposed project. In its final Environmental Impact Statement and Record of Decision Record of Decision, the BLM did not authorize the Sloan Hills Competitive Minerals Sale (BLM news release, 4/26/2013; Proposed Sloan Hills Competitive Minerals Sales Final
Environmental Impact State and Record of Decision, 2/2013).
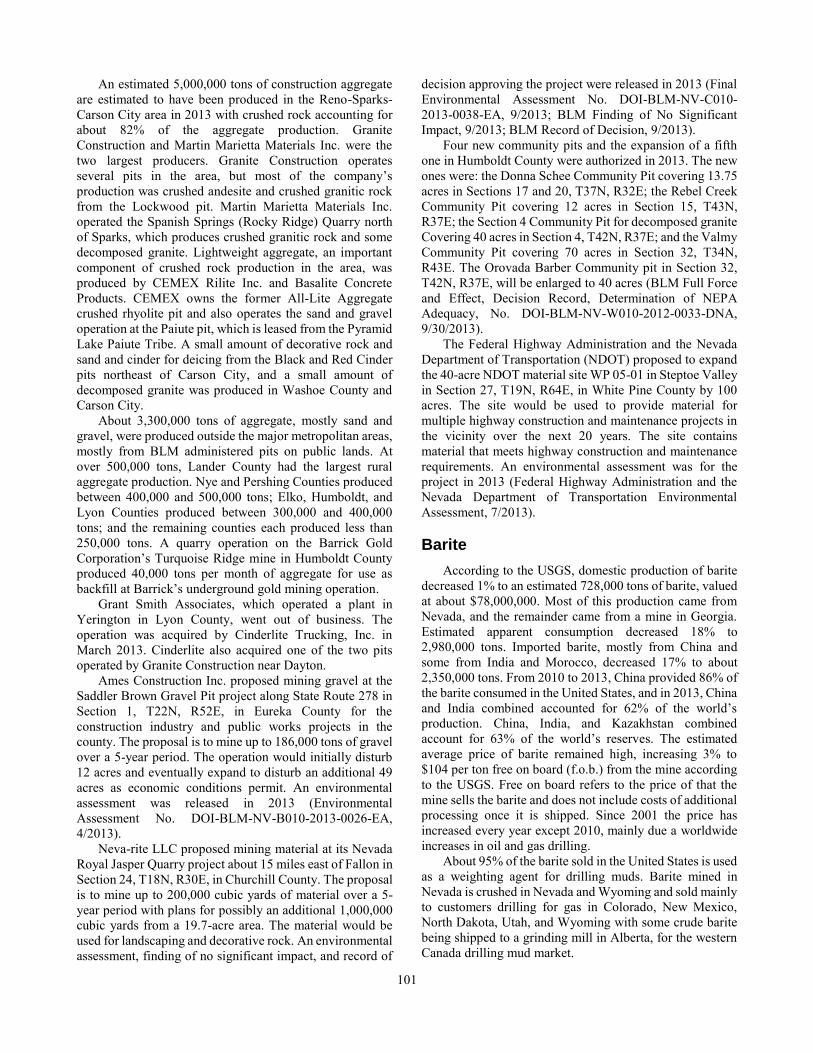
101
An estimated 5,000,000 tons of construction aggregate are estimated to have been produced in the Reno-Sparks-Carson City area in 2013 with crushed rock accounting for about 82% of the aggregate production. Granite Construction and Martin Marietta Materials Inc. were the two largest producers. Granite Construction operates several pits in the area, but most of the company’s production was crushed andesite and crushed granitic rock from the Lockwood pit. Martin Marietta Materials Inc. operated the Spanish Springs (Rocky Ridge) Quarry north of Sparks, which produces crushed granitic rock and some decomposed granite. Lightweight aggregate, an important component of crushed rock production in the area, was produced by CEMEX Rilite Inc. and Basalite Concrete Products. CEMEX owns the former All-Lite Aggregate crushed rhyolite pit and also operates the sand and gravel operation at the Paiute pit, which is leased from the Pyramid Lake Paiute Tribe. A small amount of decorative rock and sand and cinder for deicing from the Black and Red Cinder pits northeast of Carson City, and a small amount of decomposed granite was produced in Washoe County and Carson City.
About 3,300,000 tons of aggregate, mostly sand and gravel, were produced outside the major metropolitan areas, mostly from BLM administered pits on public lands. At over 500,000 tons, Lander County had the largest rural aggregate production. Nye and Pershing Counties produced between 400,000 and 500,000 tons; Elko, Humboldt, and Lyon Counties produced between 300,000 and 400,000 tons; and the remaining counties each produced less than 250,000 tons. A quarry operation on the Barrick Gold Corporation’s Turquoise Ridge mine in Humboldt County produced 40,000 tons per month of aggregate for use as backfill at Barrick’s underground gold mining operation.
Grant Smith Associates, which operated a plant in Yerington in Lyon County, went out of business. The operation was acquired by Cinderlite Trucking, Inc. in March 2013. Cinderlite also acquired one of the two pits operated by Granite Construction near Dayton.
Ames Construction Inc. proposed mining gravel at the Saddler Brown Gravel Pit project along State Route 278 in Section 1, T22N, R52E, in Eureka County for the construction industry and public works projects in the county. The proposal is to mine up to 186,000 tons of gravel over a 5-year period. The operation would initially disturb 12 acres and eventually expand to disturb an additional 49 acres as economic conditions permit. An environmental assessment was released in 2013 (Environmental Assessment No. DOI-BLM-NV-B010-2013-0026-EA, 4/2013).
Neva-rite LLC proposed mining material at its Nevada Royal Jasper Quarry project about 15 miles east of Fallon in Section 24, T18N, R30E, in Churchill County. The proposal is to mine up to 200,000 cubic yards of material over a 5-year period with plans for possibly an additional 1,000,000 cubic yards from a 19.7-acre area. The material would be used for landscaping and decorative rock. An environmental assessment, finding of no significant impact, and record of
decision approving the project were released in 2013 (Final Environmental Assessment No. DOI-BLM-NV-C010-2013-0038-EA, 9/2013; BLM Finding of No Significant Impact, 9/2013; BLM Record of Decision, 9/2013).
Four new community pits and the expansion of a fifth one in Humboldt County were authorized in 2013. The new ones were: the Donna Schee Community Pit covering 13.75 acres in Sections 17 and 20, T37N, R32E; the Rebel Creek Community Pit covering 12 acres in Section 15, T43N, R37E; the Section 4 Community Pit for decomposed granite Covering 40 acres in Section 4, T42N, R37E; and the Valmy Community Pit covering 70 acres in Section 32, T34N, R43E. The Orovada Barber Community pit in Section 32, T42N, R37E, will be enlarged to 40 acres (BLM Full Force and Effect, Decision Record, Determination of NEPA Adequacy, No. DOI-BLM-NV-W010-2012-0033-DNA, 9/30/2013).
The Federal Highway Administration and the Nevada Department of Transportation (NDOT) proposed to expand the 40-acre NDOT material site WP 05-01 in Steptoe Valley in Section 27, T19N, R64E, in White Pine County by 100 acres. The site would be used to provide material for multiple highway construction and maintenance projects in the vicinity over the next 20 years. The site contains material that meets highway construction and maintenance requirements. An environmental assessment was for the project in 2013 (Federal Highway Administration and the Nevada Department of Transportation Environmental Assessment, 7/2013).
Barite
According to the USGS, domestic production of barite decreased 1% to an estimated 728,000 tons of barite, valued at about $78,000,000. Most of this production came from Nevada, and the remainder came from a mine in Georgia. Estimated apparent consumption decreased 18% to 2,980,000 tons. Imported barite, mostly from China and some from India and Morocco, decreased 17% to about 2,350,000 tons. From 2010 to 2013, China provided 86% of the barite consumed in the United States, and in 2013, China and India combined accounted for 62% of the world’s production. China, India, and Kazakhstan combined account for 63% of the world’s reserves. The estimated average price of barite remained high, increasing 3% to $104 per ton free on board (f.o.b.) from the mine according to the USGS. Free on board refers to the price of that the mine sells the barite and does not include costs of additional processing once it is shipped. Since 2001 the price has increased every year except 2010, mainly due a worldwide increases in oil and gas drilling.
About 95% of the barite sold in the United States is used as a weighting agent for drilling muds. Barite mined in Nevada is crushed in Nevada and Wyoming and sold mainly to customers drilling for gas in Colorado, New Mexico, North Dakota, Utah, and Wyoming with some crude barite being shipped to a grinding mill in Alberta, for the western Canada drilling mud market.
102
According to data from NDOM, Nevada’s barite production comes from four operations, which shipped 882,826 tons, an increase 24% from 2012 and the highest since 1982. Any differences in reported production is because the USGS reports run-of-mine, flotation, or other beneficiated material that is sold or used by the producer, while NDOM reports what is shipped, which can include some material from stockpiles. According to the Nevada Department of Taxation, the gross proceeds reported were $85,144,649, an increase of 18% from 2012.
M-I SWACO, a subsidiary of Schlumberger, Ltd. was the largest Nevada barite producer. The company shipped 317,241 tons of crude and ground barite shipped from the Greystone Mine and Battle Mountain plant, in Lander County, an increase of 5% from 2012 and the highest since 2004. A small amount of barite was also taken from stockpiles in the nearby Mountain Springs Mine for blending at the plant. Barite in the Greystone Mine occurs as bedded barite with chert and lesser argillite and shale that comprise the Devonian Slaven Chert. An environmental assessment was being prepared for the company’s proposal to mine barite at the Dana 15 site on patented mining claims in Sections 25 and 36, T28N, R45E. The deposit has a projected six month reserve. (Environmental Assessment No. DOI-BLM-NV-B010-2013-0073-EA, 4/2014).
Baroid Drilling Fluids, a subsidiary of Halliburton Co., was the second largest producer in Nevada. The company shipped 251,329 tons, a slight decrease from 2012. This was the first decrease after four consecutive years of increasing production. The company mined barite from the Rossi Mine in Elko County and processed it at its Dunphy Mill in Eureka County. The barite occurs with chert of the Ordovician Vinini Formation.
The Rossi deposit is the largest source of barite in the country, and the mine consists of the King Lode Pit, which produces high grade barite and the Queen Lode Pit, which produces low-grade barite. At the present production rate, the Rossi Mine has a projected life of 23 years. The company mixes ore that is mined from both pits at a strip ratio is 12:1. The jig plant can process up to 1,000 tons of ore per day. Halliburton contracted the Mouat Co., Inc., to build a new processing plant adjacent to the existing one at Dunphy. The new plant is scheduled to start up in 2014 (Elko Daily Free Press Summer, 2013; Miners News, June/July 2013; Mouat Co., Inc., http://www.mouat. com/ mineral-processing/mineral-processing-recent-projects/halliburton-barite-grinding-plant).
Baker Hughes Oilfield Operations Inc., formerly Baker Hughes Drilling Fluids, shipped 150,802 tons of barite from its Argenta operation near Battle Mountain in Lander County, an increase of 9% from 2012. This was the fifth year in a row that production increased. The barite deposits are in chert and minor argillite and shale of the Devonian Slaven Chert in the upper plate of the Roberts Mountain thrust.
National Oilwell Varco shipped 51,052 tons of barite previously concentrated at its Big Ledge mine and the adjacent Dry Creek Jig Plant, an increase of 11% from 2012.
The mine operated between May and December 5, 2013, and then was temporarily shut down. The barite at Big Ledge occurs in argillite and chert of the Ordovician Valmy Formation Barite is mined and then hauled to the jig plant for crushing, washing, and sorting. It is then stockpiled for later hauling to Osino or the company plant in Evanston, Wyoming. The company built and opened a new grinding plant at the Northeastern Nevada Regional Railport at Osino. In addition to processed ore from the Big Ledge mine, it shipped 40,910 tons of ground barite from the new Osino plant. The barite is shipped to warehouses across the country with the product from Osino expected to supply drill programs in Ohio and Pennsylvania (Elko Daily Free Press Spring 2012 Mining Quarterly; Elko Daily Free Press, 9/14/2012).
Baker Hughes leased the rights to barite on the Shoshone Pediment property from the Bravada Gold Corp. The property consists of 70 claims, and the area of interest is largely within section 24, T31N, R47E in the Argenta mining district. In 2013, Baker Hughes completed 43 holes totaling 9,940 feet, though the results were not released. The barite is bedded and occurs with chert and argillite in the Devonian Slaven Chert (NBMG Bulletin 98; http://www.bravadagold.com/en/projects/shoshone-pediment-property/index.php).
Halliburton Energy Services, Inc., received a reclamation permit from the Nevada Bureau of Mining Regulation and Reclamation for the Pleasant View project covering 698 acres in Section 2, T30N, R46E and Section 34, T31N, R46E in the Bateman Canyon Mining District, Lander County. The project is in the area of the Pleasant View Mine, which consisted of four pits and produced over 100,000 tons of barite prior to 1979. The barite occurs in beds up to 10 feet thick in Devonian Slaven Chert (Halliburton Energy Services, Inc., Environmental Assessment, 11/2012; Bureau of Mining Regulation and Reclamation Permit 0341, 3/20/2013).
Baker Hughes Drilling Fluids increased the size of its CLE claim block by staking 46 claims covering over 900 acres in portions of T30N, R46E just south of the company’s Argenta Mine in the Bateman Canyon Mining District. These claims are adjacent to the Dutch Boy, Pleasant View, and Slaven Canyon deposits described in NBMG Bulletin 98, Barite in Nevada. All three deposits had some production from open pits prior to 1980 (NBMG Bulletin 98; BLM LR2000 Database).
The Marquis Alliance Energy Group USA Inc. staked lode claims (BMB claims) covering over 450 acres in portions of Sections 25, 35 and 36, T31N, R46E and Section 1, T30N, R36E in the Argenta and Bateman Canyon Mining Districts. The claims are just south of the Miller deposit, which produced over 250,000 tons of barite prior to 1980 from the Devonian Slaven Chert (NBMG Bulletin 98; BLM LR2000 Database).
The descriptions of 181 Nevada barite deposits are compiled in Nevada Bureau of Mines and Geology Bulletin 98, Barite in Nevada, 1984, by Keith Papke. A collection of Nevada barite samples acquired by Keith Papke is also

103
available at the Nevada Bureau of Mines and Geology Great Basin Science Sample and Records Library.
Cement
According to the USGS, domestic cement production in 2013 increased 4% to an estimated 85,100,000 tons that had a value of $7,600,000,000. Consumption increased 5% to an estimated 90,500,000 tons with the difference between production and consumption being made up by imports mainly from Canada, China, South Korea, and Mexico. The estimated average mill price was $82.56 per ton, a slight increase from 2012.
The only cement producer in Nevada is Nevada Cement Co. (a subsidiary of Eagle Materials Inc.), which has a plant in Fernley in Lyon County. Production is confidential, but the company’s website reported annual capacity of 500,000 tons of cement and 560,000 tons of clinker. Also, according the Nevada Department of Taxation, the gross proceeds reported were $2,639,235.61 for the limestone mine and cement plant, an increase of 31% from 2012. The plant produces Type I/II, low alkali, moderate sulfate-resistant cement; Type II/V, low alkali, high sulfate-resistant cement; IP portland-pozzolan moderate sulfate-resistant cement; and Class N pozzolan. The cement is manufactured from limestone that is mined from two areas, and from other raw materials that come from northern Nevada and elsewhere. Most of the limestone occurs in a Tertiary lacustrine sedimentary rocks, which mined in the Nevada Cement Company quarry a few miles south of Fernley. Small amounts of marble of Mesozoic age are also mined from a quarry in the Trinity Range about 40 miles east of the plant (Nevada Cement website, http://www.nevadacement.com).
Nevada Cement serves markets in northern Nevada and California. Overall, Eagle Materials reported their total 2013 cement sales volume and overall cement sales revenue were up 39% and 31% from 2012. Their average price was $95.41 per ton (Eagle Materials Inc., 10-K Report, 5/23/2014; Eagle Materials Inc., website, http://www.eaglematerials.com).
Infrastructure Materials Corp. of Reno, Nevada, staked a large number of claims in 2009, but of the 12 projects for cement-grade limestone summarized in NBMG MI2009, the company, as of 2013, had only retained the Blue Nose project in Lincoln County and the Morgan Hill project in Elko County. The Blue Nose Claim block is located about 25 miles southeast of Caliente, Nevada, and covers limestone of the Mississippian Monte Cristo Formation. The Morgan Hill Claim block is located about 20 miles west of Wells, Nevada, and covers large amounts of micritic limestone within the Devonian Devils Gate and Nevada Formations. The Blue Nose project appeared to have the higher potential of these two prospects (NBMG Bulletins 73 and 101; Infrastructure Materials Corp. 10-K Report, 9/20/2013; Infrastructure Materials Corp. website, www.infrastructurematerialscorp.com).
Clay
According to the USGS, domestic clay production increased very slightly to an estimated 28,600,000 tons, which had a value of $1,580,000,000. The USGS divides output into: ball clay, bentonite, common clay, fire clay, fuller’s earth, and kaolin. Estimated apparent consumption decreased slightly to 24,400,000 tons. The difference between production and consumption was mainly exported. Nevada has never been a large clay producer, and the state’s 2013 clay production accounts for 0.06% of domestic production. According to data from NDOM, Nevada clay production decreased 20% to 20,000 tons. According to the Nevada Department of Taxation, the gross proceeds reported for clay were $7,712,071, an increase of 15% from 2012.
IMV Nevada, a subsidiary of Lhoist North America, produced 20,000 tons of sepiolite, saponite, and bentonite from deposits in the Ash Meadows-Amargosa Flat area of Nye County, a slight decrease from 2012. The clay occurs in shallow, flat-lying deposits in Pliocene lacustrine rocks. It is processed at a plant in Amargosa Valley, and clay products are exported worldwide. The sepiolite and saponite deposits have unusual geology and are considered to have originated in a Pliocene playa with an area of at least 22 square miles. The sepiolite, which yields most of the profits for the operation, occurs in an almost continuous bed with an average thickness of about seven feet. IMV Nevada is the only commercial producer of sepiolite and saponite in North America. (IMV Nevada website, http://www.imvnevada.com).
Two companies periodically mine and ship relatively minor amounts of clay from several sites in Nevada for use in high-value specialty products. At its White Caps Mill near Beatty in Nye County, Vanderbilt Minerals Co. processes small amounts of clay stockpiled from several deposits in Nevada, Arizona, and California. In 2013, the company did not actively mine but did process smectite from the New Discovery Mine just south of Beatty, the Blanco Mine located about 40 miles west-southwest of Tonopah in the Coaldale Mining District in Esmeralda County, and from the Buff and Satin Mines about 10 miles northeast of Lovelock in the Willard Mining District in Pershing County.
The American Colloid Co. mined about 2,000 tons of calcium bentonite from its Nassau property in Coal Canyon in the Willard Mining District for use in specialty clay products. The clay is in altered rhyolite tuff-breccia of probable Miocene-Pliocene age.
The Art Wilson Company mined halloysite on an as-needed basis for the Nevada Cement Company, which owns the Flanagan pit in the Terraced Hills about 8 miles northwest of Pyramid Lake. Because of its high alumina content, it is used in the production of Portland cement at the Nevada Cement Co. plant at Fernley. This halloysite production is not included in NDOM’s annual clay production estimates for Nevada.
104
In 2013, Nevada Mining, Milling, and Manufacturing Inc. acquired Specialty Clays Corp. of Reno and continued efforts to restart the Fallon Bentonite Project to mine a deposit of sodium bentonite in the Lahontan Mountains in the Sand Springs Marsh Mining District in Churchill County. The deposit reportedly contains proven reserves of 34,000,000 tons, and 7,000 tons of API/ISO grade material have been stockpiled for shipment. The clay occurs in Quaternary lacustrine deposits and Tertiary tuffaceous sediments (NBMG Map 168; Nevada Mining, Milling, and Manufacturing, Inc. website, http://nv3M.com).
The U.S. Forest Service issued a scoping document for the East Walker Clay Mine Expansion Project proposed by Precious Minerals Mining and Refining Corp. (PMMR) in Sections 20, 21, 28 through 30, T7N, R27E in the Washington Mining District in Lyon County. The company proposes to expand operations to include two mine sites including the expansion of the existing approved site and the additions of new mine and a staging area. It plans to mine about a million tons of volcanically-derived “clay-based mineral.” The company sells the material under the trade name OryktaTM as a soil and animal feed additive. The two main components reported in OryktaTM are natrojarosite and gypsum. The company’s 1998 approved plan of operation allowed for annual production of up to 36,500 tons and, as of 2013, 5,000 tons had been mined (U.S. Forest Service scoping document 4/2012; PMMR, website, http://www.pmmrcorp.com).
Western Lithium USA Corp. owns the Kings River Valley Lithium Project, which is described below in more detail in the section on lithium. The property is within the McDermitt caldera, and contains high-lithium clays including hectorite with significant amounts of clay formed by hydrothermal alteration of volcaniclastic sedimentary rocks making up the moat deposits in the western part of the caldera.
In 2011, Western Lithium recognized that processed hectorite was being used as a specialty drilling mud additive by the oil and gas drilling industry. It put together a clay laboratory facility in Nevada, and spent two years developing products and a strategy to enter the specialty drilling mud business. The hectorite clay would have to be processed using an extruder and combined with several additives to produce an organoclay, which typically sells for between $2,000 and $4,500 per ton. In 2012, the company submitted its Kings Valley Plan of Operations for its drilling additives hectorite organoclay business to the BLM. In 2013, the BLM concluded the plan of operations was complete and initiated preparation of an Environmental Assessment. The company contracted Precision Systems Engineering of Salt Lake City, Utah, to design an organoclay plant facility with an initial annual capacity of 10,000 tons and purchased an industrial complex with adjacent rail and freeway access in Fernley to be the site of the plant. The organoclay would go under the trade name Hectatone. The plant was expected to be completed in the summer of 2014, and the company excavated 3,000 tons of hectorite clay for testing at the plant. The company was also
considering purchasing other clays such as bentonite to produce other clay products (Western Lithium USA Corp., Annual Information Form, 12/18/2013; Western Lithium USA Corp. news release, 1/21/2014; Western Lithium USA Corp., website, http://www.westernlithium.com).
The descriptions of 31 Nevada clay deposits are compiled in Nevada Bureau of Mines and Geology Bulletin 76, Montmorillonite, Bentonite, and Fuller’s Earth
Deposits in Nevada, 1970, by Keith Papke. A collection of Nevada clay samples acquired by Keith Papke is also available at the Nevada Bureau of Mines and Geology Great Basin Science Sample and Records Library.
Diatomite
The United States is the largest producer of diatomite in the world. According to the USGS, domestic production increased 5% to an estimated 849,000 tons valued at $220,000,000. Estimated apparent consumption increased 4% to 737,000 tons, and exports increased 6% to 112,000 tons in 2013. Production was from six companies with ten mining areas and nine processing facilities in California, Nevada, Oregon, and Washington.
The estimated average price was $259 per ton, the same as in 2012. The world’s two largest producers, both of which have operations in Nevada, increased prices in 2013. Imerys, a large French industrial minerals company, increased prices between 2% to 8% effective July 1 on products shipped within North America. EP Minerals LLC a subsidiary of EaglePicher Corp. and the world’s second largest diatomite producer, increased prices between 5% to 7% effective November 1 to offset higher costs in labor and benefits, mining and hauling, packaging, regulatory compliance, and transportation and logistics (Imrys Filtration Minerals, press release, 6/6/2013; Business Wire, 10/8/2013).
Nevada’s production is confidential, but according to the Nevada Department of Taxation, the gross proceeds reported for 2013 were $41,871,521.97, an increase of 6% from 2012. About two-thirds of the diatomite produced in Nevada is used in filtration and the remainder is largely used in absorbents, fillers, and cement. Emerging small-scale uses include pharmaceutical processing and nontoxic insecticides.
EP Minerals LLC produced most of Nevada’s diatomite. EP Minerals’ Colado operatons in Pershing County is the company’s most productive Nevada operation and averages 140,000 tons of diatomite annually. It consists of a plant at Lovelock that mostly makes filtration products from diatomite mined from a series of pits about 15 miles to the northwest, in the Velvet Mining District. The diatomite occurs as thick beds interbedded with fresh-water tuffaceous sedimentary rocks of probable Miocene age. The company also produced diatomite used in fillers and absorbents at its Clark plant and mine in the Clark Mining District, Storey County, about 20 miles east of Reno. The diatomite mined from a pit near Hazen in Lyon County is used in insulation. The Clark operation averages about

105
80,000 tons of diatomite annually. The diatomite at Clark occurs with diatomaceous shale and thin beds of volcanic tuff within the Miocene-Pliocene Kate Peak Formation and consists of about 90% of the diatom Melosira granulata (NBMG Bulletin 89; Mining-Winnemucca Publishing, 7/2013).
In 2013, EP Minerals LLC acquired the Moltan Company and began referring to Moltan’s mine and plant complex in Churchill County about 20 miles northeast of Fernley in the Desert Mining District as the Fernley Operation. The Fernley Operation remained in production and processed diatomite into absorbent products, cat litter, and soil conditioner (NBMG Bulletin 83; Mining-Winnemucca Publishing, 7/2013).
Imerys Minerals of California, Inc., (formerly Celite Corp. and World Minerals, Inc.) operated a plant in Fernley that produced functional fillers from diatomite mined from the company’s Nightingale deposit north of Fireball Ridge in Churchill County. The company’s Hazen Pit, which had been mined since 1950 and still has reserves, has been on standby since 2009. The diatomite deposits mined at both Nightingale and the Fernley Operation are interbedded with Pliocene lacustrine tuffaceous shale, sandstone, and limestone, and siliceous tuff (NBMG Bulletin 83).
The Grefco Minerals Inc. diatomite operation near the Esmeralda/Mineral county line is small relative to other Nevada diatomite operations but has been producing diatomite for many years, mainly for fillers. The company campaign mines and then processes material from the resulting stockpiles. The mine was idle from 2004 through 2011 but mining resumed in 2012. The deposit is in Miocene-Pliocene lacustrine sedimentary rocks consisting of diatomite, argillaceous and calcareous diatomite, clay, sand, and volcanic ash, and the main diatoms are Melosira
granulate, Stephanodiscus aslraea, and Eunotia robusta. Global Silica LLC of Las Vegas received a finding of
no significant impact and a reclamation permit for its Monte Cristo project in the Monte Cristo Range in northern Esmeralda County. The company plans to mine and process diatomite and sell it as amorphous silica. Depending on the production rate, 150,000 to 300,000 tons of material would be mined annually over a mine life of 25 years. Diatomite occurs in Miocene siltstone, shale, and fine-grained argillaceous sandstone (USGS Miscellaneous Field Studies Map MF-2260; Environmental Assessment DOI-BLM-NV-B020-2011-0086-EA, 11/2012; Nevada Department of Environmental Protection Reclamation Permit 0349, 12/19/2013; BLM Nevada Field Office Update for Nevada Legislative Committee for Public Land, 4/2014).
EP Minerals staked eight 20-acre placer claims (Butte group) in south half of section 30, T27N, R30E, in the Gold Butte Mining District, Pershing County. The area is largely underlain by Tertiary Truckee Formation consisting of lacustrine, volcanic, and volcaniclastic rocks containing diatomite and capped by basalt (Southern Pacific Areal Economic Map, T27N, R29 and 30E, 1957; NBMG Bulletins 89; BLM LR2000 Database).
Dimension Stone and Landscape Rock
According to the USGS, the estimated domestic production of dimension stone increased very slightly to 2,390,000 tons, which was valued at $460,000,000. Estimated apparent consumption increased 6% to $2,250,000,000 in 2013. The difference between production and consumption was due to imports, largely from China, Brazil, and Italy. Annual production in Nevada was estimated to be about 150,000 tons with an estimated value of about $25,000,000.
Mt. Moriah Stone Quarries LLC quarried flaggy quartzite of several colors from the Cambrian Prospect Mountain Quartzite at a quarry about 15 miles north of Baker in White Pine County. This material, which naturally splits into large slabs, is used for flagstone, ashlar (uncut facing stone), and other types of uncut building stone.
Las Vegas Rock produced cut decorative slabs, flagstone, ashlar, boulders, and crushed landscape rock from its Rainbow Quarries near Goodsprings, about 32 miles southwest of Las Vegas at the base of Mount Potosi. The operation consists of a main quarry and a number of satellite quarries located according to the color of the stone. The stone is mined from the Jurassic Aztec Sandstone, and technical data including hardness, strength (Las Vegas Rock website http://vegasrock.com).
Kalamazoo Materials Inc. of Tucson, Arizona, mined crushed stone for landscaping from a quarry located about 5 miles north of Beatty, which it leases from D and H Mining. These pits are in Pliocene tuff, which in the past, D and H Mining mined and sold the rock under the name of “Spicerite” (strong, bright white, hydrothermally altered tuff used to make brick and blocks) (Kalamazoo Materials website, http://www.kalamazoomaterials.com).
Fluorspar
The USGS reports only U.S. production of fluorspar equivalent (equivalent to 92% fluorspar) derived as a by-product in the form of fluorosilicic acid from phosphate rock processed for phosphoric acid. Domestic production was an estimated 148,000 tons of fluorspar equivalent, an increase of 3% from 2012. Apparent consumption was 645,000 tons, an increase of 11% from 2012. Imports, mostly from Mexico and China and some from South Africa, made up the difference between production and consumption. The average price of metallurgical grade fluorspar from $263 to $399 per ton in the first half of 2013 (Industrial Minerals).
China accounted for 64% of the world’s fluorspar production making that country by far the world’s largest producer. Over time, China has increased its hydrofluoric acid production capacity and has curtailed fluorspar exports in favor of internal consumption. China’s curtailment of exports and the increase in demand outside of China starting in 2010 led to increased exploration and development of new deposits and the reopening of old mines. Since then,

106
however, world demand has dropped, largely due to a slowdown in the fluorochemicals market resulting in a drop in price.
According to NBMG Bulletin 93, Fluorspar in Nevada, Nevada produced an estimated 556,000 tons between 1928 and 1976, 91% of which came from four mines. According to the USGS, production from mines in Nevada continued through 1991 and then from stockpiles for several years afterwards.
In 2013, Tertiary Minerals PLC completed 26 drill holes in two phases on the Nevada Fluorspar’s BM Project of Nevada Fluorspar Inc. in the Fish Creek Mining District in Eureka County. The property is also known in the literature as the Bisoni deposit or the McCullough’s Butte deposit. In 2012, the Tertiary Minerals took out a 50-year renewable lease on the property with the option buy from Nevada Fluorspar Inc. Early in 2013, a resource under the JORC “exploration target” category was estimated between 93,000,000 and 116,000,000 tons grading 9-11% CaF2 with an 8% CaF2 cut-off as part of a larger mineralized system estimated at between 435,000,000 and 678,000,000 tons grading 5-7% CaF2 with a 2% CaF2 cut-off.
Phase one drilling program consisted of four core and reverse circulation totaling 1,804 feet. Significant intercepts included 140 feet averaging 12.4% CaF2, including 15 feet grading 26.1% CaF2; and 40 feet averaging 16.5% CaF2. Phase two consisted of 22 reverse circulation holes totaling 8,758 feet designed to estimate the resource. In the Southern Area, 14 holes were drilled to depths up to 410 feet. They were spaced between 260 feet and 330 feet apart in a 980-foot by 1,300-foot area. All the holes intersected thick intervals of fluorspar mineralization. Some of the better intercepts were 225 feet averaging 9.9% CaF2, including 35 feet grading 14.3% CaF2; and 75 feet averaging 10.1% CaF2, including 10 feet grading 14.2% CaF2. In the Central Area five holes were drilled in a 1,300-foot by 1,970-foot area. Fluorspar mineralization appeared to be continuous, but analytical results were not yet available by year’s end. Three holes were drilled in the Northern Area, an exploration area where drilling in the 1960s by Union Carbide indicated potential fluorspar mineralization. No significant mineralization was encountered, but it may have been down-faulted to depths greater than the drilling.
The mineralization occurs in pegmatitic quartz veins, skarn veins, greisen veins, and quartz veins spatially associated with late Cretaceous granite porphyry dikes in dolomitized limestone of the Ordovician Antelope Valley Formation. Fluorite is the ore mineral, which occurs with sphalerite, molybdenite, beryl, and scheelite (BLM LR2000 Database; NBMG Bulletin 93; Tertiary Minerals, PLC, news releases, 2/12/2013, 5/9/2013, 12/18/2013, 4/16/2014; Tertiary Minerals, PLC, annual report, 9/30/2013; Tertiary Minerals, PLC, website, http://www.tertiaryminerals.com).
The descriptions of 62 Nevada fluorspar deposits are compiled in Nevada Bureau of Mines and Geology Bulletin 93, Fluorspar in Nevada, 1979, by Keith Papke. A collection of Nevada fluorspar samples acquired by Keith
Papke is also available at the Nevada Bureau of Mines and Geology Great Basin Science Sample and Records Library. Gemstones
Precious opal is produced from several small mines in the Virgin Valley area of northern Humboldt County, which is a well-known source of gemstones in North America. The best known mines are the Royal Peacock, Rainbow Ridge, and Bonanza Mines, which produce about 100 pounds of opal annually from pay-to-dig operations. The opal occurs in Miocene lacustrine sedimentary rock, volcanic ash and tuff, and bentonite. According to the Nevada Department of Taxation, the gross proceeds reported were $174,528.25, an increase of 19% from 2012. Turquoise was produced from the Damele Mine in Lander County and the Royston claims, Nye County, in 2011, but no turquoise production has been reported since.
Gypsum
According to the USGS, domestic crude gypsum production increased 3% to an estimated 18,000,000 tons valued at $130,000,000, the third consecutive annual increase after four consecutive annual decreases. Estimated apparent consumption increased 4% to 34,700,000 tons, the fourth consecutive annual increase. Production of crude gypsum continues to be offset by the production of synthetic gypsum. Synthetic gypsum is largely produced from scrubbed emissions from coal-fired power plants. Production of synthetic gypsum has increased in most years since 2003 and surpassed the production of crude gypsum. The production of synthetic gypsum increased 4% to 14,600,000 tons in 2013. The difference between production and consumption was mostly made up with imports from Canada and some from Mexico and Spain, which decreased 2% to 3,500,000 tons. The increase in consumption was due to increased activity in construction of residential and nonresidential buildings. The estimated price of crude gypsum increased 4% to $7.25 per ton. For the previous 22 years, the price has ranged between $6.08 and $8.01 per ton, averaging $6.67 per ton over that period.
Nevada ranked third in the list of five states which account 62% of domestic production. According to data from NDOM, Nevada’s gypsum production increased 41% to 2,088,438 tons, which is the second increase after eight consecutive annual decreases from a peak of 2,310,000 tons in 2004. According to the Nevada Department of Taxation, the gross proceeds reported was $25,632,185, an increase of 50% from 2012.
PABCO Gypsum in Clark County northeast of Las Vegas was the largest Nevada producer with production of 1,177,633 tons, an increase of 14% from 2012. PABCO Gypsum processes the gypsum into wallboard at a plant adjacent to their mining operation. The gypsum ore occurs in a nearly flat-lying late Miocene gypsite blanket atop a 5-square-mile mesa. Drilling indicates the gypsum is at least 120 feet thick in the area of current mining.

107
Material from two smaller operations is used in cement and agricultural applications. The Art Wilson Company of Carson City produced 441,129 tons of gypsum and anhydrite from the Adams Mine in Lyon County, an increase of 29% from 2012. The Adams deposit is a folded body associated with limestone in Triassic metavolcanic rocks. The Pioneer Gypsum Mining Company produced 155,535 tons of gypsum from the Pioneer Mine about 10 miles east of Las Vegas, a decrease of 154% from 2012. The Pioneer Mine exploits the same late Miocene gypsite deposit as the PABCO operation.
Gypsum Resources, LLC, mined and processed gypsum 314,141 tons of gypsum from the Blue Diamond pit mainly for agricultural purposes. The company started operating in 2012 when they produced 43,120 tons. The company received a reclamation permit from the Nevada Department of Environmental Protection that allows for the disturbance of up to 1,007 acres on private property and 130 acres of disturbance on public lands (Bureau of Mining Regulation and Reclamation Permit 0328, 1/15/2013; Gypsum Resources, LLC, website, http://www.bdhgypsum.com).
USG Corporation produced a small amount of gypsum from its pit near Empire according to the Nevada Department of Taxation. The operation was shut down in January 2011 due to the severe construction slump, though operations could be restarted if the construction industry picked up again.
Georgia-Pacific Gypsum LLC operated a plant at Apex using synthetic gypsum and crude gypsum imported from Saint George, Utah, for the production of drywall and related products. It also owns the Weiser Ridge quarry about 10 miles west of Overton, which has not been actively mined since 1995. The quarry is in gypsum interbedded with limestone of the Permian Toroweap and Kaibab Formations.
CertainTeed Gypsum Manufacturing Inc. produced sheet rock from its plant at Blue Diamond, Clark County, in 2013. The Black Rock Mine in Mohave County, Arizona, is the source of its gypsum (BLM LR-2000 Database; CertainTeed website, http://www.certainteed.com).
Transnational Group Inc. of Las Vegas was preparing to negotiate for the acquisition of an undisclosed 204-acre gypsum mining property in Clark County, Nevada. A 1964 study estimated the resource to be 11,600,000 tons grading 90% gypsum 10,000,000 tons of dolomitic limestone, and a 2013 study limited to 10 acres noted 1,193,486 tons of in-situ gypsum. In December 2013, a mine plan was completed allowing for an annual production of 290,000 tons of gypsum, which would give the mine a production life of 40 years (Transnational Group, Inc. news release, 4/9/2014; Transnational Group, Inc. website, http://www.transnationalgroup.net).
The descriptions of 26 Nevada gypsum deposits are compiled in Nevada Bureau of Mines and Geology Bulletin 103, Gypsum Deposits in Nevada, 1987, by Keith Papke. A collection of Nevada gypsum samples acquired by Keith Papke is also available at the Nevada Bureau of Mines and Geology Great Basin Science Sample and Records Library.
Iron Oxide
The USGS reports iron ore that is not used in general iron and steel production as iron oxide pigments (IOP). This includes use in concrete and other construction materials (60%); coatings and paint (25%); foundry uses (5%); and animal food, magnetic tapes, and other uses (6%). Mine production was withheld, but the estimated combined annual production of finished natural and synthetic IOP has remained around 53,000 tons from 2011 through 2013. Estimated apparent consumption of combined naturally and synthetically produced IOP was 226,000 tons, an increase of 8% from 2012. Thus, about 80% of IOP consumed was imported. The estimated average price was $1,397 per ton, a decrease of 4% from 2012. Nevada’s production of IOP was small and not reported, but two companies sold iron oxide from stockpiles in 2013. According to the Nevada Department of Taxation, the reported gross proceeds for IOP, which was reported as iron ore, were $1,564,409.86, an increase of 82% from 2012.
Saga Exploration Company shipped iron oxide from stockpiles at the old Nevada Barth Mine in Eureka County, accounting for 99% of Nevada’s IOP proceeds. The iron ore consists mostly of hematite and some magnetite, and is used in the manufacturing of cement by the Nevada Cement Company in Fernley. The American Smelting and Refining Company leased the property from the Central Pacific Railroad Company and mined 544,295 tons of iron ore between 1903 and 1918 for use as flux in their lead smelter in Salt Lake City. Lessees continued to work the property off and on afterwards with some mining in the 1960s and 1970s. Saga Exploration has shipped iron ore from stockpiles since 1993.
Standard Industrial Minerals, Inc., of Bishop, California, sold several hundred tons of iron oxide from stock piles from the old Minnesota Mine near Yerington. The material was sold to a company for use as an additive in agricultural products. The iron oxide is magnetite that replaced dolomitized limestone in the Triassic Oreana Peak Formation.
Lime, Limestone, and Dolomite
According to the USGS, domestic production of quicklime and hydrate increased 1% to an estimated 20,900,000 tons valued at $2,300,000,000. Apparent consumption remained flat at 21,100,000 tons. Peak production and consumption occurred in 2006, and both decreased 25% to the lows in 2009. Both have increased about 20% since then. In 2013, the average price at the plant increased slightly $105 per ton for quicklime and $125 per ton for hydrate.
In 2013, 7,024,187 tons of limestone were mined in Nevada, a 6% increase from 2012. This includes all limestone mined for crushed rock, cement, lime and agricultural products, and cement but does not include dolomite. Nevada has two large lime producers and several small specialty dolomite and limestone producers. The
108
Nevada Department of Taxation reported the 2012 gross proceeds at $35,430,727.34, an increase of 9% from 2012.
Nevada’s largest lime producer, the Pilot Peak high-calcium lime operation of Graymont Western US, Inc. (formerly Continental Lime, Inc.) is in the Toano Range about 10 miles northwest of Wendover in Elko County. The plant has three kilns with a combined capacity of more than 700,000 tons of quicklime per year and a hydrated lime plant capable of producing 350 tons per day. Pilot Peak mainly markets lime to gold-mining operations for use in cyanide-solution pH control. Gross proceeds for Pilot Peak reported to the Nevada Department of Taxation were $20,418,961, an increase of 18% from 2012. Production is mainly from the Devonian Devils Gate Limestone (Graymont Western US, Inc. website, http://www.graymont.com).
Nevada’s other lime producer, Lhoist North America (formerly Chemical Lime Co.), produces lime at Apex in the Apex Mining District about 20 miles northeast of Las Vegas. The operation makes high-calcium quicklime used in metallurgical processing, paper manufacturing, and environmental markets. The company also produces dolomitic lime and hydrated high calcium lime at Apex, mainly for construction uses. The company’s Henderson plant processes Type S hydrated dolomitic lime for building and home construction. In addition to lime, Lhoist North America also shipped crushed limestone. Gross proceeds reported to the Nevada Department of Taxation were $11,822,179, an increase of 5% from 2012. Production is from the Devonian Sultan Limestone.
Nutritional Additives Corp., one of Nevada’s specialty dolomite and limestone producers, turns out agricultural and nutritional dolomite products along the northwest edge of the Sonoma Range about five miles south of Winnemucca. Production is from the Triassic Dun Glen Formation. Min-Ad, Inc., a subsidiary of Inter-Rock Minerals Inc. of Toronto, Canada, also produced dolomite from the Dun Glen Formation about three miles south of the Nutritional Additives Corp. operation. Its dolomite is mostly sold to midwestern states and as far as New York and Alberta for use in beef and dairy feed. The Art Wilson Company of Carson City produced some pure calcitic limestone from the Adams Mine. The limestone is used for soil pH control and reportedly contains no detectable magnesium. Production is confidential, but the Nevada Department of Taxation reported the gross proceeds to be $4,246,353.98, a slight decrease from 2012.
Lithium
According to the USGS, the estimated domestic
consumption of lithium averaged 3,100 tons in the late 1990s to 2000 and then fluctuated between 1,200 tons and 2,750 tons through 2010. Consumption was stable afterwards at 2,200 tons through 2013. In 2013, the United States was estimated to have lithium reserves of 42,000 tons and identified resources of 6,000,000 tons. Nevada is the only state with domestic production of lithium raw
materials. The Nevada Department of Taxation reported the gross proceeds to be $21,937,051, an increase of 19% from 2012.
Subsurface brines, mainly from Chile, were the main source of lithium worldwide because of low production costs as compared with the mining and processing costs associated with hard-rock ores. Nevada’s lithium operation, initiated at Silver Peak in Esmeralda County in 1966 by Cyprus Mines, was the first to extract lithium as the sole commercial product from brine. This operation was the world’s dominant lithium producer until the late 1980s, when a Chilean lithium brine operation started. Along with Chile and Nevada, Argentina and China also produce lithium from brines. U.S. lithium imports amounted to 2,200 tons in 2013, while its exports were 1,200 tons. Global production was about 39,000 tons in 2013. Lithium-based rechargeable battery sales accounted for 29% of the global lithium market. Ceramics and glass account for 35% and lubrication grease for 9% of the market. The remainder includes air treatment, metallurgy, polymers, pharmaceuticals, aluminum production, and other uses. Prices were between $2.50-3.00 per pound through May 2013 when they jumped to $3.00-3.50 per pound and remained there for the rest of the year (Industrial Minerals).
Rockwood Lithium, Inc. (formerly Chemetall Foote Mineral Co.) owns and operates the Silver Peak lithium facility. The company produces lithium carbonate, lithium hydroxide monohydrate, and lithium hydroxide anhydrite. The lithium chemicals are produced by solar evaporation preconcentration and subsequent refining techniques from brine that is pumped from beneath the Clayton Valley playa. The brine varies between 100 and 300 ppm lithium. In 2013, the Rockwood reported its average annual production capacity to be 6,600 tons with an estimated mine life of 21 years at that rate. It reported the remaining economic reserves to be about 38,000 tons (Rockwood Lithium, Inc. 10-K Report, 3/4/2014; BLM LR2000 Database; Industrial
Minerals). AmeriLithium of Henderson, Nevada, dropped many of
the claims comprising its Clayton Deep, Full Monty, and Jackson Wash land positions. Clayton Deep covers part of a large gravity low anomaly, less than 10 miles southwest of Silver Peak. It is underlain by the upper Miocene to Pliocene Esmeralda formation, which consists of approximately 15,000 feet of lucustrine tuffaceous sediments including poorly sorted conglomerates and sandstones, limestone, and mudstones. The company released a 43-101 technical report on the property in 2013. The Full Monty is located in Smoky Valley about 25 miles north of Clayton Valley, where it occurs in a large gravity low associated with a thick sequence of Quaternary alluvium. Part of the property also is covered by a playa containing evaporites. The property is just west of the inactive Hall molybdenum mine. The Hall porphyry contains anomalous lithium, which may be a source of the lithium on the Full Monty property. The Jackson Wash property is located west of the Goldfield Hills. The property covers part of a gravity low in an area of Quaternary alluvium. The company was developing a

109
drilling program for all three properties in 2013 (AmeriLithium Corp. 10-K Report, 4/25/2014; AmeriLithium Corp. website, http://.amerilithium.com; AmeriLithium Corp. 43-101 Technical Report, 2/27/2013).
BG Capital Group South Florida, Inc., acquired most of the mining claims making up the Borate Hills project from American Lithium Minerals Inc., when that company went out of business in 2012. The Borate Hills project covers over 3,400 acres between 15 and 20 miles west-northwest of Silver Peak. It consisted of three separate claim blocks: North Borate Hills and South Borate Hills in the northern Silver Peak Range and Fish Lake Deep on the east edge of Fish Lake Valley. In the 1980s, U.S. Borax drilled 57 holes up to 2,000 feet deep totaling 50,000 feet in the North Borate Hills and South Borate Hills areas and identified a large deposit up to 1,300 feet thick, which ranks as the second largest boron deposit in the country. Surface mineralization extends for at least 1.5 miles, and recent surface sampling at South Borate Hills assayed over 1% boron and up to 2,750 ppm lithium. The boron and lithium mineralization is contained in a stratabound formation consisting of a claystone unit and a unit of volcanic tuff lacking clay. (BLM LR2000 Database; American Lithium Minerals, Inc., Form 8-K, 11/25/2011; Nevada Business Search, website, http://nvsos.gov/sosentitysearch/CorpSearch.aspx).
Lithium Corp. completed 11 drill holes totaling 1,025 feet on its Fish Lake Valley property, located about 22 miles northwest of Rockwood’s Silver Peak Operation. Storms and wet conditions made the playa impassable, and the company was forced to drill around the playa margins. All the fluids encountered returned values of less than 5 mg/L lithium indicating anomalously high boron, potassium, and lithium values encountered during the 2012 drilling project barely extend past the margins of the playa (Lithium Corp. 10-K Report, 4/1/2014; Lithium Corp. news releases 1/24/2013, 9/3/2013; Lithium Corp. website: www.lithiumcorporation.com).
Lithium Corp. compiled all its data including that from its 2012 drilling program of its San Emidio Property, located in the San Emidio Desert about 65 miles north-northeast of Reno. The company amended its permit with the BLM to allow for drilling up to three deeper lithium brine tests in 2014 in an area on the playa where lithium enriched brines were encountered at shallower depths. The 2012 drilling program helped define a 0.6-mile by 3-mile lithium-in-brine anomaly containing a peak value of 23.7 mg/L lithium and also indicated the anomaly occurs at or near the intersection of several faults which may have provided the structural setting necessary for a covered lithium-rich brine deposit to form (Lithium Corp. 10-K Report, 4/1/2014; Lithium Corp. news release, 3/4/2014; Lithium Corp. website: www.lithiumcorporation.com).
Pure Energy Minerals, Ltd., released the results of gravity and controlled source audio-magneto-telluric (CSAMT) surveys conducted in 2012 on its Alkali Flats Lithium project in the Montezuma Mining District, in Esmeralda County. The survey indicated that a highly
conductive layer occurs at depths greater than 650 feet. The layer is about 1.25 miles wide and ranges between 590 to 650 feet in thickness. The gravity survey confirmed the existence of a 6-sqaure-mile closed basin partly covered by the claim block. The company received a permit from the BLM to conduct a program to drill up to eight wells (Pure Energy Minerals, Ltd., Management and Discussion Analysis, 10/17/2012; Pure Energy Minerals, Ltd., 43-101 technical report, 8/8/2012; Pure Energy Minerals, Ltd., news releases, 2/25/2013, 4/24/2013, 9/3/2013; Pure Energy Minerals, Ltd., website, http://www.pureenergyminerals.com).
In 2013, Rodinia Lithium wrote off and dropped its Clayton Valley Lithium project, which consisted of 1,012 claims covering 72,340 acres in Clayton Valley immediately surrounding most of Chemetall Foote’s Silver Peak operation. However, no exploration was carried out (Rodinia Lithium Management Discussion and Analysis, 4/30/2014; Rodinia Lithium news release, 8/29/2013; Rodinia Lithium website; http://www.rodinialithium.com).
Sovereign Lithium Inc., entered into a mineral property option agreement with GeoXplor Corp. for the exclusive right to acquire a 100% interest in its Big Smoky Valley Lithium Project (BSV claims) in Esmeralda County, just northwest of the Silver Peak lithium operation. In 2013, the company conducted a gravity survey and a CSAMT survey. Results of the gravity survey indicated the presence of a basin that extends over most of the claim block with depths exceeding 1,600 feet 3/24/2014; Sovereign Lithium, Inc., news releases, 1/8/2013, 7/1/2013, 7/12/2013, 11/4/2013; Sovereign Lithium, Inc., website, www.sovereign lithium.com)
Western Lithium USA Corp. continued with exploration, testing, and evaluation of its lithium-bearing clay resource at its Kings River Valley project, in northern Humboldt County. The results of testing by the Department of Energy’s Argonne National Laboratory of lithium carbonate from Kings Valley for lithium ion batteries demonstrated that Western Lithium can produce high purity lithium product for use in multiple types of lithium ion battery chemistries. In 2013, the company was also awarded a patent (US 8,431,005), filed in 2011, for developing a process in separating lithium and potassium from hectorite and other lithium-rich clays. Western Lithium evaluated two scenarios using the new technique. The first is based on mining and processing ore with a throughput of 2,300 tons per day (14,300 tons of lithium carbonate annually). The second is to double production to full production (14,600 tons of lithium carbonate annually) four years after start-up. At full production, the estimated cost of production is $878 per ton of lithium carbonate. Start-up capital is estimated to be $248 million, with the additional capital needed to bring to full production estimated to be $161 million. Sustaining capital is estimated to be $40 million. Western Lithium contracted a firm to design and build a lithium demonstration plant that would process 13.2 tons of lithium clay per day resulting the extraction of 132 pounds of battery grade lithium carbonate. As part of the
110
demonstration plant, a 1.6-ton bulk sample was processed at a calcination facility in Germany, which resulted in an 85%-92% recovery rate for lithium. The plant was expected to be operational in the fall of 2014. In the meantime, Western Litihum moved ahead with plans for the production of hectorite clay for a specialty drilling mud additive, which is discussed in the section on clay (Western Lithium USA Corp. Annual Information Form, 12/18/2013; Western Lithium USA Corp. 43-101 technical report, 5/9/2014; Western Lithium USA Corp. news releases 2/13/2014, 4/28/2014; Mining-Winnemucca Publishing, 7/2013; Western Lithium USA Corp. website, http://www.westernlithium.com).
The property is within the McDermitt caldera, where the lithium occurs in high-lithium clays, including hectorite. Significant amounts of clay formed by hydrothermal alteration of the volcaniclastic sedimentary rocks making up the moat deposits in the western part of the caldera. These lithium-bearing moat deposits extend north through the western Montana Mountains and Disaster Peak into Oregon. Significant lithium mineralization has been defined in five areas referred to by Western Lithium as Stages I through V. In each area, the high-lithium clay occurs in thick, apparently continuous accumulations that vary between about 3 and 300 feet in thickness (Western Lithium USA Corp. website, http://www.westernlithium.com).
Magnesia
According to the USGS, domestic production of magnesium compounds increased 2% to an estimated 276,000 tons. About 69% of domestic magnesia production came from seawater and natural brines, and the rest was produced from mining magnesite and minor brucite from Nevada and olivine from Washington. Estimated apparent consumption was 520,000 tons, a decrease of 3% from 2012, with the difference between consumption and production being made up mainly by imports from China. About 53% of the magnesium compounds are used for refractories, and the rest is used in agricultural, chemical, construction, environmental, and industrial operations. The average price for calcined magnesite delivered from China to the U.S., varied between $275 and $310 per ton in 2013. (Industrial Minerals).
Premier Chemicals, LLC, owns the Gabbs magnesia operation in Nye County, which is the only place in the country to mine magnesite. Magnesite and some brucite (<5%) have been mined at Gabbs since 1935. During the 1990s, the availability of cheap foreign refractory magnesia caused production at Gabbs to be switched to light-burned (caustic calcined) magnesia that is mainly marketed for wastewater treatment and agricultural uses. Production is confidential, but the plant capacity is rated at 150,000 tons per year. The Nevada Department of Taxation reported gross proceeds at $6,142,219, an increase of 6% from 2012. The magnesite and brucite occur as complex replacement bodies in Triassic dolomite in an area of about 1,300 acres in the Paradise Range just east of Gabbs. The resource was
estimated to be about 64,000,000 tons (Magnesia
Supplement, Industrial Minerals, May 2010, p. 50-67) and is thought to be sufficient for more than 50 years of production at present mining rates.
Nevada Clean Magnesium Inc. (formerly Molycor Gold Corp.) owns the Tami-Mosi magnesium property in the western foothills of the Schell Creek Range between Tamberlain and Mosier Canyons about 6.5 miles southeast of Ely in White Pine County. In 2013, the company formed a joint venture with ScanMag AS of Norway. The company also is planning construction of a pilot furnace to test the dolomite at Tami-Mosi (Nevada Clean Magnesium, Inc., Management and Discussion Analysis, 3/17/2014; Nevada Clean Magnesium, Inc., news release, 10/5/2013; Nevada Clean Magnesium, Inc., website, http://www.nevadacmi.com).
Perlite
According to the USGS, the estimated domestic production of perlite decreased 5% to 414,000 tons valued at $21,100,000. Estimated apparent consumption was 520,000 tons, and imports were 148,000 tons, decreases of 7% and 12% respectively from 2012. About 53% of perlite production is used in building construction products. Most of the rest is used in fillers, filters, and horticulture. The estimated average price was $51 per ton, an increase of 7% from 2012.
Although Nevada has large resources, current perlite production in Nevada is restricted to small-scale mining of two deposits for niche markets, which produced less than 3% of the domestic total in 2013. Nevada’s actual production is confidential, but the Nevada Department of Taxation reported gross proceeds of $5,264,459.11 in 2013, an increase of 196% from 2012.
Wilkin Mining and Trucking Inc. mined perlite from the Tenacity Perlite Mine in the South Pahroc Range Mining District about 25 miles west of Caliente, Lincoln County. The company has mined perlite in the area for more than 25 years. The company has a small popping plant in Caliente, and sales were almost exclusively expanded perlite used for horticultural purposes. Most years, the company ships between 1,500 and 2,000 tons. The deposit consists of a large, flat-lying, 20-foot thick perlite flow with obsidian pellets in Tertiary rhyolitic volcanic rocks.
EP Minerals processed and shipped a small amount of expanded perlite that is marketed as a filter aid from its Colado diatomite plant in Pershing County. Plant capacity is reportedly about 8,000 tons per year. The crude perlite comes from the Popcorn Mine about 15 miles south of Fallon, Churchill County, which is usually mined a week or two per year. The perlite occurs as glassy flows associated with rhyolitic flows (NBMG Bulletin 83).
111
Potassium Sulfate, Sodium Sulfate, and Alum
During the planned lithium extraction process for the previously described Kings Valley project of Western Lithium Corp., potassium sulfate and sodium sulfate would be recovered as a by-product and processed and sold for fertilizer. A 2012 feasibility study indicated an 82.7% recovery rate for potassium sulfate and a 77.7% recovery rate for sodium sulfate (Western Lithium USA Corp. Annual Information Form, 12/18/2013; Western Lithium USA Corp. news releases 2/13/2014; Western Lithium Corp. 43-101 Technical Report, 1/27/2012; Western Lithium Corp. website, http://www.westernlithium.com).
Heart of Nature LLC campaign mined and processed material from its Alum/Sulfur pit in the Alum Mining District in Esmeralda County. The minerals that are mined include alunite, potassium alum (kalinite), jarosite, gypsum, native sulfur, and potassium feldspar. The alunite occurs with kalinite and sulfur as veins, stringers, and fracture fillings in either a dike or neck of rhyolite intruded into folded rhyolitic tuffs of the Tertiary Esperanza Formation. Reddish, iron-stained jarosite occurs locally in the pit. The material is mined, crushed, and stockpiled. The stockpiled material is processed as necessary. Alunite and sulfur are the main essential minerals with thiobacillis bacteria added. The final product is sold as an agricultural soil amendment, as an odor control for manure, and as an odor and algae control for ponds (Heart of Nature, LLC, website, http://www.heartofnature.biz).
Rare Earths
According to the USGS, Molycorp’s Mountain Pass Mine in California, which restarted production in 2012, is the only domestic producer of rare earths elements (REE). The company processes REE from the fluorocarbonate mineral bastnasite, and in 2013, produced 4,400 tons of bastnasite concentrates (60-70% rare earth oxides). Domestic consumption figures are withheld, but the estimated consumption of imports increased 81% in 2013 after decreasing 26% in 2012. Despite this increase, the estimated value of imported refined rare earths was $260,000,000, a decrease of 50% from 2012. China contains 39% of the world reserves and accounted for 91% of world production, which totaled 121,000 tons in 2013, and 79% of U. S. imports between 2008 and 2012.
Largely because of its own increasing consumption, China cut its exports in 2010 by 70%, resulting in drops of 40% drop in 2010 and 65% for the first nine months of 2011, while tripling its domestic consumption in 2011. China continued export restrictions and consolidation of its domestic REE industry through 2013. The export restrictions resulted in price increases ranging from 15% to 1,265% on various rare earth elements in 2010 and 2011. However, sluggish economic conditions and improved efficiency in material processing resulted in price decreases ranging between 5% and 95% depending upon the element
in 2012 and 2013. The world has little near term production capacity outside of China. The only significant producers of REE outside China are: 1) the recent startup of the Mount Weld operation in Australia, 2) the restart of Mountain Pass, ine California, 3) the 2014 projected start-up of a monazite sand processing plant in Odisha, India, and 4) the 2015 projected start-up of the Nolans bore project in Australia. This has led to an increase in exploration (Industrial
Minerals). Elissa Resource Ltd. conducted a high resolution
combined radiometric-aeromagnetic survey over the area that included its Thor project. It’s located in Clark County, Nevada in T28-29S, R61E, very near the Mountain Pass deposit. The project area is in Precambrian rocks but, unlike Mountain Pass with its bastnasite-bearing ore enriched in light REE, the mineralization at Thor is in structurally-controlled zones containing monazite, apatite, and xenotime enriched in heavy REE. Significant REE and some thorium mineralization has been identified in areas referred to as the Lopez and Santos trends and Black Butte and NED areas. Based on previous exploration work, including drilling in 2012 and the 2013 geophysical survey, a new geologic model was being prepared. The Lopez trend may represent part of the eastern limb of a large, possibly overturned, fold with the nose and western limb, represented by the Santos Trend. Shallow alluvium covers most of interpreted fold. If the interpretation is correct, the REE-bearing host units in the Lopez Trend may have a strike length of 3.8 miles (Elissa Resource, Ltd., management discussion and analysis, 3/24/2014; Elissa Resource, Ltd., website, http://www.elissaresources.com).
Salt
According to the USGS, the estimated domestic production of salt increased 8% in 2013 to 44,200,000 tons valued at $1,600,000,000. According to data from NDOM, Nevada’s only producer, the Huck Salt Co., produced 23,000 tons of salt, a decrease of 20% from 2012. The Nevada Department of Taxation reported gross proceeds at $626,048, an increase of 48% from 2012. The salt is mainly used for de-icing roads, and production levels are dependent on weather. The salt is also used for water softeners. The salt is mined from a playa on Fourmile Flat about 25 miles southeast of Fallon, Churchill County, where it has been harvested almost continuously since the 1860s, when it was hauled to the mills that processed Comstock silver and gold ore.
Silica
The USGS includes silica under Industrial Sand and
Gravel. The U.S. is by far the world’s largest silica sand producer, and the estimated domestic production increased 3% in 2013 to 57,900,000 tons, an all-time high. The value of 2013’s production was $2,600,000,000. Estimated domestic consumption increased 3% in 2013 to 53,100,000 tons. The U.S. is a major exporter of silica, and exports were
112
estimated at 4,850,000 tons, an increase of 1% from 2012. The estimated average price was $45.00 per ton, a decrease of 6% from 2012.
The uses of silica are: 1) hydraulic fracturing sand and well-packing and cement sand, 62%; 2) manufacturing glass, 16%; 3) foundry sand, 9%, and 4) fillers and building products, golf course sand, and other uses, 13%. Most silica production in Nevada goes to manufacturing glass and foundry castings and construction materials and a small amount to golf sand.
The Nevada Department of Taxation reported gross proceeds to be $15,847,249, an increase of 34% from 2012. According to data from NDOM, Nevada’s major silica producer, Simplot Silica Products at Overton, Clark County, shipped 600,936 tons of silica sand, an increase of 44% from 2012. The sand is mined from a large open pit in the relatively friable Cretaceous Baseline Sandstone, washed in the pit, and transported via a 5-mile slurry pipeline to a plant where it is screened and bagged.
James Hardie Building Products, Inc., produced high purity silica from the Lucky Boy Quarry about 10 miles southwest of Hawthorne, Mineral County. The material is transported to the company’s crushing plant near Reno. Production is confidential, but the Nevada Department of Taxation reported gross proceeds at $467,892, a decrease of 56% from 2012. The silica is used as feed for the company’s fiber-cement siding manufacturing plant in the Tahoe-Reno Industrial Park east of Sparks. The company’s lease on the mines expires in January 2014 but includes an option to buy.
The Lucky Boy Quarry is in a 1300-foot by 350-foot body of milky quartz hosted in granodiorite.
Southern Nevada Liteweight mined silica sand from the Hidden Valley South quarry about 20 miles south of Las Vegas. The quarry produced mostly plaster and concrete sand for stucco and masonry block and some golf course sand.
Zeolites
Nevada contains large resources of zeolite; however, zeolite production has been small, and no zeolite is currently mined in Nevada. Saint Cloud Mining Company operated the Ash Meadows plant, which annually ships 1,000 to 5,000 tons of clinoptilolite used in water filtration, odor control, and nuclear clean-up from their plant in Amargosa Valley, Nye County. The plant, which has a 40,000 ton annual capacity, also produces zeolite-based cement for building materials and oil and gas projects. The clinoptilolite is mined from a small open pit just over the state line in Inyo County, California, in a large area of zeolite deposits that extends into Nevada. (Saint Cloud Mining Co. website, http://www.stcloudmining.com)
KMI Zeolite, Inc. operated its plant in Sandy Valley about 32 miles southwest of Las Vegas. The source is a deposit with a reported reserve of 53,700,000 tons of largely clinoptilolite, located eight miles west of Death Valley Junction in California about 85 miles northwest of the plant. The mill is capable of producing 55,000 tons per year. (KMI Zeolite, Inc., website, http://www.kmizeolite.com).
113
Industrial Mineral Deposits by David A. Davis _________________________________________________________________________________________________________
This is a compilation, in progress, of industrial mineral deposits. The information in this compilation was obtained from the Nevada Division of Minerals and from published reports, articles in mining newsletters, and company websites, annual reports, and press releases. Locations of active mines and contact information are listed in the Directory of Mining and Milling Operations. ________________________________________________________________________________________________________________________
Deposit name Minerals Reserves/resources Production
________________________________________________________________________________________________________________________
CHURCHILL COUNTY ________________________________________________________________________________________________________________________
Carson Sink Salt Project NaCl 1978: 3,600,000 tons (Carson Sink district) (recoverable NaCl)
________________________________________________________________________________________________________________________
Fallon Bentonite Project Bentonite 2012: 34,000,000 tons, Na-Bentonite 2012: 7,000 tons stockpiled (Sand Springs Marsh (proven reserves) district)
________________________________________________________________________________________________________________________
CLARK COUNTY ________________________________________________________________________________________________________________________
Anderson Gypsum 1936: 1,500,000 tons, (Moapa district) (estimated reserve)
________________________________________________________________________________________________________________________
Chapparal Limestone 2012: 182,000,000-200,000,000 tons, (Moapa district) 80-95% CaCO3 (resource, <2.5% MgO)
________________________________________________________________________________________________________________________
Lone Mountain Aggregate 2008: Public Lands: 177,000,000 cubic yards; 1980-2012: N/A Private Property: 63,000,000 cubic yards (proposed for extraction)
________________________________________________________________________________________________________________________
Mica Peak Vermiculite 2007: 2,000,000-3,000,000 tons, (Gold Butte district) (estimated recoverable reserve)
________________________________________________________________________________________________________________________
Overton Magnesite 1936: 850,000 tons 38% MgO; 3,700,000 1920s: small (Moapa district) tons 34% MgO; 5,100,000 tons 30% MgO (resource)
________________________________________________________________________________________________________________________
Pabco (Apex) Gypsum 1958: 750,000,000 tons 1940s: N/A (Muddy Mountains district) (estimated reserves) 1959-1988: N/A 1989-2005: 12,712,287 tons 2006: 1,438,886 tons 2007: 1,148,624 tons 2008: 829,801 tons 2009: 715,701 tons 2010: 682,000 tons 2011: 710,033 tons 2012: 1,033,681 tons 2013: 1,177,633 tons
________________________________________________________________________________________________________________________
Searchlight Insulation Perlite 1951: 10,581,000 tons (indicated reserves) 1940s-1955: N/A (Searchlight district)
_________________________________________________________________________________________________________
Sloan Dolomite 1952: 48,000,000 tons (indicated ore) 1928-2012: N/A (Sloan district) 22,000,000 tons (inferred ore)
_________________________________________________________________________________________________________
Sloan Hills Dolomite 2011: 126,000,000 tons (material (Sloan district) Limestone proposed to be mined)
________________________________________________________________________________________________________________________
114
INDUSTRIAL MINERAL DEPOSITS (continued) ________________________________________________________________________________________________________________________
Deposit name Minerals Reserves/resources Production ________________________________________________________________________________________________________________________
ELKO COUNTY ________________________________________________________________________________________________________________________
Ivanhoe Creek Bentonite 2007: 2,200,000 tons, Ca-Bentonite (Ivanhoe district) (inferred resource)
________________________________________________________________________________________________________________________
Lakes Barite 1982: 8,000,000 tons, 4.1 sp. gr. 1959-1965; (Beaver district) (resource) 1973-1981: <1,000,000 tons
_________________________________________________________________________________________________________
ESMERALDA COUNTY _________________________________________________________________________________________________________
Silver Peak Li 2008: 44,000 tons (economic reserves) 1966-1997: N/A (Disaster district) 1998: 1,200,000 lbs LiCO3, 500,000 lbs LiOH 1999-2013: N/A ________________________________________________________________________________________________________________________
EUREKA COUNTY _________________________________________________________________________________________________________
Bisoni (Fish Creek) Fluorspar 1970s: “many 100,000s” tons, 10% CaF2 (Fish Creek district) 1987: >120,000,000 tons, 10% CaF2 2014: 9,800,000 tons, 10.3% CaF2 (JORC compliant indicated mineral resource, 8% CaF2 cut-off); 32,500,000 tons, 10.4% CaF2 (JORC compliant inferred mineral resource, 8% CaF2 cut-off)
________________________________________________________________________________________________________________________
HUMBOLDT COUNTY _________________________________________________________________________________________________________
Kings Valley Li, K, Na 2011: 0.327% Li cut-off grade: (Disaster district) 16,465,000 tons, 0.4% Li, 3.85% K, 3.7% Na (proven reserves); 13, 445,000 tons, 0.388% Li, 3.93% K, 3.93% Na (probable reserves) Li, K, Na 2012: 0.32% Li cut-off grade:
13,396,000 tons, 0.405% Li, 3.83% K, 1.46% Na (proven reserves); 1, 980,000 tons, 0.396% Li, 3.77% K, 1.45% Na (probable reserves)
_________________________________________________________________________________________________________
LANDER COUNTY ________________________________________________________________________________________________________________________
Blazer Fluorspar 1970s: 300,000 tons, 30% CaF2 (Iowa Canyon district) 1974: 437,500 tons, 25.8% CaF2
_________________________________________________________________________________________________________
Bradshaw Barite 1975: 78,760 tons (reserve, shipping grade 1975-1982: N/A (Bullion district) 4.22 sp. gr.); 5,100 tons (low grade resource)
_________________________________________________________________________________________________________
Nevada Fluorspar Fluorspar 1974: 924,000 tons, 26% CaF2 1945-1975: N/A (Iowa Canyon district)
________________________________________________________________________________________________________________________
LINCOLN COUNTY _________________________________________________________________________________________________________
Acoma Perlite 1951: 38,700,000 tons (indicated reserves) (Acoma district) 21,850,000 tons (inferred reserves)
________________________________________________________________________________________________________________________

115
INDUSTRIAL MINERAL DEPOSITS, LINCOLN COUNTY (continued) ________________________________________________________________________________________________________________________
Deposit name Minerals Reserves/resources Production ________________________________________________________________________________________________________________________
Blue Nose Limestone 2011: 227,725,000 tons (indicated (Viola district) resource; low, <5%, MgO);
30,595,000 tons [inferred resource, low; <5%, MgO); 16,649,000 tons
(indicated resource, high MgO); 2,086,000 tons (inferred resource, high MgO)
________________________________________________________________________________________________________________________
Boyd Clay 1936: 800,000 cubic feet 1920-1930: N/A (Boyd district)
________________________________________________________________________________________________________________________
Eccles and Minto Perlite 1951: 15,281,000 tons (indicated reserves) (Acoma district) 9,640,000 tons (inferred reserves)
________________________________________________________________________________________________________________________
Fairview Perlite 1951: 4,038,000 tons (indicated reserves) Bef. 1951: 5,000 tons (Silverhorn district) 2,000,000 (inferred reserves)
________________________________________________________________________________________________________________________
Free Perlite 1951: 450,000 tons (indicated reserves) (Wilson Creek Range 1,000,000 (inferred reserves) district)
________________________________________________________________________________________________________________________
Hollinger Perlite 1951: 1,150,000 tons (indicated reserves) 1940s-1968: over 250,000 tons (Wilson Creek Range 3,000,000 (inferred reserves) district)
_________________________________________________________________________________________________________
Johnson-Fitchett Perlite 1951: 2,680,000 tons (indicated reserves) 1,000,000 tons (inferred reserves)
_________________________________________________________________________________________________________
Kopenite Perlite 1951: 10,460,000 tons (indicated reserves) Bef. 1951: several 1,000 tons (South Pahroc Range 5,000,000 tons (inferred reserves) district) _________________________________________________________________________________________________________
Leech Perlite 1951: 1,150,000 tons (indicated reserves) (Wilson Creek Range 3,000,000 (inferred reserves) district)
________________________________________________________________________________________________________________________
Robb Perlite 1951: 16,000,000 tons (indicated reserves) (South Pahroc Range 8,000,000 (inferred reserves) district)
________________________________________________________________________________________________________________________
Snow Perlite 1951: 29,615,000 tons (indicated reserves) (Eagle Valley district)
________________________________________________________________________________________________________________________
Tenacity Perlite 1950s: 15,000,000 tons (reserves) 1950-2013: N/A (South Pahroc Range district)
________________________________________________________________________________________________________________________
LYON COUNTY _________________________________________________________________________________________________________
North of Rosetta Mine Limestone 1959: 1,000,000 tons (estimated) (Red Mountain district)
________________________________________________________________________________________________________________________
South of Rosetta Mine Limestone 1959: 400,000 tons (estimated) (Red Mountain district)
________________________________________________________________________________________________________________________
MINERAL COUNTY ________________________________________________________________________________________________________________________
Fluftrok Perlite 1950s: 300,000 tons (resource) (Aurora district)
_________________________________________________________________________________________________________

116
INDUSTRIAL MINERAL DEPOSITS, MINERAL COUNTY (continued) ________________________________________________________________________________________________________________________
Deposit name Minerals Reserves/resources Production _________________________________________________________________________________________________________
Fluorspar King and Fluorspar 1945: 25,000-37,500 tons, 65% CaF2 1929: 200 tons Blue Bell (Buena Vista district)
________________________________________________________________________________________________________________________
NYE COUNTY ________________________________________________________________________________________________________________________
Carrara Marble 2003: 60,000,000 tons 1914-1934: ~10,000 tons (Bare Mountain district)
________________________________________________________________________________________________________________________
Horseshoe Fluorspar 1956: 410,000 tons, abt. 40% CaF2 (Quinn Canyon district) (estimated reserves)
________________________________________________________________________________________________________________________
Mammoth Fluorspar 1956: 3,125,000 tons, 30-35% CaF2 (Quinn Canyon district) (estimated reserves)
_________________________________________________________________________________________________________
Premier Mg 2010: 64,000,000 tons (resource) 1935-2013: N/A (Gabbs district)
_________________________________________________________________________________________________________
Shannon Queen Fluorspar 1956: 12,000 tons, abt. 51% CaF2 (Quinn Canyon district) (estimated reserves)
_________________________________________________________________________________________________________
Spar Fluorspar 1956: 33,000 tons, abt. 80% CaF2 (Quinn Canyon district) (estimated reserves)
_________________________________________________________________________________________________________
PERSHING COUNTY ________________________________________________________________________________________________________________________
Nassau Bentonite 2012: 535,000 tons, Ca-Bentonite 1981-2013: <2,000 tons annually (Nevada district) (wet tons of reserves)
_________________________________________________________________________________________________________
Valery Fluorspar 1965: 800,000 tons, 25% CaF2 1953-1955: 1,932 tons (Imlay district)
_________________________________________________________________________________________________________
WASHOE COUNTY _________________________________________________________________________________________________________
Spanish Springs Quarry Aggregate 2012: 139,849,000 tons, hard rock 1984-2013: N/A (Nevada district) (reserve) 2013: 139,342,000 tons, hard rock (reserve)
_________________________________________________________________________________________________________
WHITE PINE COUNTY _________________________________________________________________________________________________________
Hampton Creek Garnet Garnet 1990: 12,000 to 60,000 tons Early 1960s: test lots (Mount Moriah district) (1-5% alluvial resource)
_________________________________________________________________________________________________________
Tami-Mosi Mg 2011: 454,000,000 tons, 12.3% Mg (Nevada district) (inferred resource, 12% cut-off grade)
_________________________________________________________________________________________________________

117
Geothermal Energy by Lisa Shevenell and Alexandra Reid
Geothermal activity in 2013 culminated in two success stories at Wild Rose and a blind geothermal system at McGinness Hills. McGinness Hills initially went into operation in 2012, but experienced such success in the early development of the field that an additional 22 MW was added to the project in 2013. This brought the project capacity to 52 MW, one of the largest fields developed in Nevada. The Wild Rose project came online in late 2013 both under budget and ahead of schedule delivering power from its new 16 MW facility. Both these projects helped to increase total geothermal production capacity for the state to 593 MW, second only to California in installed capacity in the U.S.
Additional indications of continued geothermal development are reported by Nevada Division of Minerals who issued 2 project area permits and 21 geothermal well permits in 2013 that included the following: 10 industrial production well permits, 2 industrial injection well permits, 1 domestic well permit, 1 gradient well permit, and 7 observation well permits,. A total of 23 geothermal wells of all types (see table of Nondomestic Geothermal Wells below for complete listing) were reported as drilled during 2013, 8 of which were production wells: 10 of the wells drilled were permitted in 2012.
Nevada geothermal electrical production in 2013 from federal and private lands combined was 3,456,380 megawatt-hours (MWh) gross and 2,577,515 MWh net. This was an increase in gross production of 318,726 MWh, compared to the 2012 production, and an increase in net production of 167,179 MWh from 2012. According to the Nevada Department of Taxation (2014), the total 2013 gross proceeds from geothermal power generation in Nevada were $184,672,029 ($22 million greater than in 2012), with the largest gross proceeds generated by the Steamboat complex at $39.7 million ($2 million less than in 2012; $4 million less than in 2011), followed by Dixie Valley at $30 million. The total proceeds were not entirely from power generation but also included Elko Heat Company’s $219,378 gross proceeds from commercial heating and Nevada Geothermal Utility Company’s $102,117 (Warren
and Manzanita Estates, Moana geothermal system). No taxation information is published by the Department of Taxation for the Peppermill Hotel Casino, which uses geothermal waters produced on site to heat their hotel towers.
Currently installed capacity (nameplate/ gross) at 16 existing geothermal power production sites (24 power plant units) in Nevada is 593.3 megawatts (MW), an 81.3 MW increase from 2012. Table 1 lists operators, plant locations, and energy production for individual Nevada geothermal power producers at the end of 2013 (based on data supplied to the Nevada Division of Minerals by individual companies). Figure 1 shows the location of these power plants.
In Nevada during 2013, there were 11 authorized federal leases covering approximately 7,056 acres, offered for bid (Table 2) on January 29 and November 29. This shows a decline from previous years from 2007 to 2012 in both the number of leases sold and the percent of available leases that were sold. For instance, in 2007 and 2008, 100% of the parcels offered were sold, whereas in 2012, only 24% of the parcels offered were sold. However, 69% of the leases offered were sold in 2013, although far fewer acres were sold than in previous years. Figure 2 shows the location of active geothermal leases in Nevada as of December 2013; data were obtained from the BLM LR2000 database and prepared by the Nevada Bureau of Mines and Geology.
Total lease sale income in 2013 in Nevada was $42,870 in comparison to the peak year of 2008 in which $28,207,806 were generated. (Tables 2 and 3). Only 0.15% of the dollars generated from BLM lease sales in the peak year of 2008 were collected from lease sales in 2013, which is an indication of the decline in geothermal exploration activity in Nevada since the somewhat artificial peak in 2008 (Table 2).
Seventy-five percent of BLM lease sale income went to the State of Nevada (25% had gone to the counties of Nevada prior to the 2009 state budget crisis), and 25% went to the U.S. Department of Interior to help support BLM’s geothermal program (BLM web site, 2013).

118
Table 1. Nevada geothermal power plants, 2013.
Footnotes to Table 1.
* Ormat decommissioned the Steamboat I plant. The 8.4 MW is not included in the total.
1: Nameplate capacity is the manufacturer’s rating of equipment output capacity as reported to the Nevada Division of Minerals by the plant operators (as of February, 2013) and does not necessarily reflect the capability of the currently developed resource. These nameplate capacities are estimates, and several different values can be found in the literature. Generator nameplate capacity actually refers to the size of the actual generator, but not to the turbine size or the actual capacity of the power plant. There are no public documents breaking down nameplate capacity of the turbines or gross power so these numbers may not adequately reflect actual generation (Dan Fleischmann, personal communication, June 2010).
2: Original installed capacity of 16.6, increased to 17.7MW in 2006 after improvements were made to reinjection strategies. Additional 1.5MW in 2011 from a new binary bottoming-cycle plant added.
3: Desert Peak II is a newer binary power plant that was built to replace the original steam turbine power plant at Desert Peak, which was permanently shut down on May 1, 2006. The new power plant came online on August 1, 2006 with a generation capacity of 23 MW, more than twice that of the original power plant.
119
Table 2. Geothermal power plant operator contact information. Addresses, telephone numbers, and websites for companies listed in Table 1 follow (as of fall 2013):
Operator Local (Nevada) Office Project MW
Enel North America Enel North America Salt Wells 23.6
One Tech Drive 1755 East Plumb Lane, Suite 155 Stillwater 47.2
Suite 220 Reno, NV 89502 Andover, MA 01810 (775)557-2940 Phone: 978-681-1900 http://www.enel.it/northamerica/
Homestretch Energy Business Office Homestretch Energy Generating Facility Wabuska 5.6
1147 N. Daybreak Dr. 10 Julian Lane Washington, UT 84780 Yerington, NV 89447 (435) 668-6003 (775) 741-7921
http://www.homestretchenergy.com/
Alternative Earth Resources NGP Blue Mountain 1 LLC Blue Mountain (Faullkner 1) 49.5
Suite 900 - 409 Granville Street 657 Anderson St Vancouver, BC Winnemucca, NV 89445 Canada, V6C 1T2 (775) 625-4515
(866) 688-0808 http://www.alternative-earth.com/s/Home.asp
*Brady Power Partners Ormat Technologies, Inc. *Bradys 26.1
(subsidiary of Ormat Nevada Inc.) 6225 Neil Rd Desert Peak II 23
6225 Neil Rd Reno, NV 89511 Jersey Valley 23.5
Reno, NV 89511 (775) 356-9029 McGinness Hills 52
(775) 356-9029 http://www.ormat.com/ Steamboat 2-3 & Hills 61
http://www.ormat.com/ Tuscarora 32
Don A Campbell 22.5
Burdette (Galena 1) 30
Galena 2 & 3 43.5
Alterra Power Corp Alterra Power Corp, (Magma Energy) Soda Lake No. 1 5.1
600 - 888 Dunsmuir Street 5500 Soda Lake Road Soda Lake No. 2 18
Vancouver, BC Fallon, NV, 89406, USA Canada V6C 2K4 (775) 867-5093 (604) 669-4999; (877) 669-4999 www.magmaenergycorp.com
Terra-Gen Power, LLC Terra-Gen Power, LLC Beowawe 16.6
1095 Avenue of the Americas 9590 Prototype Ct., #220 Dixie Valley 64.7
25th Floor, Suite A Reno, NV 89521 Dixie Valley Binary 6.2
New York, NY 10036 (775) 851-1125 (646) 829-3900 http://www.terra-genpower.com/
U.S. Geothermal Inc U.S. Geothermal Inc Empire (San Emidio) 11.8
390 E. Parkcenter Blvd, Ste 250 P.O. Box 10 Boise, Idaho 83706 Empire, NV 89405 (208) 424-1027 (775) 557-2015
http://www.usgeothermal.com/index.aspx
Gradient Resources Patua 30
2440 Vassar Street Reno, Nevada 89521 (775) 284-8842 www.gradient.com/
Total Installed MW (nameplate capacity) 593.3

120
Figure 1. Locations of existing power plants noted in Table 1 (as of December 2014; modified from Shevenell and Zehner, 2011).
Figure 2. Locations of active geothermal leases in
Nevada as of December 2013, highlighting those
offered in 2013 in red. Does not include leases that
were authorized in LR2000 through the end of the
year, but had been submitted for
relinquishment prior to 12/2013.
121
Table 3. 2013 BLM lease sales results from the January 29 and November 19, 2013 lease sales. Note that the last two entries were sold non-competitively based on a search of BLM’s LR2000.
Table 4. Geothermal competitive leasing activity in Nevada, 2007–2013.
Year Parcels Acres Parcels Acres Total Average % Acres % Parcels
Offered Offered Sold Sold receipts per acre Sold Sold
2007 43 122,849 43 122,849 $11,669,821 $95 100% 100%
2008 35 105,212 35 105,212 $28,207,806 $268 100% 100%
2009 108 323,222 82 243,727 $8,909,445 $28 75% 76%
2010 114 328,020 75 212,370 $2,762,292 $13 65% 66%
2011 51 151,119 17 42,627 $456,353 $11 28% 33%
2012 33 94,829 8 27,834 $112,540 $4.04 29% 24%
2013 13 16,284 9 10,373 $42,870 $4.13 64% 69%
Totals: 397 1,141,535 269 764,992 $52,161,127 $60
Source: http://www.blm.gov/nv/st/en/prog/minerals/leasable_minerals/geothermal0/ggeothermal_leasing/prior_sales.html
As can be seen from Tables 3 and 4, geothermal leasing activity had declined dramatically by 2011 through 2013, with only minimum-bid offers on all the properties. Of the total number (348) of leases sold from 2007-2013 (including non-competitive), 186 (53%) of the leases were relinquished, allowed to expire, or terminated by BLM during this time period.
According to the Geothermal Energy Association, at the end of 2013, 45 projects (compared to 75 projects at
the end of 2012) were in various stages of development in Nevada, which could result in the construction of approximately 718 MW of additional power generation capacity over the next 5 to 10 years (GEA, 2014).
Plant nameplate capacity by year is shown in Table 1 and Figures 1 and 3, price and production data appear in Figure 4, and production wells drilled by year are graphed in Figure 5, with detail on those wells listed in Table 5.
Location Company T
(N) R
(E) Sec BID/ACRE ACRES
TOTAL Bonus Bid
Hot Springs Flat Ormat Nevada Inc 23N 27E 6 $2.00 1836 $3,674.00
Bog Hot Valley Ormat Nevada Inc 46N 28E 22 $2.00 3053 $6,108.00
Denio/Bog Hot Valley Ormat Nevada Inc 47N 30E 18 $2.00 640 $1,280.00 Rye Patch/Florida Canyon Presco Energy LLC 31N 33E 4 $2.00 1366 $2,734.00
Dixie Valley ORNI 32 LLC 22N 35E 3 $2.00 160 $320.00
Hot Springs Flat Ormat Nevada Inc 23N 27E 20 $2.00 1402 $2,804.00 Rye Patch/Florida Canyon Presco Energy LLC 32N 33E 28 $2.00 1320 $2,640.00
Dixie Hot Springs Ormat Nevada Inc 22N 35E 7 $2.00 520 $1,040.00
Tungsten Mountain Ormat Nevada Inc 21N 38E 13 $2.00 75 $150.00
Dixie Valley Blue Mtn Research & Devel. 24N 36E 12 $1.00 640 $640.00
Dixie Valley Blue Mtn Research & Devel. 24N 36E 24 $1.00 1600 $1,600.00
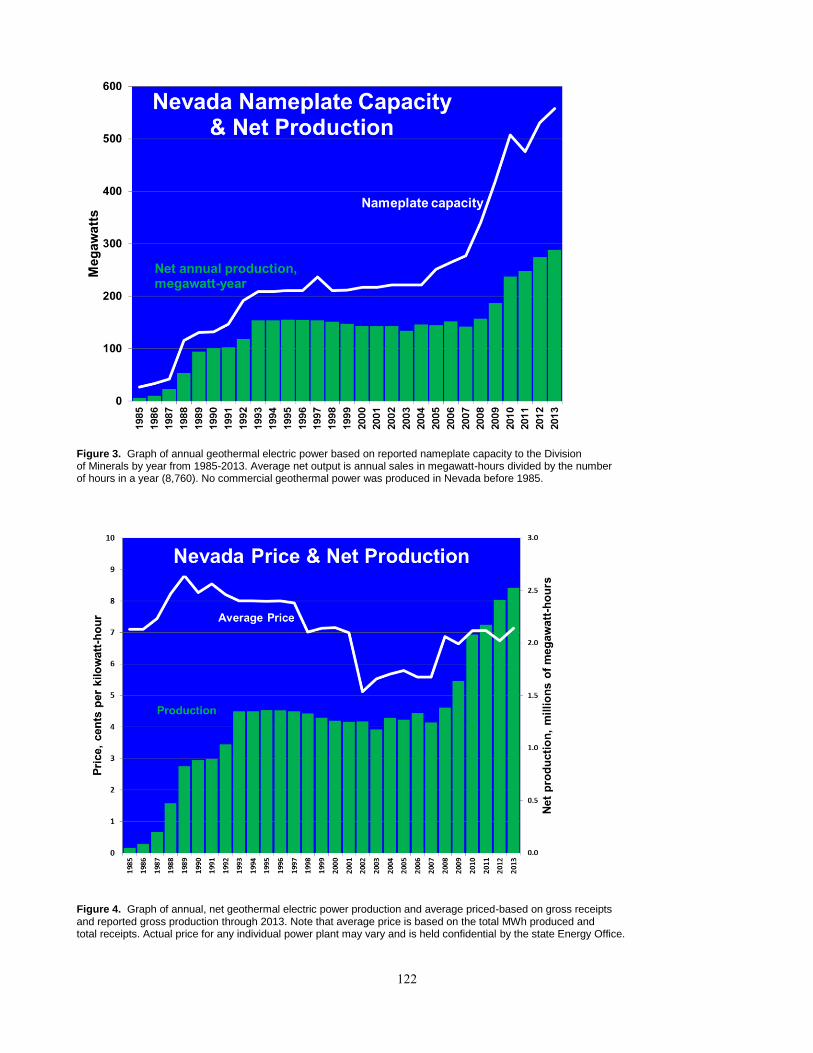
122
Figure 3. Graph of annual geothermal electric power based on reported nameplate capacity to the Division of Minerals by year from 1985-2013. Average net output is annual sales in megawatt-hours divided by the number of hours in a year (8,760). No commercial geothermal power was produced in Nevada before 1985.
Figure 4. Graph of annual, net geothermal electric power production and average priced-based on gross receipts and reported gross production through 2013. Note that average price is based on the total MWh produced and total receipts. Actual price for any individual power plant may vary and is held confidential by the state Energy Office.

123
Table 5. Geothermal wells reported as drilled, re-drilled or completed in 2013.
Area Company Name Well
Type1 Well Number PRMT
# Location Permitted Depth (ft) SPUD Date
Lyon County
Patua I PATUA PROJECT P 23-17 (ST-1) 826 SW/4 NW/4 S 17, T20N, R26E 10,000 1/29/2013
PATUA PROJECT P 23-17 (ST-2) 826 SW/4 NW/4 S 17, T20N, R26E 10,000 3/15/2013
PATUA PROJECT P 36-17 1321 NE/4 SW/4 S17, T20N, R26E 9,500 3/4/2013
PATUA PROJECT P 36-17 (ST) 1321 NE/4 SW/4 S17, T20N, R26E 9,500 6/8/2013
Churchill County Stillwater ENEL STILLWATER I 68-31 ∆ FRM 67-31 1284 SW/4 SE/4 S 31, T20N, R31E ±2,000 11/13/2013
Patua I PATUA PROJECT I 38(51-28)21 1316 SE/4 SW/4 S 21, T20N, R26E 10,800 1/16/2013
PATUA PROJECT I 38(43-28)21 (ST 1) 1316 SE/4 SW/4 S 21, T20N, R26E 10,800 4/25/2013
PATUA PROJECT I 38(22-28)21 (ST 2) 1316 SE/4 SW/4 S 21, T20N, R26E 10,800 6/9/2013
PATUA PROJECT I 38(25)21 (ST 3) 1316 SE/4 SW/4 S 21, T20N, R26E 10,800 7/9/2013
PATUA PROJECT I 78-20 1323 SE/4 SE/4 S 20, T 20N, R 26E 10,500 2/13/2013
PATUA PROJECT P 14(12)28 1327 SW/4 NW/4 S 28, T20N, R26E 10,500 5/20/2013
PATUA PROJECT P 14(11)28 (ST 1) 1327 SW/4 NW/4 S 28, T20N, R26E 10,500 8/6/2013
Tungsten Mountain ORNI 43 O 84-22 1324 SE/4 NE/4 S 22, T21N, R38E 4,500 9/22/2013
Washoe County San Emidio USG NEVADA NORTH O 12 (58A-33) 1301 SW/4 SE/4 S 33, T30N, R23E 3,000 9/2/2013 Reno International Airport UNR BOARD OF
REGENTS TG RENO AIRPORT TG-
1 1338 SW/4 SE/4 S 19, T19N, R20E 1,000 9/11/2013
Elko County Tuscarora HSS II O 35-8 1306 NE/4 SW/4 S 8, T41N, R52E 4,000 5/25/2013
HSS II O 33-17 1333 SE/4 NW/4 S 17, T41N, R52E ±4,000 6/8/2013
HSS II O 36-8 1334 NE/4 SE/4 S 8, T41N, R52E ±4,000 6/9/2013
Mineral County Wild Rose ORNI 47 O 38-12 1320 SE/4 SW/4 S 12, T11N, R32E 3,000 11/16/2013
Lander County McGinness Hills ORNI 39 O 22A-10 1326 NW/4 NW/4 S 10, T20N, R45E 4,000 2/6/2013
ORNI 39 P 25-10 1341 NW/4 SW/4 S10, T20N, R45E 5,000 12/18/2013
ORNI 39 P 27-10 1342 SW/4 SW/4 S 10, 20N, R45E 4,475 12/15/2013 1 I = Injection, O = Observation, P = Production, TG = Thermal Gradient, D = Domestic
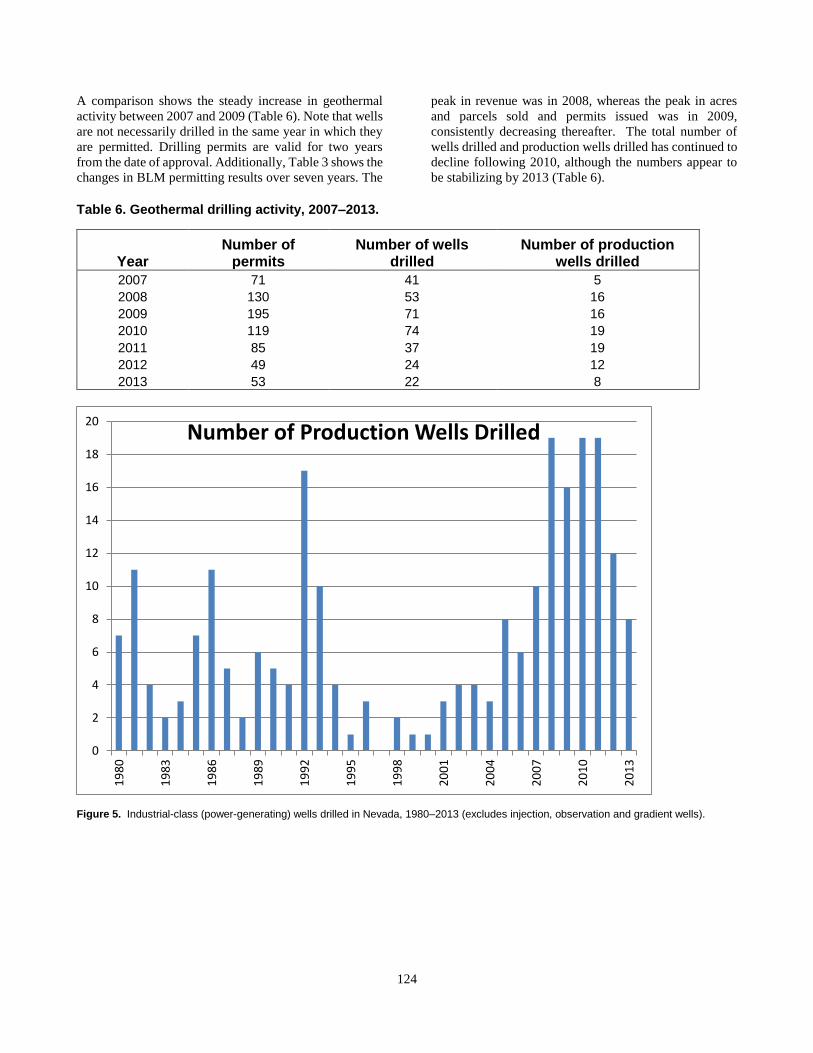
124
A comparison shows the steady increase in geothermal
activity between 2007 and 2009 (Table 6). Note that wells
are not necessarily drilled in the same year in which they
are permitted. Drilling permits are valid for two years
from the date of approval. Additionally, Table 3 shows the
changes in BLM permitting results over seven years. The
peak in revenue was in 2008, whereas the peak in acres
and parcels sold and permits issued was in 2009,
consistently decreasing thereafter. The total number of
wells drilled and production wells drilled has continued to
decline following 2010, although the numbers appear to
be stabilizing by 2013 (Table 6).
Table 6. Geothermal drilling activity, 2007–2013.
Figure 5. Industrial-class (power-generating) wells drilled in Nevada, 1980–2013 (excludes injection, observation and gradient wells).
0
2
4
6
8
10
12
14
16
18
20
1980
1983
1986
1989
1992
1995
1998
2001
2004
2007
2010
2013
Number of Production Wells Drilled
Year Number of
permits Number of wells
drilled Number of production
wells drilled
2007 71 41 5
2008 130 53 16
2009 195 71 16
2010 119 74 19
2011 85 37 19
2012 49 24 12
2013 53 22 8
125
ACTIVITY DURING 2013
The following sections summarize activities that occurred in 2013 at specific geothermal areas in Nevada. Text descriptions are included for sites for which information was either available publicly or through direct communications with operators.
Blue Mountain, Humboldt County - Alternative Earth Resources (Nevada Geothermal Power)
The Nevada Geothermal Power, Inc. (NGP) Blue Mountain project area covers approximately 17.2 square miles (44.5 km2) in T36N, R34E of Humboldt County, encompassing a blind geothermal system with no visible hydrothermal features at the surface. It was located during gold exploration drilling that encountered high temperature water (up to 88°C) in the early 1990s (Parr and Percival, 1991). Maximum temperatures encountered at the site are 370.4°F (188°C) at approximately 2,000 feet (610 m) (Niggemann et al., 2009).
The Nevada Geothermal Power Inc. (NGP) Blue Mountain property underwent some financial restructuring in 2012, in part as a result of the revised predicted lower power output and required reinjection strategy needed to meet loan covenants during the remaining 17 year contracted life of the project. GeothermEx revised their previous reservoir simulation model and showed an 8°F/yr (4.4°C/yr) decline in reservoir temperatures, reducing estimated power output from previous model estimates. The power output was projected to fall below the average amount of 34 MW in 2012, decreasing to about 15 MW by 2020. As such, NGP hired Canaccord Genuity as a financial advisor to evaluate restructuring of its mezzanine debt. In January, 2013 NGP transferred its 100% interest in NGP Blue Mountain HoldCo LLC (“BM HoldCo”) to Blue Mountain Power, LLC, a company owned by EIG Global Energy Partners. BM HoldCo holds a 100% interest in NGP Blue Mountain I LLC (“NGP 1”) which in turn owns all of the project assets including leases, operating permits and licenses, the power plant, well field, and all other physical or contractual assets of the Blue Mountain Project.
As a result of the debt restructuring, Alternative Earth Resources now operates the Faulkner 1 power plant, under contract to Blue Mountain Power LLC (a subsidiary of EIG Global Energy Partners), through its subsidiary Nevada Geothermal Operating Company LLC.
During this restructuring, the plant began to shift injection locations to avoid previously noted injection returns that cooled the geothermal fluids in the production zone too quickly. The revised and recalibrated GeothermEx reservoir model using production data indicates that the re-distribution of injection to 3 wells (58A-15, 38-14 and 89-11) would allow for contracted power requirements to be met for the remaining 17 years of the plant. Two of the injectors would shift injection farther to the northeast and northwest, and one producer would target the inferred zone of deep western heat after
injection in this area has been relocated. Annual, updated reservoir simulation modeling is now required under the company’s loan agreement. Bradys, Churchill County – Ormat Technologies
In January 2013, the BLM approved a request to implement a well stimulation program at Bradys to initiate development and testing of a reservoir using enhanced geothermal system technology (EGS). This new technology will be implemented near the existing field that is currently producing 26.1 MW (gross) of power. The EGS project is partially supported by a grant from the US Department of Energy to support their long term goals of demonstrating EGS technologies.
Coyote Canyon, Churchill County – Terra-Gen Power
Terra-Gen Power (TGP) has proposed construction of a 62 megawatt geothermal power plant at Coyote Canyon. This property is located on 3,960 acres of Federal and 760 acres of private lands within Dixie Valley. Plans are to deliver power to an existing transmission line via a short tie-in line from the new power plant. In 2012, TGP received authorization from the Carson City BLM office to begin exploration activities at their Coyote Canyon South property, which is directly south of the Coyote Canyon geothermal project area previously analyzed. Up to 15 wells were proposed to be drilled to 6,000 to 10,000 ft (1,830-3,048 m). In 2013, the BLM issued a Decision Record for Terra-Gen to proceed with development of the property. However, no drilling activity was reported by the Nevada Division of Minerals at Coyote Canyon in 2013.
Dixie Hope, Churchill County – Ormat Technologies
The Dixie Hope geothermal area is located in Dixie Valley at T22N, R35E and has been leased by Ormat Technologies. In 2012, Ormat permitted three thermal gradient wells and drilled two of them to approximately 1000 feet. No additional information is available for this site for 2013 activities. Edwards Creek Area (Tungsten Mountain), Churchill County - Ormat Technologies Inc.
The Edwards Creek project encompasses 4,160 acres (1,683 ha) along 6 miles (9.6 kilometers) of the Clan Alpine Mountains range-front fault in T21N, R38E, Churchill County. Areas of hydrothermal alteration occur along the fault, and boiling water was encountered at shallow depths by 23 mineral exploration wells. Cation and silica geothermometer temperatures from well waters suggest an approximately ~347°F (175°C) reservoir. The Great Basin Center for Geothermal Energy identified a shallow (2 m) thermal anomaly that coincides with the location of the hot mineral exploration wells at the site
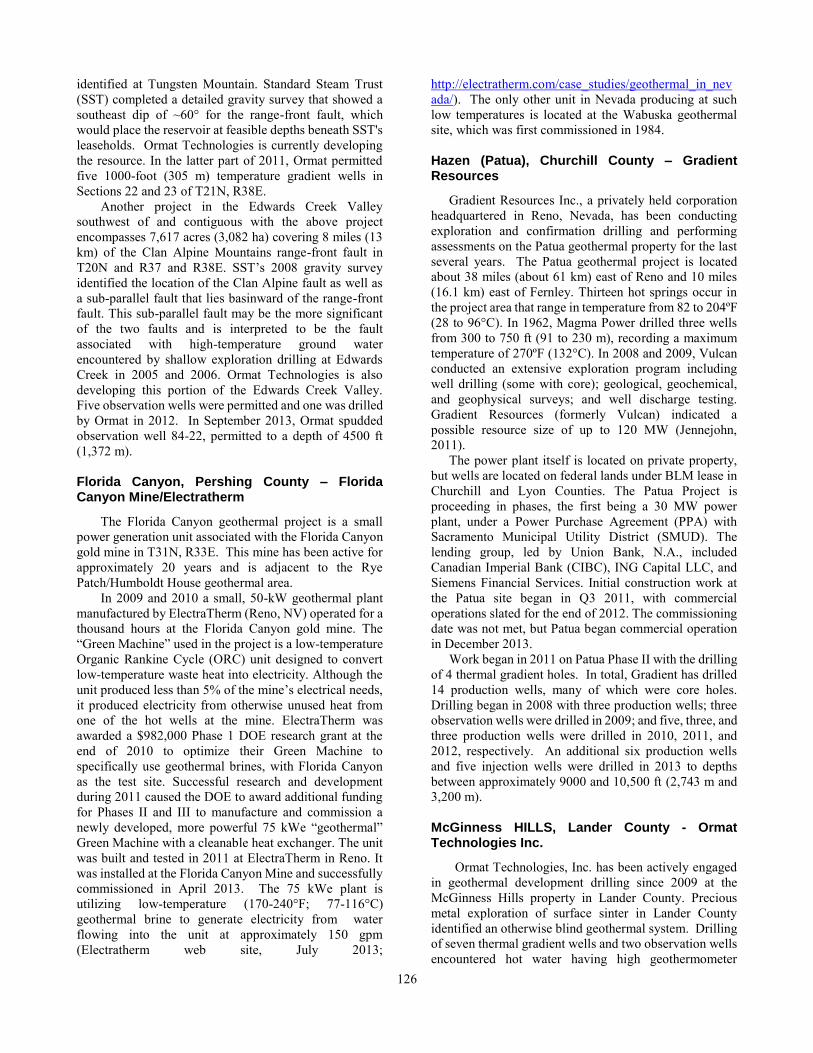
126
identified at Tungsten Mountain. Standard Steam Trust (SST) completed a detailed gravity survey that showed a southeast dip of ~60° for the range-front fault, which would place the reservoir at feasible depths beneath SST's leaseholds. Ormat Technologies is currently developing the resource. In the latter part of 2011, Ormat permitted five 1000-foot (305 m) temperature gradient wells in Sections 22 and 23 of T21N, R38E.
Another project in the Edwards Creek Valley southwest of and contiguous with the above project encompasses 7,617 acres (3,082 ha) covering 8 miles (13 km) of the Clan Alpine Mountains range-front fault in T20N and R37 and R38E. SST’s 2008 gravity survey identified the location of the Clan Alpine fault as well as a sub-parallel fault that lies basinward of the range-front fault. This sub-parallel fault may be the more significant of the two faults and is interpreted to be the fault associated with high-temperature ground water encountered by shallow exploration drilling at Edwards Creek in 2005 and 2006. Ormat Technologies is also developing this portion of the Edwards Creek Valley. Five observation wells were permitted and one was drilled by Ormat in 2012. In September 2013, Ormat spudded observation well 84-22, permitted to a depth of 4500 ft (1,372 m).
Florida Canyon, Pershing County – Florida Canyon Mine/Electratherm
The Florida Canyon geothermal project is a small power generation unit associated with the Florida Canyon gold mine in T31N, R33E. This mine has been active for approximately 20 years and is adjacent to the Rye Patch/Humboldt House geothermal area.
In 2009 and 2010 a small, 50-kW geothermal plant manufactured by ElectraTherm (Reno, NV) operated for a thousand hours at the Florida Canyon gold mine. The “Green Machine” used in the project is a low-temperature Organic Rankine Cycle (ORC) unit designed to convert low-temperature waste heat into electricity. Although the unit produced less than 5% of the mine’s electrical needs, it produced electricity from otherwise unused heat from one of the hot wells at the mine. ElectraTherm was awarded a $982,000 Phase 1 DOE research grant at the end of 2010 to optimize their Green Machine to specifically use geothermal brines, with Florida Canyon as the test site. Successful research and development during 2011 caused the DOE to award additional funding for Phases II and III to manufacture and commission a newly developed, more powerful 75 kWe “geothermal” Green Machine with a cleanable heat exchanger. The unit was built and tested in 2011 at ElectraTherm in Reno. It was installed at the Florida Canyon Mine and successfully commissioned in April 2013. The 75 kWe plant is utilizing low-temperature (170-240°F; 77-116°C) geothermal brine to generate electricity from water flowing into the unit at approximately 150 gpm (Electratherm web site, July 2013;
http://electratherm.com/case_studies/geothermal_in_nevada/). The only other unit in Nevada producing at such low temperatures is located at the Wabuska geothermal site, which was first commissioned in 1984.
Hazen (Patua), Churchill County – Gradient Resources
Gradient Resources Inc., a privately held corporation headquartered in Reno, Nevada, has been conducting exploration and confirmation drilling and performing assessments on the Patua geothermal property for the last several years. The Patua geothermal project is located about 38 miles (about 61 km) east of Reno and 10 miles (16.1 km) east of Fernley. Thirteen hot springs occur in the project area that range in temperature from 82 to 204ºF (28 to 96°C). In 1962, Magma Power drilled three wells from 300 to 750 ft (91 to 230 m), recording a maximum temperature of 270ºF (132°C). In 2008 and 2009, Vulcan conducted an extensive exploration program including well drilling (some with core); geological, geochemical, and geophysical surveys; and well discharge testing. Gradient Resources (formerly Vulcan) indicated a possible resource size of up to 120 MW (Jennejohn, 2011).
The power plant itself is located on private property, but wells are located on federal lands under BLM lease in Churchill and Lyon Counties. The Patua Project is proceeding in phases, the first being a 30 MW power plant, under a Power Purchase Agreement (PPA) with Sacramento Municipal Utility District (SMUD). The lending group, led by Union Bank, N.A., included Canadian Imperial Bank (CIBC), ING Capital LLC, and Siemens Financial Services. Initial construction work at the Patua site began in Q3 2011, with commercial operations slated for the end of 2012. The commissioning date was not met, but Patua began commercial operation in December 2013.
Work began in 2011 on Patua Phase II with the drilling of 4 thermal gradient holes. In total, Gradient has drilled 14 production wells, many of which were core holes. Drilling began in 2008 with three production wells; three observation wells were drilled in 2009; and five, three, and three production wells were drilled in 2010, 2011, and 2012, respectively. An additional six production wells and five injection wells were drilled in 2013 to depths between approximately 9000 and 10,500 ft (2,743 m and 3,200 m).
McGinness HILLS, Lander County - Ormat Technologies Inc.
Ormat Technologies, Inc. has been actively engaged in geothermal development drilling since 2009 at the McGinness Hills property in Lander County. Precious metal exploration of surface sinter in Lander County identified an otherwise blind geothermal system. Drilling of seven thermal gradient wells and two observation wells encountered hot water having high geothermometer
127
temperatures, leading to a November 2009 announcement of a 20-year power purchase agreement (PPA) between Ormat Technologies, Inc. and NV Energy. Five production wells were drilled in 2010 and three in 2011. As development continued one injection well was drilled in 2012. Construction of a 30 MWe (net) plant began in 2010 and continued through 2012. Commercial production at McGinness Hills commenced July 26, 2012. This air-cooled binary power plant, with a 36 MW (net) capacity, has been providing 30 MW to the NV Energy transmission system since July 2012. Five of the wells drilled have very high flow rates of 2350 gpm (8,900 l/min), which is only limited by pump capacity (Nordquist and Delwiche, 2013). As such, an additional Organic Rankine Cycle (ORC) unit was installed in 2013 after only one year of operation, bringing the total field production to 52 MW (nameplate capacity). New wells drilled in 2013 included two production wells drilled to depths of approximately 5000 ft (1,524 m) and one observation well of approximately 4000 ft (1,219 m). Salt Wells, Churchill County – Enel North America
On March 20, 2007, Enel North America, Inc. (a subsidiary of Enel S.p.A., Italy) purchased AMP Resources, LLC from AMP Capital Partners and a minority investor. Salt Wells is one of the two properties acquired by Enel, the other being Stillwater. In April 2009, Enel North America inaugurated its new 18 MW gross-capacity binary geothermal power plant at Salt Wells, bringing the power plant facility to two binary power units in Sections 23, 24, 25, 26, 35, and 36 of T17N, R30E. Enel continued active drilling at Salt Wells with three additional observation wells and one production well drilled in 2012. Previous (2009-2010) exploration and drilling activity by Vulcan (now Gradient Resources) and Ormat in the Salt Wells/Eightmile Flat area are apparently on hiatus, as these companies focus efforts on other properties. However, Enel added a new production well to the south end of their field in 2013, discontinuing use of the production well in the northernmost part of the field (Hinz et al., 2014)
San Emidio Geothermal Areas, Washoe County- Us Geothermal
In 2007, U.S. Geothermal, Inc. (USG) announced the completion of a transaction with Michael Stewart and Empire Geothermal Power to acquire the Empire geothermal power plant and 28,358 acres of geothermal leases and ground-water rights in Washoe County (T29N, R23E) for $16.62 million. The transaction also included assets from Granite Creek. The San Emidio property includes the Empire power plant and approximately 22,944 acres of leases and ground-water rights.
U.S. Geothermal had plans to develop a 35-megawatt power project for the San Emidio resource. A $75- to $85-million-plan called for the construction of twin binary-
cycle plants, with the anticipation that the current well field could provide approximately 75% of the geothermal fluid requirement for one of the binary plants, and an expanded production and injection well field could be drilled to provide the balance of the needed geothermal fluid for the second phase, to make, in total, a 27-megawatt development (U.S. Geothermal, Inc. http://www.usgeothermal.com and Nevada Geothermal Update, Nevada Division of Minerals, May 2008). The development was planned in two stages: repower and expansion. During the first stage, the existing 3.6 MW plant was replaced with a new, more efficient 11.75-MW power plant (8.6 MW net) that utilizes the existing, proven geothermal reservoir. The second stage requires drilling new production wells and the construction of an upgraded transmission line to allow for increased power production. This expansion is expected to produce an additional 26 MW.
Regarding exploration at San Emidio, U.S. Geothermal encountered the highest temperatures found to date at the property (160°C, 320°F) after deepening well 45-21 beyond 800 feet (244 m). Also in Section 21, well OW-10 intersected 300°F (149°C) temperatures with accompanying permeability. Several kilometers east of the plant area, U.S. Geothermal drilled three <3,000-foot (<914 m) observation wells in Section 16. One of these wells, OW-8, encountered shallow- and intermediate-depth permeable zones and had a recorded bottom-well temperature of 315°F (157°C).
In January, 2012, U.S. Geothermal Inc. announced that the Nevada Public Utility Commission approved a 19.9 megawatt amended power purchase agreement (PPA) with its wholly owned subsidiary, U.S. Geothermal Nevada LLC, for the San Emidio Project. The amended PPA expands the existing 3.6 megawatt agreement to provide for the purchase of electric power by the Sierra Pacific Power Company ("SPCC") for up to 19.9 MW from two power generation units at San Emidio. The PPA has a term of 25 years with the starting price for power of $89.75 per megawatt-hour subject to an annual escalation rate of 1%. The new Phase I power plant, which is an 8.6 megawatt (net) water cooled facility, was constructed to replace the original plant using no additional wells. This new unit uses the cost-efficient working fluid R134a, which is non-flammable, non-toxic and non-corrosive, reducing capital and operating costs.
In early 2012, U.S. Geothermal started performance testing on the new facility. Performance testing included guaranteed output, capacity, reliability, and continuous operation tests that the plant must pass to achieve commercial operation under the PPA. The plant experienced several operational and mechanical issues that were resolved to eliminate difficulties that include defective capacitors, the mechanical failure of the 2,500 horsepower process pump, and excessive vibration in the turbine gear box.
Commercial operations began in May 2012, and the new San Emidio plant is projected to generate

128
approximately 75,000 MWh of electrical power each year under a 25 year power purchase agreement with Sierra Pacific Power. The old unit that this plant replaces, generated approximately 23,000 MWh annually for 20 years (since 1987). Hence, the new, more efficient TAS unit is producing more than double the power output of the aging unit, while using no additional wells. In March, 2013, U.S. Geothermal Nevada LLC received the final $1.05 million balance of its $11.75 million grant from the U.S. Department of Treasury, which is a cash grant for Specified Energy Property in Lieu of Tax/Credits relating to the San Emidio geothermal power plant expansion project. Power availability for the fourth quarter of 2013 was reported at 98.3%, with generation in December averaging 9.96 net megawatts per hour for all hours the unit was in service. Under the terms of the PPA, generation during the quarter was paid at the price of $90.27 per megawatt-hour. For 2014, the contract price will increase from $90.27 to $91.17 per megawatt-hour.
Drilling for Phase II began in September 2013, with one observation well being completed in 2013.
Silver Peak, Esmeralda County – Rockwood Lithium
Silver Peak Hot Springs are located near the western edge of Clayton Valley playa, just north of Silver Peak (shown at NW¼ SE¼ SE¼ Sec. 15, T2S, R39E on the Goldfield 30´x 60´ topographic map). Eleven springs were originally reported in the area, and the water was used for the municipal water supply (Waring, 1965). By 1980, the site was reported to be dry (Trexler et al., 1981; Table E2).
The springs had a maximum reported temperature of 118°F (47.8°C; Waring, 1965). Mariner et al. (1983, p. 105) estimated the reservoir temperature to be 284 ºF and 288ºF (140ºC and 142ºC) using silica and Na-K-Ca geothermometers, respectively, and Reed et al. (1983, p. 40) reported a flow rate of 1,890 L/min. Silver Peak Hot Springs were reportedly quite radioactive, but contained very small amounts of uranium (Garside, 1973).
A mild thermal anomaly can be found 3 km SW of Silver Peak at the 76ºF (24.6ºC) monitor well pumping station (Sec. 28, T2S, R39E). NBMG field samplers were allowed access in June 2008 by Chemetall Foote. The estimated reservoir temperatures are 167ºF (74.8ºC; Ca-Na-K; Fournier and Potter, 1979) and 152ºF (66.8ºC; chalcedony; Fournier, 1977). A monitor well 1 km NE measured warm (no temperature specified) (Jennings, personal comm., 2008), as did a second pumping station well (26ºC; NWIS Well 143 S02 E39 28BDBB1; see Penfield et al., 2012).
Chemetall Foote (a subsidiary of Rockwood Lithium, the operator at Silver Peak) plans to double the capacity of its lithium carbonate production. Rockwood obtained a Department of Energy grant to be used to help install a geothermal power plant at the site, which the company hopes will supply the majority of electric power needs for the lithium mine (Company web site:
http://www.rockwoodlithium.com/news_events/news/news_1089.en.html, July 2013). Toward this end, Rockwood Lithium drilled one observation well that was permitted as a geothermal well to a depth of approximately 5,000 ft (1,524 m) in December, 2012. No additional information is available for 2013. Stillwater, Churchill County – Enel North America
In 2004, AMP Resources, LLC, purchased the Stillwater Power Plant and associated geothermal resources from Stillwater Holdings, LLC. In August 2005 AMP Resources applied to the Nevada Public Utilities Commission (PUC) for a permit to construct a 37-MW binary geothermal power plant adjacent to the existing Stillwater power plant. In May 2006 the PUC approved a permit to build a 26-MW power plant to replace the existing Stillwater plant, online since 1989. Enel North America subsequently acquired the Stillwater property from AMP Resources
On November 16, 2007 Enel Stillwater, LLC received a special use permit from Churchill County to construct the Stillwater 2 power plant. In April 2009, Enel North America, Inc., a subsidiary of Enel S.p.A., Italy, inaugurated its new 47.2 MW gross-capacity Stillwater binary plant.
In 2011, Enel commissioned the first hybrid geothermal-solar power plant in the world, with plant capacities of 24 MW (solar) and 33.1 MW (geothermal) (http://www.enelgreenpower.com/en-GB/ena/).
In March 2012, Enel Green Power (through its subsidiary Enel Green Power North America) expanded the capacity of the Stillwater solar power plant from 24 MW to 26 MW (89,000 solar panels). Enel subsequently won the 2012 Geothermal Energy Association Technology Advancement Award for its unique contributions to advancing geothermal power production. The Enel geothermal-solar hybrid unit has the advantages of increased power production from the solar plant during times of decreased efficiency in geothermal power production in mid-day in the summer months. And when the solar unit produces less power in the winter months, geothermal power production is more efficient. This allows the hybrid plant to better follow the power-demand load. One additional injection well was drilled in 2013. Tuscarora, Elko County (Hot Sulphur Springs) – Ormat Technologies, Inc.
The Tuscarora geothermal project is located on the west side of the Independence Mountains at the north end of the Independence Valley graben. The geothermal area includes six springs, one geyser, and one fumarole. These occur in a narrow zone approximately 3 km long within a small accommodation zone in a broad step over between two west-dipping range-front faults (Dering and Faulds, 2012). Waters from the hot springs were analyzed and subsurface temperatures of 442ºF and 333ºF (228ºC and 167ºC) were indicated by the Na-K-Ca and silica
129
geothermometers, respectively. In an AMAX Exploration, Inc., Tuscarora Area, Nevada, Final Report, (August 1981, NBMG files), H.D. Pilkington reported that a test discovery well, with a total depth of 5,454 feet (1,662 m), encountered a low-temperature reservoir. There was some difficulty in completing the well due to some lost circulation zones. Drilling on the well had to be stopped short of target and before a high temperature reservoir was discovered. The well was flow tested at approximately 1,200 barrels per hour with temperatures ranging from 156º to 225ºF (69º to 108ºC). In 2003-2004 Earth Power Resources, which had the lease on the resource rights at that time, discovered a geothermal resource over 330ºF (166ºC) between the depths of 2,950 and 3,810 feet (900 and 1,161 m). Eventually, this lease was transferred to TG Power LLC.
In 2007, TG Power LLC began to move forward with the development of a 48-MW-net power plant at Hot Sulphur Springs. However, no activity occurred on the property in 2008 and 2009. Ormat Technologies ultimately acquired the leases to the property and drilled 3 production wells in 2010 for the planned 18 MW power plant. Work on Ormat’s 30 MW (gross), 18 MW (net) air-cooled binary plant continued through 2011 and achieved commercial production in the first quarter of 2012. Production continued into 2013, and 3 additional observation wells were drilled to depths of approximately 4000 ft (1,219 m).
The success of the Tuscarora project is the result of years of work by several private companies. Earth Power Resources signed a PPA with NV Energy but did not demonstrate commercial viability, and sold the project to TG Power in 2006. TG Power drilled a production hole in 2007, but ran out of money and sold the project to the Energy Investment Fund in 2008. After the passage of Nevada’s bill AB522 in 2009, ORMAT became interested in Tuscarora and developed a commercially viable project in 2012 with a capacity of 32 MW. (http://www.elkocountynv.net/meetings/board_of_commissioners/docs/Ormat.pdf). Wild Rose, Mineral County – Ormat Technologies
Ormat Technologies is developing the blind geothermal project at Wild Rose, located in Gabbs Valley approximately 22 miles (35 km) west of Gabbs, NV, in Mineral County. This resource is also known as Don Campbell for the power plant, and Deadhorse Wells by the BLM. This system is apparently associated with a series of synthetic and antithetic NE-striking, moderately to steeply dipping normal faults linked to dextral faults in the east-central part of the Walker Lane Belt (Orenstein and Delwiche, 2014).
Resource development includes a 15-35MW net (up to 40 MW gross) geothermal power plant and electrical substation, which includes construction and operation of a 22-mile (35 km), 120-kV generation-tie to Highway 261,
along with a switching station. In 2010, anomalously high temperatures up to 267°F (130°C) were encountered at depths within 200 ft (61 m) of the surface. One observation well was completed in 2011, and one injection, one observation, and three production wells were completed in 2012 to depths of 1,500 to 1,800 ft (457 to 549 m) (permitted depths). By the end of 2012, all wells required to operate the power plant had been drilled. An additional 3000 ft (914 m) observation well was drilled in 2013.
In April 2013, Ormat entered into a 20-year Power Purchase Agreement (PPA) with Southern California Public Power Authority (SCPPA) to deliver electricity from their new 16 MW (net) Wild Rose power plant. Construction on the plant and surface piping began in the spring of 2013. The binary, air-cooled power plant came into firm operation in December 2013 ahead of schedule and below budget, producing a low temperature (260°F; 127°C) resource for power generation (Orenstein and Delwiche, 2014). Ormat is selling the power to SCPPA at $99 per megawatt hour (no annual escalation). SCPPA is reselling the power to the Los Angeles Department of Water and Power (LADWP) and Burbank Water and Power (BWP). The power is transmitted to LADWP and BWP through NV Energy’s transmission system. Acknowledgments
The authors thank Lowell Price (Nevada Division of Minerals) for his data, assistance, and review of this paper and Dr. James Faulds for his review comments on this paper.
References
BLM, 2013, Prior Sales and Results, http://www.blm.gov/nv/st/en/prog/minerals/leasable_minerals/geothermal0/ggeothermal_leasing/prior_sales.html BLM, 2014, Geothermal Leasing, http://www.blm.gov/nv/st/en/prog/minerals/leasable_minerals/geothermal0/ggeothermal_leasing.html Dering, G. and Faulds, J., 2012, Structural Controls of the Tuscarora Geothermal Field, Elko County, Nevada: Geothermal Resources Council Transactions, v. 36, p. 41–46. Department of Taxation (Division of Assessment Standards), 2014, 2013-2014 Net Proceeds of Minerals Bulletin. April 30, 2014, 49 p. http://tax.nv.gov/LocalGovt/PolicyPub/ArchiveFiles/Net_Proceeds_of_Minerals/ Drakos, P., Spielman, P., and Bjornsson, G., 2010, Jersey Valley exploration and development: Geothermal Resources Council Transactions, v. 25, p. 751–759.

130
Garside, L.J., 1973, Radioactive Mineral Occurrences in Nevada: Nevada Bureau of Mines and Geology Bulletin 81. GEA, 2014, 2014 Annual U.S. & Global Geothermal Power Production Report - April 2014: Geothermal Energy Association, 25 p. http://geo-energy.org/events/2014%20Annual%20US%20&%20Global%20Geothermal%20Power%20Production%20Report%20Final.pdf Hinz, N.H., Faulds, J.E., and Coolbaugh, M., 2014, Association of Fault Terminations with Fluid Flow in the Salt Wells Geothermal Field, Nevada, USA: Geothermal Resources Council Transactions v. 38, p. 3–10. Jennejohn, D., 2011, Annual U.S. Geothermal Power Production and Development Report, April, 2011: Geothermal Energy Association, 59 p. Mariner, R.H., Brook, C.A., Reed, M.J., Bliss, J.D., Rapport, A.L., and Lieb, R.J., 1983, Low-Temperature Geothermal Resources in the Western United States, in Reed, M.J., (Editor), Assessment of Low-Temperature Geothermal Resources of the United States-1982: U.S. Geological Survey Circular 892, p. 31–50. Mariner, R.H., Rapp, J.B. , Willey, L.M., and Presser, T.S., 1974, The chemical composition and estimated minimum thermal reservoir temperatures of the principal hot springs of northern and central Nevada: U.S. Geological Survey Open File Report 74-1066, 35 p. Nordquist, J. and Delwiche, B., 2013, The McGinness Hills Geothermal Project: Geothermal Resources Council Transactions, v. 37, p. 57–64. NV Energy, 2011, NV Energy portfolio standard annual report; Compliance year 2010, April 1, 2011 (available on the Public Utilities Commission of Nevada website; Docket #11-04001), 328 p. http://pucweb1.state.nv.us/PDF/AxImages/DOCKETS_2010_THRU_PRESENT/2011-4/8199.pdf Niggemann, K., Samuel, A., Morriss, A. V., and Hernández, R., 2009, Foamed cementing geothermal 13 3/8-in. intermediate casing – NGP #61-22: Geothermal Resources Council Transactions, v. 33, p. 217–222. Orenstein, R and Delwiche, B., 2014, The Don A. Campbell Geothermal Project: Geothermal Resources Council Transactions, v. 38, p. 91–97. Parr, A. J., and Percival, T. J., 1991, Epithermal Gold Mineralization and a Geothermal Resource at Blue Mountain, Humboldt County, Nevada: Geothermal Resources Council Transactions, v. 15, p. 35–39.
Reed, M.J., Mariner, R.H., Brook, C.A., and Sorey, M.L., 1983, Selected Data for Low Temperature (Less Than 90 Degrees C) Geothermal Systems in the United States; (Reference Data for USGS Circular 892): U.S. Geological Survey Open-File Report 83 250, 129 p. Shevenell, L., and Zehner, R., 2011, Status of Nevada geothermal resource development – Spring 2011: Geothermal Resources Council Transactions, v. 35, p. 67–72. Stewart, J.H. and Carlson, J.E.,1976, Geologic map of north-central Nevada, 1:250,000. Nevada Bureau of Mines and Geology Map 50. Trexler, D.T., Koenig, B.A., Flynn, T., Bruce, J.L., and Ghusn, G., Jr., 1981, Low-to-Moderate Temperature Geothermal Resource Assessment for Nevada; Area Specific Studies, Final Report, June 1, 1980-August 30, 1981: U.S. Department of Energy, DOE/NV/10039 3, 203 p. Waring, G.A., 1965, Thermal Springs of the United States and Other Countries of the World: U.S. Geological Survey Professional Paper 492, 383 p.
Geothermal Bibliography and Web Links to Other Geothermal Information
For further information on geothermal resources in Nevada check the following Websites or contact David Davis at (775) 682-8766 or via e-mail at [email protected]:
Map of Geothermal Resources in Nevada, NBMG Map 161, available online in PDF-file format: http://www.nbmg.unr.edu/Geothermal/PublishedMaps.html# (includes zipped file of GIS layers)
Nevada Bureau of Mines and Geology Geothermal Resources of Nevada Website at http://www.nbmg.unr.edu/geothermal/gthome.htm. This site contains geothermal exploration data, interactive maps, lease and information, and numerous geothermal digital data sets. These data are increasingly being made available through the National Geothermal Data System (www.geothermaldata.org )
Nevada Commission on Minerals, Nevada Division of Minerals at http://minerals.state.nv.us/ .
GEO-HEAT CENTER, at http://geoheat.oit.edu/, Oregon Institute of Technology, Klamath Falls, Oregon. This site focuses on direct use applications of geothermal energy.
The Renewable Resource Data Center (RReDC) provides access to an extensive collection of renewable energy resource data, maps, and tools. Geothermal, biomass,

131
solar, and wind resource data for locations throughout the United States on the RReDC site at http://www.nrel.gov/rredc/.
Southern Methodist University Geothermal Lab, specializing in geothermal gradient data and maps of the entire country, posts information at http://www.smu.edu/geothermal/.
Summary of Supporting Data for USGS Regional Heat-flow Studies of the Great Basin, 1970-1990, by John H. Sass, Susan S. Priest, Arthur H. Lachenbruch, S. Peter Galanis, Jr., Thomas H. Moses, Jr., John P. Kennelly, Jr., Robert J. Munroe, Eugene P. Smith, Frederick V. Grubb, Robert H. Husk, Jr., and Charles W. Mase; USGS Open-File Report 2005-1207 online version 1.0 on the Web at http://pubs.usgs.gov/of/2005/1207/.
Geothermal Industry Temperature Profiles from the Great Basin, by John H. Sass, Susan S. Priest, Arnold J. Blanton, Penelope C. Sackett, Stephanie L. Welch, and Mark A. Walters; USGS Open-File Report 99-425 online
version 1.0 on the Web at http://pubs.usgs.gov/of/1999/of99-425/webmaps/home.html .
The Bureau of Land Management Land and Mineral Records-LR2000 system Web address is http://www.blm.gov/lr2000/. Provides reports on BLM land and mineral use authorizations for oil, gas, and geothermal leasing, rights-of-ways, coal and other mineral development, land and mineral title, mining claims, withdrawals, classifications, and more on federal lands or on federal mineral estate. The U.S. Department of Energy (DOE) Geothermal Technologies Program (http://www1.eere.energy.gov/geothermal/) Scientific and Technical Information (OSTI) have scanned approximately 3,300 agency and national lab technical reports. These files are in a PDF, full-text-searchable format and accessible online at http://www.osti.gov/energycitations/ .

132
Oil and Gas by David A. Davis
PRODUCTION
According to the Nevada Division of Minerals, Nevada’s net oil production in 2013 was 335,672 barrels, which accounted for 0.012% of total domestic production. Production was down 9% from 367,994 barrels in 2012. Production came from 63 actively producing wells in ten fields in Railroad Valley in Nye County, which accounted for 87% of the state’s production, and seven wells in three fields in Pine Valley in Eureka County. One other minor field was shut in throughout 2013, and four other minor fields were plugged and abandoned. Nevada ranked 27th out of the 31 oil-producing states (http://www.eia.gov). According to the Nevada Division of Minerals (NDOM), the average per barrel net wellhead price for Nevada crude oil was $93.69 in 2013, which was an increase of 3% from $91.02 in 2012. The gross yield decreased 6% to $31,448,896.50 from $33,494,026 in 2012 (2013-2014 Net Proceeds of Minerals Bulletin). Most of Nevada’s oil is used to make such products as No. 1 and No. 2 diesel fuel, kerosene, stove oil, and asphalt. Nevada crude oil was transported in batches by trucks to the 8,000-barrel-per-day capacity refinery near Currant in Railroad Valley, which is owned by Foreland Refining Corporation.
Production from Nevada’s 70 actively producing wells ranged up to 102 barrels of oil per day and up to 3,292 barrels of water per day. The daily averages were 18 barrels of oil and 300 barrels of water per day. Thirty-seven wells were strippers (wells producing less than ten barrels of oil per day), and six produced more than 40 barrels of oil per day. Twenty-seven other wells listed as producers were shut in for the entire year. Of these, five had been shut in since 2012 and 18 had been shut in since before 2000.
For the third year in a row, Grant Canyon No. 10 in Railroad Valley was Nevada’s most productive well in 2013. It averaged 102 barrels of oil and 859 barrels of water per day. It went into production in May 2010 after being plugged and abandoned for 17 years. Nevada’s second highest producer in 2013 was Munson Ranch 12-43. It averaged 50 barrels of oil and 1.5 barrel of water per day. Trap Spring No. 19, which averaged 44 barrels of oil and 34 barrels of water per day, ranked third. Next, the 2013 activities of Nevada oil fields are summarized in alphabetical order.
The Bacon Flat Field in Railroad Valley averaged 18 barrels of oil and five barrels of water per day and accounted for less than 2% of Nevada’s total oil production. The field produces from dolomite in the Devonian Guilmette Formation between about 4,960-5,350 feet. Only one well has been active in the field for the last 20 years. The field also had two inactive producers.
The Blackburn Field in Pine Valley (Fig. 1) produces from the Oligocene Indian Well Formation (tuff and tuffaceous sandstone), the Mississippian Chainman Shale
(sandstone), and the Devonian Nevada Formation (dolomite) from depths between about 6,700 and 6,750 feet. The field had six active producers, four of which were active for more than 325 days and two for less than 45 days. Spread over the year, production for the field averaged 111 barrels of oil and 3,520 barrels of water per day, and accounted for 12% of Nevada’s total oil production. Oil production from the field increased 6%, and water production decreased 9% from 2012. Daily per well oil production ranged between 13 and 45 barrels and averaged 28 barrels. Daily per well water production ranged between 53 and 2,410 barrels and averaged 895 barrels. Oil production increased in two wells and decreased three wells, and one well was brought back on line after being shut in since 2009. The field also had one inactive producer.
The Eagle Springs Field in Railroad Valley produces from Oligocene ignimbrites, the Eocene Sheep Pass Formation (lacustrine carbonates), and the Pennsylvanian Ely Limestone between about 5,780 and 7,360 feet. The field had 12 active producers. The average amount of days that these wells were producing was 226 days. Spread over the year, production for the field averaged 109 barrels of oil and 1,029 barrels of water per day and accounted for 12% of Nevada’s total oil production (Fig. 2). Oil production decreased 10% and water production increased 4% from 2012. Daily per well oil production ranged between 1 and 18 barrels and averaged 13 barrels. Daily per well water production ranged between 2 and 565 barrels and averaged 167 barrels. Oil production increased in four wells and decreased in eight wells. The four wells that produced in 2012 were shut in throughout 2013. The field also had five other inactive producers, and a producer now used as a water disposal well.
The Ghost Ranch Field in Railroad Valley produces from dolomites of the Devonian Guilmette Formation between about 4,350 and 4,620 feet. In 2013, the field had four active producers, all of which produced the entire year. The field averaged 47 barrels of oil and 1,645 barrels of water per day and accounted for 5% of Nevada’s total oil
Figure 1. Chart showing oil production from the Blackburn Field in Pine Valley in Eureka County, from 1983 to 2013.
0
100
200
300
400
500
600
700
19
83
19
87
19
91
19
95
19
99
20
03
20
07
20
11
Oil
prod
uct
ion
(1,0
00 b
arre
ls) Blackburn
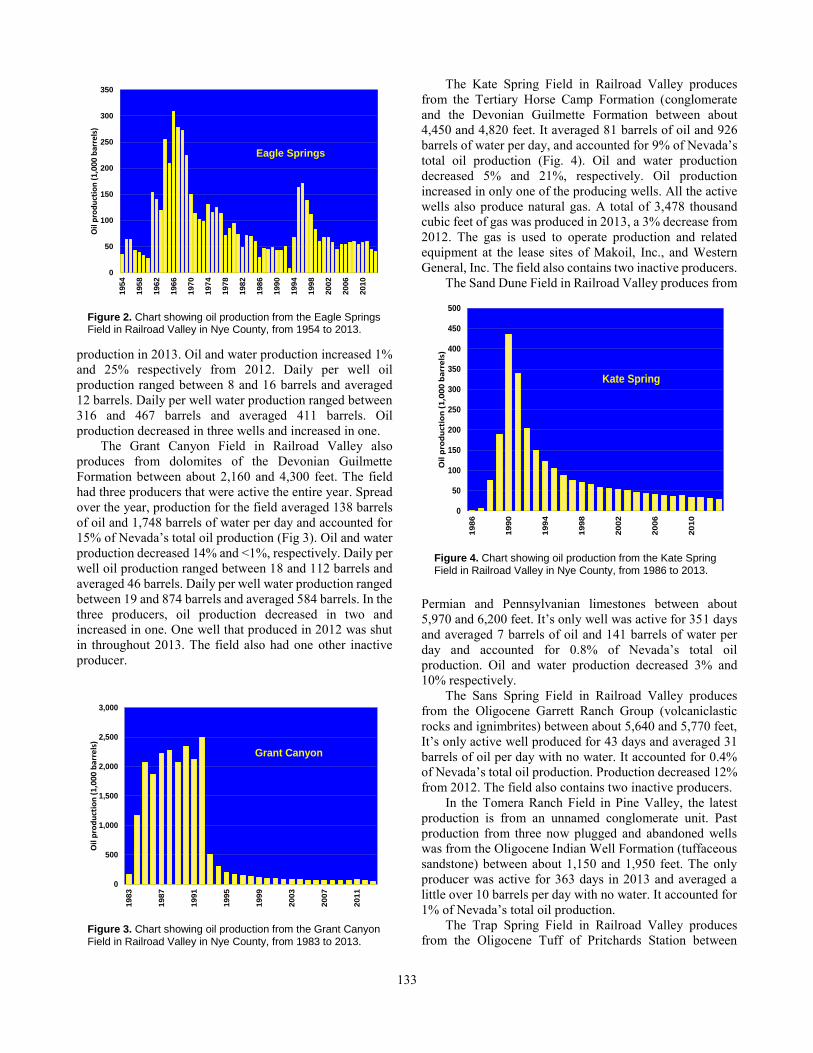
133
production in 2013. Oil and water production increased 1% and 25% respectively from 2012. Daily per well oil production ranged between 8 and 16 barrels and averaged 12 barrels. Daily per well water production ranged between 316 and 467 barrels and averaged 411 barrels. Oil production decreased in three wells and increased in one.
The Grant Canyon Field in Railroad Valley also produces from dolomites of the Devonian Guilmette Formation between about 2,160 and 4,300 feet. The field had three producers that were active the entire year. Spread over the year, production for the field averaged 138 barrels of oil and 1,748 barrels of water per day and accounted for 15% of Nevada’s total oil production (Fig 3). Oil and water production decreased 14% and <1%, respectively. Daily per well oil production ranged between 18 and 112 barrels and averaged 46 barrels. Daily per well water production ranged between 19 and 874 barrels and averaged 584 barrels. In the three producers, oil production decreased in two and increased in one. One well that produced in 2012 was shut in throughout 2013. The field also had one other inactive producer.
The Kate Spring Field in Railroad Valley produces from the Tertiary Horse Camp Formation (conglomerate and the Devonian Guilmette Formation between about 4,450 and 4,820 feet. It averaged 81 barrels of oil and 926 barrels of water per day, and accounted for 9% of Nevada’s total oil production (Fig. 4). Oil and water production decreased 5% and 21%, respectively. Oil production increased in only one of the producing wells. All the active wells also produce natural gas. A total of 3,478 thousand cubic feet of gas was produced in 2013, a 3% decrease from 2012. The gas is used to operate production and related equipment at the lease sites of Makoil, Inc., and Western General, Inc. The field also contains two inactive producers.
The Sand Dune Field in Railroad Valley produces from
Permian and Pennsylvanian limestones between about 5,970 and 6,200 feet. It’s only well was active for 351 days and averaged 7 barrels of oil and 141 barrels of water per day and accounted for 0.8% of Nevada’s total oil production. Oil and water production decreased 3% and 10% respectively.
The Sans Spring Field in Railroad Valley produces from the Oligocene Garrett Ranch Group (volcaniclastic rocks and ignimbrites) between about 5,640 and 5,770 feet, It’s only active well produced for 43 days and averaged 31 barrels of oil per day with no water. It accounted for 0.4% of Nevada’s total oil production. Production decreased 12% from 2012. The field also contains two inactive producers.
In the Tomera Ranch Field in Pine Valley, the latest production is from an unnamed conglomerate unit. Past production from three now plugged and abandoned wells was from the Oligocene Indian Well Formation (tuffaceous sandstone) between about 1,150 and 1,950 feet. The only producer was active for 363 days in 2013 and averaged a little over 10 barrels per day with no water. It accounted for 1% of Nevada’s total oil production.
The Trap Spring Field in Railroad Valley produces from the Oligocene Tuff of Pritchards Station between
Figure 2. Chart showing oil production from the Eagle Springs Field in Railroad Valley in Nye County, from 1954 to 2013.
0
50
100
150
200
250
300
350
19
54
19
58
19
62
19
66
19
70
19
74
19
78
19
82
19
86
19
90
19
94
19
98
20
02
20
06
20
10
Oil
pro
du
ctio
n (
1,0
00
ba
rre
ls)
Eagle Springs
Figure 4. Chart showing oil production from the Kate Spring Field in Railroad Valley in Nye County, from 1986 to 2013.
0
50
100
150
200
250
300
350
400
450
500
19
86
19
90
19
94
19
98
20
02
20
06
20
10
Oil
pro
du
ctio
n (
1,0
00
ba
rre
ls)
Kate Spring
Figure 3. Chart showing oil production from the Grant Canyon Field in Railroad Valley in Nye County, from 1983 to 2013.
0
500
1,000
1,500
2,000
2,500
3,000
1983
1987
1991
19
95
1999
2003
2007
2011
Oil
pro
du
ctio
n (
1,0
00
ba
rre
ls)
Grant Canyon

134
about 3,210 and 4,950 feet. The field had 35 active producers, which each averaged 288 days of production. Spread over the year, production for the field averaged 394 barrels of oil and 6,665 barrels of water per day and accounted for 43% of Nevada’s total oil production (Fig. 5). Daily per well oil production ranged between 2 and 50 barrels and averaged 13 barrels. Daily per well water production ranged between 0 and 3,318 barrels and averaged 192 barrels. Oil and water production decreased 8%, and 1% respectively from 2012. Oil production increased in 13 wells and decreased in 21. One well that had been shut in since 2011 was brought back on line in 2013. The field also contains seven inactive producers.
Two minor fields in Railroad Valley produced 313 barrels of oil. The Currant Field’s only production well averaged 27.7 barrels of oil per day and no water for 7 days. It produced from the Eocene Sheep Pass Formation between about 6,850 and 7,080 feet. The Duckwater Creek Field’s only production well in Railroad Valley averaged 10 barrels of oil and 90 barrels of water per day for 12 days. It produced from the tuffs of the Oligocene Garrett Ranch Group between about 5,680 and 5,830 feet.
The following four minor fields produced in the past but are all now plugged and abandoned. Three Bar in Pine Valley contained three wells which produced from the
Miocene Humboldt Formation, the Oligocene Indian Well Formation, and the Cretaceous Newark Canyon Formation between 5,720 and 7,070 feet. Deadman Creek in Elko County had only one well that produced briefly from the Humboldt Formation between 8,165 and 8,850 feet. Toano Draw in Elko County had only one well that produced from the Humboldt Formation between 8,250 and 8,950 feet.
Production from Nevada’s oil fields (barrels of oil)
Compiled from producer's reports filed with the Nevada Division of Minerals
Field (year discovered) 1954-2004 2005 2006 2007 2008 2009 2010 2011 2012 2013 Total
Eagle Springs (1954) 5,104,150 54,362 54,708 56,992 58,683 53,851 57,394 58,900 44,422 39,819 5,583,281
(Railroad Valley)
Trap Spring (1976) 13,789,885 170,896 163,299 159,821 196,089 181,320 175,352 166,415 156,991 143,909 15,303,977
(Railroad Valley)
Currant (1979) 1493 3 0 81 108 111 109 119 159 194 2,377
(Railroad Valley)
Bacon Flat (1981) 983,964 7,556 8,112 8,301 7,968 7,764 7,427 6,358 5,690 6,447 1,049,587
(Railroad Valley)
Blackburn (1982) 5,091,660 45,369 41,491 39,477 43,600 77,730 57,260 43,198 38,004 40,392 5,518,181
(Pine Valley)
Grant Canyon (1983) 20,789,215 68,944 70,158 62,236 56,247 60,036 68,927 77,683 58,897 50,517 21,362,860
(Railroad Valley)
Kate Spring (1986) 2,160,690 44,288 41,124 38,411 36,863 38,347 33,824 32,719 30,833 29,402 2,486,501
(Railroad Valley)
Spencer Lease (1986) 86 0 0 0 0 0 0 0 0 0 86
(Railroad Valley)
Tomera Ranch (1987) 32,766 0 0 0 0 0 0 0 11,705 3,757 48,228
(Pine Valley)
North Willow Creek (1988) 45214 2,064 2,552 1,256 56 0 0 0 0 0 51,142
(Pine Valley)
Three Bar (1990) 23837 0 0 0 0 0 0 0 0 0 23,837
(Pine Valley)
Duckwater Creek (1990) 17991 185 122 150 120 120 118 115 117 119 19,157
(Railroad Valley)
Sans Spring (1993) 258,501 3,324 3,265 2,971 2,407 1,419 1,494 1,404 1,498 1,318 277,601
(Railroad Valley)
Ghost Ranch (1996) 431,036 37,874 30,255 26,070 23,615 24,011 21,630 18,605 17,022 17,231 647,349
(Railroad Valley)
Deadman Creek (1996) 367 0 0 0 0 0 0 0 0 0 367
(Elko County)
Sand Dune (1998) 93,672 11,878 10,618 10,562 10,467 9,883 3,687 2,483 2,656 2,567 158,473
(Railroad Valley)
Toano Draw (2007) 1,916 48 0 0 0 0 0 1,964
(Elko County)
Total 48,824,527 446,743 425,704 408,244 436,271 454,592 427,222 407,999 367,994 335,672 52,534,968
Change from previous year -4% -5% -4% 7% 4% -6% -4% -10% -9%
Figure 5. Chart showing oil production from the Trap Spring Field in Railroad Valley in Nye County, from 1976 to 2013.
0
200
400
600
800
1,000
1,200
1,400
1976
1980
1984
1988
1992
1996
2000
20
04
2008
2012
Oil
pro
du
ctio
n (
1,00
0 b
arre
ls)
Trap Spring
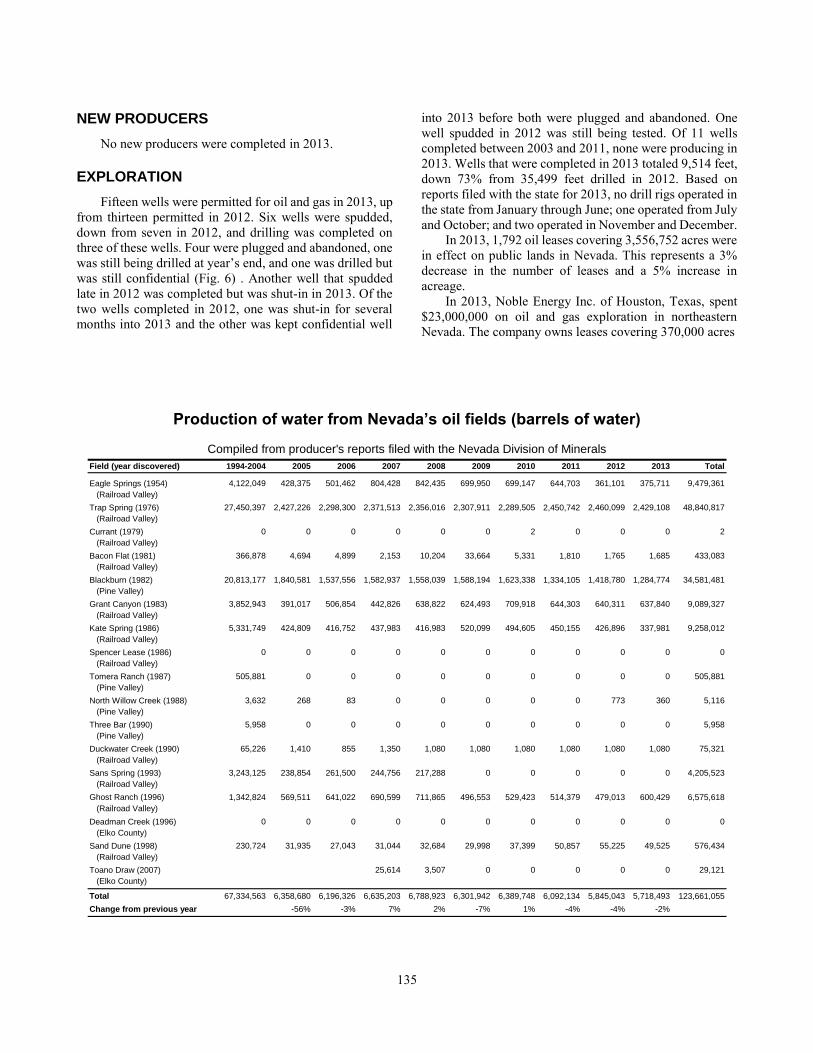
135
NEW PRODUCERS
No new producers were completed in 2013.
EXPLORATION
Fifteen wells were permitted for oil and gas in 2013, up from thirteen permitted in 2012. Six wells were spudded, down from seven in 2012, and drilling was completed on three of these wells. Four were plugged and abandoned, one was still being drilled at year’s end, and one was drilled but was still confidential (Fig. 6) . Another well that spudded late in 2012 was completed but was shut-in in 2013. Of the two wells completed in 2012, one was shut-in for several months into 2013 and the other was kept confidential well
into 2013 before both were plugged and abandoned. One well spudded in 2012 was still being tested. Of 11 wells completed between 2003 and 2011, none were producing in 2013. Wells that were completed in 2013 totaled 9,514 feet, down 73% from 35,499 feet drilled in 2012. Based on reports filed with the state for 2013, no drill rigs operated in the state from January through June; one operated from July and October; and two operated in November and December.
In 2013, 1,792 oil leases covering 3,556,752 acres were in effect on public lands in Nevada. This represents a 3% decrease in the number of leases and a 5% increase in acreage.
In 2013, Noble Energy Inc. of Houston, Texas, spent $23,000,000 on oil and gas exploration in northeastern Nevada. The company owns leases covering 370,000 acres
Production of water from Nevada’s oil fields (barrels of water)
Compiled from producer's reports filed with the Nevada Division of Minerals
Field (year discovered) 1994-2004 2005 2006 2007 2008 2009 2010 2011 2012 2013 Total
Eagle Springs (1954) 4,122,049 428,375 501,462 804,428 842,435 699,950 699,147 644,703 361,101 375,711 9,479,361
(Railroad Valley)
Trap Spring (1976) 27,450,397 2,427,226 2,298,300 2,371,513 2,356,016 2,307,911 2,289,505 2,450,742 2,460,099 2,429,108 48,840,817
(Railroad Valley)
Currant (1979) 0 0 0 0 0 0 2 0 0 0 2
(Railroad Valley)
Bacon Flat (1981) 366,878 4,694 4,899 2,153 10,204 33,664 5,331 1,810 1,765 1,685 433,083
(Railroad Valley)
Blackburn (1982) 20,813,177 1,840,581 1,537,556 1,582,937 1,558,039 1,588,194 1,623,338 1,334,105 1,418,780 1,284,774 34,581,481
(Pine Valley)
Grant Canyon (1983) 3,852,943 391,017 506,854 442,826 638,822 624,493 709,918 644,303 640,311 637,840 9,089,327
(Railroad Valley)
Kate Spring (1986) 5,331,749 424,809 416,752 437,983 416,983 520,099 494,605 450,155 426,896 337,981 9,258,012
(Railroad Valley)
Spencer Lease (1986) 0 0 0 0 0 0 0 0 0 0 0
(Railroad Valley)0
Tomera Ranch (1987) 505,881 0 0 0 0 0 0 0 0 0 505,881
(Pine Valley)
North Willow Creek (1988) 3,632 268 83 0 0 0 0 0 773 360 5,116
(Pine Valley)
Three Bar (1990) 5,958 0 0 0 0 0 0 0 0 0 5,958
(Pine Valley)
Duckwater Creek (1990) 65,226 1,410 855 1,350 1,080 1,080 1,080 1,080 1,080 1,080 75,321
(Railroad Valley)
Sans Spring (1993) 3,243,125 238,854 261,500 244,756 217,288 0 0 0 0 0 4,205,523
(Railroad Valley)
Ghost Ranch (1996) 1,342,824 569,511 641,022 690,599 711,865 496,553 529,423 514,379 479,013 600,429 6,575,618
(Railroad Valley)
Deadman Creek (1996) 0 0 0 0 0 0 0 0 0 0 0
(Elko County)
Sand Dune (1998) 230,724 31,935 27,043 31,044 32,684 29,998 37,399 50,857 55,225 49,525 576,434
(Railroad Valley)
Toano Draw (2007) 25,614 3,507 0 0 0 0 0 29,121
(Elko County)
Total 67,334,563 6,358,680 6,196,326 6,635,203 6,788,923 6,301,942 6,389,748 6,092,134 5,845,043 5,718,493 123,661,055
Change from previous year -56% -3% 7% 2% -7% 1% -4% -4% -2%

136
Federal oil and gas leases in effect for 2012 and 2013
NUMBER OF LEASES1
ACREAGE1
Competitive Noncompetitive Simultaneous2
Competitive Noncompetitive Simultaneous2
County 2012 2013 2012 2013 2012 2013 2012 2013 2012 2013 2012 2013
Carson City 0 0 0 0 0 0 0 0 0 0 0 0
Churchill 2 2 0 1 0 0 5,100 5,100 0 640 0 0
Clark 0 0 1 1 0 0 0 0 480 480 0 0
Douglas 0 0 0 0 0 0 0 0 0 0 0 0
Elko 179 197 161 161 0 0 313,478 324,400 321,850 316,199 0 0
Esmeralda 18 16 5 5 0 0 35,705 30,571 9,276 9,276 0 0
Eureka 77 110 104 78 0 0 211,849 192,650 180,955 208,049 0 0
Humboldt 0 0 0 0 0 0 0 0 0 0 0 0
Lander 0 0 0 0 0 0 0 0 0 0 0 0
Lincoln 60 57 102 93 0 0 120,356 111,085 342,279 299,983 0 0
Lyon 0 0 0 0 0 0 0 0 0 0 0 0
Mineral 2 2 3 3 0 0 4,149 4,149 6,511 6,511 0 0
Nye 362 290 218 209 20 19 552,414 411,112 551,528 488,929 7,998 4,958
Pershing 0 0 1 0 0 0 0 2,680 960 0 0
Storey 0 0 0 0 0 0 0 0 0 0 0 0
Washoe 0 0 0 0 0 0 0 0 0 0 0 0
White Pine 167 177 372 371 0 0 286,617 302,548 824,175 839,152 0 0
Total 867 851 969 922 20 19 1,529,668 1,381,615 2,298,752 2,170,179 7,998 4,958
1Data from the U.S. Bureau of Land Management and LR2000 for the calendar year.
2These are the remaining leases that were issued under the simultaneous leasing program that was terminated by the
December 22, 1987 amendment to the 1920 Mineral Leasing Act.
0
5
10
15
20
25
30
35
40
1955
1959
1963
1967
1971
1975
1979
1983
1987
1991
1995
1999
2003
2007
2011
Num
ber
of w
ells
com
plet
edOil wells completed
in Nevada
Dry Holes
Producers
Figure 6. Chart showing number of wells completed and how many were producers in Nevada from 1955 to 2013.

137
Oil well drilling activity in 2013
Company Well Permit Location Permit Spud Completion Depth Status
No. Date Date Date (Ft.)
CHURCHILL COUNTYGary Borgna MB No. 1 937 SE/4, SE/4, S36, T18N, R30E JAN 13 *5,000 Not Drilled/Extended
ELKO COUNTYTetuan Resources Corp. Marys River 34-26 922 SW/4, SE/4, S26, T38N, R61E NOV 11 JAN 12 FEB 12 6,780 P&A
Andromeda Oil, LLC Tomera Ranch No. 5 930 SE/4, SE/4, S33, T31N, R52E JUL 12 Not Drilled
MTS Energy, Inc. Ferguson Spring 7-33 932 SW/4, NE/4, S33, T30N, R69E JUL 12 OCT 12 DEC 12 10,070 P&A
Noble Energy, Inc. EOS -3N 939 NE/4, NE/4, S36, T34N, R55E MAR 13 JUN 13 JUL 13 928 P&A
Noble Energy, Inc. M2C-H (M2C-M2-11B) 941 NE/4, NW/4, S2, T34N, R58E APR 13 *12,489 Not Drilled
Noble Energy, Inc. M2C-M2C-21B 942 NE/4, NW/4, S2, T34N, R58E APR 13 SEP 13 OCT 13 *12,422 Drilled
Noble Energy, Inc. M10C-M10-22A 945 NW/4, NW/4, S10, T34N, R58E JUN 13 *12,700 Not Drilled
Noble Energy, Inc. M10C-M10-11B 946 NW/4, NW/4, S10, T34N, R58E JUN 13 NOV 13 *12,700 Drilled
Noble Energy, Inc. H33P-H33-33B 947 SE/4, SE/4, S33, T35N, R58E JUL13 *12,621 Not Drilled
Noble Energy, Inc. H33P-H33-44A 948 SE/4, SE/4, S33, T35N, R58E JUL13 *12,542 Not Drilled
Noble Energy, Inc. M2C-M2-S1 949 NE/4, NW/4, S2, T34N, R58E AUG 13 *12,422 Not Drilled
Noble Energy, Inc. M2C-M2-S2 950 SE/4, NW/4, S2, T34N, R58E AUG 13 *12,422 Not Drilled
Noble Energy, Inc. M2C-M2-S3 951 SW/4, NW/4, S2, T34N, R58E AUG 13 *12,422 Not Drilled
EUREKA COUNTYAndromeda Oil, LLC Tomera Ranch No. 6X 934 SE/4, SW/4, S33, T31N, R52E SEP 12 NOV 12 NOV 13 1,550 Shut in
HUMBOLDT COUNTYKBE Energy Well No. 1 900 NE/4, NW/4, S10, T34N, R43E APR 08 MAY 08 DEC 08 6,802 P&A
NYE COUNTYGrant Canyon Oil and Gas, LLC Federal No. 12-14 673 NW/4, SW/4, S14, T7N, R56E APR 93 MAY 93 JUN 93 6,106 TA
Wester Oil Co. Gigante No. 1-4 837 NW/4, NE/4, S4, T12N, R35E MAY 01 AUG 01 DEC 03 7,707 TA
Tri Valley Oil and Gas Midland Trail No. 1-32 861 SW/4, SW/4, S32, T6N, R56E SEP 04 JUN 05 JAN 06 7,063 Testing
Makoil, Inc. Radio No. 6-31 865 NE/4, NW/4, S6, T9N, R57E SEP 04 MAY 05 MAY 05 3,433 Drilled
V. F. Neuhaus Properties, Inc. Currant Creek Ranch 31-1 872 SE/4, SW/4, S31, T10N, R57E JUL 05 JUL 05 *2,200 TA
Petro World Nevada Corp. Cobble Questa No. 1-12 876 NW/4, SE/4, S12, T12N, R34E DEC 05 SEP 06 APR 07 5,193 TA
Makoil Inc. Dry Lake 21-21R 881 NE/4, NW/4, S21, T8N, R56E APR 12 JUN 13 JUL 13 3,224 P&A
Makoil Inc. Trap Spring No. 27-41 899 NE/4, NE/4, S27, T9N, R56E APR 08 DEC 08 JAN 09 7,294 Shut in
Makoil Inc. Munson Ranch No. 12-23X 911 NE/4, SW/4, S12, T9N, R56E DEC 08 *5,000 Not Drilled/Extended
Desert Discoveries, LLC Paradise Unit No. 2-12 916 SE/4, NE/4, S12, T12N, R34E APR 10 JUL 10 NOV 10 4,250 Shut in
HBF Exploration, Inc. Well No. 2 920 SW/4, NW/4, S33, T7N, R61E APR 11 JUL 11 AUG 11 1,020 Shut in
V.F. Neuhaus Properties, Inc. East Hogback 31-2 921 NE/4, SW/4, S31, T10N, R57E MAY 11 JUN 11 SEP 11 1,800 Shut in
Major Oil International Eblana No. 1 925 NE/4, NE/4, S25, T7N, R50E MAY 12 MAY 12 JUN 12 8,550 Testing
Bight Sky Energy and Mineral, Inc. White River Valley No. 1-35 926 SW/4, SW/4, S35, T8N, R61E JUN 12 *12,500 Not Drilled
Makoil Inc. Portuguese Mountain No. 14A-12 928 SE/4, SW/4, S12, T10N, R56E JUN 12 JAN 13 *7,000 Drilling
Kelpetro Operating (Nevada), Inc. Christina No. 30-1 935 SW/4, NW/4, S30, T7N, R55E SEP 12 *1,800 Not Drilled
V. F. Neuhaus Properties, Inc. Apex 26-1 938 SE/4, SE/4, S26, T10N, R56E JAN 13 *2,050 Not Drilled
Bestoso Oil and Gas, Inc. Well No. 1 940 NW/4, SE/4, S20, T5N, R61E APR 13 *14,000 Not Drilled
Kelpetro Operating (Nevada), Inc. Christina No. 36-1 943 NE/4, SE/4, S36, T7N, R54E MAY 13 *4,000 Not Drilled
Makoil Inc. Leoman Spring 1-32 944 SW/4, NE/4, S1, T10N, R56E MAY 13 JUN 13 AUG 13 3,812 P&A
Western General, Inc. Tom Spring 4-34 952 SW/4, SE/4, S4, T8N, R57E SEP 13 *9870 Not Drilled
WHITE PINE COUNTYGeyser Petroleum Pipeline Canyon No. 1 870 NE/4, SW/4, S28, T15N, R62E JAN 05 MAR 05 AUG 05 5,280 Shut in
Grant Alliance, LLC FLT-1 918 NE/4, NW/4, S11, T16N, R55E OCT 10 JAN 11 MAY 11 4,875 Shut in
Sam Oil, LLC Pluto No. 27-1R 936 NE/4, SE/4, S27, T18N, R61E JAN 13 *9,350 Not Drilled
Tetuan Resources Corp. Mariagnes 32-30 953 SW/4, NE/4, S30, T15N, R57E SEP 13 *4,500 Not Drilled
P&A: Plugged and abandoned; TA: Temporarily abandoned; *: Permitted depth given when the actual depth is not available
between Elko and Wells, 66% of which are on private property. Acting as an agent for Noble Energy Inc. during the March 12 lease sale, Lonewolf Exploration and Production Co. of Billings, MT, strengthened Noble Energy’s position by acquiring 16 leases covering 16,494 acres for $771,391. The project area contains three possible plays which include a rollover anticline play, a Tertiary resource play, and a Paleozoic trap play. In 2013, the company completed, plugged and abandoned one well (EOS-3N) and was still drilling two more at year’s end. One of these wells (M2C-M2-21B) in the Wilson Play reportedly recovered “oil from multiple intervals” and is set to be hydraulically fractured in 2014. The siting of the wells was based on a 3-D seismic survey in parts of T38-39N, R60-61E, which Noble completed in 2012. The company has been doing work in northeastern Nevada since 2010 and believes they have a 55% chance of discovering oil and gas by drilling a series of wells between 6,000 and 12,000 feet deep. The company estimates the area may hold a potential resource of between 190 million and 1.4 billion equivalent barrels of oil with a potential production of up to 50,000 barrels per day (Noble Energy website www.nobleenergyinc.com; Noble Energy Inc. Form 10-K,
2/6/2014; Noble Energy Inc. Form 10-Q, 4/24/2014; NSO-BLM Oil and Gas Competitive Lease Sale Results Summary, March 12, 2013; BLM oil auction hints at
Nevada boom, by Rob Sabo, Northern Nevada Business
Weekly, 3/18/2013; Noble Adds to Exploration Program in
Nevada, IHS Drilling Wire, Rocky Mountain Region, Four Corners Edition, vol. 86, no. 161, 8/21/2013; Frac Focus Chemical Disclosure Registry).
In November 2013, Noble Energy, Inc. submitted a Master Surface Use Plan of Operations to the BLM for its proposed Huntington Valley Oil and Gas Exploration Project. The project area consists of 15 leases covering 63,495 acres in portions of T28-31N, R55-56E about 21 miles south of Elko. The company has identified 39 potential well pad locations within the Project Area; however, the Proposed Action calls for a maximum of 20 wells on up to 20 well pads, including construction, drilling, completion, production, operation, and abandonment, to be constructed periodically over a period of up to five years. In the fall of 2013, the company conducted another 3D seismic survey, which in conjunction with data from older 2D seismic programs and well results, will be used to select the pad locations and increase the understanding of faults which
138
may have acted as fluid conduits in a potential reservoir. An environmental assessment was being prepared for release in 2014 (Huntington Valley Oil and Gas Exploration Project
Master Surface Use Plan, Elko County, Nevada, Noble Energy Inc., November 2013; Environmental Assessment
Huntington Valley Oil and Gas Exploration Project, DOI-BLM-E200-NV-2014-0003-EA BLM, May 2014)
Through its subsidiary Major Oil International LLC, U.S. Oil and Gas PLC continued testing its Eblana No. 1 well in section 25, T7N, R50E, in Hot Creek Valley and released a Competent Person’s Report reviewing the project. The well drilled through Tertiary volcanic rocks, but did not penetrate the targeted Paleozoic dolomite. The report noted that hydrocarbons were found in a number of zones within the volcanic rocks but in low saturations and non-commercial quantities. The well may either be in an oil-water transition zone or the zones were swept. Two oil samples from the Eblana No. 1 well were tested to be 28.5o and 33o API gravity. The Mississippian Chainman shale is present in the valley and is the likely source rock. The report recommended running a vertical seismic profile of the Eblana No. 1 well and possibly additional seismic lines to better document the structure. Afterwards, a well would be drilled up-dip from the Eblana No. 1 well to try to find the oil column. Although still to be permitted by the Nevada Division of Minerals, the company announced the BLM permitted their proposed Eblana No. 2 well (U.S. Oil and Gas, PLC, Competent Person’s Report, May 1, 2013; U.S. Oil and Gas, PLC, news release, 8/2/2013; U.S. Oil and Gas, PLC, website: http://www.usoil.us).
On March 12, 2013, the Nevada State Office (NSO) of the BLM held an oil and gas lease sale on 35 parcels covering 45,562 acres in Elko and Eureka Counties. The bids totaled $1,271,113 on 29 parcels covering 35,889 acres, which averaged $35.42 per acre. The highest bid was $152 per acre by Lonewolf Exploration and Production Co., for Parcel 65 (Serial No. NVN091689) consisting of 157 acres covering lots 4 through 7 in section 6, T37N, R61E. Lonewolf, again working as an agent for Noble Energy, also had the second and third highest bids: $128 per acre each for Parcel 63 (Serial No. NVN091687) consisting of 1,280 acres covering all of Sections 22 and 28, T37N, R59E; and Parcel 64 (Serial No. NVN091688) consisting of 480 acres covering portions of Sections 20 and 30, T37N, R60E. All three parcels are in Elko County. Lonewolf paid $249,296 for all three bids. Eight parcels went for bids over $50 per acre, 15 parcels went for bids between $12 and $41 per acre, and four parcels went for between $4 and $9 per acre. Only two parcels went for the $2-per-acre minimum bid (NSO-BLM Oil and Gas Lease List, December 7, 2012; NSO-
BLM Oil and Gas Competitive Lease Sale Results Summary, March 12, 2013).
On June 11, 2013, the NSO-BLM held an oil and gas lease sale on 40 parcels covering 65,846 acres in Eureka and Nye Counties. The bids totaled $862,183 on 33 parcels covering 53,923.5 acres, which averaged $15.99 per acre. The highest bid was $125 per acre by the Blanco Company for parcel 36 (Serial No. NVN092113) consisting of 1,600 acres covering all of section 24 and portions of Sections 12 through 16, T9N, R57E. Blanco also had the second highest bid of $105 per acre for Parcel 33 (Serial No. NVN092110) consisting of 600.5 acres covering portions of Sections 5, 8, 17, and 19, T8N, R57E. The third highest bid was $60 per acre by Kirkwood Oil and Gas LLC for Parcel 37 (Serial No. NVN092114) consisting of 1,560 acres covering all of Sections 25 and 27 and portions of Sections 26 and 35, T9N, R57E. All three parcels are in Nye County. Besides the three highest bids, six parcels went for bids between $11 and $48 per acre, 19 parcels went for bids between $3 and $7 per acre, and six parcels went for the $2 peracre minimum bid (NSO-BLM Oil and Gas Lease List, March 7, 2013; NSO-BLM Oil and Gas Competitive Lease Sale Results Summary, June 11, 2013). The NSO-BLM oil and gas lease sale scheduled for September 10, 2013, was cancelled. (NSO-BLM Notice 3120 [NV923.q], 2013).
On December 10, 2013, the NSO-BLM held an oil and gas lease sale on 178 parcels covering 303,334 acres in Lincoln, Nye, and White Pine Counties. The bids totaled $1,979,581 on 54 parcels covering 93,816 acres, which averaged $21.10 per acre. The highest bid was $54 per acre by Contex Energy Company for parcel 154 (Serial No. NVN092598) consisting of 984 acres covering portions of Sections 30 through 32, T8N, R62E. The second highest bid was $53 per acre by Housing International LLC for Parcel 144 (Serial No. NVN092591) consisting of 2,548 acres covering all of Sections 27 through 29 and portions of section 30, T9N, R61E. The third highest bid was $52 per acre by Contex Energy Co. for Parcel 155 (Serial No. NVN092599) consisting of 1,276 acres covering portions of Sections 30 through 32, T9N, R62E. All three parcels are in Nye County. Besides the three highest bids, 26 parcels went for bids between $11 and $48 per acre, 19 parcels went for bids between $2.50 and $10 per acre, and six parcels went for the $2-per-acre minimum bid (NSO-BLM Oil and Gas Lease List, September 9, 2013; NSO-BLM Oil and Gas Competitive Lease Sale Results Summary, December 10, 2013).

139
Partial list of Nevada oil wells that were stimulated in the past
Modified and compiled from well records and data from consultant Jerry Walker Permit Company Well Name Perfs Fluid Proppant Year Present Formation
(gross) Completed Status
196 Northwest Exploration Co. Trap Spring No. 8 4408'-4575' 72,300 gal. lease oil 100,000 lbs. 10/20 sand 1977 Producer Tertiary volcanic rock
210 MAPCO Oil and Gas Co. Trap Spring No. 17 3570'-3610' 10,000 gal. foam 12/20 sand 1985 P&A Horse Camp Volcanics
203 Northwest Exploration Co. Trap Spring No. 13 4976'-5078' 10,122 gal lease oil 55,000 lbs. 8/12 sand 1977 WD Garrett Ranch Volcanics
189 Northwest Exploration Co. Trap Spring No. 4 4018'-4389' 53,000 gal. oil 37,000 lbs. 8/12 sand 1977 P&A Garrett Ranch Volcanics
233 Northwest Exploration Co. Trap Spring No. 20 3932'-3987' 62,000 gal. lease oil 75,000 lbs. 10/20 sand 1978 WD Pritchards Station Volcanics
196 Northwest Exploration Co. Trap Spring No. 8 4408'-4575' 1,795 gal. lease oil 100,000 lbs. 10/20, 8/12, 1979 Producer Tertiary volcanic rock
4/8 sand
324 Amoco Production Co. Blackburn No. 3 6274'-6345' Jellied lease crude 30,000 lbs. 20/40 sand 1982 Shut in Indian Well Formation
342 Sun Exploration and Prod. Co. Southern Pacific No. 3-13 8432'-8580' Not reported Not reported 1983 P&A Humboldt Formation
350 Amoco Production Co. Blackburn No. 10 5660'-5870' 87,500 gallons foamed oil 120,000 lbs. 20/40 sand 1983 Producer Indian Well Formation
856 DY Exploration Toano Draw 15-19 8800'-8950' 75,000 gal. gel; 6,400 gal. 115,000 lbs. 20/40 PR6000 2005 P&A Humboldt Formation
slickwater sand
Abbreviations: Perf (gross) - larger interval containing one or more smaller perforated intervals; P&A - plugged and abandoned; gal. - gallons; WD - water disposal
TRANSFERS
Breck Energy LLC transferred its production wells to Grant Canyon Oil and Gas LLC on January 1, 2013. Breck Energy is a managing member of Grant Canyon Oil and Gas. The wells to be transferred include the three producers in the Sans Spring Field, and the three producers in the Bacon Flat Field. OTHER DEVELOPMENTS
In 2012, Secretary of the Interior Kenneth Salazar released a proposed set of rules covering hydraulic fracturing on public lands. The rules would require companies to publicly disclose the chemicals used in hydraulic fracturing operations on public and Indian lands, with appropriate protections for proprietary information. The new rules would also improve assurances on well-bore integrity to verify that fluids used in wells during hydraulic fracturing are not escaping; and would confirm that operators have a water management plan in place for handling fracturing fluids that flow back to the surface. The BLM received 177,000 public comments and revised the draft to include important safety standards, improved integration with existing state and tribal standards, and increased flexibility for oil and gas producers. The new draft was republished May 25, 2013, and the 30-day public comment period had to be extended another 60 days through August 2013 (BLM Press Releases, 5/4/2012, 5/16/2013, 6/7/2013).
In 2013, Nevada Legislature tasked the Nevada Division of Minerals and Nevada Division of Environmental Protection to jointly develop a hydraulic fracturing program and the Commission on Mineral Resources to adopt recommended regulations and
implement them. The program is to assess the effects of hydraulic fracturing on waters in the state, require the disclosure of each chemical used in the process, and notify the general public concerning hydraulic fracturing activities in the state (NRS 465; NRS 522). While much debate is going on about the hydraulic fracturing, limited small scale (<100,000 gallons of fluids and <120,000 pounds of proppant) well stimulation has occurred in the past in Nevada. Largely due to the nature of the rock, these attempts have had limited success. Several examples are shown in the table above. As mentioned aboveNoble Energy was planning for a hydraulic fracturing program for some of its wells in 2014.
U.S. OIL PRODUCTION AND CONSUMPTION
According to the Energy Information Agency of the U.S. Department of Energy (http://www.eia.gov), the total petroleum products supplied to the U.S. averaged 18.9 million barrels per day, up 2% from 18.5 million barrels per day in 2012, and down 9% from its peak of 20.8 million barrels per day in 2005. Domestic crude oil production averaged 7.45 million barrels per day, up 15% from 6.48 million barrels per day in 2012. The annual production is the highest since 1989, and the first time since 1970 that production has increased five years in a row. Imported crude oil averaged 7.72 million barrels per day, down 9% from 8.53 million barrels per day in 2012, and down 24% from its peak of 10.13 million barrels per day in 2005. Imported crude oil accounted for 51% of the total, down from 57% in 2012. The average price of domestic oil increased 2% to $96.13 per barrel from an average of $94.52 per barrel in 2012.
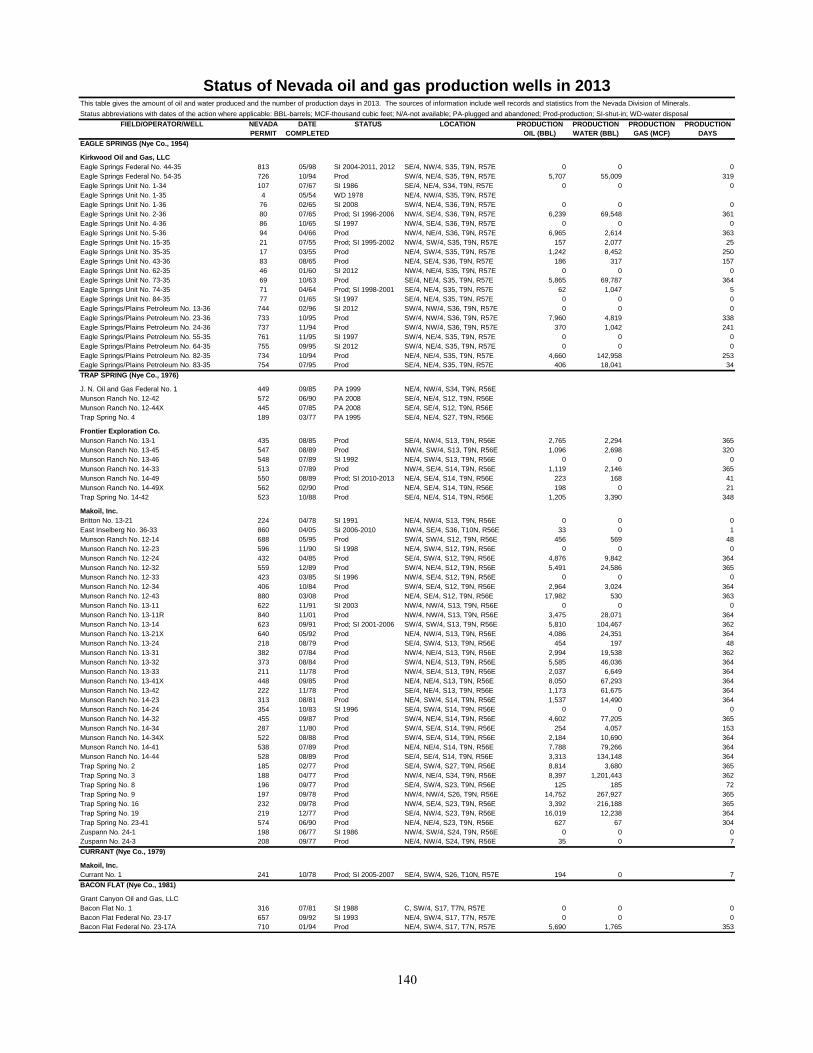
140
Status of Nevada oil and gas production wells in 2013 This table gives the amount of oil and water produced and the number of production days in 2013. The sources of information include well records and statistics from the Nevada Division of Minerals.
Status abbreviations with dates of the action where applicable: BBL-barrels; MCF-thousand cubic feet; N/A-not available; PA-plugged and abandoned; Prod-production; SI-shut-in; WD-water disposal
FIELD/OPERATOR/WELL NEVADA DATE STATUS LOCATION PRODUCTION PRODUCTION PRODUCTION PRODUCTION
PERMIT COMPLETED OIL (BBL) WATER (BBL) GAS (MCF) DAYS
EAGLE SPRINGS (Nye Co., 1954)
Kirkwood Oil and Gas, LLC
Eagle Springs Federal No. 44-35 813 05/98 SI 2004-2011, 2012 SE/4, NW/4, S35, T9N, R57E 0 0 0
Eagle Springs Federal No. 54-35 726 10/94 Prod SW/4, NE/4, S35, T9N, R57E 5,707 55,009 319
Eagle Springs Unit No. 1-34 107 07/67 SI 1986 SE/4, NE/4, S34, T9N, R57E 0 0 0
Eagle Springs Unit No. 1-35 4 05/54 WD 1978 NE/4, NW/4, S35, T9N, R57E
Eagle Springs Unit No. 1-36 76 02/65 SI 2008 SW/4, NE/4, S36, T9N, R57E 0 0 0
Eagle Springs Unit No. 2-36 80 07/65 Prod; SI 1996-2006 NW/4, SE/4, S36, T9N, R57E 6,239 69,548 361
Eagle Springs Unit No. 4-36 86 10/65 SI 1997 NW/4, SE/4, S36, T9N, R57E 0 0 0
Eagle Springs Unit No. 5-36 94 04/66 Prod NW/4, NE/4, S36, T9N, R57E 6,965 2,614 363
Eagle Springs Unit No. 15-35 21 07/55 Prod; SI 1995-2002 NW/4, SW/4, S35, T9N, R57E 157 2,077 25
Eagle Springs Unit No. 35-35 17 03/55 Prod NE/4, SW/4, S35, T9N, R57E 1,242 8,452 250
Eagle Springs Unit No. 43-36 83 08/65 Prod NE/4, SE/4, S36, T9N, R57E 186 317 157
Eagle Springs Unit No. 62-35 46 01/60 SI 2012 NW/4, NE/4, S35, T9N, R57E 0 0 0
Eagle Springs Unit No. 73-35 69 10/63 Prod SE/4, NE/4, S35, T9N, R57E 5,865 69,787 364
Eagle Springs Unit No. 74-35 71 04/64 Prod; SI 1998-2001 SE/4, NE/4, S35, T9N, R57E 62 1,047 5
Eagle Springs Unit No. 84-35 77 01/65 SI 1997 SE/4, NE/4, S35, T9N, R57E 0 0 0
Eagle Springs/Plains Petroleum No. 13-36 744 02/96 SI 2012 SW/4, NW/4, S36, T9N, R57E 0 0 0
Eagle Springs/Plains Petroleum No. 23-36 733 10/95 Prod SW/4, NW/4, S36, T9N, R57E 7,960 4,819 338
Eagle Springs/Plains Petroleum No. 24-36 737 11/94 Prod SW/4, NW/4, S36, T9N, R57E 370 1,042 241
Eagle Springs/Plains Petroleum No. 55-35 761 11/95 SI 1997 SW/4, NE/4, S35, T9N, R57E 0 0 0
Eagle Springs/Plains Petroleum No. 64-35 755 09/95 SI 2012 SW/4, NE/4, S35, T9N, R57E 0 0 0
Eagle Springs/Plains Petroleum No. 82-35 734 10/94 Prod NE/4, NE/4, S35, T9N, R57E 4,660 142,958 253
Eagle Springs/Plains Petroleum No. 83-35 754 07/95 Prod SE/4, NE/4, S35, T9N, R57E 406 18,041 34
TRAP SPRING (Nye Co., 1976)
J. N. Oil and Gas Federal No. 1 449 09/85 PA 1999 NE/4, NW/4, S34, T9N, R56E
Munson Ranch No. 12-42 572 06/90 PA 2008 SE/4, NE/4, S12, T9N, R56E
Munson Ranch No. 12-44X 445 07/85 PA 2008 SE/4, SE/4, S12, T9N, R56E
Trap Spring No. 4 189 03/77 PA 1995 SE/4, NE/4, S27, T9N, R56E
Frontier Exploration Co.
Munson Ranch No. 13-1 435 08/85 Prod SE/4, NW/4, S13, T9N, R56E 2,765 2,294 365
Munson Ranch No. 13-45 547 08/89 Prod NW/4, SW/4, S13, T9N, R56E 1,096 2,698 320
Munson Ranch No. 13-46 548 07/89 SI 1992 NE/4, SW/4, S13, T9N, R56E 0 0 0
Munson Ranch No. 14-33 513 07/89 Prod NW/4, SE/4, S14, T9N, R56E 1,119 2,146 365
Munson Ranch No. 14-49 550 08/89 Prod; SI 2010-2013 NE/4, SE/4, S14, T9N, R56E 223 168 41
Munson Ranch No. 14-49X 562 02/90 Prod NE/4, SE/4, S14, T9N, R56E 198 0 21
Trap Spring No. 14-42 523 10/88 Prod SE/4, NE/4, S14, T9N, R56E 1,205 3,390 348
Makoil, Inc.
Britton No. 13-21 224 04/78 SI 1991 NE/4, NW/4, S13, T9N, R56E 0 0 0
East Inselberg No. 36-33 860 04/05 SI 2006-2010 NW/4, SE/4, S36, T10N, R56E 33 0 1
Munson Ranch No. 12-14 688 05/95 Prod SW/4, SW/4, S12, T9N, R56E 456 569 48
Munson Ranch No. 12-23 596 11/90 SI 1998 NE/4, SW/4, S12, T9N, R56E 0 0 0
Munson Ranch No. 12-24 432 04/85 Prod SE/4, SW/4, S12, T9N, R56E 4,876 9,842 364
Munson Ranch No. 12-32 559 12/89 Prod SW/4, NE/4, S12, T9N, R56E 5,491 24,586 365
Munson Ranch No. 12-33 423 03/85 SI 1996 NW/4, SE/4, S12, T9N, R56E 0 0 0
Munson Ranch No. 12-34 406 10/84 Prod SW/4, SE/4, S12, T9N, R56E 2,964 3,024 364
Munson Ranch No. 12-43 880 03/08 Prod NE/4, SE/4, S12, T9N, R56E 17,982 530 363
Munson Ranch No. 13-11 622 11/91 SI 2003 NW/4, NW/4, S13, T9N, R56E 0 0 0
Munson Ranch No. 13-11R 840 11/01 Prod NW/4, NW/4, S13, T9N, R56E 3,475 28,071 364
Munson Ranch No. 13-14 623 09/91 Prod; SI 2001-2006 SW/4, SW/4, S13, T9N, R56E 5,810 104,467 362
Munson Ranch No. 13-21X 640 05/92 Prod NE/4, NW/4, S13, T9N, R56E 4,086 24,351 364
Munson Ranch No. 13-24 218 08/79 Prod SE/4, SW/4, S13, T9N, R56E 454 197 48
Munson Ranch No. 13-31 382 07/84 Prod NW/4, NE/4, S13, T9N, R56E 2,994 19,538 362
Munson Ranch No. 13-32 373 08/84 Prod SW/4, NE/4, S13, T9N, R56E 5,585 46,036 364
Munson Ranch No. 13-33 211 11/78 Prod NW/4, SE/4, S13, T9N, R56E 2,037 6,649 364
Munson Ranch No. 13-41X 448 09/85 Prod NE/4, NE/4, S13, T9N, R56E 8,050 67,293 364
Munson Ranch No. 13-42 222 11/78 Prod SE/4, NE/4, S13, T9N, R56E 1,173 61,675 364
Munson Ranch No. 14-23 313 08/81 Prod NE/4, SW/4, S14, T9N, R56E 1,537 14,490 364
Munson Ranch No. 14-24 354 10/83 SI 1996 SE/4, SW/4, S14, T9N, R56E 0 0 0
Munson Ranch No. 14-32 455 09/87 Prod SW/4, NE/4, S14, T9N, R56E 4,602 77,205 365
Munson Ranch No. 14-34 287 11/80 Prod SW/4, SE/4, S14, T9N, R56E 254 4,057 153
Munson Ranch No. 14-34X 522 08/88 Prod SW/4, SE/4, S14, T9N, R56E 2,184 10,690 364
Munson Ranch No. 14-41 538 07/89 Prod NE/4, NE/4, S14, T9N, R56E 7,788 79,266 364
Munson Ranch No. 14-44 528 08/89 Prod SE/4, SE/4, S14, T9N, R56E 3,313 134,148 364
Trap Spring No. 2 185 02/77 Prod SE/4, SW/4, S27, T9N, R56E 8,814 3,680 365
Trap Spring No. 3 188 04/77 Prod NW/4, NE/4, S34, T9N, R56E 8,397 1,201,443 362
Trap Spring No. 8 196 09/77 Prod SE/4, SW/4, S23, T9N, R56E 125 185 72
Trap Spring No. 9 197 09/78 Prod NW/4, NW/4, S26, T9N, R56E 14,752 267,927 365
Trap Spring No. 16 232 09/78 Prod NW/4, SE/4, S23, T9N, R56E 3,392 216,188 365
Trap Spring No. 19 219 12/77 Prod SE/4, NW/4, S23, T9N, R56E 16,019 12,238 364
Trap Spring No. 23-41 574 06/90 Prod NE/4, NE/4, S23, T9N, R56E 627 67 304
Zuspann No. 24-1 198 06/77 SI 1986 NW/4, SW/4, S24, T9N, R56E 0 0 0
Zuspann No. 24-3 208 09/77 Prod NE/4, NW/4, S24, T9N, R56E 35 0 7
CURRANT (Nye Co., 1979)
Makoil, Inc.
Currant No. 1 241 10/78 Prod; SI 2005-2007 SE/4, SW/4, S26, T10N, R57E 194 0 7
BACON FLAT (Nye Co., 1981)
Grant Canyon Oil and Gas, LLC
Bacon Flat No. 1 316 07/81 SI 1988 C, SW/4, S17, T7N, R57E 0 0 0
Bacon Flat Federal No. 23-17 657 09/92 SI 1993 NE/4, SW/4, S17, T7N, R57E 0 0 0
Bacon Flat Federal No. 23-17A 710 01/94 Prod NE/4, SW/4, S17, T7N, R57E 5,690 1,765 353
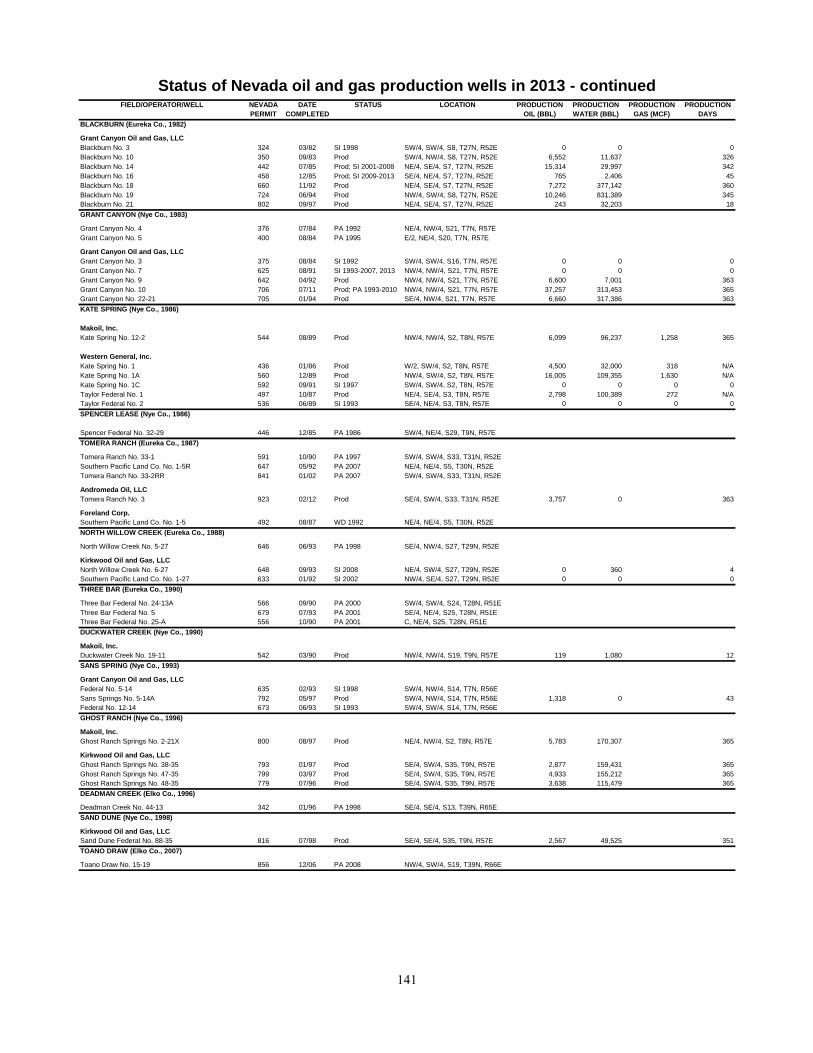
141
Status of Nevada oil and gas production wells in 2013 - continued FIELD/OPERATOR/WELL NEVADA DATE STATUS LOCATION PRODUCTION PRODUCTION PRODUCTION PRODUCTION
PERMIT COMPLETED OIL (BBL) WATER (BBL) GAS (MCF) DAYS
BLACKBURN (Eureka Co., 1982)
Grant Canyon Oil and Gas, LLC
Blackburn No. 3 324 03/82 SI 1998 SW/4, SW/4, S8, T27N, R52E 0 0 0
Blackburn No. 10 350 09/83 Prod SW/4, NW/4, S8, T27N, R52E 6,552 11,637 326
Blackburn No. 14 442 07/85 Prod; SI 2001-2008 NE/4, SE/4, S7, T27N, R52E 15,314 29,997 342
Blackburn No. 16 458 12/85 Prod; SI 2009-2013 SE/4, NE/4, S7, T27N, R52E 765 2,406 45
Blackburn No. 18 660 11/92 Prod NE/4, SE/4, S7, T27N, R52E 7,272 377,142 360
Blackburn No. 19 724 06/94 Prod NW/4, SW/4, S8, T27N, R52E 10,246 831,389 345
Blackburn No. 21 802 09/97 Prod NE/4, SE/4, S7, T27N, R52E 243 32,203 18
GRANT CANYON (Nye Co., 1983)
Grant Canyon No. 4 376 07/84 PA 1992 NE/4, NW/4, S21, T7N, R57E
Grant Canyon No. 5 400 08/84 PA 1995 E/2, NE/4, S20, T7N, R57E
Grant Canyon Oil and Gas, LLC
Grant Canyon No. 3 375 08/84 SI 1992 SW/4, SW/4, S16, T7N, R57E 0 0 0
Grant Canyon No. 7 625 08/91 SI 1993-2007, 2013 NW/4, NW/4, S21, T7N, R57E 0 0 0
Grant Canyon No. 9 642 04/92 Prod NW/4, NW/4, S21, T7N, R57E 6,600 7,001 363
Grant Canyon No. 10 706 07/11 Prod; PA 1993-2010 NW/4, NW/4, S21, T7N, R57E 37,257 313,453 365
Grant Canyon No. 22-21 705 01/94 Prod SE/4, NW/4, S21, T7N, R57E 6,660 317,386 363
KATE SPRING (Nye Co., 1986)
Makoil, Inc.
Kate Spring No. 12-2 544 08/89 Prod NW/4, NW/4, S2, T8N, R57E 6,099 96,237 1,258 365
Western General, Inc.
Kate Spring No. 1 436 01/86 Prod W/2, SW/4, S2, T8N, R57E 4,500 32,000 318 N/A
Kate Spring No. 1A 560 12/89 Prod NW/4, SW/4, S2, T8N, R57E 16,005 109,355 1,630 N/A
Kate Spring No. 1C 592 09/91 SI 1997 SW/4, SW/4, S2, T8N, R57E 0 0 0 0
Taylor Federal No. 1 497 10/87 Prod NE/4, SE/4, S3, T8N, R57E 2,798 100,389 272 N/A
Taylor Federal No. 2 536 06/89 SI 1993 SE/4, NE/4, S3, T8N, R57E 0 0 0 0
SPENCER LEASE (Nye Co., 1986)
Spencer Federal No. 32-29 446 12/85 PA 1986 SW/4, NE/4, S29, T9N, R57E
TOMERA RANCH (Eureka Co., 1987)
Tomera Ranch No. 33-1 591 10/90 PA 1997 SW/4, SW/4, S33, T31N, R52E
Southern Pacific Land Co. No. 1-5R 647 05/92 PA 2007 NE/4, NE/4, S5, T30N, R52E
Tomera Ranch No. 33-2RR 841 01/02 PA 2007 SW/4, SW/4, S33, T31N, R52E
Andromeda Oil, LLC
Tomera Ranch No. 3 923 02/12 Prod SE/4, SW/4, S33, T31N, R52E 3,757 0 363
Foreland Corp.
Southern Pacific Land Co. No. 1-5 492 08/87 WD 1992 NE/4, NE/4, S5, T30N, R52E
NORTH WILLOW CREEK (Eureka Co., 1988)
North Willow Creek No. 5-27 646 06/93 PA 1998 SE/4, NW/4, S27, T29N, R52E
Kirkwood Oil and Gas, LLC
North Willow Creek No. 6-27 648 09/93 SI 2008 NE/4, SW/4, S27, T29N, R52E 0 360 4
Southern Pacific Land Co. No. 1-27 633 01/92 SI 2002 NW/4, SE/4, S27, T29N, R52E 0 0 0
THREE BAR (Eureka Co., 1990)
Three Bar Federal No. 24-13A 566 09/90 PA 2000 SW/4, SW/4, S24, T28N, R51E
Three Bar Federal No. 5 679 07/93 PA 2001 SE/4, NE/4, S25, T28N, R51E
Three Bar Federal No. 25-A 556 10/90 PA 2001 C, NE/4, S25, T28N, R51E
DUCKWATER CREEK (Nye Co., 1990)
Makoil, Inc.
Duckwater Creek No. 19-11 542 03/90 Prod NW/4, NW/4, S19, T9N, R57E 119 1,080 12
SANS SPRING (Nye Co., 1993)
Grant Canyon Oil and Gas, LLC
Federal No. 5-14 635 02/93 SI 1998 SW/4, NW/4, S14, T7N, R56E
Sans Springs No. 5-14A 792 05/97 Prod SW/4, NW/4, S14, T7N, R56E 1,318 0 43
Federal No. 12-14 673 06/93 SI 1993 SW/4, SW/4, S14, T7N, R56E
GHOST RANCH (Nye Co., 1996)
Makoil, Inc.
Ghost Ranch Springs No. 2-21X 800 08/97 Prod NE/4, NW/4, S2, T8N, R57E 5,783 170,307 365
Kirkwood Oil and Gas, LLC
Ghost Ranch Springs No. 38-35 793 01/97 Prod SE/4, SW/4, S35, T9N, R57E 2,877 159,431 365
Ghost Ranch Springs No. 47-35 799 03/97 Prod SE/4, SW/4, S35, T9N, R57E 4,933 155,212 365
Ghost Ranch Springs No. 48-35 779 07/96 Prod SE/4, SW/4, S35, T9N, R57E 3,638 115,479 365
DEADMAN CREEK (Elko Co., 1996)
Deadman Creek No. 44-13 342 01/96 PA 1998 SE/4, SE/4, S13, T39N, R65E
SAND DUNE (Nye Co., 1998)
Kirkwood Oil and Gas, LLC
Sand Dune Federal No. 88-35 816 07/98 Prod SE/4, SE/4, S35, T9N, R57E 2,567 49,525 351
TOANO DRAW (Elko Co., 2007)
Toano Draw No. 15-19 856 12/06 PA 2008 NW/4, SW/4, S19, T39N, R66E
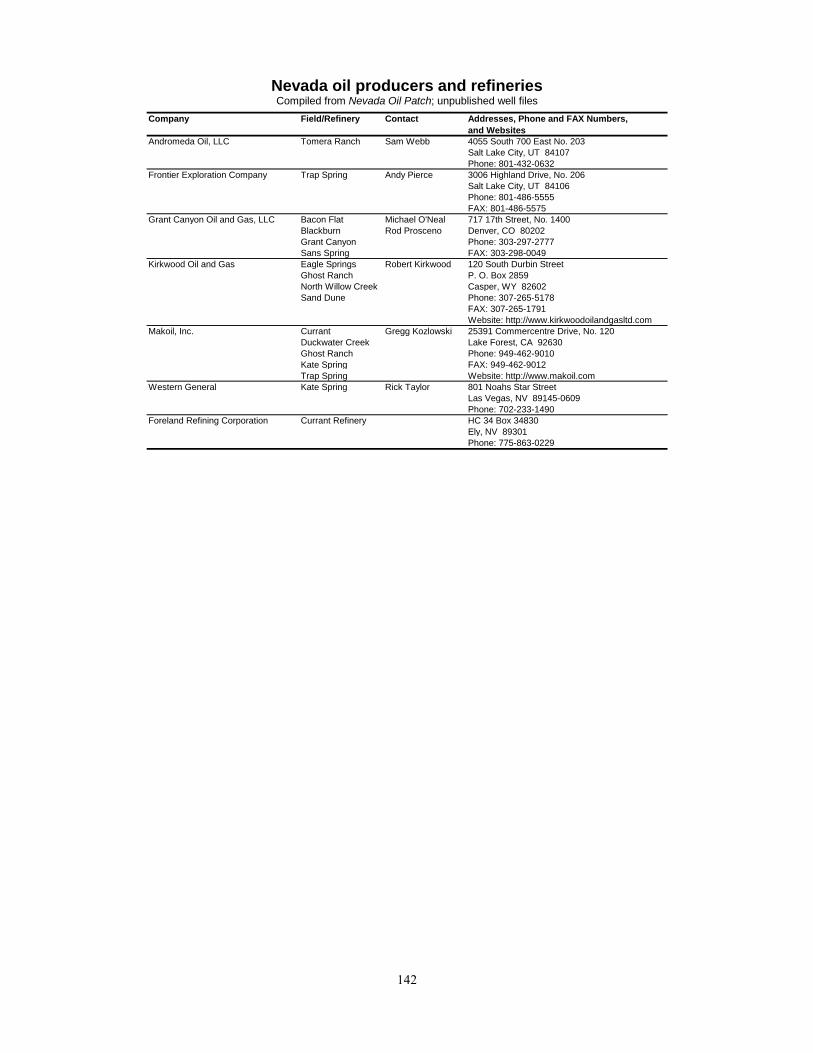
142
Nevada oil producers and refineries
Compiled from Nevada Oil Patch; unpublished well files
Company Field/Refinery Contact Addresses, Phone and FAX Numbers,
and Websites
Andromeda Oil, LLC Tomera Ranch Sam Webb 4055 South 700 East No. 203
Salt Lake City, UT 84107
Phone: 801-432-0632
Frontier Exploration Company Trap Spring Andy Pierce 3006 Highland Drive, No. 206
Salt Lake City, UT 84106
Phone: 801-486-5555
FAX: 801-486-5575
Grant Canyon Oil and Gas, LLC Bacon Flat Michael O'Neal 717 17th Street, No. 1400
Blackburn Rod Prosceno Denver, CO 80202
Grant Canyon Phone: 303-297-2777
Sans Spring FAX: 303-298-0049
Kirkwood Oil and Gas Eagle Springs Robert Kirkwood 120 South Durbin Street
Ghost Ranch P. O. Box 2859
North Willow Creek Casper, WY 82602
Sand Dune Phone: 307-265-5178
FAX: 307-265-1791
Website: http://www.kirkwoodoilandgasltd.com
Makoil, Inc. Currant Gregg Kozlowski 25391 Commercentre Drive, No. 120
Duckwater Creek Lake Forest, CA 92630
Ghost Ranch Phone: 949-462-9010
Kate Spring FAX: 949-462-9012
Trap Spring Website: http://www.makoil.com
Western General Kate Spring Rick Taylor 801 Noahs Star Street
Las Vegas, NV 89145-0609
Phone: 702-233-1490
Foreland Refining Corporation Currant Refinery HC 34 Box 34830
Ely, NV 89301
Phone: 775-863-0229

143
Directory of Mining and Milling Operations By David A. Davis
Compiled from information supplied by the Nevada Div. of Minerals, Mine Safety and Training Section of the Div. of Industrial Relations, and companies.
Except for larger BLM community pits, aggregate operations with less than 100,000 tons annual production are not listed.
CIL: carbon-in-leach, CIP: carbon-in-pulp, HL: heap leach, ML: mill, N/A: not available, OP: open-pit mine, OS: other surface, PL: placer, UG: underground
Mine/Mill Name Operator Location Commodity Type Process/ Company/ Address
Activity Contract
Employees
CARSON CITYBlack and Red Cinderlite Trucking, Inc. S21, 22, cinder OP, ML mining 2 1665 South Sutro Terrace
Cinder Pits T16N, R20E decorative stone screening Carson City, NV 89706
Phone: 775-882-4483
FAX: 775-882-1671
Web: http://www.cinderlite.com
Goni Pit Cinderlite Trucking Corp. S28, T16N, R20E decomposed granite OP, ML mining 6 1665 South Sutro Terrace
sand crushing Carson City, NV 89706
gravel screening Phone: 775-882-4483
FAX: 775-882-1671
Web: http://www.cinderlite.com
CHURCHILL COUNTYFernley Operations EP Minerals, LLC S28, 32, diatomite OP, ML mining 36 P.O. Box 860
T23N, R27E calcining I-80 Frontage Rd.
classification Fernley, NV 89408-0860
drying Phone: 775-423-6668
grinding FAX: 775-423-6411
Web: http://www.epminerals.com
Huck Salt Huck Salt Co. S11, 12, 13, salt OS mining 10 2900 Phritzie Lane
T16N, R31E; evaporation Fallon, NV 89406
S7, T16N, R32E Phone: 775-423-2055
FAX: 775-423-0467
Web: http://www.hucksalt.com
Churchill Limestone Nevada Cement Co. S31, T25N, R29E limestone OP mining 8 P.O. Box 840
Project (Nevada Fernley, NV 89408
Cement pits Phone: 775-575-2281
combined) FAX: 775-575-4387
Web:http://www.eaglematerials.com
Nightingale Pit Imerys Minerals S17, 18, 19, 20, diatomite OP mining 14/5 100 Front St.
California, Inc. T24N, R26E Fernley, NV 89408
Phone: 775-575-2536
FAX: 775-575-1507
Web: http://www.worldminerals.com
Popcorn Mine EP Minerals, LLC S24, T16N, R28E; perlite OP mining 2 640 Clark Station Rd.
S19, T16N, R29E Sparks, NV 89434
Phone: 775-824-7700
FAX: 775-824-7715
Web: http://www.epminerals.com
CLARK COUNTYApex Landfill Pit Las Vegas Paving Corp. S19, T18S, R64E sand OP, ML mining 24 4420 South Decatur Blvd.
gravel crushing Las Vegas, NV 89103
screening Phone: 702-251-5800
FAX: 702-251-1968
Web: http://www.lasvegaspaving.com
Apex Quarry Lhoist North America S14, 22, 23, 26, limestone OP, ML mining 140/20 P.O. Box 363068
and Plant 27, 34, 35, calcining (Mine and North Las Vegas, NV 89036
T18S, R63E crushing plant Phone: 702-643-7702
screening combined) FAX: 702-643-9517
Web: http://www.lhoist.us
Blue Diamond Pit Las Vegas Paving Corp. S26, T22S, R60E sand OP, ML mining 10 4420 South Decatur Blvd.
gravel crushing Las Vegas, NV 89103
screening Phone: 702-251-5800
FAX: 702-251-1968
Web: http://www.lasvegaspaving.com
Blue Diamond Hill Mine Gypsum Resources, LLC S32, T21S, R59E gypsum OP, ML mining 40/6 8912 Spanish Ridge Ave., Suite No. 200
limestone crushing Las Vegas, NV 89148
screening Phone: 702-334-4669
FAX: 702-586-3527
Web: http://www.bdhgypsum.com
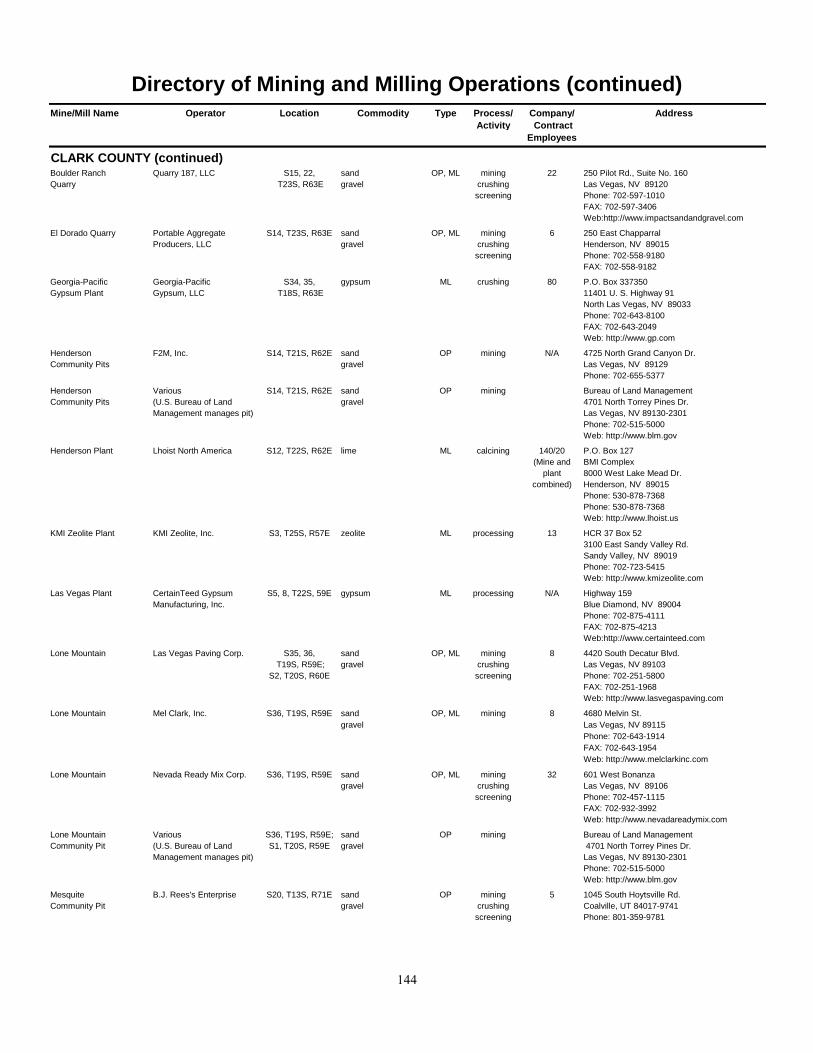
144
Directory of Mining and Milling Operations (continued)
Mine/Mill Name Operator Location Commodity Type Process/ Company/ Address
Activity Contract
Employees
CLARK COUNTY (continued)Boulder Ranch Quarry 187, LLC S15, 22, sand OP, ML mining 22 250 Pilot Rd., Suite No. 160
Quarry T23S, R63E gravel crushing Las Vegas, NV 89120
screening Phone: 702-597-1010
FAX: 702-597-3406
Web:http://www.impactsandandgravel.com
El Dorado Quarry Portable Aggregate S14, T23S, R63E sand OP, ML mining 6 250 East Chapparral
Producers, LLC gravel crushing Henderson, NV 89015
screening Phone: 702-558-9180
FAX: 702-558-9182
Georgia-Pacific Georgia-Pacific S34, 35, gypsum ML crushing 80 P.O. Box 337350
Gypsum Plant Gypsum, LLC T18S, R63E 11401 U. S. Highway 91
North Las Vegas, NV 89033
Phone: 702-643-8100
FAX: 702-643-2049
Web: http://www.gp.com
Henderson F2M, Inc. S14, T21S, R62E sand OP mining N/A 4725 North Grand Canyon Dr.
Community Pits gravel Las Vegas, NV 89129
Phone: 702-655-5377
Henderson Various S14, T21S, R62E sand OP mining Bureau of Land Management
Community Pits (U.S. Bureau of Land gravel 4701 North Torrey Pines Dr.
Management manages pit) Las Vegas, NV 89130-2301
Phone: 702-515-5000
Web: http://www.blm.gov
Henderson Plant Lhoist North America S12, T22S, R62E lime ML calcining 140/20 P.O. Box 127
(Mine and BMI Complex
plant 8000 West Lake Mead Dr.
combined) Henderson, NV 89015
Phone: 530-878-7368
Phone: 530-878-7368
Web: http://www.lhoist.us
KMI Zeolite Plant KMI Zeolite, Inc. S3, T25S, R57E zeolite ML processing 13 HCR 37 Box 52
3100 East Sandy Valley Rd.
Sandy Valley, NV 89019
Phone: 702-723-5415
Web: http://www.kmizeolite.com
Las Vegas Plant CertainTeed Gypsum S5, 8, T22S, 59E gypsum ML processing N/A Highway 159
Manufacturing, Inc. Blue Diamond, NV 89004
Phone: 702-875-4111
FAX: 702-875-4213
Web:http://www.certainteed.com
Lone Mountain Las Vegas Paving Corp. S35, 36, sand OP, ML mining 8 4420 South Decatur Blvd.
T19S, R59E; gravel crushing Las Vegas, NV 89103
S2, T20S, R60E screening Phone: 702-251-5800
FAX: 702-251-1968
Web: http://www.lasvegaspaving.com
Lone Mountain Mel Clark, Inc. S36, T19S, R59E sand OP, ML mining 8 4680 Melvin St.
gravel Las Vegas, NV 89115
Phone: 702-643-1914
FAX: 702-643-1954
Web: http://www.melclarkinc.com
Lone Mountain Nevada Ready Mix Corp. S36, T19S, R59E sand OP, ML mining 32 601 West Bonanza
gravel crushing Las Vegas, NV 89106
screening Phone: 702-457-1115
FAX: 702-932-3992
Web: http://www.nevadareadymix.com
Lone Mountain Various S36, T19S, R59E; sand OP mining Bureau of Land Management
Community Pit (U.S. Bureau of Land S1, T20S, R59E gravel 4701 North Torrey Pines Dr.
Management manages pit) Las Vegas, NV 89130-2301
Phone: 702-515-5000
Web: http://www.blm.gov
Mesquite B.J. Rees's Enterprise S20, T13S, R71E sand OP mining 5 1045 South Hoytsville Rd.
Community Pit gravel crushing Coalville, UT 84017-9741
screening Phone: 801-359-9781

145
Directory of Mining and Milling Operations (continued)
Mine/Mill Name Operator Location Commodity Type Process/ Company/ Address
Activity Contract
Employees
CLARK COUNTY (continued)Mesquite Various S20, T13S, R71E sand OP mining Bureau of Land Management
Community Pit (U.S. Bureau of Land gravel 4701 North Torrey Pines Dr.
Management manages pit) Las Vegas, NV 89130-2301
Phone: 702-515-5000
Web: http://www.blm.gov
Money Pit Southern Nevada S9, T25S, R61E silica sand OP, ML mining 6 4262 Blue Diamond Rd.
Liteweight, Inc. milling Las Vegas, NV 89139
Phone: 702-399-8621
FAX: 702-633-4062
Web: http://www.snlsand.com
PABCO Gypsum- Pacific Coast Building S7, 18, gypsum OP, ML mining 145/3 P.O. Box 364329
Apex Pit Products, Inc. T20S, R64E crushing North Las Vegas, NV 89036
washing Phone: 702-407-3700
FAX: 702-643-6249
Web: http://www.paccoast.com
Primm Quarry Las Vegas Paving Corp. S8, T27S, R59E sand OP mining 9 4420 South Decatur Blvd.
gravel crushing Las Vegas, NV 89103
screening Phone: 702-251-5800
FAX: 702-251-1968
Web: http://www.lasvegaspaving.com
Pioneer Pioneer Gypsum S19, 20, 29, 30, gypsum OP, ML mining 10/1 4880 Donovan Way
Gypsum Mine Mining Co. T20S, R64E crushing North Las Vegas, NV 89081
screening Phone: 702-399-5939
FAX: 702-399-8353
Pittman Detention Pit Aggregate Industries S9, 10, sand OP mining N/A 3101 East Craig Rd.
T23S, R61E gravel crushing North Las Vegas, NV 89030
screening Phone: 702-649-6250
FAX: 702-642-2213
Web: http://www.aggregate-us.com
Rainbow Quarries Las Vegas Rock, Inc. S34, T25S, R58E gravel OP, ML mining 11 2 Prison Rd.
stone crushing P.O. Box 19118
sawing Jean, NV 89019
Phone: 702-791-7625
FAX: 702-874-1881
Web: http://www.vegasrock.com
Sierra Ready Mix Sierra Ready Mix, LLC S6, 7, sand OP, ML mining 5 4150 Smily Rd.
Quarry T25S, R60E gravel crushing North Las Vegas, NV 89081
screening Phone: 702-664-3000
FAX: 702-664-1736
Web: http://www.sierrareadymix.com
Simplot Silica J. R. Simplot Co. S11, T17S, R67E silica sand OP, ML mining 40 P.O. Box 308
Products Pit drying Overton, NV 89040
flotation Phone: 702-397-2667
screening FAX: 702-397-2798
Web: http://www.simplot.com
Sloan Quarry Aggregate Industries S13, T23S, R60E sand OP, OS, mining 31 3101 East Craig Rd.
and Mill gravel ML crushing North Las Vegas, NV 89030
screening Phone: 702-649-6250
FAX: 702-642-2213
Web: http://www.aggregate-us.com
South Lean Pit Service Rock Products S21, 28 sand OP mining 6 151 Cassia Way
T25S, R60E gravel Henderson, NV 89014
Phone: 702-798-0568
Phone: 702-798-0580
Web: http://www.srevicerock.com
Spring Mountain Wells Cargo, Inc. S10, 15; sand OP, ML mining 8 9127 West Russell Rd., Suite 210
Pit and Mill T21S, R60E gravel gravity Las Vegas, NV 891148
Phone: 702-876-5090
FAX: 702-876-3977
Web: http://www.wcilv.com
DOUGLAS COUNTYBing Materials Pit Bing Materials Co. S16, T12N, R20E sand OP, ML mining 12 P.O. Box 487
and Mill gravel crushing Minden, NV 89423
screening Phone: 775-265-3641

146
Directory of Mining and Milling Operations (continued)
Mine/Mill Name Operator Location Commodity Type Process/ Company/ Address
Activity Contract
Employees
DOUGLAS COUNTY (continued)Wasbuska Iron Mine Standard Industrial S19, T14N, R24E iron ore OP stockpile N/A 199 1st Street
Minerals, Inc. Bishop, CA 93514
Phone: 760-873-6780
ELKO COUNTYAmy Mine Ruggeri-Stocks, LLC S21, T46N, R58E gold UG mining 5 P. O. Box 260091
milling 100 North Main
Jarbidge, NV 89826
Phone: 775-488-2403
Big Ledge Mine National Oilwell Varco S26, T42N, R61E barite OP, ML mining 30/4 247 Bluffs Ave.
and Dry Creek gravity (Mine and Elko, NV 89801
Jig Plant jigging plants Phone: 775-738-7171
combined) FAX: 775-738-7196
Web: http://www.nov.com
Boehler Pit Staker Parson Co. S12, T34N, R55E aggregate OP, ML mining 5 2755 Last Chance Road
sand crushing Elko, NV 89801
gravel Phone: 775-738-8155
Web: http://www.stakerparson.com
Dry Creek Jig Plant National Oilwell Varco 15, T42N, R62E barite ML milling 30/4 247 Bluffs Ave.
gravity (Mine and Elko, NV 89801
jigging plants Phone: 775-738-7171
combined) FAX: 775-738-7196
Web: http://www.nov.com
Elburz Pit Vega Construction S9, T33N, R52E sand OP, ML mining 9 P.O. Box 1630
and Trucking Co. gravel crushing Elko, NV 89803
screening Phone: 775-738-5381
FAX: 775-738-6311
Emigrant Mine Newmont Mining Corp. S2, T31N, R53E; gold OP, ML mining 169 1655 Mountain Hwy.
S26, 35 milling Elko, NV 89803
T32N, R53E Phone: 775-778-4000
FAX: 775-778-4751
Web: http://www.newmont.com
Fraser Pit Modern Concrete, Inc. S30, T33N, R53E sand OP, ML mining 7 1770 Sharps Access Rd.
gravel crushing Elko, NV 89801
screening Phone: 775-753-5100
FAX: 775-738-9199
Web: http://www.modernconcrete.net
Hollister Mine Waterton Global Mining
Co., LLC
S4, 5, gold UG mining 178 4000 West Winnemucca Blvd.
Mining Co., LLC T37N, R48E; silver crushing Winnemucca, NV 89445
S32, T38N, R48E milling Phone: 775-623-5760
FAX: 775-623-5767
Web: http://www.watertonglobal.com
Jerritt Canyon Mine Veris Gold USA, Inc. S3, 4, T40N, R54E; gold UG, ML, mining 360/130 HC31 Box 78
S33, 34, silver CIL heap leach Elko, NV 89801
T41N, R54E mercury milling Phone: 775-738-5600
roasting FAX: 775-758-9233
Web: http://www.yukon-nevadagold.com
Meikle Mine Barrick Goldstrike S12, 13, gold UG, ML mining 629 P.O. Box 29
Mines, Inc. T36N, R50E silver milling Elko, NV 89803
roasting Phone: 775-748-1001
FAX: 775-748-1240
Web: http://www.barrick.com
Midas Mine Newmont Mining Corp. S21, 22, 27, gold UG, ML mining 198/61 HC66 Box 125
28, 33, 34; silver milling Midas, NV 89414
T39N, R46E Phone: 775-635-6423
FAX: 775-635-6460
Web: http://www.newmont.com
Osino Grinding Plant National Oilwell Varco S10, T35N, R56E barite ML milling 30/4 247 Bluffs Ave.
gravity (Mine and Elko, NV 89801
jigging plants Phone: 775-738-7171
combined) FAX: 775-738-7196
Web: http://www.nov.com

147
Directory of Mining and Milling Operations (continued)
Mine/Mill Name Operator Location Commodity Type Process/ Company/ Address
Activity Contract
Employees
ELKO COUNTY (continued)
Pilot Peak Quarry Graymont Western S14, 15, 22, limestone OP, ML mining 55 P.O. Box 2520
and Plant US., Inc. 23, 26, calcining West Wendover, NV 89883
T34N, R68E rotary kiln Phone: 775-483-5463
FAX: 775-483-5149
Web: http://www.graymont.com
Rossi Mine BAROID/Halliburton S14-16, 21-23, barite OP, ML mining 16/65 912 Dunphy Ranch Rd.
Energy Services, Inc. 26-28, 34-35, (Mine and Battle Mountain, NV 89820
T37N, R49E plant Phone: 775-468-0515
combined) FAX: 775-468-2060
Web: http://www.halliburton.com
Storm Mine Barrick Goldstrike S12, 13, gold UG, ML mining 3 P.O. Box 29
Mines, Inc. T36N, R49E roasting Elko, NV 89803
Phone: 775-748-1001
FAX: 775-748-1240
Web: http://www.barrick.com
ESMERALDA COUNTYBasalt Plant Grefco Minerals, Inc. S29, T2N, R34E diatomite OP, ML mining 14 P.O. Box 278
drying Dyer, NV 89010
milling Phone: 775-573-2422
FAX: 775-573-2422
Web: http://www.dicalite.com
Blanco Mine Vanderbilt Minerals Corp. S22, T1N, R37E clay OP bagging 3 3561 East Burgundy Dr.
grinding (Combined P.O. Box 6660
screening Vanderbilt Pahrump, NV 89048
Mines) Phone: 775-537-6976
FAX: 775-537-6879
Web: http://www.rtvanderbilt.com
Heart of Nature
Alum/Sulfur Mine
Heart of Nature, LLC S32, T1N, R38.5E alum OP, ML mining 6 34710 7th Standard Rd.
sulfur crushing Bakersfield, CA 93314
processing Phone: 877-324-3278
screening FAX: 661-399-9758
Web: http://www.heartofnature.biz
Mineral Ridge Mineral Ridge Gold, LLC S1, T2S, R38E gold OP, HL, mining 82/22 No. 1 Coyote Summit
and Scorpio Gold U.S., silver ML heap leach Silver Peak, NV 89047
Corp. Phone: 775-753-4778
FAX: 775-753-4780
Web: http://www.scorpiogold.com
Silver Peak Operations Rockwood Lithium, Inc. T2S, R39-40E lithium carbonate OS, ML mining 75/10 P.O. Box 98
evaporation Silver Peak, NV 89047
precipitation Phone: 775-937-2222
FAX: 775-937-2250
Web: http://www.rockwoodlithium.com
EUREKA COUNTYBetze/Post Mine Barrick Goldstrike S23-26, gold OP, CIL, mining 1036 P.O. Box 29
Mines, Inc. T36N, R49E; HL, ML heap leach Elko, NV 89803
S12, 20, 29, 30; milling Phone: 775-748-1001
T36N, R50E roasting FAX: 775-748-1240
Web: http://www.barrick.com
Carlin North - Newmont Mining Corp. S33, T36N, R50E gold OP, HL, mining 2335/710 1655 Mountain Hwy.
Genesis Complex ML bioleaching (Combined Elko, NV 89801
heap leach Newmont Phone: 775-778-4000
milling Carlin Trend FAX: 775-778-4751
roasting Operations) Web: http://www.newmont.com
Carlin North - Post Newmont Mining Corp. S19, T36N, R50E gold OP, HL, mining 2335/710 1655 Mountain Hwy.
and adjacent mines ML bioleaching (Combined Elko, NV 89801
heap leach Newmont Phone: 775-778-4000
milling Carlin Trend FAX: 775-778-4751
roasting Operations) Web: http://www.newmont.com
Carlin South - Carlin Newmont Mining Corp. S14, T35N, R50E gold UG, HL, mining 2335/710 1655 Mountain Hwy.
and adjacent mines ML bioleaching (Combined Elko, NV 89801
heap leach Newmont Phone: 775-778-4000
milling Carlin Trend FAX: 775-778-4751
roasting Operations) Web: http://www.newmont.com

148
Directory of Mining and Milling Operations (continued)
Mine/Mill Name Operator Location Commodity Type Process/ Company/ Address
Activity Contract
Employees
EUREKA COUNTY (continued)
Carlin South - Newmont Mining Corp. S3, T33N, R51E gold OP, HL, mining 2335/710 1655 Mountain Hwy.
Gold Quarry ML bioleaching (Combined Elko, NV 89801
and adjacent mines heap leach Newmont Phone: 775-778-4000
milling Carlin Trend FAX: 775-778-4751
roasting Operations) Web: http://www.newmont.com
Dunphy Mill BAROID/Halliburton S14-16, 21-23, barite ML crushing 16/65 912 Dunphy Ranch Rd.
Energy Services, Inc. 26-28, 34-35, gravity (Mine and Battle Mountain, NV 89820
T37N, R49E grinding plant Phone: 775-468-0515
combined) FAX: 775-468-2060
Web: http://www.halliburton.com
Nevada Barth Iron Saga Exploration Co. S7, T31N, R51E iron OP, ML screening 5 2339 Dickerson Rd.
Mine and Mill Reno, NV 89503
Phone: 775-322-9994
Ruby Hill Mine Homestake Mining Co. of
California
S9-11, 14, 15, gold OP, CIL, heap leach 136/6 P.O. Box 676
California T19N, R53E silver CIP, HL, milling Eureka, NV 89316
ML Phone: 775-237-6060
FAX: 775-237-5408
Web: http://www.barrick.com
HUMBOLDT COUNTYBonanza Opal Mine Bonanza Opal Mines, Inc. S6, 7, precious opal OP mining 1 P.O. Box 127
T45N, R26E Denio, NV 89404
Phone: (Summer) 775-375-5955
Phone: (Winter) 864-597-1421
Web: http://www.bonanzaopals.net
Hycroft Mine Hycroft Resources and S26, T35N, R29E gold OP, HL mining 472/165 P.O. Box 3030
Development, Inc. silver heap leach Winnemucca, NV 89446
Phone: 775-623-5260
FAX: 775-623-0215
Web: http://www.alliednevada.com/
Lone Tree Mine Newmont Mining Corp. S1, 11, 13, gold OP, HL, flotation 56/55 P.O. Box 388
15, 23, silver ML heap leach Valmy, NV 89438-0388
T34N, R42E milling Phone: 775-635-6423
FAX: 775-635-6460
Web: http://www.newmont.com
Marigold Mine Goldcorp, Inc. S8, 9, 18-20; gold OP, HL, mining 343/17 P.O. Box 160
T33N, R43E silver ML heap leach Valmy, NV 89438
milling Phone: 775-635-2317
FAX: 775-635-2551
Web: http://www.goldcorp.com
MIN-AD Mine MIN-AD, Inc. S28, T35N, R38E dolomite OP, ML mining 13/2 P.O. Box 39
grinding Winnemucca, NV 89446
Phone: 775-623-5944
FAX: 775-623-9028
Web: http://www.min-ad.com
Pinson Mine Atna Resources, Ltd. S29, T38N, R42E gold UG mining 2 P.O. Box 969
silver Winnemucca, NV 89446-0969
Phone: 775-529-5026
FAX: 775-529-5030
Web: http://www.atna.com
Rainbow Ridge Rainbow Ridge S22, 23, opalized wood OP mining 1 P.O. Box 97
Opal Mine Opal Mines, Inc. T45N, R26E precious opal Denio, NV 89404
Phone: (Summer) 775-941-0270
Phone: (Winter) 541-548-4810
Web: http://www.nevadaopal.com
Royal Peacock Walter Wilson S30, T45N, R26E precious opal OP mining 1 P.O. Box 165
Opal Mine Denio, NV 89404
Phone: (Summer) 775-941-0374
Phone: (Winter) 775-272-3201
Web: http://www.royalpeacock.com
Turquoise Ridge Barrick Gold Corp. S33, T39N, R42E gold UG mining 417/112 2055 Getchell Mine Rd.
Joint Venture silver Golconda, NV 89414-9702
Phone: 775-529-5001
FAX: 775-529-0753
Web: http://www..barrick.com
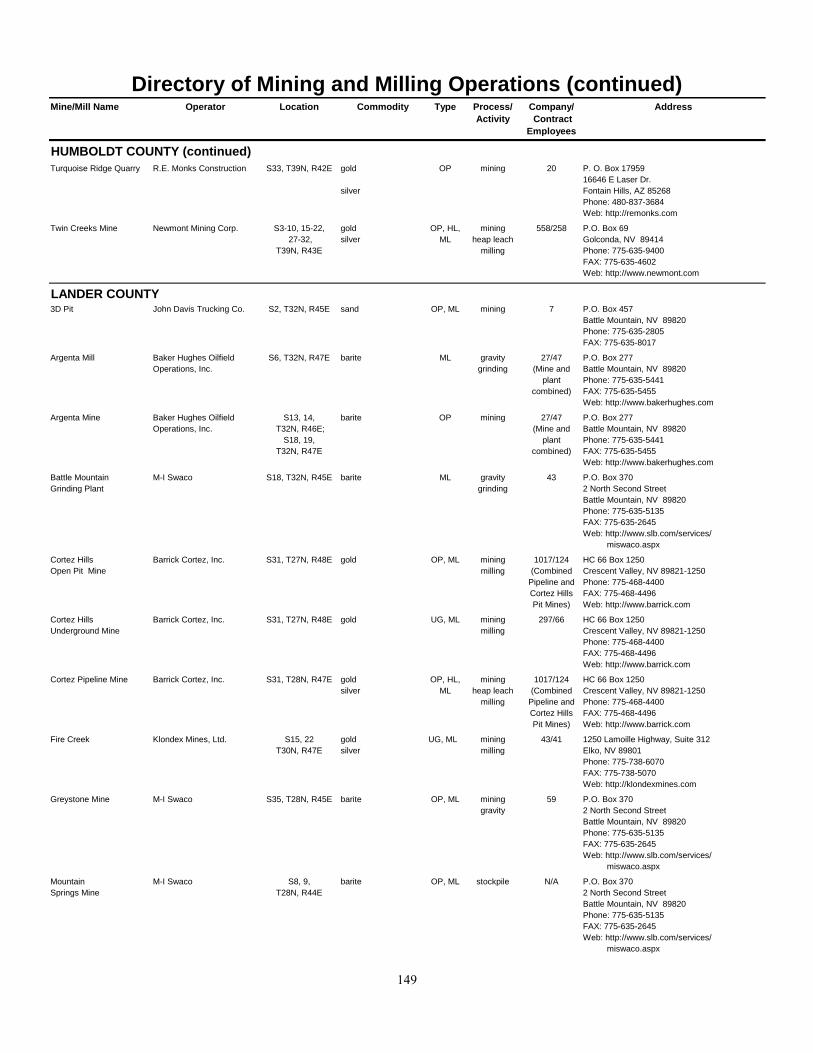
149
Directory of Mining and Milling Operations (continued) Mine/Mill Name Operator Location Commodity Type Process/ Company/ Address
Activity Contract
Employees
HUMBOLDT COUNTY (continued)
Turquoise Ridge Quarry R.E. Monks Construction
Co.
S33, T39N, R42E gold OP mining 20 P. O. Box 17959
16646 E Laser Dr.
silver Fontain Hills, AZ 85268
Phone: 480-837-3684
Web: http://remonks.com
Twin Creeks Mine Newmont Mining Corp. S3-10, 15-22, gold OP, HL, mining 558/258 P.O. Box 69
27-32, silver ML heap leach Golconda, NV 89414
T39N, R43E milling Phone: 775-635-9400
FAX: 775-635-4602
Web: http://www.newmont.com
LANDER COUNTY3D Pit John Davis Trucking Co. S2, T32N, R45E sand
gravel
OP, ML mining
screening
7 P.O. Box 457
Battle Mountain, NV 89820
Phone: 775-635-2805
FAX: 775-635-8017
Argenta Mill Baker Hughes Oilfield S6, T32N, R47E barite ML gravity 27/47 P.O. Box 277
Operations, Inc. grinding (Mine and Battle Mountain, NV 89820
plant Phone: 775-635-5441
combined) FAX: 775-635-5455
Web: http://www.bakerhughes.com
Argenta Mine Baker Hughes Oilfield S13, 14, barite OP mining 27/47 P.O. Box 277
Operations, Inc. T32N, R46E; (Mine and Battle Mountain, NV 89820
S18, 19, plant Phone: 775-635-5441
T32N, R47E combined) FAX: 775-635-5455
Web: http://www.bakerhughes.com
Battle Mountain M-I Swaco S18, T32N, R45E barite ML gravity 43 P.O. Box 370
Grinding Plant grinding 2 North Second Street
Battle Mountain, NV 89820
Phone: 775-635-5135
FAX: 775-635-2645
Web: http://www.slb.com/services/
miswaco.aspx
Cortez Hills Barrick Cortez, Inc. S31, T27N, R48E gold OP, ML mining 1017/124 HC 66 Box 1250
Open Pit Mine milling (Combined Crescent Valley, NV 89821-1250
Pipeline and Phone: 775-468-4400
Cortez Hills FAX: 775-468-4496
Pit Mines) Web: http://www.barrick.com
Cortez Hills Barrick Cortez, Inc. S31, T27N, R48E gold UG, ML mining 297/66 HC 66 Box 1250
Underground Mine milling Crescent Valley, NV 89821-1250
Phone: 775-468-4400
FAX: 775-468-4496
Web: http://www.barrick.com
Cortez Pipeline Mine Barrick Cortez, Inc. S31, T28N, R47E gold OP, HL, mining 1017/124 HC 66 Box 1250
silver ML heap leach (Combined Crescent Valley, NV 89821-1250
milling Pipeline and Phone: 775-468-4400
Cortez Hills FAX: 775-468-4496
Pit Mines) Web: http://www.barrick.com
Fire Creek Klondex Mines, Ltd. S15, 22 gold UG, ML mining 43/41 1250 Lamoille Highway, Suite 312
T30N, R47E silver milling Elko, NV 89801
Phone: 775-738-6070
FAX: 775-738-5070
Web: http://klondexmines.com
Greystone Mine M-I Swaco S35, T28N, R45E barite OP, ML mining 59 P.O. Box 370
gravity 2 North Second Street
Battle Mountain, NV 89820
Phone: 775-635-5135
FAX: 775-635-2645
Web: http://www.slb.com/services/
miswaco.aspx
Mountain M-I Swaco S8, 9, barite OP, ML stockpile N/A P.O. Box 370
Springs Mine T28N, R44E 2 North Second Street
Battle Mountain, NV 89820
Phone: 775-635-5135
FAX: 775-635-2645
Web: http://www.slb.com/services/
miswaco.aspx
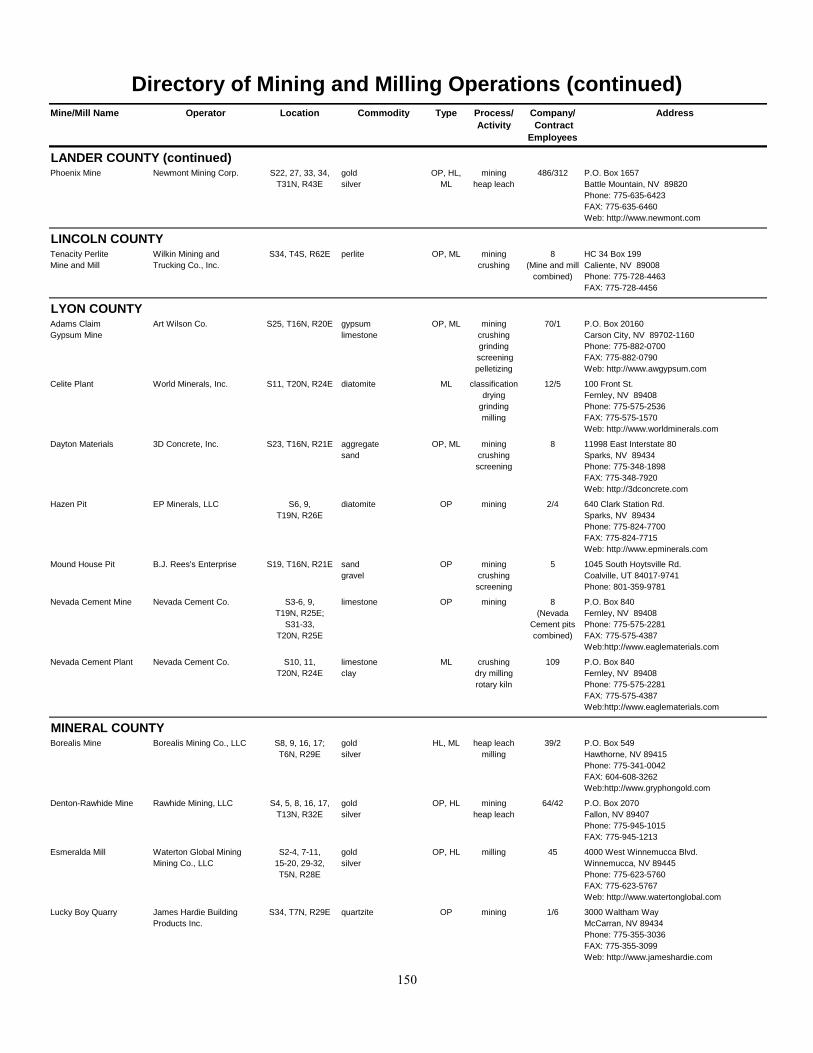
150
Directory of Mining and Milling Operations (continued)
Mine/Mill Name Operator Location Commodity Type Process/ Company/ Address
Activity Contract
Employees
LANDER COUNTY (continued)Phoenix Mine Newmont Mining Corp. S22, 27, 33, 34, gold OP, HL, mining 486/312 P.O. Box 1657
T31N, R43E silver ML heap leach Battle Mountain, NV 89820
Phone: 775-635-6423
FAX: 775-635-6460
Web: http://www.newmont.com
LINCOLN COUNTYTenacity Perlite Wilkin Mining and S34, T4S, R62E perlite OP, ML mining 8 HC 34 Box 199
Mine and Mill Trucking Co., Inc. crushing (Mine and mill Caliente, NV 89008
combined) Phone: 775-728-4463
FAX: 775-728-4456
LYON COUNTYAdams Claim Art Wilson Co. S25, T16N, R20E gypsum OP, ML mining 70/1 P.O. Box 20160
Gypsum Mine limestone crushing Carson City, NV 89702-1160
grinding Phone: 775-882-0700
screening FAX: 775-882-0790
pelletizing Web: http://www.awgypsum.com
Celite Plant World Minerals, Inc. S11, T20N, R24E diatomite ML classification 12/5 100 Front St.
drying Fernley, NV 89408
grinding Phone: 775-575-2536
milling FAX: 775-575-1570
Web: http://www.worldminerals.com
Dayton Materials 3D Concrete, Inc. S23, T16N, R21E aggregate OP, ML mining 8 11998 East Interstate 80
sand crushing Sparks, NV 89434
screening Phone: 775-348-1898
FAX: 775-348-7920
Web: http://3dconcrete.com
Hazen Pit EP Minerals, LLC S6, 9, diatomite OP mining 2/4 640 Clark Station Rd.
T19N, R26E Sparks, NV 89434
Phone: 775-824-7700
FAX: 775-824-7715
Web: http://www.epminerals.com
Mound House Pit B.J. Rees's Enterprise S19, T16N, R21E sand OP mining 5 1045 South Hoytsville Rd.
gravel crushing Coalville, UT 84017-9741
screening Phone: 801-359-9781
Nevada Cement Mine Nevada Cement Co. S3-6, 9, limestone OP mining 8 P.O. Box 840
T19N, R25E; (Nevada Fernley, NV 89408
S31-33, Cement pits Phone: 775-575-2281
T20N, R25E combined) FAX: 775-575-4387
Web:http://www.eaglematerials.com
Nevada Cement Plant Nevada Cement Co. S10, 11, limestone ML crushing 109 P.O. Box 840
T20N, R24E clay dry milling Fernley, NV 89408
rotary kiln Phone: 775-575-2281
FAX: 775-575-4387
Web:http://www.eaglematerials.com
MINERAL COUNTYBorealis Mine Borealis Mining Co., LLC S8, 9, 16, 17; gold HL, ML heap leach 39/2 P.O. Box 549
T6N, R29E silver milling Hawthorne, NV 89415
Phone: 775-341-0042
FAX: 604-608-3262
Web:http://www.gryphongold.com
Denton-Rawhide Mine Rawhide Mining, LLC S4, 5, 8, 16, 17, gold OP, HL mining 64/42 P.O. Box 2070
T13N, R32E silver heap leach Fallon, NV 89407
Phone: 775-945-1015
FAX: 775-945-1213
Esmeralda Mill Waterton Global Mining
Co., LLC
S2-4, 7-11, gold OP, HL milling 45 4000 West Winnemucca Blvd.
Mining Co., LLC 15-20, 29-32, silver Winnemucca, NV 89445
T5N, R28E Phone: 775-623-5760
FAX: 775-623-5767
Web: http://www.watertonglobal.com
Lucky Boy Quarry James Hardie Building S34, T7N, R29E quartzite OP mining 1/6 3000 Waltham Way
Products Inc. McCarran, NV 89434
Phone: 775-355-3036
FAX: 775-355-3099
Web: http://www.jameshardie.com
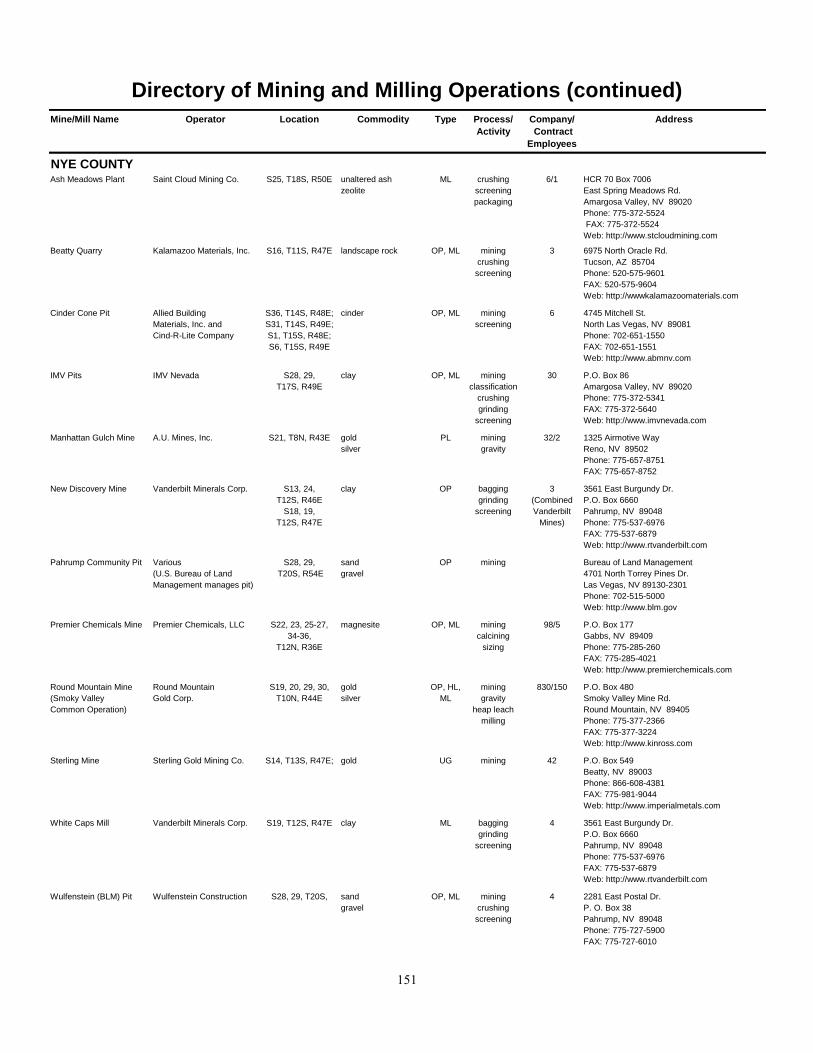
151
Directory of Mining and Milling Operations (continued)
Mine/Mill Name Operator Location Commodity Type Process/ Company/ Address
Activity Contract
Employees
NYE COUNTYAsh Meadows Plant Saint Cloud Mining Co. S25, T18S, R50E unaltered ash ML crushing 6/1 HCR 70 Box 7006
zeolite screening East Spring Meadows Rd.
packaging Amargosa Valley, NV 89020
Phone: 775-372-5524
FAX: 775-372-5524
Web: http://www.stcloudmining.com
Beatty Quarry Kalamazoo Materials, Inc. S16, T11S, R47E landscape rock OP, ML mining 3 6975 North Oracle Rd.
crushing Tucson, AZ 85704
screening Phone: 520-575-9601
FAX: 520-575-9604
Web: http://wwwkalamazoomaterials.com
Cinder Cone Pit Allied Building S36, T14S, R48E; cinder OP, ML mining 6 4745 Mitchell St.
Materials, Inc. and S31, T14S, R49E; screening North Las Vegas, NV 89081
Cind-R-Lite Company S1, T15S, R48E; Phone: 702-651-1550
S6, T15S, R49E FAX: 702-651-1551
Web: http://www.abmnv.com
IMV Pits IMV Nevada S28, 29, clay OP, ML mining 30 P.O. Box 86
T17S, R49E classification Amargosa Valley, NV 89020
crushing Phone: 775-372-5341
grinding FAX: 775-372-5640
screening Web: http://www.imvnevada.com
Manhattan Gulch Mine A.U. Mines, Inc. S21, T8N, R43E gold PL mining 32/2 1325 Airmotive Way
silver gravity Reno, NV 89502
Phone: 775-657-8751
FAX: 775-657-8752
New Discovery Mine Vanderbilt Minerals Corp. S13, 24, clay OP bagging 3 3561 East Burgundy Dr.
T12S, R46E grinding (Combined P.O. Box 6660
S18, 19, screening Vanderbilt Pahrump, NV 89048
T12S, R47E Mines) Phone: 775-537-6976
FAX: 775-537-6879
Web: http://www.rtvanderbilt.com
Pahrump Community Pit Various S28, 29, sand OP mining Bureau of Land Management
(U.S. Bureau of Land T20S, R54E gravel 4701 North Torrey Pines Dr.
Management manages pit) Las Vegas, NV 89130-2301
Phone: 702-515-5000
Web: http://www.blm.gov
Premier Chemicals Mine Premier Chemicals, LLC S22, 23, 25-27, magnesite OP, ML mining 98/5 P.O. Box 177
34-36, calcining Gabbs, NV 89409
T12N, R36E sizing Phone: 775-285-260
FAX: 775-285-4021
Web: http://www.premierchemicals.com
Round Mountain Mine Round Mountain S19, 20, 29, 30, gold OP, HL, mining 830/150 P.O. Box 480
(Smoky Valley Gold Corp. T10N, R44E silver ML gravity Smoky Valley Mine Rd.
Common Operation) heap leach Round Mountain, NV 89405
milling Phone: 775-377-2366
FAX: 775-377-3224
Web: http://www.kinross.com
Sterling Mine Sterling Gold Mining Co. S14, T13S, R47E; gold UG mining 42 P.O. Box 549
Beatty, NV 89003
Phone: 866-608-4381
FAX: 775-981-9044
Web: http://www.imperialmetals.com
White Caps Mill Vanderbilt Minerals Corp. S19, T12S, R47E clay ML bagging 4 3561 East Burgundy Dr.
grinding P.O. Box 6660
screening Pahrump, NV 89048
Phone: 775-537-6976
FAX: 775-537-6879
Web: http://www.rtvanderbilt.com
Wulfenstein (BLM) Pit Wulfenstein Construction
Co., Inc.
S28, 29, T20S,
R54E
sand OP, ML mining 4 2281 East Postal Dr.
gravel crushing P. O. Box 38
screening Pahrump, NV 89048
Phone: 775-727-5900
FAX: 775-727-6010

152
Directory of Mining and Milling Operations (continued)
Mine/Mill Name Operator Location Commodity Type Process/ Company/ Address
Activity Contract
Employees
PERSHING COUNTYBuff-Satin Mine Vanderbilt Minerals Corp. S2, T27N, R32E clay OP bagging 3 3561 East Burgundy Dr.
grinding (Combined P.O. Box 6660
screening Vanderbilt Pahrump, NV 89048
Mines) Phone: 775-537-6976
FAX: 775-537-6879
Web: http://www.rtvanderbilt.com
Coeur Rochester Mine Coeur Rochester, Inc. S9-11, 15, 16, silver OP, HL, mining 275/44 P.O. Box 1057
21, 27, 28, gold ML heap leach Lovelock, NV 89419
T28N, R34E milling Phone: 775-273-7995
FAX: 775-273-7423
Web: http://www.coeur.com
Colado Mines EP Minerals, LLC S6, 7, 16, diatomite OP, OS mining 30 P.O. Box 959
18, 21, 25, perlite 150 Coal Canyon Rd.
T28N, R29E Lovelock, NV 89419
Phone: 775-824-7591
FAX: 775-824-7595
Web: http://www.epminerals.com
Colado Plant EP Minerals, LLC S33, T28N, R32E diatomite ML calcining 100 P.O. Box 959
perlite classification 150 Coal Canyon Rd.
drying Lovelock, NV 89419
grinding Phone: 775-824-7591
FAX: 775-824-7595
Web: http://www.epminerals.com
Fencemaker Mine First Liberty Power Corp. S6, T25N, R37E; antimony UG mining 3 7251 West Lake Mead Blvd, Suite 300
S31, T26N, R37E Las Vegas, NV 89128
Phone: 800-709-1196
Web: http://www.firstlibertypower.com
Florida Canyon Mine Florida Canyon S1-4, 9-15, gold OP, HL, mining 158/56 P.O. Box 330
Mining, Inc. T31N, R33E; silver ML heap leach (Combined Imlay, NV 89418
S37-39, milling Florida Can. Phone: 775-538-7300
T31.5N, R33E; & Standard FAX: 775-538-7324
S33-35, Mines) Web: http://www.jipangu.co.jp
T32N, R33E
Nassau American Colloid Co. S8, T27N, R33E clay OP mining 0/1 P. O. Box 428
(Section 8) Mine shipping Lovell, WY 82431
Phone: 307-548-5135
FAX: 307-548-6449
Web: http://www.colloid.com
Standard Mine Florida Canyon S1, 12, gold OP, HL, heap leach 158/56 P.O. Box 330
Mining, Inc. T30N, R33E; silver ML (Combined Imlay, NV 89418
S35, T31N, R33E Florida Can. Phone: 775-538-7300
& Standard FAX: 775-538-7324
Mines) Web: http://www.jipangu.co.jp
Sunrise Gold Sunrise Minerals, LLC S17, T33N, R36E gold PL mining 3 7343 South Alton Way, Suite 100
Placer Mine gravity Centennial, CO 80112
Phone: 303-779-1800
FAX: 303-770-1995
W. Glen Sexton Nutritional Additives Corp. S5, T34N, R38E dolomite OP, ML mining 2 415 Wellington Street
Family Trust milling Winnemucca, NV 89445
Phone: 775-623-1151
FAX: 775-623-1153
Web: http://www.nutritionaladditives.com
STOREY COUNTYBasalite Dayton Pit Basalite Concrete S8, 9, 16, 17, sand OP mining 5 2500 Boeing Way
Products T17N, R22E gravel crushing Carson City, NV 89701
milling Phone: 775-882-9336
FAX: 775-887-1025
Web: http://www.basalite.paccoast.com
Clark Mill EP Minerals, LLC S35, T20N, R22E diatomite ML calcining 55 640 Clark Station Rd.
classification Sparks, NV 89434
drying Phone: 775-824-7700
grinding FAX: 775-824-7633
Web: http://www.epminerals.com
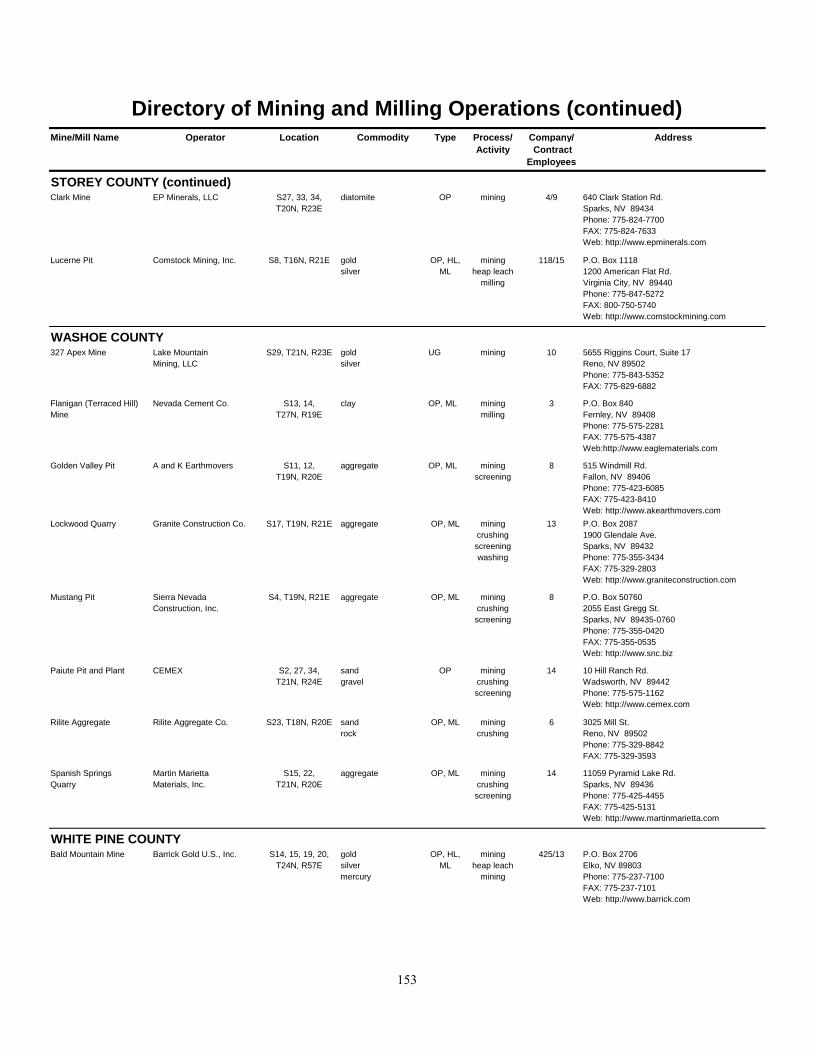
153
Directory of Mining and Milling Operations (continued)
Mine/Mill Name Operator Location Commodity Type Process/ Company/ Address
Activity Contract
Employees
STOREY COUNTY (continued)Clark Mine EP Minerals, LLC S27, 33, 34, diatomite OP mining 4/9 640 Clark Station Rd.
T20N, R23E Sparks, NV 89434
Phone: 775-824-7700
FAX: 775-824-7633
Web: http://www.epminerals.com
Lucerne Pit Comstock Mining, Inc. S8, T16N, R21E gold OP, HL, mining 118/15 P.O. Box 1118
silver ML heap leach 1200 American Flat Rd.
milling Virginia City, NV 89440
Phone: 775-847-5272
FAX: 800-750-5740
Web: http://www.comstockmining.com
WASHOE COUNTY327 Apex Mine Lake Mountain S29, T21N, R23E gold UG mining 10 5655 Riggins Court, Suite 17
Mining, LLC silver Reno, NV 89502
Phone: 775-843-5352
FAX: 775-829-6882
Flanigan (Terraced Hill) Nevada Cement Co. S13, 14, clay OP, ML mining 3 P.O. Box 840
Mine T27N, R19E milling Fernley, NV 89408
Phone: 775-575-2281
FAX: 775-575-4387
Web:http://www.eaglematerials.com
Golden Valley Pit A and K Earthmovers S11, 12, aggregate OP, ML mining 8 515 Windmill Rd.
T19N, R20E screening Fallon, NV 89406
Phone: 775-423-6085
FAX: 775-423-8410
Web: http://www.akearthmovers.com
Lockwood Quarry Granite Construction Co. S17, T19N, R21E aggregate OP, ML mining 13 P.O. Box 2087
crushing 1900 Glendale Ave.
screening Sparks, NV 89432
washing Phone: 775-355-3434
FAX: 775-329-2803
Web: http://www.graniteconstruction.com
Mustang Pit Sierra Nevada S4, T19N, R21E aggregate OP, ML mining 8 P.O. Box 50760
Construction, Inc. crushing 2055 East Gregg St.
screening Sparks, NV 89435-0760
Phone: 775-355-0420
FAX: 775-355-0535
Web: http://www.snc.biz
Paiute Pit and Plant CEMEX S2, 27, 34, sand OP mining 14 10 Hill Ranch Rd.
T21N, R24E gravel crushing Wadsworth, NV 89442
screening Phone: 775-575-1162
Web: http://www.cemex.com
Rilite Aggregate Rilite Aggregate Co. S23, T18N, R20E sand OP, ML mining 6 3025 Mill St.
rock crushing Reno, NV 89502
Phone: 775-329-8842
FAX: 775-329-3593
Spanish Springs Martin Marietta S15, 22, aggregate OP, ML mining 14 11059 Pyramid Lake Rd.
Quarry Materials, Inc. T21N, R20E crushing Sparks, NV 89436
screening Phone: 775-425-4455
FAX: 775-425-5131
Web: http://www.martinmarietta.com
WHITE PINE COUNTYBald Mountain Mine Barrick Gold U.S., Inc. S14, 15, 19, 20, gold OP, HL, mining 425/13 P.O. Box 2706
T24N, R57E silver ML heap leach Elko, NV 89803
mercury mining Phone: 775-237-7100
FAX: 775-237-7101
Web: http://www.barrick.com

154
Directory of Mining and Milling Operations (continued)
Mine/Mill Name Operator Location Commodity Type Process/ Company/ Address
Activity Contract
Employees
WHITE PINE COUNTY (continued)Mount Moriah Quarry Mount Moriah S22, 23, 26, building stone OP mining 32 P.O. Box 70
Stone Quarries, LLC 27, 33-36, landscape rock No. 10 Hatch Rock Rd.
T16N, R70E Baker, NV 89311
Phone: 435-855-2232
FAX: 435-855-2332
Web: http://mtmoriahstone.com
Robinson Mine KGHM International, Ltd. S6, 8, 17, 18, copper OP, ML mining 608/40 P.O. Box 382
T16N, R62E gold milling Ruth, NV 89319
silver Phone: 775-289-7000
molybdenum FAX: 775-289-7349
Web: http://www.quadrafnx.com

96
For additional information on Nevada’s mineral resources and mineral industries, see thefollowing NBMG publications:
Statewide Commodity PublicationsAntimony (B61) Nevada active mines and energyBarite (B98) producers (OF14-1) Fluorspar (B93) Radioactive minerals (B81, OF06-19)Gypsum (B103) Talcose minerals (B84) Iron (B53) Thermal waters (B91, M161, M151)Mercury (B41) Tungsten (B105) Montmorillonite, bentonite, Zeolites (B79) and fuller’s earth (B76)Oil and gas (B104, OF01-7, OF04-1,
OF11-2, OF11-6, M162)
County Mineral Resource BulletinsCarson City (B75) Eureka (B64) Nye (B77, B99B)Churchill (B83) Humboldt (B59) Pershing (B89)Clark (B62) Lander (B88) Storey (B70)Douglas (B75) Lincoln (B73) Washoe (B70)Elko (B106) Lyon (B75) White Pine (B85)Esmeralda (B78) Mineral (B58)
Other PublicationsIndex to geothermal well files housed at NBMG (L-5) Gold and silver resources in Nevada (M149) Geothermal resources (M161)Industrial mineral deposits (M142)Nevada oil and gas well database (OF04-1)Major mines of Nevada 2013 (P-25)Outline of Nevada mining history (SP15)Mining districts of Nevada (R47)
NBMG maintains an open-file office with the following information available to the public:• NBMG,USGS,USBM,andDOEopen-filereportsonNevadageologyandmineralresources• petroleum and geothermal exploration and production• mining district records and maps• mineral resources and reserves• mineral resource assessments• core and cuttings library• wilderness study area reports• general geologic studies• indexes and ordering information for maps, air photos, and remote sensing imagery

97
The Nevada Bureau of Mines and Geology (NBMG) is a research and public service unit of the University of Nevada and is the state geological survey. NBMG is part of the Mackay School of Earth Sciences and Engineering within the College of Science at the University of Nevada, Reno. NBMG scientists conduct research and publish reports on mineral resources, engineering geology, environmental geology, hydrogeology, and geologic mapping. Individuals interested in Nevada geology are encouraged to visit, call, or write NBMG or visit our home page at:
www.nbmg.unr.edu
Director, Research Faculty, Cartographic and Administrative Staff
NBMG offices on the main campus of the University of Nevada are located in the west wing of the Scrugham Engineering/Mines building.
Great Basin Science Sample and Records Library/Publication Sales & Information Office
Contact our Publications Sales and Information Office to purchase or obtain additional information about NBMG geologic maps and reports; U.S. Geological Survey geologic maps and publications; U.S. Geological Survey topographic maps; aerial photographs; cuttings, core, and well records for oil, gas, and geothermal; general geological and mining information.
The University of Nevada, Reno is an Equal Opportunity/Affirmative Action employer and does not discriminate on the basis of race, color, religion, sex, age, creed, national origin, veteran status, physical or mental disability, and in accordance with university policy, sexual orientation, in any program or activity it operates. The University of Nevada, Reno employs only United States citizens and aliens lawfully authorized to work in the United States.
NB
MG
Special Publication MI-2013
THE N
EVAD
A MIN
ERA
L IND
USTRY 2013
Phone: (775) 784-6691 Fax: (775) 784-1709 E-mail: [email protected]
U.S. Mail:Nevada Bureau of Mines and GeologyMail Stop 178University of NevadaReno, NV 89557-0178
Phone: (775) 682-8766 Fax: (775) 784-6690 E-mail: [email protected]
UPS or Federal Express:Nevada Bureau of Mines and GeologyMail Stop 178University of Nevada1664 N. Virginia StreetReno, NV 89503
Please check the NBMG website for hours of operation.
2175 Raggio ParkwayReno, NV 89512