Metabolism of hydroperoxy-phospholipids in human hepatoma ... · Metabolism of...
10
Metabolism of hydroperoxy-phospholipids in human hepatoma HepG2 cells Yongping Bao and Gary Williamson’ Department of Biochemistry, Institute of Food Research, Norwich Laboratory, Norwich Research Park, Colney, Norwich, NR4 7UA, United Kingdom Abstract Two enzymatic mechanisms have been proposed for the metabolism of hydroperoxy-phospholipids: i) the com- bined action of phospholipase A2 and glutathione peroxidase, and/or ii) direct enzymatic reduction. The latter reaction may be catalyzed by selenium-dependent phospholipid hy- droperoxide glutathione peroxidase and/or by glutathi- one Stransferase a. To study the pathway of this reaction, we used human hepatoma HepC2 cells into which was in- corporated labeled, hydroperoxy-phospholipids. The major product of incorporated l-palmitoyl-2-( 1 3-hydroperoxy-ci* 9,trunsl l-octadecadienoyl)-~-3-phosphatidylcholine was the corresponding hydroxy-phospholipidwith no hydroxy- or hy- droperoxy-fatty acids. The contributions to reduction of hy- droperoxy-phospholipids in HepC2 cells from glutathione Stransferase A1 and phospholipid hydroperoxide glutath- ione peroxidase were calculated to be 0.5% and 99.5%, re- spectively. Increasing selenium in the cell culture medium led to increases in selenium-dependent phospholipid hydroper- oxide glutathione peroxidase activity but not in glutathione Stransferase a. This increase in the seleniumdependent en- zyme was paralleled by a concomitant increase in the extent of reduction of the incorporated hydroperoxy-phospho1ipid.m We conclude that the main metabolic fate of hydroperoxy- phospholipids in HepC2 cells is by direct reduction to hy- droxy-phospholipidsby phospholipid hydroperoxide glutathi- one peroxidase but also by glutathione Stransferase a, and that phospholipase AJselenium-dependent glutathione per- oxidase does not play a significant role in the reduction.- Bao, Y., and G. Williamson. Metabolism of hydroperoxy-phos- pholipids in human hepatoma HepC2 cel1s.J. Lipid Res. 1996. 37: 235 1-2360. ases (5). Fatty acid hydroperoxides, especially of arachi- donic acid, are released from phospholipids and form the initial metabolites in pathways of leukotriene, pros- taglandin, and thromboxane synthesis from arachi- donic acid, as part of the inflammatory response to vari- ous cytokines (6). Estimates of the steady state concentration of oxidized phospholipid (mainly as hy- droperoxy-phosphatidylcholine) in cells are not known, but in human plasma the levels show inter-individual variation, with values in the range of 4-24 nM (7); these are increased on oxidative stress (8). This concentra- tion is sufficient for activation of prostaglandin synthase (9). Further, the decomposition products of hydroper- oxy-phospholipids, malondialdehyde and 4hydroxyno- nenal, modify the structure and correct functioning of DNA and protein (10, 11). Fatty acid hydroperoxides are metabolized by sele- niumdependent glutathione peroxidase (Se-GPx, glutathione : hydrogen peroxide oxidoreductase, EC 1.11.1.9) (12), by glutathione Stransferase (GST, RX: glutathione R-transferase EC 2.5.1.18) (13) ~1 (primarily A1 and A2 in humans), by the hydroperoxidase compo- nent of prostaglandin synthase (9), and by a hemoprot- ein fatty acid lyase (14). These enzymes may therefore provide some protection against propagation of lipid peroxidation generated by oxidative stress. However, the fate of hydroperoxy-phospholipids is not clear, and Supplementary key words phospholipid hydroperoxide glutathione oeroxidase glutathione Stransferase bid oeroxidation sekniiim possible mechanisms have been proposed. The first n ~ , ~~ , ~~~~~ ~~ ~~~ ~~~..~~~~.. HepGP cells phospholipase A2 phospholipid membrane is the release of oxidized fatty acids from membrane hydroperoxy-phospholipids by phospholipase Ap, fol- Oxidized phospholipids are generated in cell mem- branes by specific iron-dependent intracellular lipoxy- Abbreviations: PHGPx, phospholipid hydroperoxide glutathione genases and cyclooxygenases ( 1 ) , by extracellular sig- peroxidase; GPx, glutathione peroxidase; GST, glutathione- Stransferase; PLA,, phospholipase A2; PLPC, l-palmitoyl-2- or ischaemia ( 3, 4) . The resulting hydroperoxy-phos- hydroperoxy-cis-9,trnns-1 l-xtadecadienoyl)-L-3-phosphatidylcholine; pholipids contribute to cellular peroxide levels that PLPGOH, l-palmitoyl-2-(l3hydroxy-czs-9,truns-l l-octadecadienoy1)- 1.-3-phosphatidyIcholine; La-OOH, linoleic acid hydroperoxide; La- control synthesis of platelet thromboxane and arterial OH, linoleic acid hydroxide, wall prostacyclin, and also further activate lipoxygen- nals such as phorbol esters (‘) ’ and toxins, linoleoyl-r.-3phosphatidylcholine; PLPGOOH, l-palmitoyl-2-( 1.3- ‘TO whom correspondence should be addressed. Journal of Lipid Research Volume 37, 1996 2351 by guest, on July 14, 2018 www.jlr.org Downloaded from
Transcript of Metabolism of hydroperoxy-phospholipids in human hepatoma ... · Metabolism of...

Metabolism of hydroperoxy-phospholipids in human hepatoma HepG2 cells
Yongping Bao and Gary Williamson’
Department of Biochemistry, Institute of Food Research, Norwich Laboratory, Norwich Research Park, Colney, Norwich, NR4 7UA, United Kingdom
Abstract Two enzymatic mechanisms have been proposed for the metabolism of hydroperoxy-phospholipids: i) the com- bined action of phospholipase A2 and glutathione peroxidase, and/or ii) direct enzymatic reduction. The latter reaction may be catalyzed by selenium-dependent phospholipid hy- droperoxide glutathione peroxidase and/or by glutathi- one Stransferase a. To study the pathway of this reaction, we used human hepatoma HepC2 cells into which was in- corporated labeled, hydroperoxy-phospholipids. The major product of incorporated l-palmitoyl-2-( 1 3-hydroperoxy-ci* 9,trunsl l-octadecadienoyl)-~-3-phosphatidylcholine was the corresponding hydroxy-phospholipid with no hydroxy- or hy- droperoxy-fatty acids. The contributions to reduction of hy- droperoxy-phospholipids in HepC2 cells from glutathione Stransferase A1 and phospholipid hydroperoxide glutath- ione peroxidase were calculated to be 0.5% and 99.5%, re- spectively. Increasing selenium in the cell culture medium led to increases in selenium-dependent phospholipid hydroper- oxide glutathione peroxidase activity but not in glutathione Stransferase a. This increase in the seleniumdependent en- zyme was paralleled by a concomitant increase in the extent of reduction of the incorporated hydroperoxy-phospho1ipid.m We conclude that the main metabolic fate of hydroperoxy- phospholipids in HepC2 cells is by direct reduction to hy- droxy-phospholipids by phospholipid hydroperoxide glutathi- one peroxidase but also by glutathione Stransferase a, and that phospholipase AJselenium-dependent glutathione per- oxidase does not play a significant role in the reduction.- Bao, Y., and G. Williamson. Metabolism of hydroperoxy-phos- pholipids in human hepatoma HepC2 cel1s.J. Lipid Res. 1996. 37: 235 1-2360.
ases ( 5 ) . Fatty acid hydroperoxides, especially of arachi- donic acid, are released from phospholipids and form the initial metabolites in pathways of leukotriene, pros- taglandin, and thromboxane synthesis from arachi- donic acid, as part of the inflammatory response to vari- ous cytokines (6). Estimates of the steady state concentration of oxidized phospholipid (mainly as hy- droperoxy-phosphatidylcholine) in cells are not known, but in human plasma the levels show inter-individual variation, with values in the range of 4-24 nM (7); these are increased on oxidative stress (8). This concentra- tion is sufficient for activation of prostaglandin synthase (9). Further, the decomposition products of hydroper- oxy-phospholipids, malondialdehyde and 4hydroxyno- nenal, modify the structure and correct functioning of DNA and protein (10, 11).
Fatty acid hydroperoxides are metabolized by sele- niumdependent glutathione peroxidase (Se-GPx, glutathione : hydrogen peroxide oxidoreductase, EC 1.11.1.9) (12), by glutathione Stransferase (GST, RX: glutathione R-transferase EC 2.5.1.18) (13) ~1 (primarily A1 and A2 in humans), by the hydroperoxidase compo- nent of prostaglandin synthase (9), and by a hemoprot- ein fatty acid lyase (14). These enzymes may therefore provide some protection against propagation of lipid peroxidation generated by oxidative stress. However, the fate of hydroperoxy-phospholipids is not clear, and
Supplementary key words phospholipid hydroperoxide glutathione oeroxidase glutathione Stransferase b i d oeroxidation sekniiim possible mechanisms have been proposed. The first
n ~ , ~~ , ~~~~~ ~~ ~~~ ~ ~ ~ . . ~ ~ ~ ~ . .
HepGP cells phospholipase A2 phospholipid membrane is the release of oxidized fatty acids from membrane hydroperoxy-phospholipids by phospholipase Ap, fol-
Oxidized phospholipids are generated in cell mem- branes by specific iron-dependent intracellular lipoxy- Abbreviations: PHGPx, phospholipid hydroperoxide glutathione genases and cyclooxygenases ( 1 ) , by extracellular sig- peroxidase; GPx, glutathione peroxidase; GST, glutathione-
Stransferase; PLA,, phospholipase A2; PLPC, l-palmitoyl-2-
or ischaemia ( 3, 4) . The resulting hydroperoxy-phos- hydroperoxy-cis-9,trnns-1 l-xtadecadienoyl)-L-3-phosphatidylcholine; pholipids contribute to cellular peroxide levels that PLPGOH, l-palmitoyl-2-(l3hydroxy-czs-9,truns-l l-octadecadienoy1)-
1.-3-phosphatidyIcholine; La-OOH, linoleic acid hydroperoxide; La- control synthesis of platelet thromboxane and arterial OH, linoleic acid hydroxide, wall prostacyclin, and also further activate lipoxygen-
nals such as phorbol esters (‘) ’ and toxins, linoleoyl-r.-3phosphatidylcholine; PLPGOOH, l-palmitoyl-2-( 1.3-
‘TO whom correspondence should be addressed.
Journal of Lipid Research Volume 37, 1996 2351
by guest, on July 14, 2018w
ww
.jlr.orgD
ownloaded from

lowed by reduction of the liberated hydroperoxy fatty acid to hydroxy fatty acid by either Se-GPx or by GST a (13, 15, 16). The second is a direct reduction of phos- pholipid hydroperoxides to their corresponding hy- droxyderivatives without the action of phospholipase
vestigate the metabolism of hydroperoxy-phospholip- ids, and we conclude that the main product is hydroxy- phospholipid, and that the reaction is catalyzed mainly by Se-PHGPx.
A2 (PUB).
PC-OOH PLA,
La-OOH + lyso-PC
Se-GPx
or GST c1
PHGPx
and GST a
La-OOH + 2 GSH ----+ La-OH + GSSG + H,O
PC-OOH + 2 GSH PC-OH + GSSG + H20 2)
where PC is a phospholipid, and La is a fatty acid. The phospholipase A2/GPx mechanism is supported by studies on oxidized phospholipid membranes in vitro. The specific activity of phospholipase A2 on such mem- branes is increased relative to the action on unoxidized phospholipids (17). However, it is not clear whether the concentration of hydroperoxy-phospholipid in a cellu- lar membrane would be sufficient to activate phospholi- pase Ap, as the effects appear to be dependent on mem- brane molecular order. On the other hand, agents that mediate the inflammatory response such as tumor ne- crosis factor and interleukin-1 (18), oxidative stress such as vitamin E deficiency, and agents that increase intracellular calcium (19) also activate phospholipase A2, whereas ascorbate decreases it (20). Mechanism 2 could be catalyzed by either seleniumdependent phos- pholipid hydroperoxide glutathione peroxidase (Se- PHGPx, gene product of GPX4) (21-23) or by certain isoforms of GST, especially a in the liver but also "5.8" in other tissues (24).
Detailed studies have been reported on the compari- son between human hepatoma HepG2 cells and normal liver parenchymal cells. Both cell types secrete similar levels of at least 17 major human plasma proteins (25), have similar levels and inducibilities of many xenobi- otic-metabolizing enzymes (26), are morphologically comparable (27), are very similar in membrane lipid composition (28), and exhibit similar fatty acid trans- port characteristics (29). Therefore, this cell line serves as an appropriate and reliable model to study the me- tabolism of fatty acids and phospholipids (25 , 28). The levels of two selenium-dependent glutathione peroxi- dases in HepG2 cells, Se-GPx and Se-PHGPx, can be manipulated by selenium supplementation (30), and we have used this as a tool to test the involvement of these enzymes, and of GST, in metabolism of oxidized phospholipids. In this study, we used a I4C-labeled hy- droperoxy-phospholipid incorporated into HepG2 cells in selenium-supplemented and normal medium to in-
EXPERIMENTAL PROCEDURES 1)
Materials
l-Palmitoyl-2-linoleoyl-~-3-phosphatidylcholine (PLPC), soybean lipoxidase (EC 1.13.11.12, type IV), dithiothreitol, phenylmethylsufonyl fluoride, choline chloride, sodium selenite, reduced GSH and Triton X- 100 (peroxide and carbonyl free), insulin, and trans- ferrin were purchased from Sigma Chemical, Poole, Dorset, UK. 1-Palmitoyl-2-[ l-"C] linoleoyl-r~-3phospha- tidylcholine was from Arnersham International plc, Bucks., UK Methanol and acetonitrile, used for HPLC, were filtered and degassed. Monoflow 4 scintillant was from National Diagnostics, Manville, NJ. Human HepG2 hepatoma cell line was from European Collec- tion of Animal Cell Cultures (UK) . All other chemicals were analytical grade.
Preparation of PLPC-OOH and PLPGOH PLPC-OOH was prepared from PLPC using lipoxi-
dase as described by Maiorino, Gregolin, and Ursini (31). The reaction mixture contained 0.2 M sodium bo- rate (pH g) , 3 mM sodium deoxycholate, and 0.3 mM PLPC. The reaction was started by the addition of 0.05 mg/ml soybean lipoxidase and stirred at room temper- ature for 20 min. The resulting PLPC-OOH was sepa- rated from oxidized phospholipid by a PepRFT H5/5 column with a gradient of water (100%) to methanol (100%) in 10 min. PLPC-OOH was eluted with 100% methanol, and the central area of the peak was col- lected. The concentration of the hydroperoxide solu- tion was determined by absorbance at 232 nm (E = 25,000 ~ - ' c m - ' ) . The 14Glabeled PLPC was diluted with unlabeled PLPC to a radioactivity of 4 pCi/pmol and the I4C-labeled PLPC-OOH was prepared by the same method for unlabeled PLPGOOH as described above. The efficiency of '% counting was 80% and was deter- mined relative to a standard curve. PLPC-OH was pre- pared by NaBH, reduction of PLPC-OOH (32) and sub- sequent purification by Sep-Pak CIS cartridge (Waters Associates, MA). The identities of PLPC-OOH and PLPGOH were confirmed by fast atom bombardment mass spectrometry (33). No molecular ions for PLPC- OH were seen in the preparation of PLPCOOH. As determined by HPLC, the purity of PLPC-OH was >99.2%. This was based on injections of 500 pmol of PLPC-OH with a detection limit of <4 pmol undei- the described conditions.
2352 Journal of Lipid Research Volume 37, 1996
by guest, on July 14, 2018w
ww
.jlr.orgD
ownloaded from
Human HepGP hepatoma cell culture
HepG2 cells were routinely grown in Eagle's minimal essential medium with L-glutamine, nonessential amino acids, and 10% fetal calf serum (FCS) at 37"C, 5% COP in air. The medium was changed twice a week and con- fluent cells were subcultured weekly at a split ratio of 1 : 6 by treatment with 0.25% trypsin-EDTA. Normal HepG2 cells were grown in 10% FCS medium that con- tained endogenous selenium at 512.8 nM. One popula- tion of cells were made seleniumdeficient (Se( -) cells) by gradual weaning from 10% FCS to 2% FCS in Eagle's minimal essential medium containing insulin (10 pg/ ml) and transferrin (5 pg/ml). Se(+) cells were grown in 10% FCS with added selenium in the form of sodium selenite (100 nM) for 24 h. The cells were harvested us- ing trypsin-EDTA, cell extracts for measurement of en- zymatic activities were obtained by sonication in 0.1% digitonin in 0.1 M Tris-HC1, pH 7.4,l mM dithiothreitol, and 1 mM phenylmethylsulfonyl fluoride.
Incorporation of PLPGOOH to membranes There is one report about the incorporation of hydro-
peroxy-phospholipids into cells (34). When we exam- ined the stability of hydroperoxy-phospholipids in the cell culture medium reported in that paper (10% FCS in Eagle's minimum essential medium), the hydroper- oxy-phospholipid was unstable and was broken down very rapidly. In our experiments using the conditions described (in ref. 34), only 3.0 2 0.2% (n = 3) hydro- peroxy-phospholipid was left after a 2 h incubation in 37°C with 5% COB. Further, no PLPGOH was detected in the medium. A mixture of PLPC-OOH with 10% FCS in Eagle's minimum essential medium in the absence of cells led to breakdown of PLPGOOH at a compara- ble rate as in the presence of cells. Fetal calf serum was responsible for the observed breakdown of PLPC-OOH, so that a modified serum-free medium containing 0.3% bovine serum albumin was used for the incorporation of hydroperoxy-phospholipids for a short period of time. PLPC-OOH (50 p ~ ) was relatively stable in the modified medium: 89.7 5 2.1% (n = 3) PLPGOOH remained after 2 h, and 10.3 ? 2.1% (n = 3) was re- duced to PLPC-OH. After 4 h, 80.3 5 4.1% (n = 3) of the initial PLPC-OOH remained. When the cells were almost confluent, they were incubated with the serum- free Eagle's minimum essential medium containing 0.3% (w/v) bovine serum albumin and PLPC-OOH (5- 100 p~ in methanol) at 37°C with 5% C 0 2 for the de- sired time. The final methanol concentration was less than 0.4%, and cells added with methanol were cul- tured as a control. Total cellular lipids were extracted using chloroform-methanol 2 : 1 (v/v), dried with ni- trogen, redissolved in methanol, and then applied to HPLC. The values quoted here and throughout the text
are the mean and standard deviations of n determina- tions.
Preparation of glutathione Stransferase Al-1 The plasmid ptacGST2 was expressed in E. coli (35)
and glutathione Stransferase Al-1 was purified using affinity chromatography on Shexyl-glutathione-agarose (36). The enzyme was >99% pure as judged by SDS PAGE.
Protein and enzyme assays
Protein contents of the samples were determined by the dye-binding assay (Bio-Rad) of Bradford (37) using bovine serum albumin as a standard. Se-GPx activity was measured by a coupled spectrophotometric assay using hydrogen peroxide as substrate (38). GST activity was measured as described (39) using l-chloro-2,4dinitro- benzene as substrate. The rate of conversion of PLPG OOH to PLPC-OH was measured by HPLC (33).
HPLC separation and detection of PLPC-OOH and PLPC-OH
PLPGOOH and PLPC-OH contents in the cells after treatment with phospholipid hydroperoxide was deter- mined by HPLC. Cells were rinsed twice with phos- phate-buffered saline and treated with trypsin-EDTA, and the resulting cell suspension was centrifuged at 176 g for 5 min. The packed cells obtained were washed twice with phosphate-buffered saline, and extracted with 0.5 ml chloroform-methanol 2 : 1 containing 0.005% butylated hydroxytoluene. The mixture was then shaken for 3 min and centrifuged at 16,000 g for 5 min. The lower phase was dried under NP, and the residue redissolved in methanol. Aliquots (20 pl) of the solution were analyzed by HPLC using an Ultracarb 5 ODS (20) column (250 X 4.6 mm). The mobile phase was an acetonitrile-methanol-water 50 : 49.5 : 0.5 (v/v/ v) containing 10 mM choline chloride at 0.5 ml/min with detection at 232 nm. The peaks of PLPGOOH and PLPC-OH were quantified from the peak heights using external standards, with a detection limit of 4 pmol. When using '*Glabeled PLPC-OOH, the flow rate of scintillant was 1.5 ml/min with direct on line detection of radioactivity. The peaks were quantified by collecting fractions and scintillation counting.
RESULTS
Uptake of hydroperoxy-phospholipids in HepG2 cells Phospholipids constitute about 3% of the wet weight
of hepatocytes (40), which is equivalent to an apparent intracellular concentration of -40 mM. HepG2 cells have a similar phospholipid content (28). HepG2 cells
Bao and Williamson Metabolism of hydroperoxy-phospholipids 2353
by guest, on July 14, 2018w
ww
.jlr.orgD
ownloaded from
are able to efficiently take up a variety of forms of fatty acids from the culture medium (29), and there are no defects in the incorporation of phospholipids into the maturing lipoprotein by HepG2 cells (41). In order to study the metabolism of hydroperoxy-phospholipids, we specifically incorporated a low level of pure hydro- peroxy-phospholipid, 1 -palmitoyl-2- ( 1 3-hydroperoxy- cis-9, trans-1 l-octadecadienoyl)-r~-3-phosphatidylcholine (PLPCOOH), into the cells. To facilitate this, a modi- fied medium was used in which PLPC-OOH is rela- tive stable (see Experimental section). At a concen- tration of 50 ~ L M PLPC-OOH in the medium, 1.05 2 0.04% (n = 4) of the total PLPC-OOH was incorpo- rated into lo7 cells in 2 h as determined by HPLC analysis of cell extracts. This demonstrates uptake and is equivalent to a total apparent concentration of 200 ~ L M in the cell, although clearly the local intracel- lular concentrations in each organelle will vary widely. Thus the incorporated phospholipid derivatives consti- tute only -0.5% of the total phospholipid. The con- centration of peroxides in unstressed cells is unknown, but the total cellular peroxide is profoundly increased by various stimuli and this can lead to apoptosis (2, 6). However, after incorporation of PLPC-OOH (50 IM
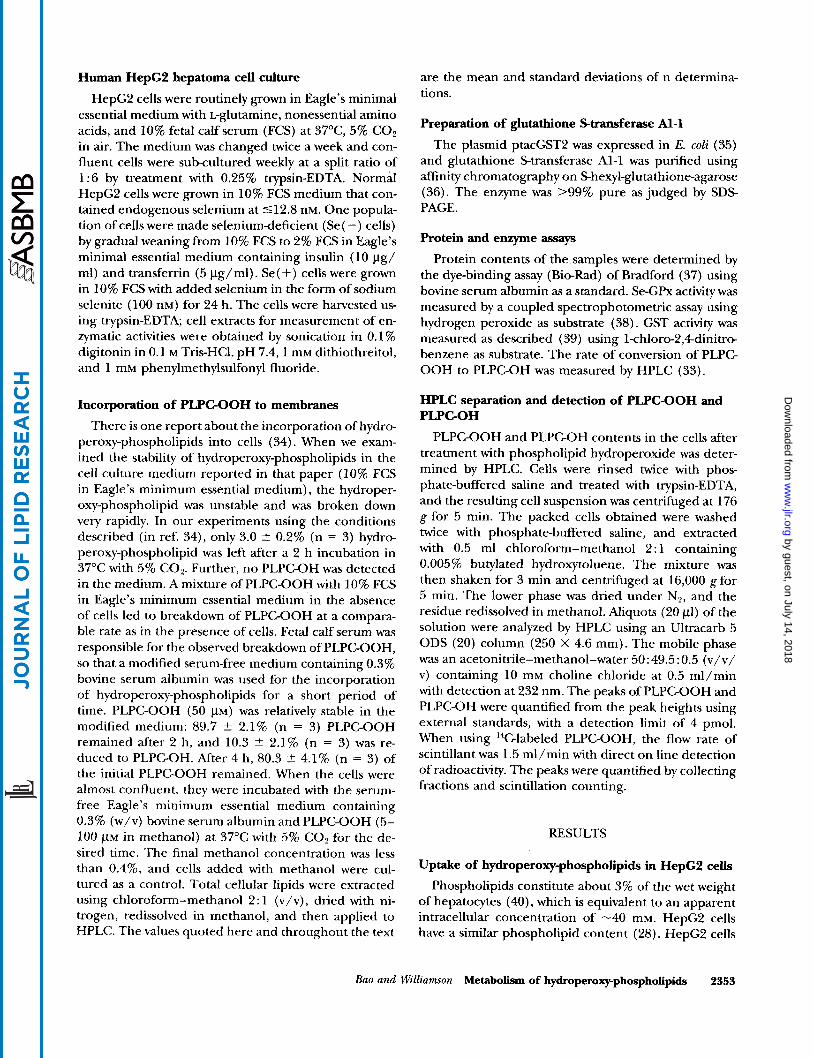
for 2 h) into the HepG2 cells, there was no effect on either cell viability as assessed by trypan blue exclu- sion (97.7 t 1.6% (n = 4) after trypsin/EDTA treat- ment for control cells, 97.0 % 1.2% (n = 4) for PLPC- OOH-treated) or on cellular morphology as judged by scanning electron microscopy. Uptake of PLPC-OOH was also demonstrated using labeled PLPC-OOH. 14Glabeled 1-palmitoyl-2-( 13-hydroperoxy-cis9, franc1 1 - octadecadienoyl)-~-3-phosphatidylcholine was added to the cell culture medium. After 2 h, the cells were washed twice and the incorporated label was measured in a membrane extract. Of the total I4C-labeled PLPC- OOH, 1.06 % 0.15% (n = 3) was taken up by the cells, which again shows uptake of PLPC-OOH. Uptake was also demonstrated indirectly by comparing the ratios of PLPC-OOH to PLPC-OH in the medium and in the cells. After incorporation into the cell membrane, me- tabolism results in the formation of PLPC-OH (see be- low). The distribution of PLPC-OOH and PLPC-OH in the cell culture medium and in cell extracts was tested by HPLC after addition of PLPC-OOH (50 VM, Fig. 1). In cell culture medium, 24.9 t 3.7% (n = 3 ) PLPC- OOH was reduced to PLPC-OH and 75.1 t 3.7% (n =
3) PLPC-OOH remained intact after 4 h. On the other hand, incorporation of phospholipid into HepC2 cells resulted in an intracellular ratio of PLPC-OH to PLPC- OOH of 97: 3.
Conversion of hydroperoxy- to hydroxy-phospholipids HepG2 cells were incubated with PLPC-OOH (50
J ~ M ) for 1-6 h. The PLPC-OH and PLPC-OOH contents
10 15 20 25
Retention time (min)
Fig. 1. Comparison of the ratio of PLPGOOH to Pl.P(:-OH aftc-r addition of PLPC-OOH to the HepG:! cell culture medium (50 p) and incubation for 4 h. Chromatograms showing the ratio of PLP(:- OOH to PLPC-OH in A the cell culture medium and B: the rell c x tract. The arrows show the elution position of sundards.
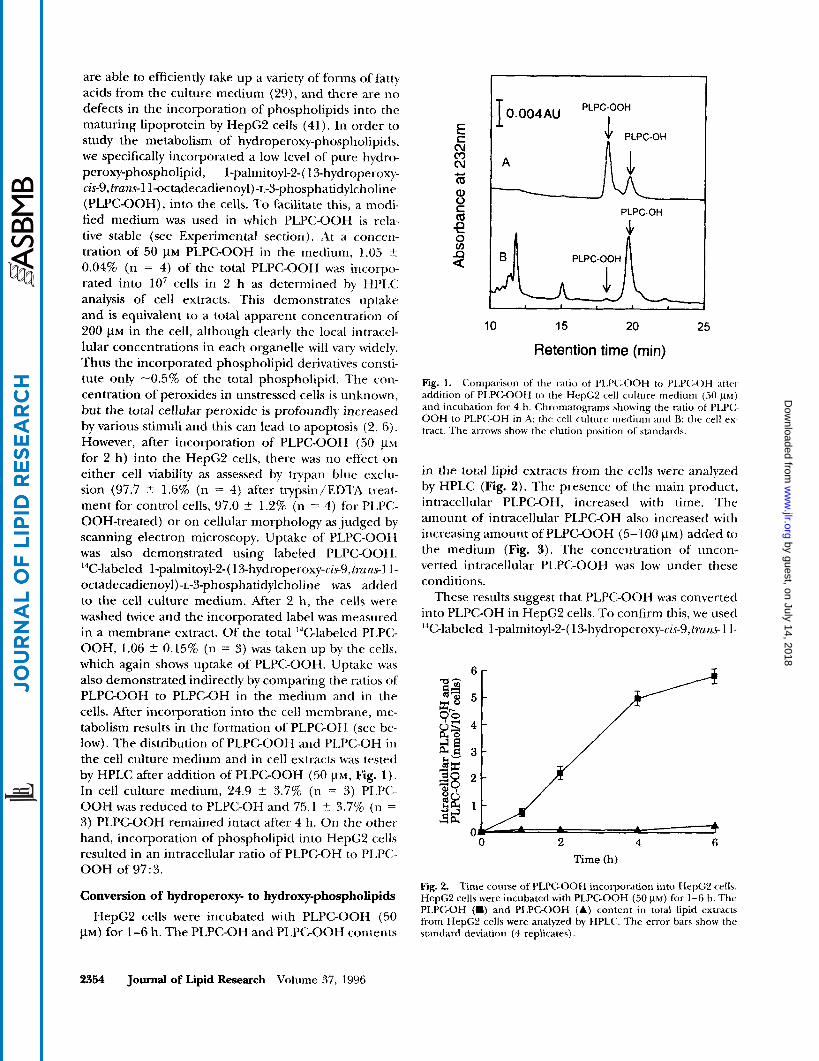
in the total lipid extracts from the cells were analyzed by HPLC (Fig. 2). The presence of the main product, intracellular PLPC-OH, increased with time. The amount of intracellular PLPC-OH also increased with increasing amount of PLPC-OOH (5-100 VM) added to the medium (Fig. 3). The concentration of' uncon- verted intracellular PLPC-OOH was low under these conditions.
These results suggest that PLPC-OOH was converted into PLPC-OH in HepG2 cells. To confirm this, we used I4C-labeled I-palmitoyl-2-( 13-hydroperoxy-cis-9,~r~~nc 1 1-
0 2 4 6 Time (h)
Fig. 2. Time course of PLPGOOH incorporation into HepGP cells. HepG2 cells were incubated with PLPCOOH (50 p ~ ) for 1-6 h. The PLPGOH (W) and PLPGOOH (A) content in total lipid extracts from HepGP cells were analyzed by HP1.C. The error bars show the standard deviation (4 replicates).
2354 Journal of Lipid Research Volume 37, 1996
by guest, on July 14, 2018w
ww
.jlr.orgD
ownloaded from

PLPC-OOH (pM)
Fig. 3. Treatment of HepG2 cells with PLPGOOH. PLPGOH (H) and PLPGOOH (A) were measured after treatment of cells with PLPC-OOH for 4 h .
octadecadienoyl)-~-3-phosphatidylcholine containing only one I4C label at C(1) of the srr2 hydroperoxy-fatty acid. After incorporation into the cell, if a hydroperoxy- or hydroxy-fatty acid is subsequently released by the action of phospholipase A2, then a radioactive peak would be detected at the retention time of the relevant fatty acid standards. In contrast, if phospholipase A2 is not involved, then a peak corresponding to l-pal- mitoyl-2-( 13-hydroxy-czs9, trans-1 l-octadecadienoyl)-~-3- phosphatidylcholine (PLPGOH) would be expected. Figure 4 shows that, in HepG2 cells, 81% of incorpo-
Peak1 T I
PLPC-OOH I
PLPC-OH I 1 'I
PLPC-OOH;,
PeaklI
5 10 15 20 25 30 Retention time (min)
Fig. 4. HPLCradiochemical detection of metabolites of incorpc- rated PLPGOOH in HepG2 cells. A Linoleic acid hydroperoxide hydrolyzed from [l4C]-PLPGO0H by the action of P U P (peak I ) . B Separation of the standards [14C]-PLPGOOH and -PLPGOH. C: HepG2 cells were incubated in 50 PM l4Clabeled PLPGOOH for 2 h before harvest, and total lipid was extracted using chloroform- methanol 2: 1 as described under Experimental Procedures.
rated intracellular PLPC-OOH was metabolized to PLPGOH, 5% of the total PLPGOOH remained un- changed, and 10% was converted to a peak that eluted at about 15 min. This latter peak has the same retention time as hemecatalyzed breakdown products of PLPC- OOH, but has no absorbance at 277 nm. This suggests that the product is a lower molecular weight and/or higher polarity derivative containing the conjugated diene moiety (absorption maximum at 232 nm) as de- scribed by Maiorino, Ursini, and Cadenas (42). There were no detectable hydroperoxy- or hydroxy-fatty acids.
A mathematical modelling study on the relative im- portance of PHGPx and PLA2/GPx in the reduction of hydroperoxy-phospholipids, based on published data using a kinetic model of mitochondrial lipid peroxida- tion in rat liver, showed the PHGPx was theoretically more important in the reduction of hydroperoxy-phos- pholipids. This study also reported that the PLA2 activity in HepG2 cells is several orders of magnitude lower than that of PHGPx (43). A pathway exists that enables phospholipids to be deacylated and reacylated with a different fatty acid (44). This pathway involves PLAZ, followed by reacylation by an acyltransferase and an acyl-CoA synthetase. However, PLAp is low in most un- stressed cells, including HepG2 cells, so the reacylation of fatty acids would be limited by the deacylation step. If this reaction was occurring to a significant extent in HepG2 cells, then the chance for reacylation of 14Gla- beled fatty acids into exactly the same lysophospholip ids is extremely low; reacylation of the I4Glabeled hy- droxy fatty acid to a different lysophospholipid (any species with no palmitic acid at the first position) would give a different retention time on HPLC. Taken together, this evidence and the results reported here show that the PLA2/GPx pathway is unlikely to play a significant role, and that the predominant metabolism of PLPGOOH re- duction is via PHGPx or a PHGPx-like pathway.
We also considered the rates of uptake of PLPGOOH and of PLPC-OH from the medium, and calculated whether very different rates of uptake for the two com- pounds could make it appear that there was intracellu- lar conversion of PLPC-OOH to PLPGOH. The reac- tions can be represented as follows:
Because of the dynamic nature of the system, it is not possible to measure directly the uptake of PLPGOOH. However, we have estimated some of the rates above in order to determine whether the rates of uptake of PLPC-OOH and of PLPC-OH are comparable. The
Bao and Williamson Metabolism of hydroperoxy-phospholipids 2355
by guest, on July 14, 2018w
ww
.jlr.orgD
ownloaded from
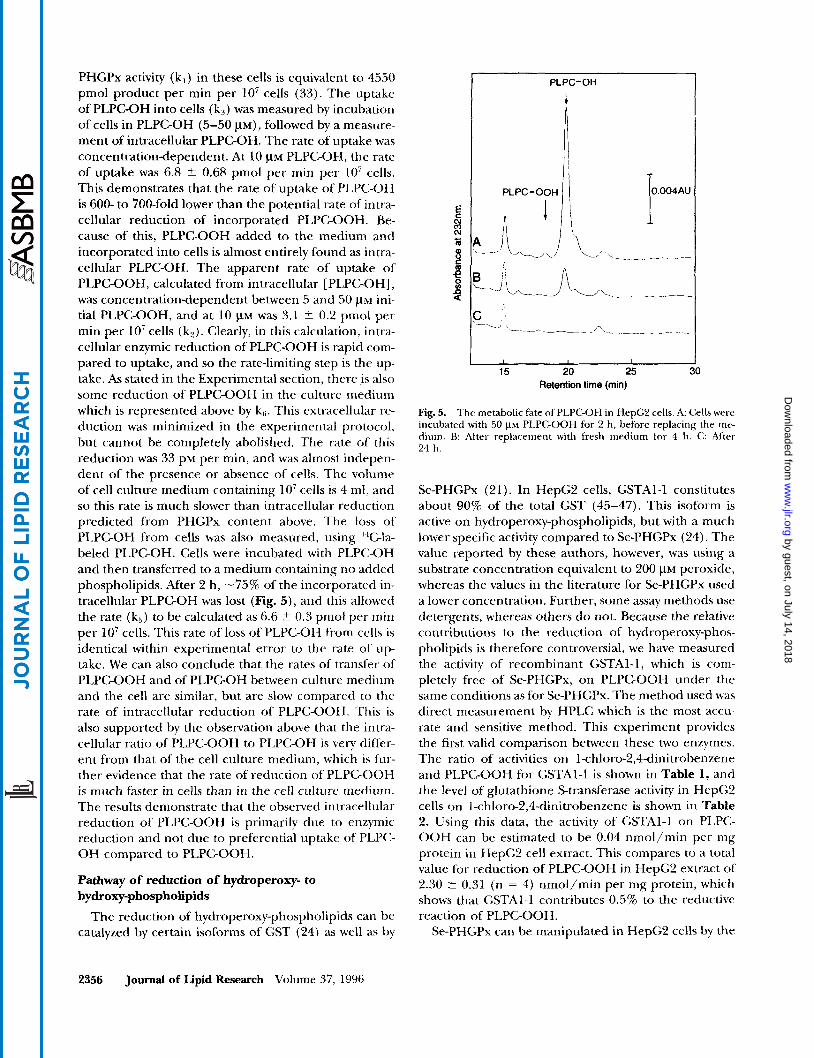
PHGPx activity (k,) in these cells is equivalent to 4550 pmol product per min per 10' cells ( 3 3 ) . The uptake of PLPC-OH into cells (k,) was measured by incubation of cells in PLPC-OH (5-50 PM) , followed by a measure- ment of intracellular PLPC-OH. The rate of uptake was concentrationdependent. At 10 VM PLPC-OH, the rate of uptake was 6.8 2 0.68 pmol per min per 10' cells. This demonstrates that the rate of uptake of PLPC-OH is 600- to 700-fold lower than the potential rate of intra- cellular reduction of incorporated PLPC-OOH. Be- cause of this, PLPC-OOH added to the medium and incorporated into cells is almost entirely found as intra- cellular PLPCOH. The apparent rate of uptake of PLPC-OOH, calculated from intracellular [PLPC-OH] , was concentration-dependent between 5 and 50 PM ini- tial PLPC-OOH, and at 10 PM was 3.1 ? 0.2 pmol per min per 10' cells (k2). Clearly, in this calculation, intra- cellular enzymic reduction of PLPC-OOH is rapid com- pared to uptake, and so the rate-limiting step is the up- take. As stated in the Experimental section, there ,is also some reduction of PLPC-OOH in the culture medium which is represented above by k6. This extracellular re- duction was minimized in the experimental protocol, but cannot be completely abolished. The rate of this reduction was 33 PM per min, and was almost indepen- dent of the presence or absence of cells. The volume of cell culture medium containing 10' cells is 4 ml, and so this rate is much slower than intracellular reduction predicted from PHGPx content above. The loss of PLPC-OH from cells was also measured, using "C-la- beled PLPC-OH. Cells were incubated with PLPC-OH and then transferred to a medium containing no added phospholipids. After 2 h, -75% of the incorporated in- tracellular PLPC-OH was lost (Fig. 5 ) , and this allowed the rate (k,) to be calculated as 6.6 ? 0.3 prnol per min per 10' cells. This rate of loss of PLPC-OH from cells is identical within experimental error to the rate of up- take. We can also conclude that the rates of transfer of PLPC-OOH and of PLPC-OH between culture medium and the cell are similar, but are slow compared to the rate of intracellular reduction of PLPC-OOH. This is also supported by the observation above that the intra- cellular ratio of PLPC-OOH to PLPC-OH is very differ- ent from that ofthe cell culture medium, which is fur- ther evidence that the rate of reduction of PLPC-OOH is much faster in cells than in the cell culture medium. The results demonstrate that the observed intracellular reduction of PLPC-OOH is primarily due to enzymic reduction and not due to preferential uptake of PLY<:- OH compared to PLPC-OOH.
Pathway of reduction of hydroperoxy- to hydr oxy-phospholipids
The reduction of hydroperoxy-phospholipids can be catalyzed by certain isoforms of GST (24) as well as by
PLPC-OH I
15 20 25 30 Retention time (min)
Fig. 5. The metabolic fate of PLPCOH in HepC'L cells. A: Cells were incubated with 50 ~ L M PLPGOOH for 2 h, before replacing the me- dium. B: After replacement with fresh medium for 4 h. C: Aftel 24 h.
Se-PHGPx (21). In HepC2 cells, GSTAI-1 constitutes about 90% of the total GST (45-47). This isoform is active on hydroperoxy-phospholipids, but with a much lower specific activity compared to Se-PHGPx (24). The value reported by these authors, however, was using a substrate concentration equivalent to 200 PM peroxide, whereas the values in the literature for Se-PHGPx used a lower concentration. Further, some assay methods use detergents, whereas others do not. Because the relative contributions to the reduction of hydroperoxy-phos- pholipids is therefore controversial, we have measured the activity of recombinant GSTAI-1, which is coni- pletely free of Se-PHGPx, on PLPC-OOH under the same conditions as for Se-PHGPx. The method used was direct measurement by HPLC which is the most accu- rate and sensitive method. This experiment provides the first valid comparison between these two enzymes. The ratio of activities on l-chloro-2,4dinitroben~ene and PLPC-OOH for GSTAI-1 is shown in Table 1, and the level of glutathione Stransferase activity in HepG2 cells on l-chloro-2,4-dinitrobenzene is shown in Table 2. Using this data, the activity of GSTA1-1 on PLPC- OOH can be estimated to be 0.04 nmol/min per mg protein in HepG2 cell extract. This compares to a total value for reduction of PLPC-OOH in HepG2 extract of 2.30 ? 0.31 (n = 4) nmol/min per mg protein, which shows that GSTAI-1 contributes 0.5% to the reductive reaction of PLPC-OOH.
Se-PHGPx can be manipulated in HepG'L cells by the
2356 Journal of Lipid Research Volume 37, 1996
by guest, on July 14, 2018w
ww
.jlr.orgD
ownloaded from

TABLE 1. Activities of purified human liver phospholipid hydroperoxide glutathione peroxidase and of glutathione Stransferase A1
Specific Activity
No Triton X-100 Triton X-100
CDNB PLPc-oon CDNB PLPc-oon
nmol/min/mg
GST 20,100 + 2600 8 + 1 20,700 5 2900 32 C 3 Se-PHGPx 0 336,000 ? 8000 0 40,000 2 6000
~~
Specific activities were calculated using substrate concentrations of 1 mM for CDNB and 25 FM for PLPC OOH. Triton X-100, were indicated, was 0.04% (v/v) for the CDNB assay and 0.1% (v/v) for the PLPCOOH reduction; CDNB, lchloro-2,4-dinitrobenzene.
level of selenium (30). Table 2 shows the levels of PHGPx in HepG2 cells in selenium-supplemented, “normal,” and seleniumdeficient cells. The morphol- ogy of the cells in selenium supplementation was un- changed, as was the cell viability. However, the viability of the seleniumdeficient cells was decreased (88.5 5 4.3%, n = 4), and scanning electron microscopy showed that the cells were more fragile. Selenium sup- plementation increased the level of intracellular Se- PHGPx and Se-GPx activity on hydrogen peroxide, but did not affect the level of GST (see Table 2). PLPG OOH was incorporated into the cells, and the levels of remaining PLPGOOH and product PLPC-OH was mea- sured (Fig. 6 ) . The selenium-deficient cell extract con- tained the highest amount of PLPGOOH (7-fold more than control cells) and the lowest amount of PLPC-OH. Selenium supplementation decreases the amount of re- sidual PLPGOOH (Fig. 6). If seleniumdeficient cells are re-supplemented with 100 nM selenium for 20 h, and the cells are then treated with PLPC-OOH, they exhibit less remaining PLPGOOH than selenium-defi- cient cells (706 ? 112 compared to 408 ? 56 pmol/ lo7 cells). This demonstrates that selenium-deficient cells can partially recover their ability to metabolize hy- droperoxy-phospholipids.
TABLE 2. Effects of selenium depletion and supplementation on enzyme activities in HepG2 cells
Enzyme Activities
Cell Type GPx PHGPx GST
nmol/min/mg protein
Se(+) 18.6 C 2.0 10.2 C 1.6 26.4 2 3.9 Normal 6.0 C 0.52 2.3 + 0.31 25.6 r+_ 2.7 Se(-) 1.2 C 0.25 0.65 2 0.2 24.3 -+ 4.5
HepG2 cells were grown in Eagle’s minimum essential medium containing 5% FCS for 3 days followed hy a reduction to 2% FCS for 4 days, with no added selenium (Se(-)). Cells were also grown in 10% FCS medium with added selenium (100 nM) for 24 h (Se(+)). Normal cells were grown in 10% FCS medium that contained endoge- nous selenium at 512.8 nM. Values represent the mean and standard deviation of 4 replicates.
PLPC-OH 4
PLPC-OOH I \
15 20 25 Retention time (min)
Fig. 6. Elution profiles of lipids extracted from HepG2 cells cultured with different levels of selenium. A PLPGOOH and PLPGOH were 52 ? 5.4 and 2143 2 176 pmol/107 cells (n = 4), respectively, in seleniumsupplemented medium (100 nM sodium selenite, 24 h). B: PLPGOOH and PLPCOH were 98 C 6.8 and 2102 2 103 pmol/lO’ cells (n = 4), respectively, in cells cultured in control medium (Se 5 12.8 nM). C: In seleniumdeficient cells, PLPGOOH and PLPCOH were 706 2 112 and 1453 C 91 pmol/lO’ cells (n = 4), respectively
DISCUSSION
There are few reports on the comparison of activities of GPx and PHGPx in tissues, and it is not easy to distin- guish the contributions from these two enzymes as both are increased on selenium supplementation. However, a human leukemia cell line, K562, expresses PHGPx but not GPx. This line exhibited a 5- to 10-fold lower PHGPx activity under Se deficiency relative to Se-suffi-
Bao and Williaritson Metabolism of hydroperoxy-phospholipids 2357
by guest, on July 14, 2018w
ww
.jlr.orgD
ownloaded from

cient conditions (48) and the Se-deficient cells were more susceptible to photoperoxidation and hydroper- oxides than the controls. The fact that PHGPx, and not GPx, can act directly on hydroperoxy phospholipids suggests the importance of PHGPx. The expression of PHGPx in cultured cells has also been used to examine the role of PHGPx (49). cDNA expressing PHGPx was transfected into guinea pig 104C1 cells. The cells were incubated with PC-OOH (300 PM) for 24 11, and cell viability (assessed by the release of LDH) was signifi- cantly higher in transfectants (104C1/04C;) containing the human PHGPx cDNA (49).
In this report, the role of PHGPx has been further probed. One of the central questions involves the nie- tabolism of hydroperoxy-lipids by selenoenzymes. Here we show that the cellular metabolism of hydroperoxy- phospholipids is by direct reduction to hydroxy-phos- pholipids by both Se-PHGPx and GSTAl. The fornier plays the more important role in HepG2 cells, as the reduction of hydroperoxy- to hydroxy-phospholipid can be enhanced by selenium supplementation, whereas under selenium deficiency, the reaction of hydropet-- oxy- to hydroxy-phospholipid is decreased. There are no detectable hydroperoxy- or hydroxy-fatty acid prod- ucts, and no products of a possible reacylation reaction, which shows that the action of phospholipase A,/ GPx on hydroperoxy-phospholipids is not significant. Even under conditions where the intracellular hydroperoxy- phospholipid concentration may be as high as 200 ~ L M , which may activate phospholipase A?, there are no de- tectable fatty acid products (17). In in vitro assays, phos- pholipase A'? activity can be increased by 1-3 mM Ca" , and although the concentration of (:a2 + in human HepC2 cells is unknown, the free (;a" in hepatocytes is about one magnitude lower than this (50).
The activity of GST in human liver is subject to large inter-individual variations. GST p (Ml) exhibits a null allele in about 50% of the population (5 1 ) , but this iso- form has almost no peroxidase activity (IS). GST n (Pl) is present at low levels in human liver (52), and also has almost no peroxidase activity (15). GST cx (GSTA1 and A2) is the predominant isoform in human liver but is subject to considerable variation. The total hepatic GST activity (on l-chloro-2,4-dinitrobenzene) varies from 0.39 to 2.17 pmol/min per mg protein (53). These vari- ations are reflected in the level of GSTAl (7.0 to 47.0 pg A1 protein/mg cytosolic protein) and of GSTA2 (4.4 to 40.5 pg A2 protein/ mg cytosolic protein). The range of inter-individual variation of Se-PHGPx in humans is not known, but the one estimate available shows that the total activity for reduction of hydroperoxy-phospho- lipids is 3 ninol/min per mg protein (54). On the basis of these data, it is clearly not yet possible to calculate the precise contribution of GST a and Se-PHGPx to re- duction of cellular hydroperoxy-phospholipids in hu-
man individuals. However, for the ranges of GS'I' activit!' on l-chloro-2,4-dinitrobenzene shown above, arid using the values in Table 1, the activity contributed by ( on hydroperoxy-phospholipids is between 0.1 5 and 0.86 nmol/min per mg protein; this compares to the total value for this activity, albeit measured in only o w h t i -
man liver sample, of ?I nmol/rnin per mg protein. Al- though accurate figures cannot yet be calculated, i t is clear that reduction of hydroperoxy-phospholipids de- pends on both GST a levels (which vary betwren indi- viduals) and on Se-PHGPx levels (which are affected hy dietary selenium (30, 55)). Whether Se-PHGPx in hu- mans shows inter-individual variation requires further investigation. Up to 13 selenium-containing proteins or protein subunits have been identified by in vivo labeling with ["Se]selenate in rat tissues (56), but apart from glutathione peroxidases, the functions of most of these selenoproteins are not well characterized. The metabo- lism of hydroperoxy-phospholipids by Se-PHGPx dem- onstrates the role of the essential trace element sek- nium.W
We wish to thank the SineBritish Friendship Scholarship Scheme (SBFSS) and the Biotechnology and Biological Sci- ences Research Council for financial support. We also thank Dr. H. Crews for the selenium measurements, Dr. P. Board for the ptacGST'2 plasmid, and Dr. Mary Parker for the scanning electron microscopy. Mariusrript rrrriued h Ilrrrmbrr 1995, in rroirrd form 2 Jul,. 1996, m i l in rr-rmi.spd fnm 8 A ups t 1996.
REFERENCES
1.
2.
3.
4.
5.
6.
7.
Maiorino, M., and F. Ursini. 199'2. Synergistic effect of lipid hydroperoxyl radical scavenging and lipid hydroper- oxide reduction in the inhibition of lipid peroxidation in biomembranes. In Lipid-Soluble Antioxidants: Biochem- istry and Clinical Applications. A. S. H. Ong and L. Packer, editors. Birkhauser Verlag, Basel/Switzerland. 47-51. Pynzar, E. I . , N. G. Bogdanova, and N. P. Palmina. 1995. The effect of phorbol esters on the lipid peroxidation i n the membranes of endoplasmic reticulum isolated from mouse liver. Bid. Membr. 12: 279-287. Hegstad, A. C., H. Strand, and K. Ytrehus. 1994. Phospho- lipid peroxidation after 60 min of global ischaemia and 10 niin of reperfusion. A study in the isolated rat heart.
Shen, H. M., C. Y. Shi, H. P. Lee, and C . N. Ong. 1994. Aflatoxin B,-induced lipid peroxidation in rat. 'lhxirnl.
Ursini, F., and A. Bindoli. 1987. The role ofselenium per- oxidases in the protection against oxidative damage of membranes. Chem. f'hys. Lipids. 44: 255-276. Clemens, M. J . 1991. Cytokines. BIOS Scientific Publish- ers Ltd, Oxford, UK. 33-55. Akasaka, K., A. Ohata, H. Ohrui, and H. Meguro. 1995. Automatic determination of hydroperoxides of phospha- tidylcholine and phosphatidylethanolamine in hunian plasma. ,J Cliromatogr. RRio. Med. Appl. 665: 37-43.
1. Mol. Cell C d i d 26: 569-578.
AppL. I ' h a ~ ~ d . 127: 145-150.
2358 Journal of Lipid Research Volume 37, 1996
by guest, on July 14, 2018w
ww
.jlr.orgD
ownloaded from
8. Takayama, F., T. Egashira, Y. Kudo, and Y. Yamanaka. 1993. Effects of anti-free radical interventions on phos- phatidylcholine hydroperoxide in plasma after ischae- mia-reperfusion in the liver of rats. B i o c h . Phannacol.
9. Lands, W. E. M., R. J. Kulmacz, and P. J. Marshall. 1984. Lipid peroxide actions in the regulation of prostaglandin biosynthesis. Zn Free Radicals in Biology. W. A. Pryor, edi- tor, Academic Press, New York/London. Vol. VI, 39-61.
10. Esterbauer, H., and K. H. Cheeseman. 1990. Determina- tion of aldehydic lipid peroxidation products: malonalde- hyde and 4hydroxynonenal. Methods Enzymol. 186: 407- 421.
1 1 . LoidlStahlhofen, A., and G. Spiteller. 1994. a-Hydroxyal- dehydes, products of lipid peroxidation. Biochim. Biophys.
12. Ladenstein, R. 1984. Molecular enzymology of seleno-glu- tathione peroxidase. Prot. Pep. Rev. 4 173-214.
13. Mannenik, B., and U. H. Danielson. 1988. Glutathione transferase-structure and catalytic activity. CRC Cn't. Rev. Biorhm. 23: 283-337.
14. Shibata,Y., K. Matsui, T. Kajiwara, and A. Hatanaka. 1995. Fatty acid hydroperoxide lyase is a heme protein. Biochem. Biqbhys. Res. Commun. 207: 438-443.
15. Van Kuijk, F. J. G. M., A. Sevanian, G. J. Handelman, and E. A. Dratz. 1987. A new role for phospholipase AB: pro- tection from membrane from lipid peroxidation damage. Trends Biochem. Sci. 1 2 31-34.
16. Van Kuijk, F. J. G. M., G. J. Handelman, and E. A. Dratz. 1985. Consecutive action of phospholipase A2 and gluta- thione peroxidase is required for reduction of phospho- lipid hydroperoxides and provides a convenient method to determine peroxide values in membranes. Free Radical Biol. Med. 1: 421-427.
17. Van den Berg, J. J. M., J. A. F. Op den Kamp, B. H. Lubin, and F. A. Kuypers. 1993. Conformational changes in oxi- dized phospholipid and their preferential hydrolysis by phospholipase A,: a monolayer study. Biochemistly. 32:
18. Heller, R. A., and M. Kronke. 1994. Tumor necrosis fac- tor receptor-mediated signalling pathways. J. Cell Biol. 126: 5-9.
19. Kuo, GF., S. Cheng, and J. R. Burgess. 1995. Deficiency of vitamin E and selenium enhances calcium-independent phospholipase A2 activity in rat lung and 1iver.J. Nutr. 125:
20. Stoll, K. E., and J. R. Duncan. 1995. Phospholipase A2 ac- tivity in vitro cultured cells-influence of ascorbate sup- plementation. J. Lipid Mediat. Cell Signal. 11: 261-266.
21. Ursini, F., M. Maiorino, and A. Sevanian. 1991. Mem- brane hydroperoxides. In Oxidative Stress: Oxidant and Antioxidants. H. Sies, editor. Academic Press, London.
22. Chu, F-F. 1994. The human glutathione peroxidase genes GPXZ, GPX3, and GPX4 map to chromosomes 14,5, and 19, respectively. Cytogenet. Cell &et. 66: 96-98.
23. Brigelius-Flohe, R., K. D. Aumann, H. Blocker, G. Gross, M. Kiess, K. D. Kloppel, M. Maiorino, A. Roveri, R. Schuckelt, F. Ursini, E. Wingender, and L. Flohe. 1994. Phospholipid hydroperoxide glutathione peroxidase: ge- nomic DNA, cDNA, and deduced amino acid sequence. _I. Biol. Chem. 269: 7342-7348.
24. Awasthi, Y. C., P. Zimniak, S. S. Singhal, and S. Awasthi. 1995. Physiological role of glutathione Stransferases in protection mechanisms against lipid peroxidation: a com- mentary. Biochem. Arch. 11: 47-54.
46: 1749-1 757.
Acta. 1211: 156-160.
4962-4967.
1419-1429.
3 19-336.
25. Knowles, B. B., C. C. Howe, and D. P. Aden. 1980. Human hepatocellular carcinoma cell lines secrete the major plasma proteins and hepatitis B surface antigen. Science. 209 497-499.
26. Doostdar, H., S. J. Duthie, M. D. Burk, W. T. Melvin, and M. H. Grant. 1988. The influence of culture medium com- position on drug metabolising enzyme of human liver de- rived HepG2 cell line. E B S Lett. 241: 15-18.
27. Bouma, M. E., E. Gogier, N. Verthier, C. Labarre, and G. Feldmann. 1989. Further cellular investigation of the hu- man hepatoblastoma-derived cell line HepG2: morphol- ogy and immunocytochemical studies of hepatic-secreted proteins. Zn Vitro Cell. Dev. Biol. 25: 267-275.
28. Koumanov, K. S., A. B. Momchilova-Pankova, S. Wang, and R. Infante. 1990. Membrane phospholipid composi- tion, fluidity and phospholipase A2 activity of human h e p atoma cell line HepG2. Znt. J. Biochem. 2 2 1453-1455.
29. Angeletti, C., and M. J. T. de Alaniz. 1995. Fatty acid u p take and metabolism in HepG2 cells. Mol. Cell Biocha.
30. Maiorino, M., F. F. Chu, F. Ursini, K. J. A. Davies, J. H. Doroshow, and R. S. Esworthy. 1991. Phospholipid hydro- peroxide glutathione peroxidase is the 18-kDa seleno- protein expressed in human tumor cell 1ines.J. Bid. Chem.
31. Maiorino, M., C. Gregolin, and F. Ursini. 1990. Phospho- lipid hydroperoxide glutathione peroxidase. Methods En- qmol. 186 448-457.
32. Sevanian, A., and E. Kim. 1985. Phospholipase AI depen- dent release of fatty acids from peroxidized membranes. Free Radical Biol. Med. 1: 263-271.
33. Bao,Y. P., S. J. Chambers, and G. Williamson. 1995. Direct separation of hydroperoxy- and hydroxy-phosphotidyl- choline derivatives: application to the assay of phospho- lipid hydroperoxide glutathione peroxidase. Anal. Biu chem. 224 395-399.
34. Kaneko, T., N. Baba, and M. Matsuo. 1994. Phospholipid hydroperoxides are significantly less toxic to cultured en- dothelial cells than fatty acid hydroperoxides. Life Sci. 55:
35. Board, P. G., and K. Pierce. 1987. Expression of human glutathione Stransferase 2 in Escha'chza coli: immunologi- cal comparison with the basic glutathione Stransferase from human liver. Biochem. J. 248: 937-941.
36. Williamson, G. 1989. Multiple forms of glutathione S transferase from pig liver-reaction with methyl linoleate hydroperoxides. Znt. J. Biochem. 21: 23-30.
37. Bradford, M. M. 1976. A rapid and sensitive method for the quantitation of microgram quantities of protein, uti- lizing the principle of protein, utilizing the principle of protein-dye binding. Anal. Biochem. 7 2 248-254.
38. Wendel, A. 1981. Glutathione peroxidase. Methods Enzy- mol. 77: 325-333.
39. Habig, W. H., and W. B. Jakoby. 1981. Assays for differen- tiation of glutathione Stransferases. Methods Enzymol. 77:
40. Gunstone, F. D., J. L. Harwood, and F. P. Padley. 1994. The Lipid Handbook. 2nd edition. Chapman and Hall, London. 198.
41. Gibbons, G. F., R. Khurana, A. Odwell, and M. C. L. See- laender. 1994. Lipid balance in HepG2 cells: active syn- thesis and impaired mobilization. J. Lipid Res. 35: 1801- 1808.
42. Maiorino, M., F. Ursini, and E. Cadenas. 1994. Reactivity of metmyoglobin towards phospholipid hydroperoxides. Free Radical Biol. Med. 16: 661-667.
143: 99-105.
266: 7728-7732.
1443-1449.
398-405.
Bao and Williamson Metabolism of hydroperoxy-phospholipids 2359
by guest, on July 14, 2018w
ww
.jlr.orgD
ownloaded from

43. Autunes, F., A. Salvador, and R. E. Pinto. 1995. PHGPx and phospholipase A2/ GPx: comparative importance on the reduction of hydroperoxides in the rat liver mito- chondria. Free Radical Biol. Med. 1 9 669-677.
44. Ansell, G. B., and S. Spanner. 1982. Phosphatidylserine, phosphatidylethanolamine and phosphatidylcholine. In Phospholipids. J. N. Hawthorne and G. B. Ansell, editors. Elsevier Biomedical Press, Oxford. 1-49.
45. Eickelmann, P., T. Ebert, U. Warskulat, W. A. Schulz, and H. Sies. 1994. Expression of NAD(P)H: quinone oxidore- ductase and glutathione Stransferase a and n in human renal cell carcinoma and in kidney cancer-derived cell lines. Carcinogenesis. 15: 219-2'25.
46. Castro, V. M., M. Soderstrom, I. Carlberg, M. Widersten, A. Platz, and B. Mannervik. 1990. Differences among hu- man tumor cell lines in the expression of glutathione transferases and other glutathione-linked enzymes. Carci- nogenesis. 11: 1569-1576.
47. Lewis, A. D., L. M. Forrester, J. D. Hayes, C . J. Wareing, J. Carmichael, A. L. Harris, M. Mooghen, and C. R. Wolf. 1989. Glutathione Stransferases isoenzymes in human tu- mours and tumourderived cell line. Br.J. Cancer. 60: 327- 331.
48. Lin, F., P. G. Geiger, and A. W. Girotti. 1992. Selenoper- oxidase-mediated cytoprotection against merocyanine 540-sensitized photoperoxidation and photokilling ofleu- kemia cells. Cancer Res. 52: 5282-5290.
49. Yagi, K., S. Komura, H. Kojima, Q. Sun, N. Nagata, N. Ohishi, and M. Nishikimi. 1996. Expression of human phospholipid hydroperoxide glutathione peroxidase gene for protection of host cells from lipid hydroperox-
ide-mediated injury. Biochem. Hiophys. 1G.s. ( h m r t ~ n . 219:
50. Woods, N. M., K. S . Roy Cuthbertson, and P. H. Cobbold. 1986. Repetitive transient rises in cytoplasmic frce c a - cium in hormone-stimulated hepatocytes. A'alurt. 319:
51. Chenevix-Trench, G.,J. Young, M. Coggan, and P. Board. 1995. Glutathione S-transferase M1 and T1 polymol- phisms: susceptibility to colon cancer and age of onset. Carcinogenesis. 16: 1655-1657.
52. Vos, R. M. E., and P. J. van Bladeren. 1990. Glutathionr~ S-transferases in relation to their role in the biotrans- formation of xenobiotics. Chm-Hiol. InkracL 75: 24 1 - 26.5.
53. Van Ommen, B., J. J. P. Bogaards, W. H. M. Peters, U . Blaauboer, and P. J. van Bladeren. 1990. Quantification 01 human hepatic glutathione S-transferase. Riochem. ,I. 269:
54. Chambers, S . J., N. Lambert, and G. Williamson. 1994. Purification of a cytosolic enzyme from human liver with phospholipid hydroperoxide glutathione peroxidase ac- tivity. hnt. ,/. Biochem. 26: 1279- 1286.
55. I e i , X. G., J . K. Evenson, K. M. Thompson, and K. A. Sunde. 1995. Glutathione peroxidase and phospholipid hydroperoxide glutathione peroxidase are differentially regulated in rats by dietary selenium. ,/. N u k 125: 1438- 1446.
56. Behne, D., H. Hilmert, S . Scheid, H. Gessner, and U'. Elger. 1988. Evidence for specific selenium target tissues and new biologically important selenoproteins. Bzochim. 13iqViy.s. Acta. 966: 12-21.
486-491.
600-602.
609-613.
2360 Journal of Lipid Research Volume 37, 1996
by guest, on July 14, 2018w
ww
.jlr.orgD
ownloaded from