Met Standard - La Joya Independent School District · TEXAS EDUCATION AGENCY 2015 Accountability...
23
TEXAS EDUCATION AGENCY 2015 Accountability Summary EMILIANO ZAPATA EL (108912118) - LA JOYA ISD Accountability Rating Met Standard Met Standards on Did Not Meet Standards on - Student Progress - Student Achievement - Closing Performance Gaps - Postsecondary Readiness In 2015, to receive a Met Standard or Met Alternative Standard rating, districts and campuses must meet targets on three indexes: Index 1 or Index 2 and Index 3 and Index 4. Performance Index Report 0 25 50 75 100 Index 1 Student Achievement (Target Score=60) Index 2 Student Progress (Target Score=30) Index 3 Closing Performance Gaps (Target Score=28) Index 4 Postsecondary Readiness (Target Score=12) 57 30 30 16 Performance Index Summary Index Points Earned Maximum Points Index Score 1 - Student Achievement 268 469 57 2 - Student Progress 178 600 30 3 - Closing Performance Gaps 181 600 30 4 - Postsecondary Readiness STAAR Score 16.0 Graduation Rate Score N/A Graduation Plan Score N/A Postsecondary Component Score N/A 16 Distinction Designation Academic Achievement in Reading/ELA NO DISTINCTION EARNED Academic Achievement in Mathematics NOT ELIGIBLE Academic Achievement in Science NO DISTINCTION EARNED Academic Achievement in Social Studies NOT ELIGIBLE Top 25 Percent Student Progress NO DISTINCTION EARNED Top 25 Percent Closing Performance Gaps NO DISTINCTION EARNED Postsecondary Readiness NO DISTINCTION EARNED Campus Demographics Campus Type Elementary Campus Size 735 Students Grade Span PK - 05 Percent Economically Disadvantaged 95.9 Percent English Language Learners 83.7 Mobility Rate 18.6 State System Safeguards Number and Percent of Indicators Met Performance Rates 2 out of 12 = 17% Participation Rates 4 out of 4 = 100% Graduation Rates N/A Total 6 out of 16 = 38% For further information about this report, please see the Performance Reporting Division website at http://ritter.tea.state.tx.us/perfreport/account/2015/index.html TEA Division of Performance Reporting Page 1 August 7, 2015
Transcript of Met Standard - La Joya Independent School District · TEXAS EDUCATION AGENCY 2015 Accountability...

TEXAS EDUCATION AGENCY2015 Accountability Summary
EMILIANO ZAPATA EL (108912118) - LA JOYA ISD
Accountability Rating
Met Standard
Met Standards on Did Not Meet Standards on
- Student Progress - Student Achievement
- Closing Performance Gaps
- Postsecondary Readiness
In 2015, to receive a Met Standard or Met Alternative Standard rating, districts and campusesmust meet targets on three indexes: Index 1 or Index 2 and Index 3 and Index 4.
Performance Index Report
0
25
50
75
100
Index 1
StudentAchievement
(Target Score=60)
Index 2
StudentProgress
(Target Score=30)
Index 3
ClosingPerformance Gaps(Target Score=28)
Index 4
PostsecondaryReadiness
(Target Score=12)
57 30 30 16
Performance Index Summary
IndexPoints
EarnedMaximum
PointsIndexScore
1 - Student Achievement 268 469 572 - Student Progress 178 600 303 - Closing Performance Gaps 181 600 304 - Postsecondary Readiness
STAAR Score 16.0
Graduation Rate Score N/A
Graduation Plan Score N/A
Postsecondary Component Score N/A 16
Distinction Designation
Academic Achievement in Reading/ELA
NO DISTINCTION EARNED
Academic Achievement in Mathematics
NOT ELIGIBLE
Academic Achievement in Science
NO DISTINCTION EARNED
Academic Achievement in Social Studies
NOT ELIGIBLE
Top 25 Percent Student Progress
NO DISTINCTION EARNED
Top 25 Percent Closing Performance Gaps
NO DISTINCTION EARNED
Postsecondary Readiness
NO DISTINCTION EARNED
Campus Demographics
Campus Type Elementary
Campus Size 735 Students
Grade Span PK - 05
Percent EconomicallyDisadvantaged 95.9
Percent English LanguageLearners 83.7
Mobility Rate 18.6
State System Safeguards
Number and Percent of Indicators Met
Performance Rates 2 out of 12 = 17%
Participation Rates 4 out of 4 = 100%
Graduation Rates N/A
Total 6 out of 16 = 38%
For further information about this report, please see the Performance Reporting Division website at http://ritter.tea.state.tx.us/perfreport/account/2015/index.html
TEA Division of Performance Reporting Page 1 August 7, 2015

TEA Division of Performance Reporting Page 1 of 11 August 7, 2015** When only one racial/ethnic group is masked, then the second smallest racial/ethnic group is masked (regardless of size).
* Indicates results are masked due to small numbers to protect student confidentiality.
TEXAS EDUCATION AGENCY2015 Index 1: Student Achievement Calculation Report
EMILIANO ZAPATA EL (108912118) - LA JOYA ISD
Reading Mathematics Writing ScienceSocial
Studies Total
% Phase-inSatisfactory
StandardIndexPoints
# at Phase-in Satisfactory Standard ‡ 168 0 48 52 0 268
Total Tests 282 0 88 99 0 469 57 57
Index 1 Score (Target = 60) 57
‡ Results for grades 3-8 mathematics, STAAR A, and STAAR Alternate 2 are not included in 2015 accountability results.

TEA Division of Performance Reporting Page 2 of 11 August 7, 2015
‡ Results for grades 3-8 mathematics, STAAR A, and STAAR Alternate 2 are not included in 2015 accountability results.
- Indicates there are no students in the group.
** When only one racial/ethnic group is masked, then the second smallest racial/ethnic group is masked (regardless of size).
* Indicates results are masked due to small numbers to protect student confidentiality.
TEXAS EDUCATION AGENCY2015 Index 1: Student Achievement Data Table
EMILIANO ZAPATA EL (108912118) - LA JOYA ISD
AllStudents
AfricanAmerican Hispanic White
AmericanIndian Asian
PacificIslander
Two orMoreRaces
SpecialEd
EconDisadv ELL
2015 STAAR Performance ‡
All SubjectsPercent of Tests% at Phase-in Satisfactory Standard 57% - 57% - - - - - * 57% 54%
Number of Tests# at Phase-in Satisfactory Standard 268 - 268 - - - - - * 250 218Total Tests 469 - 469 - - - - - * 442 402
ReadingPercent of Tests% at Phase-in Satisfactory Standard 60% - 60% - - - - - * 59% 57%
Number of Tests# at Phase-in Satisfactory Standard 168 - 168 - - - - - * 158 139Total Tests 282 - 282 - - - - - * 268 242
MathematicsPercent of Tests% at Phase-in Satisfactory Standard - - - - - - - - - - -
Number of Tests# at Phase-in Satisfactory Standard - - - - - - - - - - -Total Tests - - - - - - - - - - -
WritingPercent of Tests% at Phase-in Satisfactory Standard 55% - 55% - - - - - * 52% 50%
Number of Tests# at Phase-in Satisfactory Standard 48 - 48 - - - - - * 43 36Total Tests 88 - 88 - - - - - * 82 72
SciencePercent of Tests% at Phase-in Satisfactory Standard 53% - 53% - - - - - * 53% 49%
Number of Tests# at Phase-in Satisfactory Standard 52 - 52 - - - - - * 49 43Total Tests 99 - 99 - - - - - * 92 88
Social StudiesPercent of Tests% at Phase-in Satisfactory Standard - - - - - - - - - - -
Number of Tests# at Phase-in Satisfactory Standard - - - - - - - - - - -Total Tests - - - - - - - - - - -

TEA Division of Performance Reporting Page 3 of 11 August 7, 2015
TEXAS EDUCATION AGENCY2015 Index 2: Student Progress Calculation Report
EMILIANO ZAPATA EL (108912118) - LA JOYA ISD
Overall Progress (All Subjects) ‡
STAAR Weighted Progress RateAll
StudentsAfrican
American Hispanic WhiteAmerican
Indian AsianPacific
Islander
Two orMoreRaces
SpecialEd
ELL(Current &Monitored)
TotalPoints
MaximumPoints
Number of Tests 183 183 158
# Met or Exceeded Progress 93 93 75
# Exceeded Progress 19 19 15
% Met or Exceeded Progress 51 51 47
% Exceeded Progress 10 10 9
Total 61 61 56 178 600
Index 2 Score (Target = 30) 30
Blank cells above represent student group indicators that do not meet the minimum size criteria.
‡ Results for grades 3-8 mathematics, STAAR A, and STAAR Alternate 2 are not included in 2015 accountability results.

TEA Division of Performance Reporting Page 4 of 11 August 7, 2015
‡ Results for grades 3-8 mathematics, STAAR A, and STAAR Alternate 2 are not included in 2015 accountability results.
- Indicates there are no students in the group.
** When only one racial/ethnic group is masked, then the second smallest racial/ethnic group is masked (regardless of size).
* Indicates results are masked due to small numbers to protect student confidentiality.
TEXAS EDUCATION AGENCY2015 Index 2: Student Progress Data TableEMILIANO ZAPATA EL (108912118) - LA JOYA ISD
AllStudents
AfricanAmerican Hispanic White
AmericanIndian Asian
PacificIslander
Two orMore Races
SpecialEd
ELL(Current &Monitored)
ELL(Current)
2015 STAAR Performance ‡All SubjectsNumber of Tests 183 - 183 - - - - - * 158 158# Met or Exceeded Progress 93 - 93 - - - - - * 75 n/a# Exceeded Progress 19 - 19 - - - - - * 15 n/a% Met or Exceeded Progress 51% - 51% - - - - - * 47% n/a% Exceeded Progress 10% - 10% - - - - - * 9% n/a
ReadingNumber of Tests 183 - 183 - - - - - * 158 158# Met or Exceeded Progress 93 - 93 - - - - - * 75 n/a# Exceeded Progress 19 - 19 - - - - - * 15 n/a% Met or Exceeded Progress 51% - 51% - - - - - * 47% n/a% Exceeded Progress 10% - 10% - - - - - * 9% n/a
MathematicsNumber of Tests - - - - - - - - - - -# Met or Exceeded Progress - - - - - - - - - - n/a# Exceeded Progress - - - - - - - - - - n/a% Met or Exceeded Progress - - - - - - - - - - n/a% Exceeded Progress - - - - - - - - - - n/a
WritingNumber of Tests - - - - - - - - - - -# Met or Exceeded Progress - - - - - - - - - - n/a# Exceeded Progress - - - - - - - - - - n/a% Met or Exceeded Progress - - - - - - - - - - n/a% Exceeded Progress - - - - - - - - - - n/a

TEA Division of Performance Reporting Page 5 of 11 August 7, 2015
TEXAS EDUCATION AGENCY2015 Index 3: Closing Performance Gaps Calculation Report
EMILIANO ZAPATA EL (108912118) - LA JOYA ISD
Overall Performance ‡
STAAR Weighted Performance RateEcon
DisadvTotal
PointsMaximum
Points
Reading 69 69 200
Mathematics 0 0 0
Writing 58 58 200
Science 54 54 200
Social Studies 0 0 0
Total 181 600
Index 3 Score (Target = 28) 30
‡ Results for grades 3-8 mathematics, STAAR A, and STAAR Alternate 2 are not included in 2015 accountabilityresults.

TEA Division of Performance Reporting Page 6 of 11 August 7, 2015
TEXAS EDUCATION AGENCY2015 Index 3: Closing Performance Gaps Calculation Report
EMILIANO ZAPATA EL (108912118) - LA JOYA ISD
Reading Performance
STAAR Weighted Performance Rate ‡Econ
DisadvTotal
PointsMaximum
Points
Number of Tests 268
# Phase-in Satisfactory Standard 158
# Advanced Standard 27
% Phase-in Satisfactory Standard 59
% Advanced Standard 10
Reading Weighted Performance Rate 69 69 200
Mathematics Performance
STAAR Weighted Performance Rate ‡Econ
DisadvTotal
PointsMaximum
Points
Number of Tests
# Phase-in Satisfactory Standard
# Advanced Standard
% Phase-in Satisfactory Standard
% Advanced Standard
Mathematics Weighted Performance Rate 0 0 0
Writing Performance
STAAR Weighted Performance Rate ‡Econ
DisadvTotal
PointsMaximum
Points
Number of Tests 82
# Phase-in Satisfactory Standard 43
# Advanced Standard 5
% Phase-in Satisfactory Standard 52
% Advanced Standard 6
Writing Weighted Performance Rate 58 58 200
Blank cells above represent student group indicators that do not meet the minimum size criteria.‡ Results for grades 3-8 mathematics, STAAR A, and STAAR Alternate 2 are not included in 2015 accountabilityresults.
TEA Division of Performance Reporting Page 7 of 11 August 7, 2015
TEXAS EDUCATION AGENCY2015 Index 3: Closing Performance Gaps Calculation Report
EMILIANO ZAPATA EL (108912118) - LA JOYA ISD
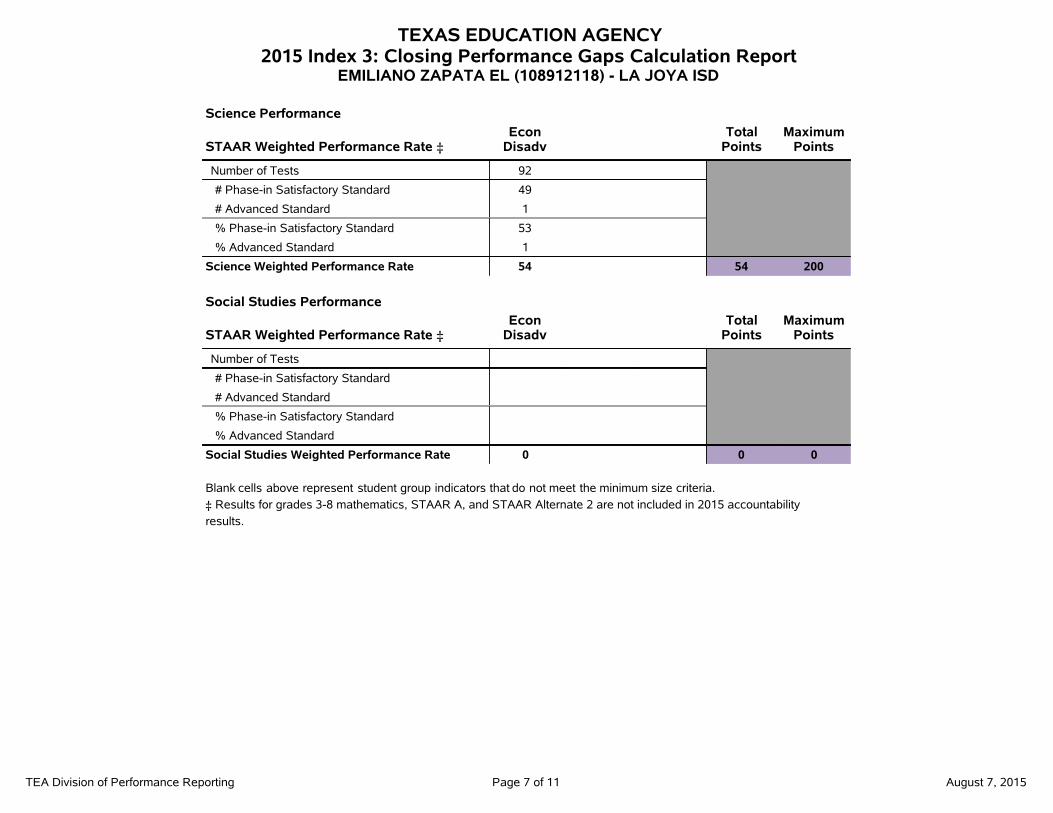
Science Performance
STAAR Weighted Performance Rate ‡Econ
DisadvTotal
PointsMaximum
Points
Number of Tests 92
# Phase-in Satisfactory Standard 49
# Advanced Standard 1
% Phase-in Satisfactory Standard 53
% Advanced Standard 1
Science Weighted Performance Rate 54 54 200
Social Studies Performance
STAAR Weighted Performance Rate ‡Econ
DisadvTotal
PointsMaximum
Points
Number of Tests
# Phase-in Satisfactory Standard
# Advanced Standard
% Phase-in Satisfactory Standard
% Advanced Standard
Social Studies Weighted Performance Rate 0 0 0
Blank cells above represent student group indicators that do not meet the minimum size criteria.‡ Results for grades 3-8 mathematics, STAAR A, and STAAR Alternate 2 are not included in 2015 accountabilityresults.

TEA Division of Performance Reporting Page 8 of 11 August 7, 2015
‡ Results for grades 3-8 mathematics, STAAR A, and STAAR Alternate 2 are not included in 2015 accountability results.
- Indicates there are no students in the group.
** When only one racial/ethnic group is masked, then the second smallest racial/ethnic group is masked (regardless of size).
* Indicates results are masked due to small numbers to protect student confidentiality.
TEXAS EDUCATION AGENCY2015 Index 3: Closing Performance Gaps Data Table
EMILIANO ZAPATA EL (108912118) - LA JOYA ISD
AfricanAmerican Hispanic White
AmericanIndian Asian
PacificIslander
Two orMoreRaces
2014 STAAR Performance - Used for Determining Lowest Performing Racial/Ethnic Group(s)
All SubjectsPercent of Tests% Phase-in Satisfactory Standard - 63% - - - - -
Number of TestsTotal Tests - 813 - - - - -
ReadingNumber of TestsTotal Tests - 302 - - - - -
MathematicsNumber of TestsTotal Tests - 299 - - - - -
AfricanAmerican Hispanic White
AmericanIndian Asian
PacificIslander
Two orMoreRaces
EconDisadv
2015 STAAR Performance ‡
ReadingPercent of Tests% Phase-in Satisfactory Standard - 60% - - - - - 59%% Advanced Standard - 11% - - - - - 10%
Number of Tests# Phase-in Satisfactory Standard - 168 - - - - - 158# Advanced Standard - 32 - - - - - 27Total Tests - 282 - - - - - 268
MathematicsPercent of Tests% Phase-in Satisfactory Standard - - - - - - - -% Advanced Standard - - - - - - - -
Number of Tests# Phase-in Satisfactory Standard - - - - - - - -# Advanced Standard - - - - - - - -Total Tests - - - - - - - -

TEA Division of Performance Reporting Page 9 of 11 August 7, 2015
‡ Results for grades 3-8 mathematics, STAAR A, and STAAR Alternate 2 are not included in 2015 accountability results.
- Indicates there are no students in the group.
** When only one racial/ethnic group is masked, then the second smallest racial/ethnic group is masked (regardless of size).
* Indicates results are masked due to small numbers to protect student confidentiality.
TEXAS EDUCATION AGENCY2015 Index 3: Closing Performance Gaps Data Table
EMILIANO ZAPATA EL (108912118) - LA JOYA ISD
AfricanAmerican Hispanic White
AmericanIndian Asian
PacificIslander
Two orMoreRaces
EconDisadv
2015 STAAR Performance ‡
WritingPercent of Tests% Phase-in Satisfactory Standard - 55% - - - - - 52%% Advanced Standard - 7% - - - - - 6%
Number of Tests# Phase-in Satisfactory Standard - 48 - - - - - 43# Advanced Standard - 6 - - - - - 5Total Tests - 88 - - - - - 82
SciencePercent of Tests% Phase-in Satisfactory Standard - * - - - - - *% Advanced Standard - * - - - - - *
Number of Tests# Phase-in Satisfactory Standard - * - - - - - *# Advanced Standard - * - - - - - *Total Tests - * - - - - - *
Social StudiesPercent of Tests% Phase-in Satisfactory Standard - - - - - - - -% Advanced Standard - - - - - - - -
Number of Tests# Phase-in Satisfactory Standard - - - - - - - -# Advanced Standard - - - - - - - -Total Tests - - - - - - - -

TEA Division of Performance Reporting Page 10 of 11 August 7, 2015
TEXAS EDUCATION AGENCY2015 Index 4: Postsecondary Readiness Calculation Report
EMILIANO ZAPATA EL (108912118) - LA JOYA ISD
Overall Performance Score WeightTotal
Points
STAAR Postsecondary Readiness ‡ 16.0 100% 16.0
Index 4 Score (Target = 12) 16
IndicatorAll
StudentsAfrican
American Hispanic WhiteAmerican
Indian AsianPacific
Islander
Two orMoreRaces
SpecialEd ELL
TotalPoints
MaxPoints
STAAR Postsecondary Readiness Standard ‡STAAR Postsecondary Readiness 16% 16% 32.0 200
STAAR Postsecondary ReadinessStandard Score
16.0
For more information on Index 4 calculations (annual dropout rate conversions or AEA bonus point calculations) see the 2015 Accountability Manual.Blank cells above represent student group indicators that do not meet the minimum size criteria.‡ Results for grades 3-8 mathematics, STAAR A, and STAAR Alternate 2 are not included in 2015 accountability results.

TEA Division of Performance Reporting Page 11 of 11 August 7, 2015
‡ Results for grades 3-8 mathematics, STAAR A, and STAAR Alternate 2 are not included in 2015 accountability results.
n/a Indicates the student group is not applicable to Index 4.
- Indicates there are no students in the group.
** When only one racial/ethnic group is masked, then the second smallest racial/ethnic group is masked (regardless of size).
* Indicates results are masked due to small numbers to protect student confidentiality.
TEXAS EDUCATION AGENCY2015 Index 4: Postsecondary Readiness Data Table
EMILIANO ZAPATA EL (108912118) - LA JOYA ISD
AllStudents
AfricanAmerican Hispanic White
AmericanIndian Asian
PacificIslander
Two orMore Races
SpecialEd ELL
2015 STAAR Postsecondary Readiness ‡% Meeting Postsecondary Readiness Standard 16% - 16% - - - - - n/a n/a# Meeting Postsecondary Readiness Standard 46 - 46 - - - - - n/a n/aTotal Students Tested 283 - 283 - - - - - n/a n/a
4-Year Graduation Rate (Gr 9-12): Class of 2014% Graduated - - - - - - - - - -# Graduated - - - - - - - - - -Total in Class - - - - - - - - - -
5-Year Extended Graduation Rate (Gr 9-12): Class of 2013% Graduated - - - - - - - - - -# Graduated - - - - - - - - - -Total in Class - - - - - - - - - -
Annual Dropout Rate (Gr 9-12): SY 2013-14% Dropped Out - - - - - - - - - -# Dropped Out - - - - - - - - - -# of Students - - - - - - - - - -
Longitudinal RHSP/DAP Graduates: Class of 2014% RHSP/DAP Graduates - - - - - - - - n/a n/a# RHSP/DAP Graduates - - - - - - - - n/a n/a# of Graduates - - - - - - - - n/a n/a
Annual RHSP/DAP Graduates: SY 2013-14% RHSP/DAP Graduates - - - - - - - - n/a n/a# RHSP/DAP Graduates - - - - - - - - n/a n/a# of Graduates - - - - - - - - n/a n/a
College and Career Readiness: SY 2013-14% College and Career Ready Graduates - - - - - - - - n/a n/a# College and Career Ready Graduates - - - - - - - - n/a n/a# of Graduates - - - - - - - - n/a n/a

TEA Division of Performance Reporting Page 1 of 8 August 7, 2015
TEXAS EDUCATION AGENCY2015 Distinction Designation Summary - Reading/ELA
EMILIANO ZAPATA EL (108912118) - LA JOYA ISDCampus Type: Elementary
Indicator ‡Indicator
Score Quartile
Attendance Rate 95.9% Q4Greater Than Expected Student Growth in English Language Arts (ELA) 10% Q4Grade 3 Reading Performance (Level III) 17% Q1Grade 4 Reading Performance (Level III) 9% Q2Grade 4 Writing Performance (Level III) 7% Q1Grade 5 Reading Performance (Level III) 8% Q4Grade 6 Reading Performance (Level III)Grade 7 Reading Performance (Level III)Grade 7 Writing Performance (Level III)Grade 8 Reading Performance (Level III)EOC English I Performance (Level III)EOC English II Performance (Level III)AP/IB Examination Participation: ELAAP/IB Examination Performance: ELASAT/ACT ParticipationSAT Performance: ELAACT Performance: ELAAdvanced/Dual Enrollment Course Completion Rate: Reading/ELATotal Indicators for Reading/ELA 2 of 6
Distinction Campus Outcome: 2 of 6 eligible indicators in the Top Quartile (Q1)
2 of 6 = 33%
Distinction Target: Elementary = 50% or higher
NO DISTINCTION EARNED
Blank values for an indicator score occur if the indicator is not applicable to that campus or does notmeet the minimum size of 10 students.
Blank values for a quartile occur if there are fewer than 20 campuses in the campus comparison groupfor each qualifying indicator.
The attendance rate indicator is not subject specific; therefore, it applies to Reading/ELA,Mathematics, Science, and Social Studies. Consequently, this indicator cannot be the solemeasure used by a campus to attain a distinction.
‡ Results for STAAR A and STAAR Alternate 2 are not included in 2015 accountability results.

TEA Division of Performance Reporting Page 2 of 8 August 7, 2015
TEXAS EDUCATION AGENCY2015 Distinction Designation Summary - Mathematics
EMILIANO ZAPATA EL (108912118) - LA JOYA ISDCampus Type: Elementary
This campus is not eligible for this Distinction Designation. See the 2015 Accountability Manual for more information.
NOT ELIGIBLE

TEA Division of Performance Reporting Page 3 of 8 August 7, 2015
TEXAS EDUCATION AGENCY2015 Distinction Designation Summary - Science
EMILIANO ZAPATA EL (108912118) - LA JOYA ISDCampus Type: Elementary
Indicator ‡Indicator
Score Quartile
Attendance Rate 95.9% Q4Grade 5 Science Performance (Level III) 2% Q4Grade 8 Science Performance (Level III)EOC Biology Performance (Level III)AP/IB Examination Participation: ScienceAP/IB Examination Performance: ScienceACT Performance: ScienceAdvanced/Dual Enrollment Course Completion Rate: ScienceTotal Indicators for Science 0 of 2
Distinction Campus Outcome: 2 of 6 eligible indicators in the Top Quartile (Q1)
0 of 2 = 0%
Distinction Target: Elementary = 50% or higher
NO DISTINCTION EARNED
Blank values for an indicator score occur if the indicator is not applicable to that campus or does notmeet the minimum size of 10 students.
Blank values for a quartile occur if there are fewer than 20 campuses in the campus comparison groupfor each qualifying indicator.
The attendance rate indicator is not subject specific; therefore, it applies to Reading/ELA,Mathematics, Science, and Social Studies. Consequently, this indicator cannot be the solemeasure used by a campus to attain a distinction.
‡ Results for STAAR A and STAAR Alternate 2 are not included in 2015 accountability results.

TEA Division of Performance Reporting Page 4 of 8 August 7, 2015
TEXAS EDUCATION AGENCY2015 Distinction Designation Summary - Social Studies
EMILIANO ZAPATA EL (108912118) - LA JOYA ISDCampus Type: Elementary
This campus is not eligible for this Distinction Designation. See the 2015 Accountability Manual for more information.
NOT ELIGIBLE

TEA Division of Performance Reporting Page 5 of 8 August 7, 2015
TEXAS EDUCATION AGENCY2015 Distinction Designation Summary - Top 25% in Student Progress
EMILIANO ZAPATA EL (108912118) - LA JOYA ISDCampus Type: Elementary
Campus Name District NameIndex 2Score ‡
1 J KAWAS EL (240901122) LAREDO ISD 562 GUERRERO THOMPSON (227901186) AUSTIN ISD 553 HART EL (227901163) AUSTIN ISD 524 GRACIELA GARCIA EL (108909127) PHARR-SAN JUAN-ALAMO ISD 505 WILLIAM J CLINTON EL (108912123) LA JOYA ISD 506 MCRAE EL (220905143) FORT WORTH ISD 497 PATRICIO PEREZ EL (108912114) LA JOYA ISD 498 RODOLFO C CENTENO EL (240903129) UNITED ISD 499 JOHN F KENNEDY LEARNING CENTER (057905268) DALLAS ISD 48
10 J C MARTIN JR EL (240901120) LAREDO ISD 4611 ELODIA R CHAPA EL (108912109) LA JOYA ISD 4512 HENRY CUELLAR EL (240903125) UNITED ISD 4513 JULIAN S ADAME (108902118) DONNA ISD 4514 PADRON EL (227901188) AUSTIN ISD 4515 FRANKLIN D ROOSEVELT EL (240903123) UNITED ISD 4416 HEIGHTS EL (240901106) LAREDO ISD 4417 STEPHEN C FOSTER EL (057905145) DALLAS ISD 4418 WOOTEN EL (227901144) AUSTIN ISD 4419 FARIAS EL (240901105) LAREDO ISD 4320 PRADA EL (240903119) UNITED ISD 4221 EVANGELINA GARZA EL (108912126) LA JOYA ISD 4122 LEE A MCSHAN JR EL (057905286) DALLAS ISD 4123 ROQUE GUERRA JR EL (214901108) RIO GRANDE CITY CISD 4124 BRUNI EL (240901101) LAREDO ISD 4025 CORINA PENA EL (108912124) LA JOYA ISD 4026 JACK LOWE SR EL (057905176) DALLAS ISD 4027 JUAREZ/LINCOLN EL (240903118) UNITED ISD 4028 SANTO NINO EL (240901116) LAREDO ISD 4029 WOOLDRIDGE EL (227901152) AUSTIN ISD 4030 CENTRAL EL (057903103) CARROLLTON-FARMERS BRANCH ISD 3931 DON JOSE GALLEGO (240901102) LAREDO ISD 3932 DAICHES EL (240901104) LAREDO ISD 3833 DIAZ-VILLARREAL EL (108912111) LA JOYA ISD 3834 DR MARIA PALMIRA MENDIOLA EL (108912127) LA JOYA ISD 3835 MACDONELL EL (240901109) LAREDO ISD 3836 DR AMERICO PAREDES EL (108912122) LA JOYA ISD 3637 EASTRIDGE EL (188901105) AMARILLO ISD 3638 JUAN SEGUIN EL (108912120) LA JOYA ISD 3339 PICKLE EL (227901164) AUSTIN ISD 3240 LEONIDES GONZALEZ CIGARROA MD EL (057905278) DALLAS ISD 31
EMILIANO ZAPATA EL (108912118) LA JOYA ISD 30
Top 25% in Student Progress Target = Index 2 Score of 46
NO DISTINCTION EARNED
Blank values for an Index 2 Score occur if the indicator is not applicable to that campus or does notmeet the minimumsize of 10.
Where Index 2 scores are identical the campuses are listed alphabetically by campus name.
‡ Results for grades 3-8 mathematics, STAAR A, and STAAR Alternate 2 are not includedin 2015 accountability results.

TEA Division of Performance Reporting Page 6 of 8 August 7, 2015
TEXAS EDUCATION AGENCY2015 Distinction Designation Summary - Top 25% in Closing Performance Gaps
EMILIANO ZAPATA EL (108912118) - LA JOYA ISDCampus Type: Elementary
Campus Name District NameIndex 3Score ‡
1 GUERRERO THOMPSON (227901186) AUSTIN ISD 472 HEIGHTS EL (240901106) LAREDO ISD 463 JUAREZ/LINCOLN EL (240903118) UNITED ISD 464 HART EL (227901163) AUSTIN ISD 455 SANTO NINO EL (240901116) LAREDO ISD 456 RODOLFO C CENTENO EL (240903129) UNITED ISD 447 GRACIELA GARCIA EL (108909127) PHARR-SAN JUAN-ALAMO ISD 438 ROQUE GUERRA JR EL (214901108) RIO GRANDE CITY CISD 439 PATRICIO PEREZ EL (108912114) LA JOYA ISD 42
10 WILLIAM J CLINTON EL (108912123) LA JOYA ISD 4211 BRUNI EL (240901101) LAREDO ISD 4112 DR MARIA PALMIRA MENDIOLA EL (108912127) LA JOYA ISD 4113 J C MARTIN JR EL (240901120) LAREDO ISD 4114 CENTRAL EL (057903103) CARROLLTON-FARMERS BRANCH ISD 4015 ELODIA R CHAPA EL (108912109) LA JOYA ISD 3916 FRANKLIN D ROOSEVELT EL (240903123) UNITED ISD 3917 J KAWAS EL (240901122) LAREDO ISD 3918 MCRAE EL (220905143) FORT WORTH ISD 3919 PADRON EL (227901188) AUSTIN ISD 3920 JULIAN S ADAME (108902118) DONNA ISD 3821 PRADA EL (240903119) UNITED ISD 3822 DON JOSE GALLEGO (240901102) LAREDO ISD 3723 HENRY CUELLAR EL (240903125) UNITED ISD 3724 STEPHEN C FOSTER EL (057905145) DALLAS ISD 3725 WOOTEN EL (227901144) AUSTIN ISD 3626 EVANGELINA GARZA EL (108912126) LA JOYA ISD 3527 DIAZ-VILLARREAL EL (108912111) LA JOYA ISD 3428 FARIAS EL (240901105) LAREDO ISD 3429 MACDONELL EL (240901109) LAREDO ISD 3430 DR AMERICO PAREDES EL (108912122) LA JOYA ISD 3331 EASTRIDGE EL (188901105) AMARILLO ISD 3332 JOHN F KENNEDY LEARNING CENTER (057905268) DALLAS ISD 3333 LEE A MCSHAN JR EL (057905286) DALLAS ISD 3334 CORINA PENA EL (108912124) LA JOYA ISD 3235 JACK LOWE SR EL (057905176) DALLAS ISD 3236 PICKLE EL (227901164) AUSTIN ISD 3237 WOOLDRIDGE EL (227901152) AUSTIN ISD 3238 JUAN SEGUIN EL (108912120) LA JOYA ISD 3139 DAICHES EL (240901104) LAREDO ISD 30
EMILIANO ZAPATA EL (108912118) LA JOYA ISD 3040 LEONIDES GONZALEZ CIGARROA MD EL (057905278) DALLAS ISD 28
Top 25% in Closing Performance Gaps Target = Index 3 Score of 42
NO DISTINCTION EARNED
Blank values for an Index 3 Score occur if the indicator is not applicable to that campus or does notmeet the minimumsize of 10.
Where Index 3 scores are identical the campuses are listed alphabetically by campus name.
‡ Results for grades 3-8 mathematics, STAAR A, and STAAR Alternate 2 are not includedin 2015 accountability results.

TEA Division of Performance Reporting Page 7 of 8 August 7, 2015
TEXAS EDUCATION AGENCY2015 Distinction Designation Summary - Postsecondary Readiness
EMILIANO ZAPATA EL (108912118) - LA JOYA ISDCampus Type: Elementary
Indicator ‡Indicator
Score Quartile
Index 4 - Percent at STAAR Postsecondary Readiness Standard 16% Q3Four-Year Longitudinal Graduation RateFour-Year Longitudinal RHSP/DAP RateCollege-Ready GraduatesAdvanced/Dual Enrollment Course Completion Rate: Any SubjectAP/IB Examination Performance: Any SubjectSAT/ACT ParticipationSAT/ACT PerformanceCTE-Coherent Sequence GraduatesTotal Indicators for Postsecondary Readiness 0 of 1
Evaluation of Campus Outcomes: 0 of 1 eligible indicators in Q1 (Top Quartile)
0 of 1 = 0%
Distinction Target: Elementary = 50% or higher
NO DISTINCTION EARNED
Blank values for an indicator score occur if the indicator is not applicable to that campus or does notmeet the minimum size of 10 students.
Blank values for a quartile occur if there are fewer than 20 campuses in the campus comparison groupfor each qualifying indicator.
The attendance rate indicator is not subject specific; therefore, it applies to Reading/ELA,Mathematics, Science, and Social Studies. Consequently, this indicator cannot be the solemeasure used by a campus to attain a distinction.
‡ Results for grades 3-8 mathematics, STAAR A, and STAAR Alternate 2 are not includedin 2015 accountability results.

TEA Division of Performance Reporting Page 8 of 8 August 7, 2015
TEXAS EDUCATION AGENCY2015 Distinction Designation Summary
EMILIANO ZAPATA EL (108912118) - LA JOYA ISDCampus Type: Elementary
Indicator ‡
IndicatorScore
Numerator
IndicatorScore
Denominator Score
Quartile 1Minimum
Score Quartile
Attendance Rate 94,434.5 98,494.0 95.9 97.3 Q4Greater Than Expected Student Growth in English Language Arts (ELA) 19 183 10 26 Q4Greater Than Expected Student Growth in Mathematics 0 0Grade 3 Reading Performance (Level III) 16 96 17 17 Q1Grade 4 Reading Performance (Level III) 8 86 9 14 Q2Grade 4 Writing Performance (Level III) 6 88 7 5 Q1Grade 5 Reading Performance (Level III) 8 100 8 14 Q4Grade 5 Science Performance (Level III) 2 99 2 8 Q4Grade 6 Reading Performance (Level III)Grade 7 Reading Performance (Level III)Grade 7 Writing Performance (Level III)Grade 8 Reading Performance (Level III)Grade 8 Science Performance (Level III)Grade 8 Social Studies Performance (Level III)Algebra I by Grade 8 - ParticipationEOC Algebra I Performance (Level III)EOC English I Performance (Level III)EOC English II Performance (Level III)EOC Biology Performance (Level III)EOC U.S. History Performance (Level III)AP/IB Examination Participation: ELAAP/IB Examination Participation: MathematicsAP/IB Examination Participation: ScienceAP/IB Examination Participation: Social StudiesAP/IB Examination Performance: ELAAP/IB Examination Performance: MathematicsAP/IB Examination Performance: ScienceAP/IB Examination Performance: Social StudiesAP/IB Examination Performance: Any SubjectSAT/ACT ParticipationSAT/ACT PerformanceSAT Performance: ELASAT Performance: MathematicsACT Performance: ELAACT Performance: MathematicsACT Performance: ScienceIndex 4 - Percent at STAAR Postsecondary Readiness Standard 46 283 16 25 Q3Four-Year Longitudinal Graduation RateFour-Year Longitudinal RHSP/DAP RateCollege-Ready GraduatesAdvanced/Dual Enrollment Course Completion Rate: Reading/ELAAdvanced/Dual Enrollment Course Completion Rate: MathematicsAdvanced/Dual Enrollment Course Completion Rate: ScienceAdvanced/Dual Enrollment Course Completion Rate: Social StudiesAdvanced/Dual Enrollment Course Completion Rate: Any SubjectCTE-Coherent Sequence Graduates
Blank valuesfor an indicator score occur if the indicator is not applicable to that campus or does not meet the minimum size of 10 students.
Blank valuesfor a quartile occur if there are fewer than 20 campuses in the campus comparison group for each qualifying indicator.
'n/a' Indicates data reporting is not applicable for this indicator.
‡ Results for grades 3-8 mathematics,STAAR A, and STAAR Alternate2 are not included in 2015 accountability results.

TEA Division of Performance Reporting Page 1 of 3 August 7, 2015
TEXAS EDUCATION AGENCY2015 State System Safeguards - Status Report
EMILIANO ZAPATA EL (108912118) - LA JOYA ISD
AllStudents
AfricanAmerican Hispanic White
AmericanIndian Asian
PacificIslander
Two orMore
RacesEcon
DisadvSpecial
Ed
ELL(Current &Monitored) ELL +
TotalMet
TotalEligible
Percent ofEligible
Measures Met
Performance Status ‡Target 60% 60% 60% 60% 60% 60% 60% 60% 60% 60% 60%
Reading Y Y N N 2 4 50
Mathematics 0 0
Writing N N N N 0 4 0
Science N N N N 0 4 0
Social Studies 0 0
Total 2 12 17
Participation Status ‡Target 95% 95% 95% 95% 95% 95% 95% 95% 95% 95% 95%
Reading Y Y Y Y 4 4 100
Mathematics 0 0
Total 4 4 100
Federal Graduation Status (Target: See Reason Codes)Graduation Target Met 0 0
Reason Code ***
Total 0 0
Overall Total 6 16 38
‡ Resultsfor grades 3-8 mathematics,STAAR A, and STAAR Alternate2 are not included in 2015 State System Safeguards.
+ Participation uses ELL (Current) rate, Graduation uses ELL (Ever HS) rate.*** Federal Graduation Rate Reason Codes:
a = Graduation Rate Goal of 90%b = Four-year Graduation Rate Target of 83%c = Safe Harbor Target of a 10% decrease in difference from the prior-year rate and the goald = Five-year Graduation Rate Target of 88%
Blank cells above represent student group indicators that do not meet the minimum size criteria.
TEA Division of Performance Reporting Page 2 of 3 August 7, 2015
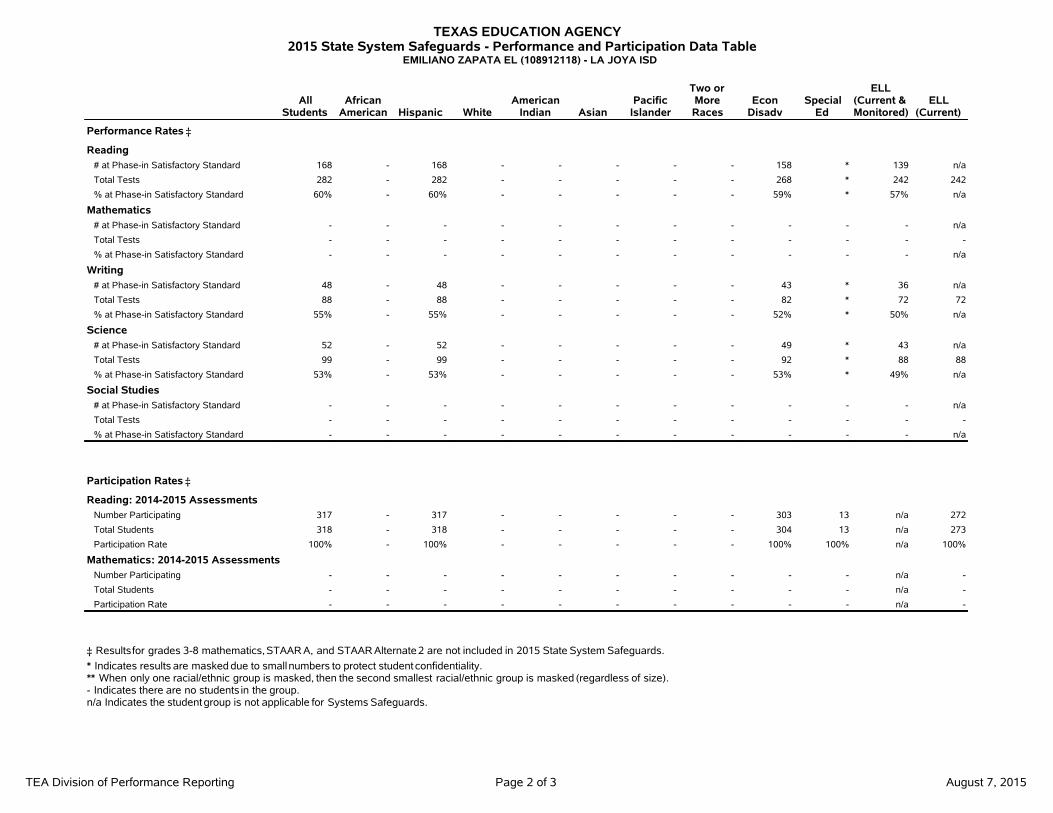
TEXAS EDUCATION AGENCY2015 State System Safeguards - Performance and Participation Data Table
EMILIANO ZAPATA EL (108912118) - LA JOYA ISD
AllStudents
AfricanAmerican Hispanic White
AmericanIndian Asian
PacificIslander
Two orMoreRaces
EconDisadv
SpecialEd
ELL(Current &Monitored)
ELL(Current)
Performance Rates ‡Reading
# at Phase-in Satisfactory Standard 168 - 168 - - - - - 158 * 139 n/a
Total Tests 282 - 282 - - - - - 268 * 242 242
% at Phase-in Satisfactory Standard 60% - 60% - - - - - 59% * 57% n/a
Mathematics# at Phase-in Satisfactory Standard - - - - - - - - - - - n/a
Total Tests - - - - - - - - - - - -
% at Phase-in Satisfactory Standard - - - - - - - - - - - n/a
Writing# at Phase-in Satisfactory Standard 48 - 48 - - - - - 43 * 36 n/a
Total Tests 88 - 88 - - - - - 82 * 72 72
% at Phase-in Satisfactory Standard 55% - 55% - - - - - 52% * 50% n/a
Science# at Phase-in Satisfactory Standard 52 - 52 - - - - - 49 * 43 n/a
Total Tests 99 - 99 - - - - - 92 * 88 88
% at Phase-in Satisfactory Standard 53% - 53% - - - - - 53% * 49% n/a
Social Studies# at Phase-in Satisfactory Standard - - - - - - - - - - - n/a
Total Tests - - - - - - - - - - - -
% at Phase-in Satisfactory Standard - - - - - - - - - - - n/a
Participation Rates ‡Reading: 2014-2015 Assessments
Number Participating 317 - 317 - - - - - 303 13 n/a 272
Total Students 318 - 318 - - - - - 304 13 n/a 273
Participation Rate 100% - 100% - - - - - 100% 100% n/a 100%
Mathematics: 2014-2015 AssessmentsNumber Participating - - - - - - - - - - n/a -
Total Students - - - - - - - - - - n/a -
Participation Rate - - - - - - - - - - n/a -
‡ Resultsfor grades 3-8 mathematics,STAAR A, and STAAR Alternate2 are not included in 2015 State System Safeguards.
* Indicates results are masked due to smallnumbers to protect student confidentiality.** When only one racial/ethnic group is masked, then the second smallest racial/ethnic group is masked (regardless of size).- Indicates there are no students in the group.n/a Indicates the student group is not applicable for Systems Safeguards.

TEA Division of Performance Reporting Page 3 of 3 August 7, 2015
TEXAS EDUCATION AGENCY2015 State System Safeguards - Graduation Data Table
EMILIANO ZAPATA EL (108912118) - LA JOYA ISD
AllStudents
AfricanAmerican Hispanic White
AmericanIndian Asian
PacificIslander
Two orMoreRaces
EconDisadv
SpecialEd
ELL(Ever HS)
ELL(Current)
Federal Graduation Rates
4-year Longitudinal Cohort Graduation Rate (Gr 9-12): Class of 2014Number Graduated - - - - - - - - - - - n/a
Total in Class - - - - - - - - - - - -
Graduation Rate - - - - - - - - - - - n/a
4-year Longitudinal Cohort Graduation Rate (Gr 9-12): Class of 2013Number Graduated - - - - - - - - - - - n/a
Total in Class - - - - - - - - - - - -
Graduation Rate - - - - - - - - - - - n/a
5-year Extended Graduation Rate (Gr 9-12): Class of 2013Number Graduated - - - - - - - - - - - n/a
Total in Class - - - - - - - - - - - -
Graduation Rate - - - - - - - - - - - n/a
* Indicates results are masked due to smallnumbers to protect student confidentiality.** When only one racial/ethnic group is masked, then the second smallest racial/ethnic group is masked (regardless of size).- Indicates there are no students in the group.n/a Indicates the student group is not applicable for Systems Safeguards.