MESSAGE FROM THE CHIEF EXECUTIVE OFFICER - TSO3 · Message from the Chief Executive Officer ......
22
Transcript of MESSAGE FROM THE CHIEF EXECUTIVE OFFICER - TSO3 · Message from the Chief Executive Officer ......

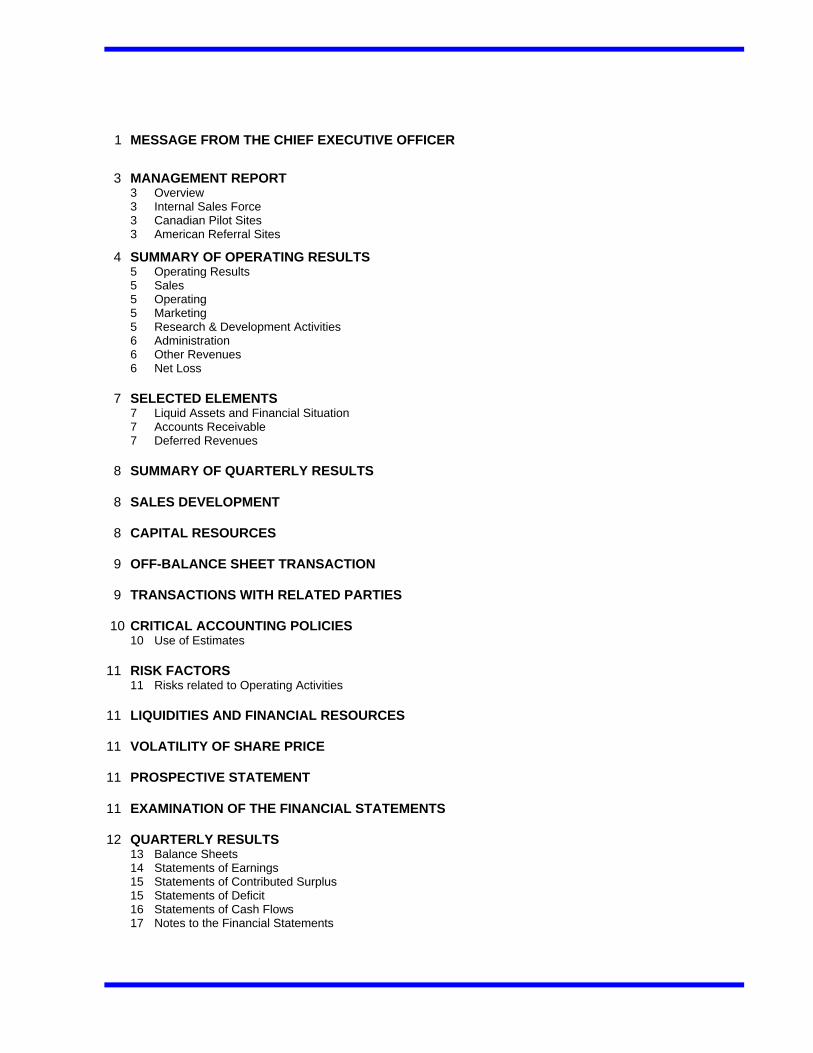
1 MESSAGE FROM THE CHIEF EXECUTIVE OFFICER
3 MANAGEMENT REPORT
3 Overview 3 Internal Sales Force 3 Canadian Pilot Sites 3 American Referral Sites
4 SUMMARY OF OPERATING RESULTS 5 Operating Results 5 Sales 5 Operating 5 Marketing 5 Research & Development Activities 6 Administration 6 Other Revenues 6 Net Loss
7 SELECTED ELEMENTS
7 Liquid Assets and Financial Situation 7 Accounts Receivable 7 Deferred Revenues
8 SUMMARY OF QUARTERLY RESULTS 8 SALES DEVELOPMENT 8 CAPITAL RESOURCES 9 OFF-BALANCE SHEET TRANSACTION 9 TRANSACTIONS WITH RELATED PARTIES 10 CRITICAL ACCOUNTING POLICIES
10 Use of Estimates 11 RISK FACTORS
11 Risks related to Operating Activities 11 LIQUIDITIES AND FINANCIAL RESOURCES 11 VOLATILITY OF SHARE PRICE 11 PROSPECTIVE STATEMENT 11 EXAMINATION OF THE FINANCIAL STATEMENTS 12 QUARTERLY RESULTS
13 Balance Sheets 14 Statements of Earnings 15 Statements of Contributed Surplus 15 Statements of Deficit 16 Statements of Cash Flows 17 Notes to the Financial Statements

Message from the Chief Executive Officer Dear Shareholders: Spread over the summer period that is traditionally quiet in the health industry, the third quarter of 2006 was also slower in terms of sales. We took advantage of this lull to consolidate gains with our current and potential customers, ensuring the progression of the purchasing process set in motion in 2006, and the development of the sales foreseen for 2007. The average sales cycle for a capital investment such as the 125L Ozone Sterilizer device is estimated to take 12 months. During this quarter, we have noted that the sales cycle tends to be longer for the introduction of a new technology. Several sales forecast for this year will be delayed until next year, and will be in our pipeline for 2007. Having begun our commercialization last January with our own sales team, we have won the trust of the hospital milieu and continue to elicit interest. For instance, the conservative market we are in has responded positively to our technology with the acquisition of units, and also with the ongoing testimonials from satisfied users committed to providing positive references for our potential clients. What’s more, we have improved the quality of our sales and marketing team this quarter by recruiting new sales representatives. Today, 22 sales and marketing professionals share the North American market. In addition to their extensive experience in the hospital sector, these professionals, under experienced management, have all the tools and sales arguments developed by TSO3 , including the following new elements:
• The third clearance from the United States Food and Drug Administration (FDA), which we obtained during the third quarter. This clearance certifies that the 125L Ozone Sterilizer can sterilize a significantly broader range of lumened instruments with smaller internal diameters and longer lengths. These tubes with lights (endoscopes) are used notably during micro-invasive surgery (MIS). This major recognition puts us even further ahead of the competition, as TSO3 is redefining the industry standards for sterilization capabilities. Indeed, several of our partners among the most important manufacturers of rigid MIS instruments have confirmed that the 125L Ozone Sterilizer now has the capacity to sterilize all their instruments.
• Four new medical instrument manufacturers recently endorsed our technology,
bringing undeniable added value to our Company as each manufacturer confirms through these endorsements that their instruments can be safely sterilized with the 125L.
TSO3 – 2006 Third Quarter Report p. 1
• After several years of preparation and waiting, our sterilization process is now patented in Europe and the United States. The United States Patent and Trademark Office (USPTO) and the European Patent Office (EPO) have officially granted TSO3 optimal intellectual property protection for the next 20 years. The patent we were issued covers not only the ozone sterilization method, but also the process through which low temperature humidity is created. This process is necessary for efficacious sterilization and is specific to TSO3.
To conclude, TSO3 has always demonstrated perseverance and we continue to develop intensively the commercialization of the 125L Ozone Sterilizer. Despite a sales cycle that is longer than anticipated, the acceptance of our product by the market clearly expresses the need for a simple, environmentally friendly and economical solution like ours. The satisfaction expressed by our customers reiterates that the 125L is perfectly adapted to the expectations of our market – and several hospitals have confirmed they are in the acquisition process for one or more sterilizers – an encouraging outlook for the coming year.
Jocelyn Vézina Chief Executive Officer
TSO3 – 2006 Third Quarter Report p. 2

Management Report The following information must be read in conjunction with the audited financial statements and accompanying notes.
Overview Founded in June 1998, the Company has developed a unique new sterilization process that uses ozone as the sterilizing agent. The first device resulting from this technological platform, the 125L Ozone Sterilizer, was designed to sterilize the new generation of surgical and diagnostic instruments made of heat-sensitive polymers. After receiving approval from Health Canada on May 3, 2002, the Company obtained clearance from the United States Food and Drug Administration (FDA) to sell the 125L Ozone Sterilizer and the accompanying Chemical Indicator on September 3, 2003. Internal Sales Force The sales and marketing department was strengthened significantly between the third quarter of 2005 and the third quarter of 2006. The number of employees went from 10 to 22. The team can now profit from the contribution of 22 sales professionals who have extensive experience working with capital equipment sales to both operating rooms and central sterilization departments in hospitals. Canadian Pilot Sites The Company entered into agreements with six hospital centres. These hospitals have agreed to make their sterilization depart-ment facilities, personnel and equipment available for the project. These tests aim to validate the compatibility of an increasing number of instruments and packaging, and also to demonstrate to hospitals how the 125L Ozone Sterilizer can considerably reduce direct and indirect operating costs.
As of September 30, 2006, the in-use evaluations and the transfer of property have been completed in one of the Canadian Pilot Sites. The Company anticipates concluding evaluations at the remaining pilot sites within the coming months. American Referral Sites The Company received market recognition for its innovative technology by promoting the use of its 125L Ozone Sterilizer at several prestigious hospitals in the United States. These in-use evaluations are presently ongoing and function as a trial period before using the sterilizer in a real hospital setting. The users agree to testify to their satisfaction and to act as a showcase site for the technology for future clients. In exchange, the referral site participants receive a discount on the selling price of the 125L Ozone Sterilizer.
The principal objectives of the referral sites were: to allow the users to experience the operation of the 125L Ozone Sterilizer in a live hospital context; and to receive testimonials from the referral sites to aid sales to future clients. These objectives are currently being met. The Company expects that certain pilot sites will not acquire the sterilizer at the end of the trial period, for budgetary reasons for example, while others may purchase more than one. The Company has signed agreements with seven renowned hospital networks. By the end of the third quarter of 2006, five referral sites had completed their in-use evaluations and one had bought the sterilizer. Four
TSO3 – 2006 Third Quarter Report p. 3

American Referral Sites (cont’d) sites returned the sterilizer. Among them, two were not able to proceed to the acquisition due to budgetary constraints, and two other devices - installed in the same site - were returned due to changes in the management involved in the operation of the 125L. However this site wrote a testimonial and agreed to testify to its effectiveness.
Besides, as of September 30 2006, two remaining sites are still testing the sterilizers. The Company anticipates concluding evaluations at the referral sites within the coming months.
SUMMARY OF OPERATING RESULTS Periods ended September 30 (unaudited) THIRD QUARTER
2006 2005
NINE MONTH 2006 2005
SALES $ 33,961 $ 161,345 $ 636,110 $ 161,345 EXPENSES
Operating 308,057 267,570 1,186,140 693,315Marketing 794,376 431,209 2,289,755 1,294,637Research & development 387,637 433,387 1,267,583 1,370,740Administrative 705,234 577,575 2,220,493 1,723,909Financial 1,968 10,256 12,270 13,528
2,197,272 1,719,997 6,976,241 5,096,129 OPERATING LOSS 2,163,311 1,558,652 6,340,131 4,934,784 OTHER REVENUES 150,242 157,526 829,625 333,565 NET LOSS $ 2,013,069 $ 1,401,126 $ 5,510,506 $ 4,601,219
TSO3 – 2006 Third Quarter Report p. 4

Operating Results Periods ended September 30, 2006, compared to periods ended September 30, 2005. Sales Sales for the third quarter amounted to $33,961 compared to $161,345 for the same period in 2005. During the third quarter of 2006 the Company recorded accessory sales solely, compared to the third quarter of 2005 in which it actually recorded the sale of a sterilizer. For the nine-month period, sales amounted to $636,110, which were the results of the sales of five devices and accompanying accessories. This compared to $161,345 for the same period in 2005, which reflects the sale of a sterilizer and accompanying accessories. Operating Operating expenses were $308,057 for the three-month period ending September 30, 2006, compared to $267,570 for the same period in 2005. This figure includes the following items: device manufacturing expenses, general operating expenses and expenses attributed to the Company’s Customer Service Department. The variance between the third quarter of 2006 and the third quarter of 2005 is attributed to a rise in maintenance fees and warranty costs. For the nine-month period ended September 30, 2006, Operating expenses amounted to $1,186,140 compared to $693,315 for the same period in 2005. The variance between these two periods can be explained by the cost of manufacturing the devices sold during these quarters and also by manufacturing new ones. This increase can also be attributed to a rise in maintenance, warranty costs, the amor-tization of the technology and the cost of
adding two new employees to the Production Department. Marketing Marketing expenses amounted to $794,376 for the three-month period ended September 30, 2006 compared to $431,209 for the same period in 2005. For the nine-month period ended September 30, 2006, Marketing expenses increased $995,118 to reach $2,289,755 compared to $1,294,637 for the corresponding period of the preceding fiscal year. These increases are due to more intensive marketing activities. The sales and marketing team increased from 10 to 22 professionals between September 30, 2005 and September 30, 2006. It is the Company’s intention, within the coming months, to concentrate its resources on the Sales and Marketing department. Costs related to salaries, bonus, commissions, recruitment, as well as representation fees, also increased. On the other hand, costs related to American referral sites have decreased between these two periods. Research & Development Activities For the three-month period ended September 30, 2006, R&D expenses before tax credits amounted to $387,637 compared to $433,387 for the same period in 2005. For the nine-month period ended September 30, 2006, Research and Development expenses realized a decrease of $103,157 to reach $1,267,583 compared to $1,370,740 for the corres-ponding period of the preceding fiscal year. The declines between the two periods mentioned-above are explained primarily by a reduction in material purchases and expenses related to scientific advisor committees, as well as a decrease in professional fees. These decreases were partially offset by increases in salaries paid to the Company’s R&D team.
TSO3 – 2006 Third Quarter Report p. 5

Administration Administration expenses amounted to $705,234 for the three-month period ended September 30, 2006 compared to $577,575 for the same period in 2005. This increase is mainly attributed to a rise in salaries and Stock-based Compensation. On the other hand, this increase was partially offset by a decrease in professional fees. For the nine-month period ended September 30, 2006, administration expenses increased $496,584 to reach $2,220,493 compared to $1,723,909 for the corresponding period of the preceding fiscal year. This difference is mainly attributed to bonus paid in the first quarter of 2006, (for fiscal year 2005) and to an increase in Stock-based Compensation. Insurance and professional fees also contributed to the increase between the two periods. On the other hand, expenses related to communications decreased. Other Revenues For the third quarter of 2006, the Company realized Other revenues of $150,242 compared to $157,526 for the same period in 2005. Other Revenues consists of investment revenues and R&D income tax credits. The decrease between the two periods is the result of a loss due to fluctuating exchange rates and lower amounts of R&D income tax credits. This decrease was offset by an increase in investment revenues. For the nine-month period ended September 30, 2006, Other Revenues increased $496,060 to reach $829,625 compared to $333,565 for the corresponding period of the preceding fiscal year. The increase between these two periods is explained primarily by an increase in investment revenues, in R&D income tax credits, as well as the receipt of $250,000 for the third instalment of payments from IQ Immigrants Investisseurs Inc.
Net Loss The Company recorded a net loss of $2,013,069 or $0.06 per share for the third quarter of 2006, compared to a net loss of $1,401,126, or $0.04 per share, for the same period in 2005. For the nine-month period ended September 30, 2006, net loss was $5,510,506, or $0.15 per share, compared to $4,601,219, $0.14 per share for the same period in 2005.
TSO3 – 2006 Third Quarter Report p. 6

SELECTED ELEMENTS SEPTEMBER 30 DECEMBER 31
2006 2005 2005 2004 2003
Liquid Assets (Cash & Temporary Investment) $ 8,738,435 $ 16,569,170 $ 14,595,003 $ 10,678,563 $ 15,640,237Accounts Receivable $ 473,840 $ 213,272 $ 344,302 $ 332,331 $ 1,453,471Deferred Revenues $ 46,847 $ 946,391 $ 961,826 $ 36,060 $ -Assets $ 16,854,296 $ 24,049,739 $ 22,587,034 $ 18,310,919 $ 27,406,162Short & Long Term Debt $ - $ - $ - $ - $ 68,500 Liquid Assets and Financial Situation As of September 30, 2006, cash and temporary investments amounted to $8,738,435 and accounts receivable amounted to $473,840, for a total amount of $9,212,275 compared to $16,782,442 as of September 30, 2005. Capital payments required and the various contractual commitments in the coming fiscal years are as follows:
2006
2007
2008
Rental Contract $ 9,159 $28,355 $19,632
Referral Sites 29,489 - -
R&D Contract 95,587 - -
TOTAL $134,235 $28,355 $19,632 Account Receivables Account Receivables as of September 30, 2006, amounted to $473,840 compared to $213,272 for the same period in 2005. The difference between the two periods is due to an increase in income tax credits to be received.
Deferred Revenues As of September 30, 2006, Deferred Revenues amounted to $46,847 compared to a total amount of $946,391 for the same period in 2005. Further to the desire of TSO3 to market its technology in an autonomous way, the companies agreed that TSO3 would buy back sterilizers from Skytron in the second and third quarter of 2006. Theses units had originally been bought by Skytron for use at American referral sites.
TSO3 – 2006 Third Quarter Report p. 7

SUMMARY OF QUARTERLY RESULTS
2006
2005
($000 except loss/share)
Q3 Q2 Q1 Q4 Q3 Q2 Q1 Q4 Q3
Sales 34 301 301 11 161 - - - -
Other Revenues 150 443 236 197 157 75 101 82 133
Net Loss 2,013 1,492 2,005 1,835 1,401 1,637 1,562 1,406 1,419
Net Loss per share
0.06 0.04 0.05 0.05 0.04 0.05
0.05 0.05 0.04
Company revenues consisted of sales of units and accessories, investment income, various income tax credits and government subsidies. Overall, net quarterly losses per share have been relatively stable for the last two complete fiscal years. SALES DEVELOPMENT During the first three quarters of 2006, the Company sold five units. Some of these units were attributed to Deferred Revenues and the transfer of ownership of these units was also completed. Certain sales did not require any trial period. The Company strategy of establishing referral sites is now bearing fruit. In fact, early adopters are now in a position to provide testimonials highlighting the benefits of the ozone sterilizer to potential clients. As a result and generally speaking, the Company does not anticipate needing to offer trial periods to future clients. Revenues from sales will be recognized when the unit is delivered.
CAPITAL RESOURCES Historically, the Company has funded its activities from several rounds of public and private financing, as well as from various government subsidies. Since its inception in June 1998, the Company has raised $47M from the sale of its equity. Even though the monthly burn-rate for the third quarter of 2006 was $700,000, the Company anticipates that its burn-rate could increase slightly during the upcoming months and then decrease as sales accelerate. On July 7, 2005, the Company concluded private financing of $10M. There were warrants issued as a result of this financing. There are 288,750 warrants valid until January 7, 2007 and 2,419,850 warrants valid until July 7, 2007. 416,670 warrants, issued in other circumstance, will expire during this fiscal year.
TSO3 – 2006 Third Quarter Report p. 8

CAPITAL RESOURCES (cont’d) The Company believes that even with its current liquid assets and the amounts that would be generated by exercising the warrants, an additional financing will be necessary to reach the break-even point. The Company has a line of credit with which it can obtain advances up to a maximum of $200,000. Amounts drawn on this line of credit, renewable on an annual basis, bear interest at the prime rate plus 1.5%. The Company’s accounts receivable and inventories are pledged as security against this line of credit, and the Company must satisfy certain financial ratios commonly found in this type of loan. This line of credit had not been used as of September 30, 2006. The Company has entered into a non-refundable financial contribution agree-ment with IQ Immigrants Investisseurs Inc., under which and upon reaching specific objectives, the Company could receive a contribution totalling $1,000,000 payable in four annual instalments of $250,000. The Company received the first two instalments in 2002 and 2003, totalling $500,000. The third instalment was received during the second quarter of 2006. As of October 18, 2006 the number of outstanding shares was 36,615,701. OFF-BALANCE SHEET TRANSACTION The Company made no off-balance sheet transaction. TRANSACTIONS WITH RELATED PARTIES The Company leases its premises from a company owned by the Company’s shareholders.
Over the three first quarters of 2005 and 2006 and the last two complete fiscal years, the Company has made the following related transactions, assessed at fair market value:
TSO3 – 2006 Third Quarter Report p. 9

CRITICAL ACCOUNTING POLICIES The Company financial statements are prepared in accordance with Generally Accepted Accounting Principles in Canada (“G.A.A.P.”). The Company’s critical accounting policies include the use of estimates, revenue recognition, the recording of research and development expenses and the determination of the useful lives or fair value of goodwill and intangible assets. Some of our critical accounting policies require the use of judgment in their application or require estimates of inherently uncertain matters. We believe that these policies, described hereafter, are critical and require the use of complex judgment in their application: Use of estimates The preparation of financial statements, in accordance with Canadian Generally Accepted Accounting Principles, requires management to make estimates and assumptions that affect the recorded amounts of assets and liabilities, the disclosure of contingent assets and liabilities as of the date of the financial statements and the disclosure of contingencies at the date of the financial statements and the reported amounts of revenues and expenses during the reporting period. Since the process for presenting financial information presupposes the use of estimates, actual
results could differ from the information presented. Intangible assets are acquisition costs for a patent license and technology, including all related rights and patents for the technology. The licence stated at acquisition cost is amortized using the straight-line method over the licence’s useful life of 16 years. The patents stated at acquisition cost are amortized using the straight-line method over the patents’ useful life of 20 years. The value of the licence is periodically tested for impairment based on an estimate of undiscounted cash flows for the remaining amortization period. Any impairment loss revealed by the test would be carried to earnings for the period during which the loss occurred. The technology is amortized using the straight-line method over the useful life of 20 years. The impairment test consists of comparing the recovery fair value of the asset with its carrying value. Any excess of book value over fair value will be charged to earnings in the period in which the impairment is determined. Amortization expenses of $54,951, related to intangible assets, were recorded in the third quarter of 2006 compared to $34,301 for the same period in 2005.
SEPTEMBER 30
DECEMBER 31
2006 2005 2005 2004 Rent
$ 43,353 $ 42,420 $ 56,560 $ 55,560
Other Rent-Related Expenses 62,026 62,765 73,462 60,650
$ 105,379 $ 105,185 $ 130,022 $ 116,210
TSO3 – 2006 Third Quarter Report p. 10

RISK FACTORS Risks related to Operating Activities
The Company’s activities entail certain risks and uncertainties inherent in the industry in which it operates. However, management has implemented a risk-reduction strategy that relies on the Company’s ability to:
• Suitably protect its intellectual property;
• Establish strategic alliances;
• Compete with existing technologies marketed by major players in the industry;
• Adequately market its products;
• Develop alliances in order to constantly increase the number of ozone-compatible instruments;
• Provide the resources and the necessary energies to successfully pursue research on the compatibility of the sterilization process with current and future generations of surgical instruments.
LIQUIDITIES AND FINANCIAL RESOURCES Management believes that it will be able to raise the necessary long-term capital to achieve corporate objectives. However, the availability of these financial resources cannot be guaranteed. VOLATILITY OF SHARE PRICE Company share prices are subject to volatility. Financial and scientific results that differ from analysts’ projections may lead to significant variations in the price of Company shares.
PROSPECTIVE STATEMENT This document contains certain prospective statements that reflect the Company’s current expectations concerning future activities. These prospective statements include risks and uncertainties. Actual results can differ considerably from the results, as previously described in this report, expected by the Company. Investors are advised to consult the Company’s quarterly and annual reports, as well as the filing of the Company’s annual information form for more details on the risks and uncertainties related to these prospective statements. The reader must not unduly rely upon the Company’s prospective statements. The Company is not obliged to update these prospective statements. This Management Report has been prepared as of October 18, 2006. Additional information on the Company is available through regular filing of press releases, quarterly financial statements and the Annual Information Form on the SEDAR website (www.sedar.com). EXAMINATION OF THE FINANCIAL STATEMENTS The Financial Statements have not been audited by the External Controller.
Marc Boisjoli, M.Sc. Vice President, Finances and Chief Financial Officer October 18, 2006
TSO3 – 2006 Third Quarter Report p. 11
QUARTERLY RESULTS
JULY, AUGUST, SEPTEMBER
The Financial Statements have not been audited by the External Controller
TSO3 – 2006 Third Quarter Report p. 12

FINANCIAL STATEMENTS Balance Sheets as of
SEPTEMBER 30 2006
(unaudited)
DECEMBER 31
2005 (audited)
SEPTEMBER 30
2005 (unaudited)
CURRENT ASSETS Cash $ 518,366 $ 294,101 $ 612,556 Temporary Investments 8,220,069 14,300,902 15,956,614 Accounts receivable 473,840 344,302 213,272 Inventories 3,337,515 3,303,258 2,889,003 Prepaid Expenses 159,226 95,894 119,783
12,709,016 18,338,457 19,791,228
PROPERTY, PLANT AND EQUIPMENT 422,843
416,327
434,216
INTANGIBLE ASSETS 3,722,437 3,832,250 3,824,295 $ 16,854,296 $ 22,587,034 $ 24,049,739
CURRENT LIABILITIES Accounts Payable and Accrued Liabilities $ 820,984 $ 1,015,491 $ 777,101
Deferred Revenues 46,847 961,826 946,391 867,831 1,977,317 1,723,492
SHAREHOLDERS’S EQUITY
Share Capital 46,598,110 46,036,329 46,030,549 Contributed Surplus 4,946,065 4,620,592 4,492,151 Deficit (35,557,710) (30,047,204) (28,196,453)
15,986,465 20,609,717 22,326,247 $ 16,854,296 $ 22,587,034 $ 24,049,739
TSO3 – 2006 Third Quarter Report p. 13
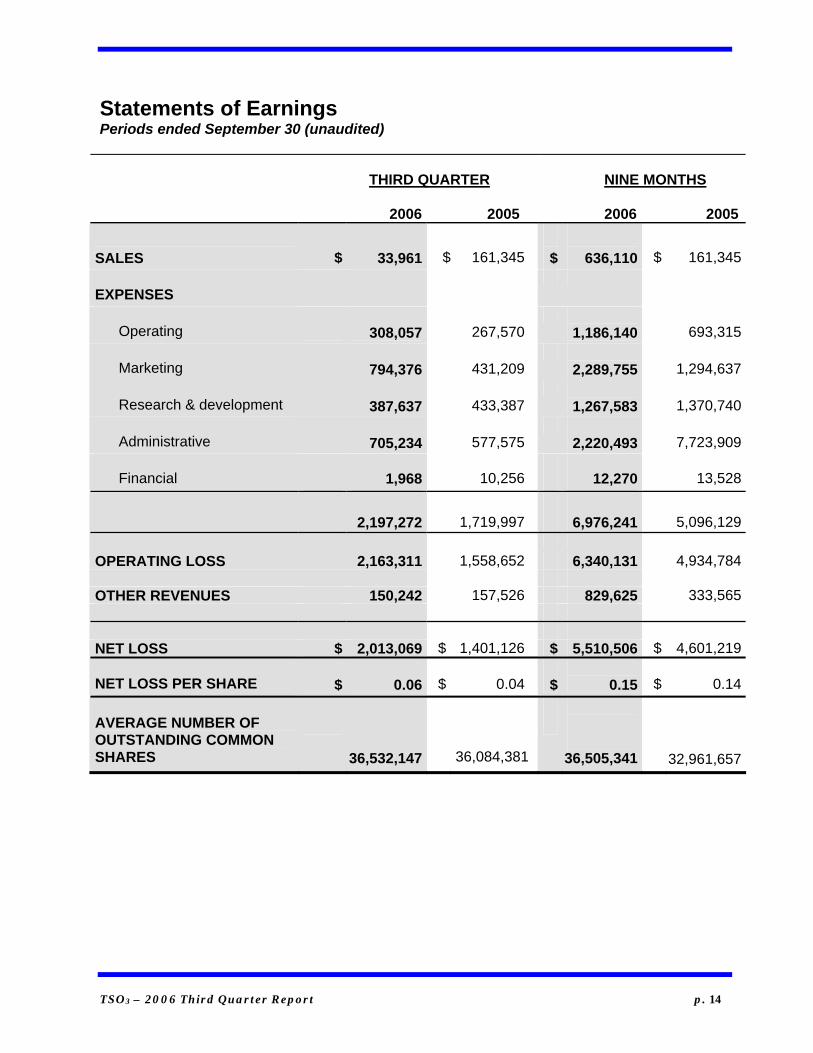
Statements of Earnings Periods ended September 30 (unaudited)
THIRD QUARTER
2006 2005
NINE MONTHS 2006 2005
SALES $ 33,961 $
161,345
$
636,110 $ 161,345
EXPENSES
Operating 308,057 267,570
1,186,140 693,315
Marketing 794,376 431,209
2,289,755 1,294,637
Research & development 387,637 433,387
1,267,583 1,370,740
Administrative 705,234 577,575
2,220,493 7,723,909
Financial 1,968 10,256 12,270 13,528 2,197,272 1,719,997 6,976,241 5,096,129 OPERATING LOSS 2,163,311 1,558,652 6,340,131 4,934,784 OTHER REVENUES 150,242 157,526 829,625 333,565 NET LOSS $ 2,013,069 $ 1,401,126 $ 5,510,506 $ 4,601,219
NET LOSS PER SHARE $ 0.06 $ 0.04 $
0.15 $ 0.14
AVERAGE NUMBER OF OUTSTANDING COMMON SHARES 36,532,147 36,084,381
36,505,341
32,961,657
TSO3 – 2006 Third Quarter Report p. 14

Statements of Contributed Surplus Periods ended September 30 (unaudited)
THIRD QUARTER 2006 2005
NINE MONTHS 2006 2005
Balance, Beginning of Period $ 4,784,059 $ 2,396,155 $ 4,620,592 $ 2,213,699
Stock-based Compensation 189,882 105,775
441,830
288,231
Warrants issued related to the private placement - 1,639,871
-
1,639,871
Compensation Options related to the private placement - 350,350
-
350,350
4,973,941 4,492,151
5,062,422
4,492,151
Exercised Stocks - -
( 2,475 )
-
Exercised Warrants ( 27,876)
-
( 113,882 )
-
Balance, End of Period $ 4,946,065 $ 4,492,151 $
4,946,065
$
4,492,151
Statements of Deficit Periods ended September 30 (unaudited)
THIRD QUARTER 2006 2005
NINE MONTHS 2006 2005
Balance, Beginning of Period $ 33,544,641 $ 25,635,039 $ 30,047,204 $ 22,434,946
Share issue expenses - 809,938 -
809,938
Compensation Options related to the private placement - 350,350
-
350,350
Net Loss 2,013,069 1,401,126
5,510,506
4,601,219
Balance, End of Period $ 35,557,710 $
28,196,453 $ 35,557,710
$
28,196,453
TSO3 – 2006 Third Quarter Report p. 15

Statements of Cash Flows Periods ended September 30 (undaudited) THIRD QUARTER
2006 2005 NINE MONTHS 2006 2005
OPERATING ACTIVITIES Net loss $ (2,013,069) $ (1,401,126) $ (5,510,506) $ (4,601,219) Adjustments for :
Depreciation and amortization of property, plant and equipment 36,584
40,209
104,146
115,758
Depreciation and amortization of the intangible assets 54,951
34,301
164,385
102,665
Stock-based compensation 189,882 105,775 441,830 288,231 Lost on disposal of property, plant and
equipment -
- -
1,698
(1,731,652) (1,220,841) (4,800,145) (4,092,867) Changes in non-cash operating working
capital items (328,073)
14,188 (1,336,612)
916,476
Cash flows used in operating activities (2,059,725) (1,206,653) (6,136,757) (3,176,391)
INVESTING ACTIVITIES Temporary investments 3,767,125 (7,242,026) (857,573) (7,487,106) Disposal of temporary investments 1,087,861 - 4,261,202 1,876,944 Acquisition of property, plant and
equipment (25,457) (23,403) (110,663)
(63,399)
Intangible assets (6,196) (6,360) (54,572) (18,965) Disposal of property, plant and
equipment -
- -
9,300
Cash flows (used in) from investing activities
4,823,333
(7,271,789)
3,238,394
(5,683,226)
FINANCING ACTIVITIES Repayment of long-term debt - - - (68,500) Share issue expenses - (809,938) - (809,938) Exercised shares - - (2,475) - Exercised warrants (27,876) - (113,882) - Share issue 140,601 10,018,500 561,781 10,018,500 Cash flows (used in) from investing activities 112,725
9,208,562
445,429
9,140,062
INCREASE (DECREASE) IN CASH AND CASH EQUIVALENTS 2,876,333 730,120
(2,452,939)
280,445
CASH AND CASH EQUIVALENTS AT BEGINNING 1,967,363
8,351,944
7,296,635
8,801,619
CASH AND CASH EQUIVALENTS AT END $ 4,843,696 $
9,082,064 $
4,843,696
$
9,082,064
Temporary investments more than three months 3,894,739
7,487,106
3,894,739
7,487,106
CASH AND TEMPORARY INVESTMENTS $ 8,738,435
$
16,569,170 $
8,738,435
$
16,569,170
The notes are an integral part of the financial statements.
TSO3 – 2006 Third Quarter Report p. 16

Notes to the Financial Statements Nine-month period ended September 30 (Unaudited) 1. The unaudited financial statements are prepared in accordance with Canadian generally
accepted accounting principles for interim financial statements and do not include all the information required for complete financial statements. The intermediate exploitation results do not necessarily reflect the exploitation results forecasted for the entire period. Moreover, they do not include all the information presented in the annual financial statements. The unaudited financial statements are consistent with the policies outlined in the Company’s audited financial statements for the year ended December 31, 2005. The interim financial statements and related notes should be read in conjunction with the Company’s audited financial statements for the year ended December 31, 2005. Certain of the prior periods comparative amounts have been reclassified to conform to the current year’s.
2. Accounting Policies Intangible Assets Intangible assets include the patent cost of a licence, the cost of a technology including all the related rights, and the patent costs. The licence and patents are amortized using the straight-line method over the licence’s useful life of 16 years and over the patents’ useful lives of 20 years. The technology is amortized using the straight-line method over the estimated useful life of 20 years. Impairment of long-lived Assets Long-lived assets are reviewed for impairment upon the occurrence of events or changes in circumstances indicating that the carrying value of the assets may not be recoverable. Impairment is recognized when the carrying amount of a long-lived asset exceeds the undiscounted cash flows expected to result from its use and disposal. The recognized impairment is measured as the excess of the carrying amount over its fair value. Revenue Recognition The Company generates revenue mainly from the sale of ozone sterilization units, parts and instruments related to these units and contracts for the support and maintenance of these units. The Company is generally committed under revenue arrangements with multiple deliverables that include delivery of units, installation, maintenance, and consulting and support services. The Company recognizes revenue when persuasive evidence of an arrangement exists, delivery has occurred, the price to the buyer is fixed or determinable and collection is reasonably assured.
TSO3 – 2006 Third Quarter Report p. 17

Notes to the Financial Statements Nine-month period ended September 30 (Unaudited)
Revenue Recognition (cont’d) Revenue from revenue arrangements with multiple deliverables are divided into separate units of accounting when the Company has reliable evidence. When revenue cannot be determined, it is deferred and calculated using the straight-line method over the term of the contract. Revenue related to units sold, parts and instruments related to those units, installation and consulting services are recognized once the services are provided and the client accepts the services received. Maintenance and support contracts are calculated using the straight-line method over the term of the contract.
3. Share Capital
SEPTEMBER 30 2006
DECEMBER 31 2005 Issued
36,615,701 common shares $ $46,036,329 46,598,110
Stock Options As of August 2, 2006, the Company has granted 132,000 stock options to certain employees and managers. These options, which vests over 3 years, entitle the holder to subscribe to common share of the Company at a price of $2.90 until August 2, 2016. The fair value of stock options is $2.00 per share. The Black-Scholes options pricing model was developed for use in estimating the fair value of traded options which have no vesting restrictions and are fully transferable, a practice significantly different from how stock options are granted by the Company. In addition, option pricing models require the input of highly subjective assumptions including the expected stock price volatility. Any changes in the assumptions can materially affect the fair value estimate.
TSO3 – 2006 Third Quarter Report p. 18

Notes to the Financial Statements Nine-month period ended September 30 (Unaudited)
Stock Options (cont’d) The fair value of the options at the grant date is estimated using the Black-Scholes option pricing model under the following weighted average assumptions:
2006 Risk free interest rate 4.36% Expected volatility 59% Life 10 yearsExpected dividend yield 0%
4. Dilutive Items
THIRD QUARTER NINE MONTHS WEIGHTED
AVERAGE WEIGHTED
AVERAGE EXERCISE
PRICE
NUMBER EXERCISE
PRICE NUMBER Stock Options Outstanding at the beginning of period
2,180,567
$2.05
2,002,826
$1.99
Granted 132,000 2.90 370,001 3.10 Exercised (3,500) 1.85 (16,800) 1.81 Forfeited - - (46,960) 2.60
2,309,067
2,309,067
$2.16 $2.16 Warrants Outstanding at the beginning of period
3,167,770
$2.42
3,310,476
$2.41
Granted - - - - Exercised (42,500) 2.50 (185,206) 2.24 Forfeited - - - - 3,125,270 $2.42 3,125,270 $2.42 Outstanding at the end of period 5,434,337 $2.31 5,434,337 $2.31 Exercisable at the end of period 4,658,705 $2.26 4,658,705 $2.26
TSO3 – 2006 Third Quarter Report p. 19

HEADQUARTERS
TSO3 Inc.
2505, avenue Dalton
Québec (Québec)
Canada G1P 3S5
Telephone: (418) 651-0003
Fax: (418) 653-5726
www.tso3.com
Ticker Symbol: TOS (TSX)
COMMUNICATIONS ANDINVESTOR RELATIONS
Telephone: (418) 651-0003, Ext. 237Fax: (418) 653-5726E-mail: [email protected]