Mesophase Pitch-based Carbon Fiber and Its Composites- Preparati
90
University of Tennessee, Knoxville Trace: Tennessee Research and Creative Exchange Masters eses Graduate School 12-2010 Mesophase Pitch-based Carbon Fiber and Its Composites: Preparation and Characterization Chang Liu [email protected] is esis is brought to you for free and open access by the Graduate School at Trace: Tennessee Research and Creative Exchange. It has been accepted for inclusion in Masters eses by an authorized administrator of Trace: Tennessee Research and Creative Exchange. For more information, please contact [email protected]. Recommended Citation Liu, Chang, "Mesophase Pitch-based Carbon Fiber and Its Composites: Preparation and Characterization. " Master's esis, University of Tennessee, 2010. hp://trace.tennessee.edu/utk_gradthes/816
description
artigo
Transcript of Mesophase Pitch-based Carbon Fiber and Its Composites- Preparati

University of Tennessee, KnoxvilleTrace: Tennessee Research and CreativeExchange
Masters Theses Graduate School
12-2010
Mesophase Pitch-based Carbon Fiber and ItsComposites: Preparation and CharacterizationChang [email protected]
This Thesis is brought to you for free and open access by the Graduate School at Trace: Tennessee Research and Creative Exchange. It has beenaccepted for inclusion in Masters Theses by an authorized administrator of Trace: Tennessee Research and Creative Exchange. For more information,please contact [email protected].
Recommended CitationLiu, Chang, "Mesophase Pitch-based Carbon Fiber and Its Composites: Preparation and Characterization. " Master's Thesis,University of Tennessee, 2010.http://trace.tennessee.edu/utk_gradthes/816

To the Graduate Council:
I am submitting herewith a thesis written by Chang Liu entitled "Mesophase Pitch-based Carbon Fiberand Its Composites: Preparation and Characterization." I have examined the final electronic copy of thisthesis for form and content and recommend that it be accepted in partial fulfillment of the requirementsfor the degree of Master of Science, with a major in Materials Science and Engineering.
Zhongren Yue, Major Professor
We have read this thesis and recommend its acceptance:
Ahmad Vakili, William H. Hofmeister
Accepted for the Council:Carolyn R. Hodges
Vice Provost and Dean of the Graduate School
(Original signatures are on file with official student records.)

To the Graduate Council: I am submitting herewith a thesis written by Chang Liu entitled “Mesophase Pitch-based Carbon Fiber and Its Composites: Preparation and Characterization.” I have examined the final electronic copy of this thesis for form and content and recommend that it be accepted in partial fulfillment of the requirements for the degree of Master of Science, with a major in Materials Science and Engineering. Zhongren Yue, Major Professor We have read this thesis and recommend its acceptance: Ahmad Vakili
William Hofmeister Accepted for the Council:
Carolyn R. Hodges Vice Provost and Dean of the Graduate School
(Original signatures are on file with official student records.)
Mesophase Pitch-based Carbon Fiber and Its Composites:
Preparation and Characterization
A Thesis
Presented for the
Masters of Science
Degree
The University of Tennessee, Knoxville
Chang Liu
December 2010

ii
DEDICATION
From the beginning of my UTSI experience I have received the kind help from
uncountable number of people. The thesis that is presented here is based on the
continuous effort of Dr.Yue, Dr.Vakili, and myself to research and to unlock the
knowledge behind the University of Tennessee Space Institute’s carbon fibers.
UTSI has given the opportunity to explore myself intellectually through the
teachings from highly qualified world-class professors in mechanical and material
science engineering programs. Without the challenges presented in class and in the lab
I would not be where I am today.

iii
ABSTRACT
The objective of this study is to investigate the relationship among process,
structure, and property of the UTSI pitch-based carbon fibers and optimize carbon
fiber’s mechanical properties through the stabilization process. Various analysis
techniques were employed throughout these investigations which include the Scanning
Electron Microscope (SEM), optical microscope, Dia-stron system, MTS, and ImageJ.
Several fiber process techniques including fiber spinning, stabilization, and
carbonization were explored to determine the effect of the thermal process on the fiber
yield, fiber diameter, the sheath-core structure of stabilized fibers, the pac-man and
hollow core structures of carbonized fibers, and the resulting mechanical properties of
the carbon fibers. It was found that stabilization time and the temperature stepping had
a great deal on influence on the resulting carbon fibers. Larger diameter fiber is easy to
form sheath-core structure in the stabilization process. Pac-man structure was
developed at 600°C during the carbonization. Both stabilization duration and the
carbonization temperature control the resulting carbon fiber diameter and fiber structure
defects such as the pac-man and hollow core defects. Multi-step stabilization can
reduce the total stabilization duration and improve the mechanical properties of the
resulting carbon fibers.
Fiber structure non-uniformities including fiber diameter distributions for a bundle
fiber or along a single fiber, and pac-man angles were determined. Statistical analysis
revealed the distribution of the carbon fiber cross-sectional areas and the result is
compared against commercial available carbon fibers.
Carbon fiber sandwiched composites (CFSCs) were fabricated with UTSI carbon
fiber and commercial PAN-based carbon fibers. Several configurations of sandwich
structured composites were explored to test the flexural properties with varying
sandwich thickness.
iv
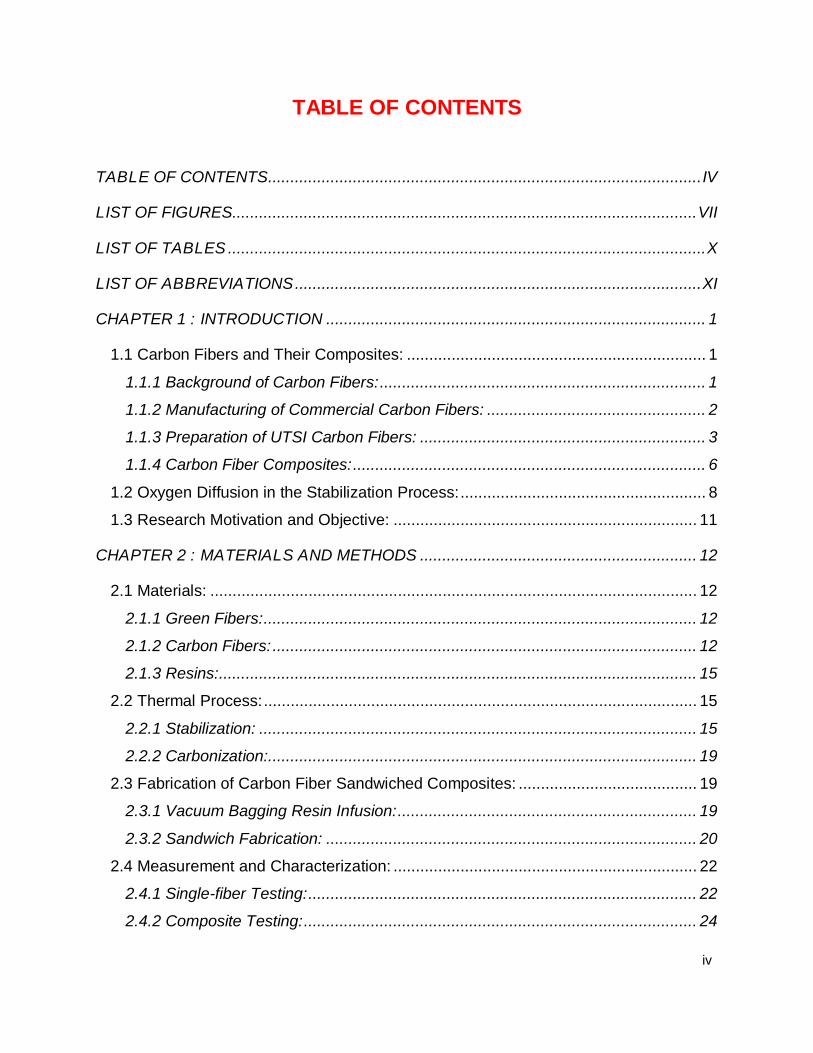
TABLE OF CONTENTS
TABLE OF CONTENTS ................................................................................................. IV
LIST OF FIGURES........................................................................................................ VII
LIST OF TABLES ........................................................................................................... X
LIST OF ABBREVIATIONS ........................................................................................... XI
CHAPTER 1 : INTRODUCTION ..................................................................................... 1
1.1 Carbon Fibers and Their Composites: ................................................................... 1
1.1.1 Background of Carbon Fibers: ......................................................................... 1
1.1.2 Manufacturing of Commercial Carbon Fibers: ................................................. 2
1.1.3 Preparation of UTSI Carbon Fibers: ................................................................ 3
1.1.4 Carbon Fiber Composites: ............................................................................... 6
1.2 Oxygen Diffusion in the Stabilization Process: ....................................................... 8
1.3 Research Motivation and Objective: .................................................................... 11
CHAPTER 2 : MATERIALS AND METHODS .............................................................. 12
2.1 Materials: ............................................................................................................. 12
2.1.1 Green Fibers: ................................................................................................. 12
2.1.2 Carbon Fibers: ............................................................................................... 12
2.1.3 Resins: ........................................................................................................... 15
2.2 Thermal Process: ................................................................................................. 15
2.2.1 Stabilization: .................................................................................................. 15
2.2.2 Carbonization:................................................................................................ 19
2.3 Fabrication of Carbon Fiber Sandwiched Composites: ........................................ 19
2.3.1 Vacuum Bagging Resin Infusion: ................................................................... 19
2.3.2 Sandwich Fabrication: ................................................................................... 20
2.4 Measurement and Characterization: .................................................................... 22
2.4.1 Single-fiber Testing: ....................................................................................... 22
2.4.2 Composite Testing: ........................................................................................ 24
v
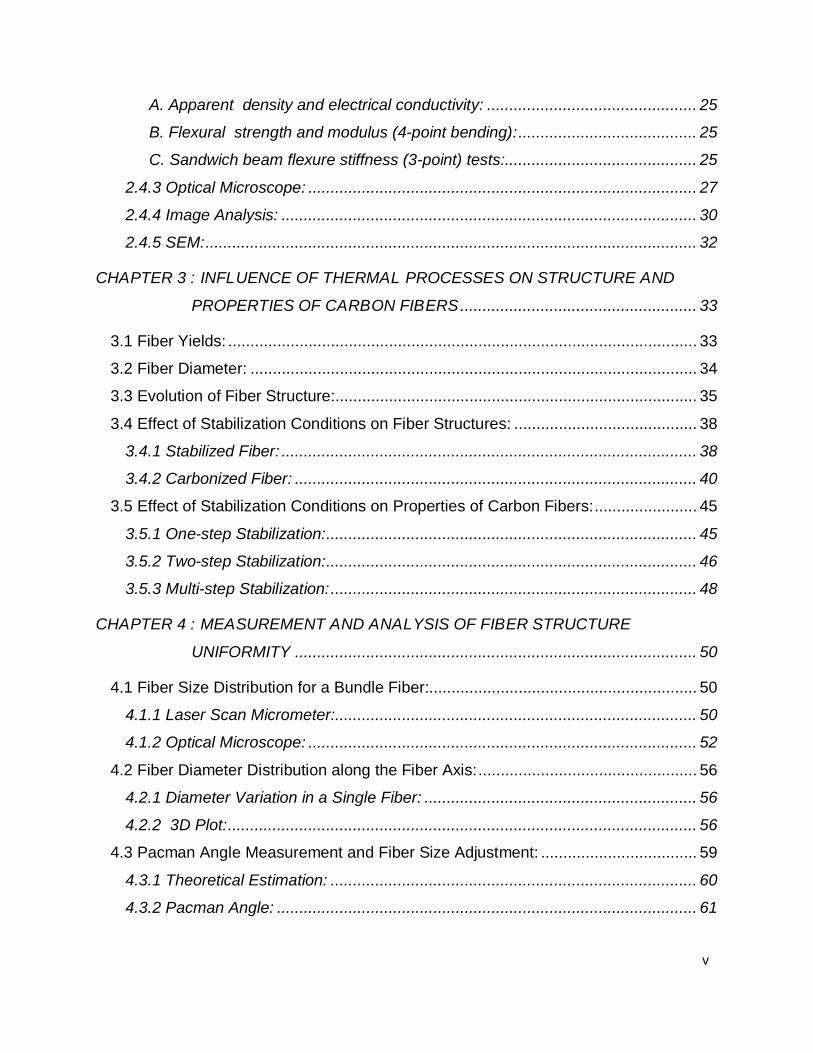
A. Apparent density and electrical conductivity: ............................................... 25
B. Flexural strength and modulus (4-point bending): ........................................ 25
C. Sandwich beam flexure stiffness (3-point) tests:........................................... 25
2.4.3 Optical Microscope: ....................................................................................... 27
2.4.4 Image Analysis: ............................................................................................. 30
2.4.5 SEM: .............................................................................................................. 32
CHAPTER 3 : INFLUENCE OF THERMAL PROCESSES ON STRUCTURE AND
PROPERTIES OF CARBON FIBERS ..................................................... 33
3.1 Fiber Yields: ......................................................................................................... 33
3.2 Fiber Diameter: .................................................................................................... 34
3.3 Evolution of Fiber Structure: ................................................................................. 35
3.4 Effect of Stabilization Conditions on Fiber Structures: ......................................... 38
3.4.1 Stabilized Fiber: ............................................................................................. 38
3.4.2 Carbonized Fiber: .......................................................................................... 40
3.5 Effect of Stabilization Conditions on Properties of Carbon Fibers: ....................... 45
3.5.1 One-step Stabilization: ................................................................................... 45
3.5.2 Two-step Stabilization: ................................................................................... 46
3.5.3 Multi-step Stabilization: .................................................................................. 48
CHAPTER 4 : MEASUREMENT AND ANALYSIS OF FIBER STRUCTURE
UNIFORMITY .......................................................................................... 50
4.1 Fiber Size Distribution for a Bundle Fiber:............................................................ 50
4.1.1 Laser Scan Micrometer: ................................................................................. 50
4.1.2 Optical Microscope: ....................................................................................... 52
4.2 Fiber Diameter Distribution along the Fiber Axis: ................................................. 56
4.2.1 Diameter Variation in a Single Fiber: ............................................................. 56
4.2.2 3D Plot: ......................................................................................................... 56
4.3 Pacman Angle Measurement and Fiber Size Adjustment: ................................... 59
4.3.1 Theoretical Estimation: .................................................................................. 60
4.3.2 Pacman Angle: .............................................................................................. 61
vi
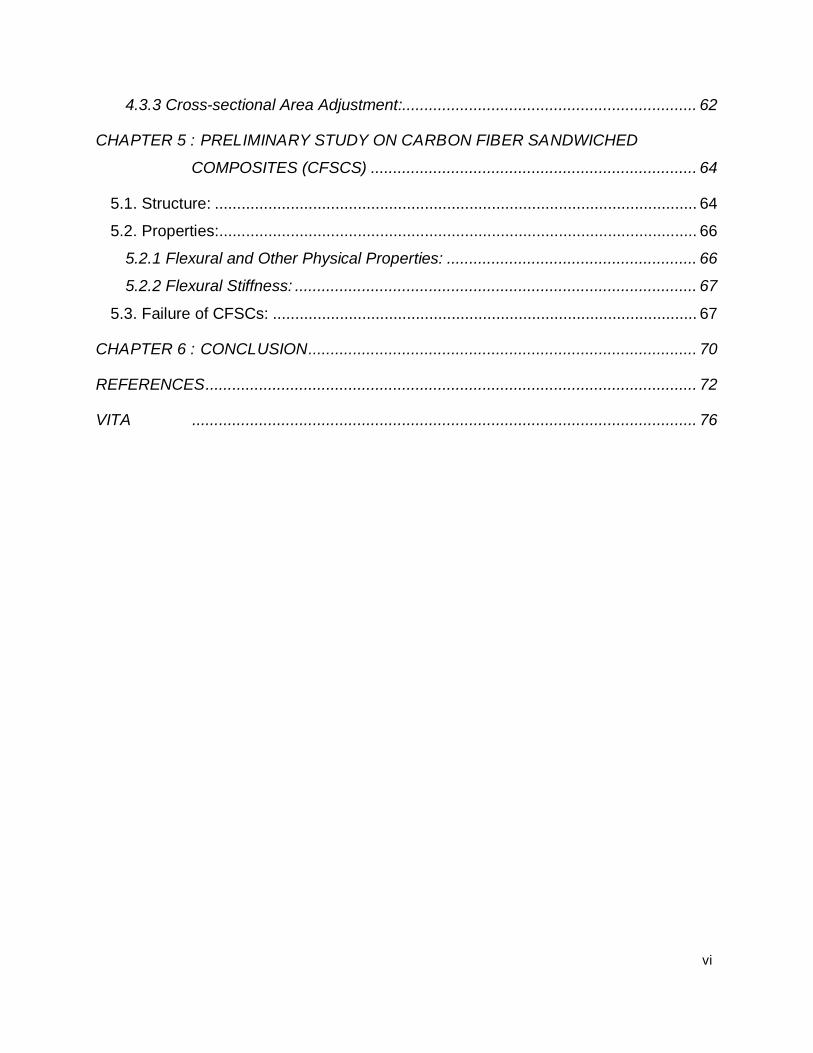
4.3.3 Cross-sectional Area Adjustment:.................................................................. 62
CHAPTER 5 : PRELIMINARY STUDY ON CARBON FIBER SANDWICHED
COMPOSITES (CFSCS) ......................................................................... 64
5.1. Structure: ............................................................................................................ 64
5.2. Properties: ........................................................................................................... 66
5.2.1 Flexural and Other Physical Properties: ........................................................ 66
5.2.2 Flexural Stiffness: .......................................................................................... 67
5.3. Failure of CFSCs: ............................................................................................... 67
CHAPTER 6 : CONCLUSION ....................................................................................... 70
REFERENCES .............................................................................................................. 72
VITA ................................................................................................................. 76
vii
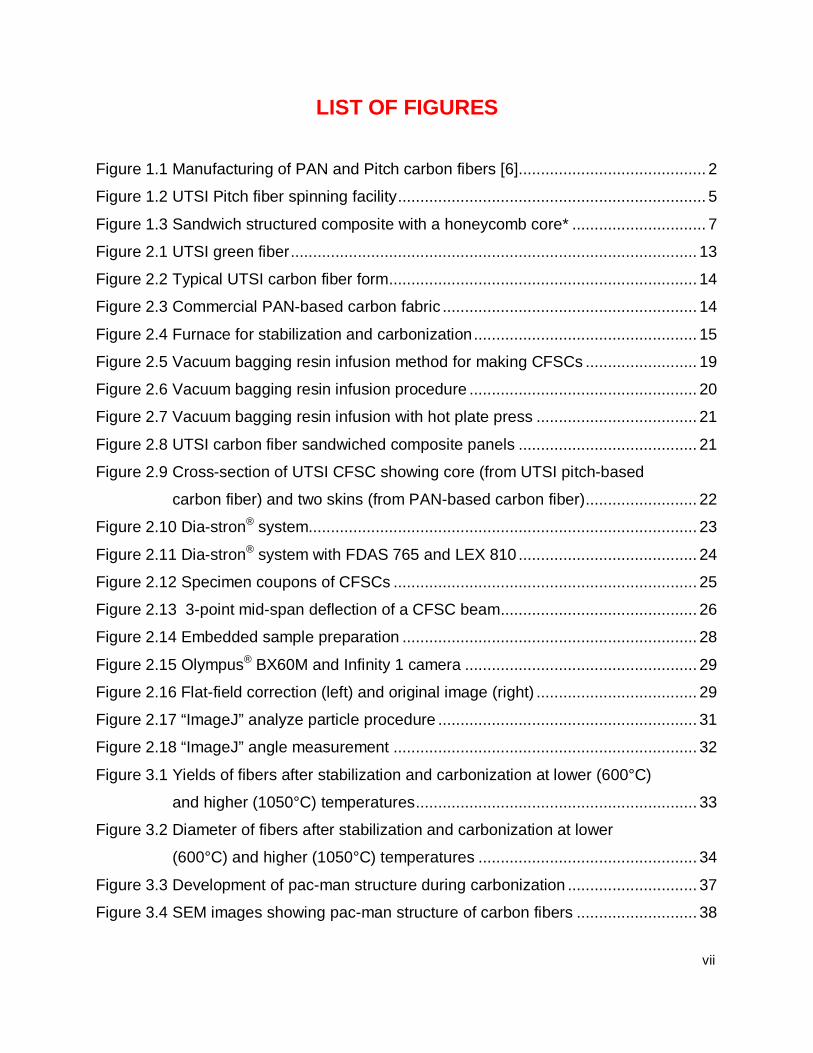
LIST OF FIGURES
Figure 1.1 Manufacturing of PAN and Pitch carbon fibers [6] .......................................... 2
Figure 1.2 UTSI Pitch fiber spinning facility ..................................................................... 5
Figure 1.3 Sandwich structured composite with a honeycomb core* .............................. 7
Figure 2.1 UTSI green fiber ........................................................................................... 13
Figure 2.2 Typical UTSI carbon fiber form ..................................................................... 14
Figure 2.3 Commercial PAN-based carbon fabric ......................................................... 14
Figure 2.4 Furnace for stabilization and carbonization .................................................. 15
Figure 2.5 Vacuum bagging resin infusion method for making CFSCs ......................... 19
Figure 2.6 Vacuum bagging resin infusion procedure ................................................... 20
Figure 2.7 Vacuum bagging resin infusion with hot plate press .................................... 21
Figure 2.8 UTSI carbon fiber sandwiched composite panels ........................................ 21
Figure 2.9 Cross-section of UTSI CFSC showing core (from UTSI pitch-based
carbon fiber) and two skins (from PAN-based carbon fiber) ......................... 22
Figure 2.10 Dia-stron® system....................................................................................... 23
Figure 2.11 Dia-stron® system with FDAS 765 and LEX 810 ........................................ 24
Figure 2.12 Specimen coupons of CFSCs .................................................................... 25
Figure 2.13 3-point mid-span deflection of a CFSC beam ............................................ 26
Figure 2.14 Embedded sample preparation .................................................................. 28
Figure 2.15 Olympus® BX60M and Infinity 1 camera .................................................... 29
Figure 2.16 Flat-field correction (left) and original image (right) .................................... 29
Figure 2.17 “ImageJ” analyze particle procedure .......................................................... 31
Figure 2.18 “ImageJ” angle measurement .................................................................... 32
Figure 3.1 Yields of fibers after stabilization and carbonization at lower (600°C)
and higher (1050°C) temperatures ............................................................... 33
Figure 3.2 Diameter of fibers after stabilization and carbonization at lower
(600°C) and higher (1050°C) temperatures ................................................. 34
Figure 3.3 Development of pac-man structure during carbonization ............................. 37
Figure 3.4 SEM images showing pac-man structure of carbon fibers ........................... 38
viii
Figure 3.5 Optical microscope images of stabilized (NS) fibers ................................... 39
Figure 3.6 Possible condition of embedded sample’s polished fibers ........................... 39
Figure 3.7. Optical (left) and SEM (right) micrographs of the hollow carbon fibers........ 44
Figure 3.8. Comparison between normal (NS) and long (LS) stabilization .................... 46
Figure 3.9. Normalized strength and modulus of carbon fibers as a function of
total stabilization time in two-step stabilization processes ............................ 47
Figure 3.10. Effect of Multi-step stabilization on normalized strength and modulus
of carbon fibers ............................................................................................ 49
Figure 4.1 Fiber diameter distribution (left) and mean diameter with stdev (right)
comparing four UTSI carbon fibers with commercial carbon fibers. ............. 51
Figure 4.2 Diameter (left) and cross-sectional area (right) measured with laser
scan micrometer comparing large diameter (40 LPM) carbon fibers
prepared with different stabilization methods ............................................... 52
Figure 4.3 Typical optical microscope images showing fiber cross-sectional
structure ....................................................................................................... 53
Figure 4.4 Cross-sectional area of carbon fibers (same as in Figure 4.2)
measured using optical microscope method ................................................ 54
Figure 4.5 Fiber cross-sectional area with deviation measured with optical
microscope method vs. carbonization temperatures .................................... 54
Figure 4.6 Fiber cross-sectional area (left) and diameter (right) distribution
histogram changing with carbonization temperatures .................................. 55
Figure 4.7 Typical graphs showing fiber diameter variation in commercial carbon
fibers ............................................................................................................ 57
Figure 4.8 Typical graphs showing fiber diameter variation in four UTSI’s carbon
fibers ............................................................................................................ 57
Figure 4.9 Typical ribbon graphs showing 3D structures of commercial carbon
fibers ............................................................................................................ 58
Figure 4.10 Typical ribbon graphs showing 3D structures of four UTSI’s carbon
fibers ............................................................................................................ 58
Figure 4.11 Typical ribbon graphs showing 3D structures of special carbon fibers ...... 59

ix
Figure 4.12 Example fiber cross-sectional area with a circular fiber (left) and a
octadecagon fiber (right) .............................................................................. 60
Figure 4.13 Pac-man angle vs. cross-sectional area.................................................... 61
Figure 4.14 Cross-sectional areas of laser, optical, and laser adjusted average ......... 63
Figure 4.15 Adjusted and laser error ............................................................................ 63
Figure 5.1 Structure problem in S0 (no core) composite .............................................. 66
Figure 5.2 Typical force-displacement curves recorded in a same support span
length ........................................................................................................... 68
Figure 5.3 Failure of CFSCs showing (A) testing in a long support span length;
(B), (C), and (D) testing in a short support span length, with increasing
beam deflection ............................................................................................ 69

x
LIST OF TABLES
Table 2.1 The typical UTSI carbon fiber used for the fabrication of composites ............ 13
Table 2.2 Parameters for stabilization and carbonization .............................................. 16
Table 3.1 Diameter of green fiber vs. carbon fibers....................................................... 36
Table 3.2 Sheath-core structure of 4S2 stabilized fibers vs. pac-man structures
of the resulting carbon fibers ........................................................................ 41
Table 3.3 Long time stabilization resulting in absence of sheath-core and pac-
man structures ............................................................................................. 42
Table 3.4 Very short time stabilization resulting in absence of sheath-core of the
stabilized fiber but presence of hollow carbon fiber ...................................... 43
Table 3.5 Proposed mechanism of the formation of sheath-core, pac-man, and
hollow structures depending on the stabilization conditions ......................... 44
Table 5.1 Structures of the CFSCs and the content of UTSI-CF ................................... 65
Table 5.2 Physical and flexural properties of the CFSCs .............................................. 67
Table 5.3 Flexural stiffness, transverse shear rigidity, and the core shear
modulus of carbon fiber sandwiched composites ......................................... 68

xi
LIST OF ABBREVIATIONS
2S (2,3,4,5)
4S2
8S2
CF
Two(2) step stabilization in (2,3,4,5) hours
Four (4) step stabilization in two hours
Eight (8) step stabilization in two hours
Carbon fiber
CFSC Carbon fiber Sandwich Composite
HB High bias stabilization
HPCF High performance carbon fiber
LB Low bias stabilization
LPM Liters per minute
LS Long stabilization
NS
PAN
SS
SSC
Normal stabilization
Polyacrylonitrile
Short stabilization
Sandwich Structured Composite

1
Chapter 1: Introduction
1.1 Carbon Fibers and Their Composites:
1.1.1 Background of Carbon Fibers:
The origins of carbon fibers can be dated back to the days of Thomas Edison in
1880 [1]. It was around this time that Edison explored various ways to make filaments
for the light bulb and unfortunately the carbon fibers he formed were insufficient for this
particular task as they only had a lifetime of 40 hours. Much of history and the credit of
inventions or new findings are up for debate and this can also be seen with the use of
carbon fibers in light bulbs. In 1850, Joseph Wilson Swan started to use carbonized
paper filaments to make the incandescent light bulb and he succeeded in 1878 to be the
first person to invent a practical incandescent bulb that lasted 13.5 hours. The particular
filament used by Swan’s 1878 invention was derived from cotton [2].
After World War II the USAF undertook major efforts to become the best Air
Force in the world. One of the initiatives was to develop state-of-the-art jet fighter
planes. There are only two ways to improve the performance, in terms of acceleration
and velocity, of any air or ground vehicle. The vehicle can either have a more powerful
engine to generate more power or weight must be shed off the vehicle so that the
power-to-weight ratio of the vehicle improves. Carbon fibers were explored by the USAF
to be used in jet fighters as a way to reduce weight while still maintaining the chassis
strength. Today majority of the fighters in the world utilize carbon fiber composites in
their construction. USAF’s F-22 airframe being 50% composite by weight [3], has over
350 carbon/epoxy parts and about a third (1/3) of the F-35 Joint Strike Fighter is made
with carbon and glass fibers [4].
Utilization of carbon fibers is not only limited to Military applications as Civilian
commercial industry plays a huge role in driving up the demand for carbon fibers in
recent decades. Airbus is the second largest customer, after the Military, of commercial
carbon fibers with its recent Super jumbo A380 and A350 made with great portions of
carbon fibers. The third largest buyer is Boeing with the creation of its 787 Dreamliner

2
that contains about 50% carbon fiber [4]. The 787 is so fuel efficient that it can fly
straight from England to Australia without stopping to refuel.
Top three buyers of carbon fiber utilize High Performance Carbon Fiber (HPCF).
Carbon fibers are not limited to high performance applications and its use can also be
found in Golf Clubs, Tennis Rackets, Laptop casing, and in many more regular
commercial products. Widespread use of carbon fibers for vast applications is limited
due to its high cost.
1.1.2 Manufacturing of Commercial Carbon Fibers:
The typical steps for manufacturing of commercial carbon fibers are shown in
Figure 1.1. High cost of carbon fibers can mainly be attributed to the precursor [5].
Carbon fibers made from Polyacrylonitrile (PAN) precursor consists of 90% of the
carbon fibers manufactured today.
Figure 1.1 Manufacturing of PAN and Pitch carbon fibers [6]

3
PAN-based carbon fibers is expensive due to the high cost of PAN precursor and
fiber spinning process, and the other manufacturing process involved in order to contain
HPCF. Manufacturing of HPCF PAN fibers involves wet/dry melt spinning techniques
that requires a costly wet chemical bath and a relatively long stabilization time. The
search for a lower cost precursor for HPCF has led to the development of pitch-based
carbon fibers.
Pitch-based carbon fibers can be manufactured in a similar process as PAN
fibers. Pitch can be spun to fiber through melt spinning process which with costs
relatively lower than wet/dry spinning. In melt spinning process the precursor is first
heated until it exists in a liquid form and then it is pushed out from a spinneret. As the
fiber comes out from the spinneret it is stretched and pulled to greatly reduce the fiber
diameter to a desired value, meanwhile increase molecular orientation along the fiber
axis and reduce the voids inside the fiber which result in higher strength and modulus.
After the fibers are formed it undergoes stabilization where the fibers are oxidized
in air to introduce oxygen-containing groups while undergoing cross-linking. The
stabilization process prevents the fiber from melting (fusion) again at higher
temperatures. After that, Carbonization and graphitization follows stabilization and
carries the process of aromatization and shedding non-carbon content to form a
turbostratic graphite crystalline structure carbon fiber.
The primary advantage of pitch-based fibers is the high modulus as compared to
PAN fibers. A high modulus fiber has many applications where the structure calls for
high stiffness such as competitive Golf Clubs where ultrahigh modulus fibers provides
better damping properties.
1.1.3 Preparation of UTSI Carbon Fibers:
Solvated mesophase pitch-based carbon fibers were first manufactured by
Conoco-Philips using the melt blown technique. This research endeavor was passed
onto UTSI via a donation by Conoco-Philips along with the spinning equipment and
solvated mesophase pitch in 2004. The University of Tennessee Space Institute (UTSI)
continues the development and application of such carbon fibers.
bibi
Highlight

4
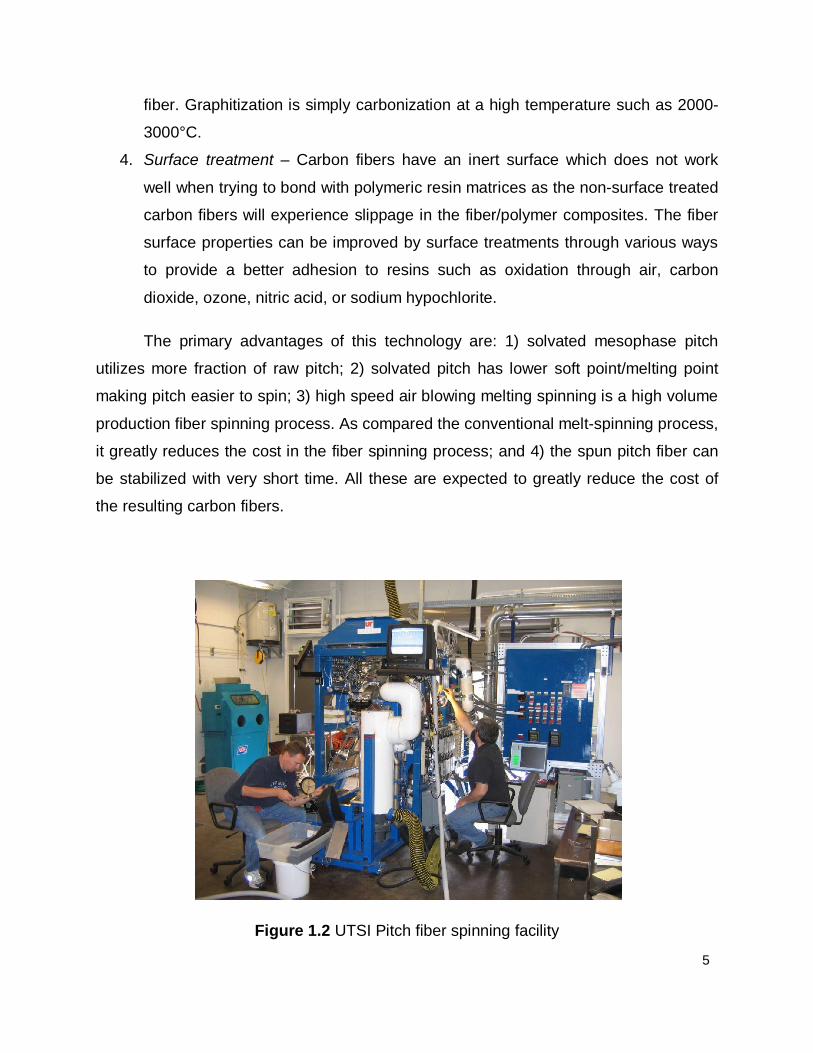
The UTSI spinning process is shown in Figure 1.2. Mesophase pitch precursor is
heated until it melts in a closed system and then press through the spinneret. An air
stream blows the melted precursor from the spinneret to form continuous long fibers
that are collected as fiber tape (or non-woven mat).
The spun fibers (green fiber) are then thermally treated in a batch process.
Green fiber are first dried to remove solvents and then oxidized in air to stabilize the
green fiber. After stabilization the fiber undergoes carbonization at high temperature in
an inert gas in a furnace.
The Preparation process of the UTSI carbon fiber can be simply described as
follows [7-8]:
1. Spinning –Solvated mesophase pitch precursor is melted down into a liquid form
and then sprayed out of spinning jets to form green or non-stabilized fibers.
UTSI’s spinning process is done by melt-blowing where the melted pitch is
sprayed out of a spinneret jet and then drawn by blown hot air. During this
process the fiber is drawn and stretched to maintain certain tension in the fiber so
that the resulting fiber can have better molecular alignment along the fiber axis
and a smaller diameter.
2. Stabilization – The green fiber, thermoplastic or non-stabilized fiber, requires dry
oxidation to remove solvents from pitch and allow oxygen to diffuse into the fiber
and strengthen the bonds through cross-linking so that it becomes thermally
stabilized or thermoset. This process is done by subjecting the green fibers to
temperatures from 150-400°C in air with varying temperature gradients and
durations. If possible, tension could be applied and kept throughout stabilization
to ensure better fiber axis alignment of molecules.
3. Carbonization/graphitization – This step follows stabilization or thermosetting
where the stabilized fibers are heated between 1000-3000°C in an inert
environment with either nitrogen (<1600oC) or argon gas for a short duration.
During carbonization all non-carbon elements are removed from the fiber, the
fiber undergoes further cross-linking, and then resulting fiber becomes a carbon
5
fiber. Graphitization is simply carbonization at a high temperature such as 2000-
3000°C.
4. Surface treatment – Carbon fibers have an inert surface which does not work
well when trying to bond with polymeric resin matrices as the non-surface treated
carbon fibers will experience slippage in the fiber/polymer composites. The fiber
surface properties can be improved by surface treatments through various ways
to provide a better adhesion to resins such as oxidation through air, carbon
dioxide, ozone, nitric acid, or sodium hypochlorite.
The primary advantages of this technology are: 1) solvated mesophase pitch
utilizes more fraction of raw pitch; 2) solvated pitch has lower soft point/melting point
making pitch easier to spin; 3) high speed air blowing melting spinning is a high volume
production fiber spinning process. As compared the conventional melt-spinning process,
it greatly reduces the cost in the fiber spinning process; and 4) the spun pitch fiber can
be stabilized with very short time. All these are expected to greatly reduce the cost of
the resulting carbon fibers.
Figure 1.2 UTSI Pitch fiber spinning facility
6
However, there are problems with this novel fiber process that need to be
addressed. The expression “There is no free lunch” describes the shortcomings of pitch-
based carbon fibers as the melt-blowing process, with the micro vortices and
turbulence, produces fibers that are kinky. One of the most important criteria for carbon
fiber strength and modulus is the fiber alignment that is lacking in the UTSI produced
pitch-based fibers.
1.1.4 Carbon Fiber Composites:
Carbon fibers primarily used in composites with a lightweight matrix. Carbon fiber
composites are ideally suited to applications where strength, stiffness, lower weight, and
outstanding fatigue characteristics are critical requirements. They also can be used in
the occasion where high temperature durability, chemical inertness and high damping
are important. The primary advantage of carbon fiber composites is in the high specific
tensile strength and modulus as compared to steel and aluminum.
Many different carbon fiber composites are available in the markets and
researches. These include polymer matrix composites, metal matrix composites,
ceramic matrix composites, concrete matrix composites, and C/C composites [9]. The
carbon fiber composites could be divided into fiber reinforced (short fiber and
continuous fiber) and structural (laminar and sandwich) composites. Many technologies
have been used to fabricate carbon fiber composites, including, contact molding,
compression molding, vacuum molding, resin injection molding, filament winding, and
pre-preg production processes [10].
A sandwich structured composite (Figure 1.3) is usually fabricated by attaching
two thin but stiff skins to a lightweight but thick core. The core material is normally low
strength material, but its higher thickness provides the sandwich composite with high
bending stiffness with overall low density. In a composite sandwich structure, the core is
responsible for separating and fixing the skins, resisting transverse shear, and providing
other functionalities like absorbing impact energy, shielding radiation, and insulating
heat transfer [11].

7
Figure 1.3 Sandwich structured composite with a honeycomb core*
*http://en.wikipedia.org/wiki/Sandwich_structured_composite
Sandwich structured composites have been widely used in satellites, aerospace
structures, ship building, automobiles, rail cars, wind energy systems, bridge
construction, and infrastructure due to their light weight and high strength to weight
ratio. In the case of ground transportation, sandwich components have been
successfully introduced to several applications such as roof panels in train and in bus
structures, front cabins of high-speed locomotives, and interior panels. Minimizing the
weight of a structure is becoming a common key design objective as it allows many
options such as higher speed, longer range, larger payloads, less engine power and
better operating economy.
8
1.2 Oxygen Diffusion in the Stabilization Process:
Diffusion of oxygen into pitch during the stabilization step is crucial for the
prevention of fibers adhering to one another due to partial oxidation as well as
producing desirable resulting mechanical properties of carbon fibers [12]. Control
parameters in the diffusion process consist of stabilization time, heating rate,
temperature, and pressure [13].
Stabilization requires the diffusion of oxygen into the green fiber, expulsion of
trapped gases or possible solvents, and the cross-linking oxidative reaction to form a
stabilized fiber. Oxidative reactions for pitch based green fibers start approximately
beyond 180°C [14]. Rapid heating rates or short stabilization times can lead to the
formation of sheath-core structures in both small diameter (10 µm) and large diameter
(100 µm) fibers [12, 15]. Smaller fibers such as those of 10 µm in diameter are less
affected by the oxidative reactions as compared to fibers of 100 µm in diameter [15].
The primary reason is that a thicker diameter requires more time for complete oxygen
diffusion and the oxidative reactions occur from the outer layer to the core. Since the
oxidative reaction lags behind the diffusion process the outer layers start to become
fully oxidized while oxygen diffuses to the inner core. The ever more oxidized outer
layers forms a sheath thereby restricting and preventing the diffusion of oxygen into the
inner core forming the sheath-core structure.
Micro-thermal analysis done on 100 µm diameter mesophase pitch based fiber
by Blanco, C., Lu, S., Appleyard, S.P., and Rand, B reveals that greater oxidation depth
can be obtained with a greater stabilization time, 25 hours vs. 5 hours, for the same
given stabilization temperature of 180°C [15]. Oxygen profiles obtained from the Micro-
thermal analysis experiment shows that a more complete oxidation of the inner core and
uniform oxidation of the entire fiber can be obtained at a lower stabilization temperature
of 160°C vs. 200°C for the same stabilization time of 25 hours [15].
A similar study was conducted by Matsumoto, T., and Mochida, I. using tunneling
Secondary Ion Mass Spectrometry (SIMS) and Elemental Analyzer on 10 µm diameter
mesophase pitch obtained similar results. SIMS profile of the ratio of O16/C12 reveals
that 350°C is optimal stabilization temperature for the given heating rate of 0.5°C/min

9
[12]. This optimal temperature is different from the optimal uniform stabilization
temperature of 160°C as found in the Micro-thermal analysis experiment [15]. The
reason for this difference is that diffusion is not a major issue for a 10 µm fiber as
compared to a 100 µm fiber where there exists less “layers” of semi-oxidized for fresh
oxygen to fight through in order to penetrate to the fiber core. A quick stabilization
forming a sheath core structure in a 100 µm diameter fiber with a 5 µm thick sheath will
give the 10 µm fiber a complete oxidation because the sum of the penetration depth
(sheath layer) from both sides is the total diameter for the 10 µm fiber. However, when
the heating rate is changed from 0.5°C/min to 5.0°C/min higher temperature (300°C)
stabilization proved to be less effective than lower temperature (230°C) stabilization for
obtaining a uniform distribution of oxygen content within the fiber due to the formation of
a sheath-core structure on the outer layers [12].
Successful attempts have been made to model diffusion of oxygen to pitch based
fibers during stabilization. One study by Singer, L.S., and Mitchell, S. utilized electron
paramagnetic resonance (EPR) to study the oxygen uptake by isotropic and mesophase
pitch fibers from -50°C to 150°C and modeled the behavior with partial differential
equations (PDEs) [14]. The dimensionless parameters of the partial differential equation
(PDE) are diffusion rate, diffusion time, radius of fiber, and oxygen concentration with
the assumption of isothermal conditions and constant barrier opposing oxygen diffusion
or the non-formation of sheath-core structures throughout the stabilization process. The
output of this PDE model was validated against previous findings literature and the
results are consistent with other experimental findings [14]. Results from the model
showed that a 10-fold increase in fiber diameter increases the fiber oxygen saturation
time by nearly twice and a 100-fold increase in fiber diameter increases the fiber oxygen
saturation time by nearly three times for the given fiber oxygen saturation levels of 50%
and 90% [14]. This model can only be utilized for diffusion reactions of non-solvated
isotropic and mesophase pitch for temperatures below 180-200°C because it assumes
a constant barrier opposing oxygen diffusion. For temperatures above the 180°C the
formation of sheath-core structures or a dynamic barrier opposing oxygen diffusion
would make this a non-linear partial differential equation which involves a more rigorous
mathematical treatment to find possible solutions. The addition of solvents in
10
mesophase pitch would also add to the difficulty of this type of PDE model as there are
gases leaving the fiber during the oxygen diffusion into the fiber.
Another example of a model is in the study conducted by Liedtke, V., and
Huttinger, K.J. on mesophase pitch fibers with X-ray photoelectron spectroscopy (XPS)
and temperature-programmed desorption of surface functional groups (TPD). This
experiment dealt with non-surface oxidized and surface-oxidized HT carbon fibers as
well as mesogenic and mesophase pitch fibers. Control parameters were oxygen
pressure (up to 2 MPa), temperature (160°C-200°C), and stabilization time (up to 36
hours). The diffusion model was based on Fick’s 2nd law of diffusion where the fiber
mass change during stabilization varied directly with the stabilization time for a given
constant temperature [13]. Influence of oxygen pressure followed a power law where
the fiber mass change during stabilization varied directly with the oxygen pressure
raised to a pitch-specific exponential factor. Optimal fiber oxygen uptake was found to
occur with 200°C and 1 MPa of oxygen pressure [13]. This study also circumvented the
issue of sheath-core formation by purposefully maintaining a stabilization temperature
no higher than 200°C to keep the stabilization process as diffusion controlled process
rather than a reaction or oxidative controlled process. In a continuous industrial
production process for low-cost carbon fibers it is very difficult and costly to perform
stabilization around 1 MPa (~10 atm).
From the studies above it can be concluded that the fiber diameter dictates the
optimal stabilization temperature and time. Larger diameter fibers are more prone to
formation of sheath-core structures if the stabilization temperature goes well above
200°C before having significant oxygen saturation to the fiber core. A slower heating
rate is ideal for obtaining a more uniformly stabilized fiber at the expense of having a
much longer stabilization time. The diffusion process can be modeled in simplified
conditions where the temperature is kept below 200°C threshold of sheath-core
formation. The addition of pressure to stabilization allows for a more thorough oxidation
of the fiber core but it is entirely impractical in a mass-production setting. The results in
the literatures presented above on low temperature stabilization and slow heating rate
along with inspirations from other literary sources play a crucial role in the pursuit of an
optimal heating profile for UTSI’s pitch-based carbon fibers.
11
1.3 Research Motivation and Objective:
The development of a domestic, low-cost carbon fiber composite industry is a
strategic national priority that could have significant impact on the energy use of various
sectors of the U.S. economy [16]. Being able to use lower cost precursors, produced in
high volume, is a critical step toward lower cost carbon fiber composites for use in
multiple industries.
Potential low-cost carbon fiber has been produced in our laboratory at the UTSI
by using solvated mesophase pitch as precursor, a new-patented high-speed melt
blown process to spin pitch fibers [17]. The prepared carbon fiber shows promising
characteristic including small diameter (~7 µm), high electrical conductivity, and the
appropriate mechanical properties. The carbon fiber was also fabricated to composites
with different polymer resins. The composites show reasonable mechanical and
physical properties.
However, since the UTSI carbon fiber process is different from the conventional
carbon fiber process and utilizes special precursor and spinning method, the
fundamental study on such novel carbon fibers is lacking. Few research papers have
been published relating to the carbon fibers made from solvated mesophase pitch spun
using melt blowing method. To further improve the properties of UTSI carbon fiber and
its composites, and to reduce the process cost a fundamental study is critically needed.
It is well known that the structural uniformity of carbon fibers is very important in
understanding the properties of fibers and the processing related issues to improve the
fiber and fiber composite’s quality and the performance. Therefore, the objective of this
study is to:
• Investigate the effect of fiber spinning and thermal processes on
fiber structure.
• Understand the relationship among stabilization conditions,
structures, and properties.
• Examine and characterize the fiber diameter and structure
uniformity.
• Test a new approach to the fabrication of carbon fiber composites.
12
Chapter 2: Materials and Methods
2.1 Materials:
2.1.1 Green Fibers:
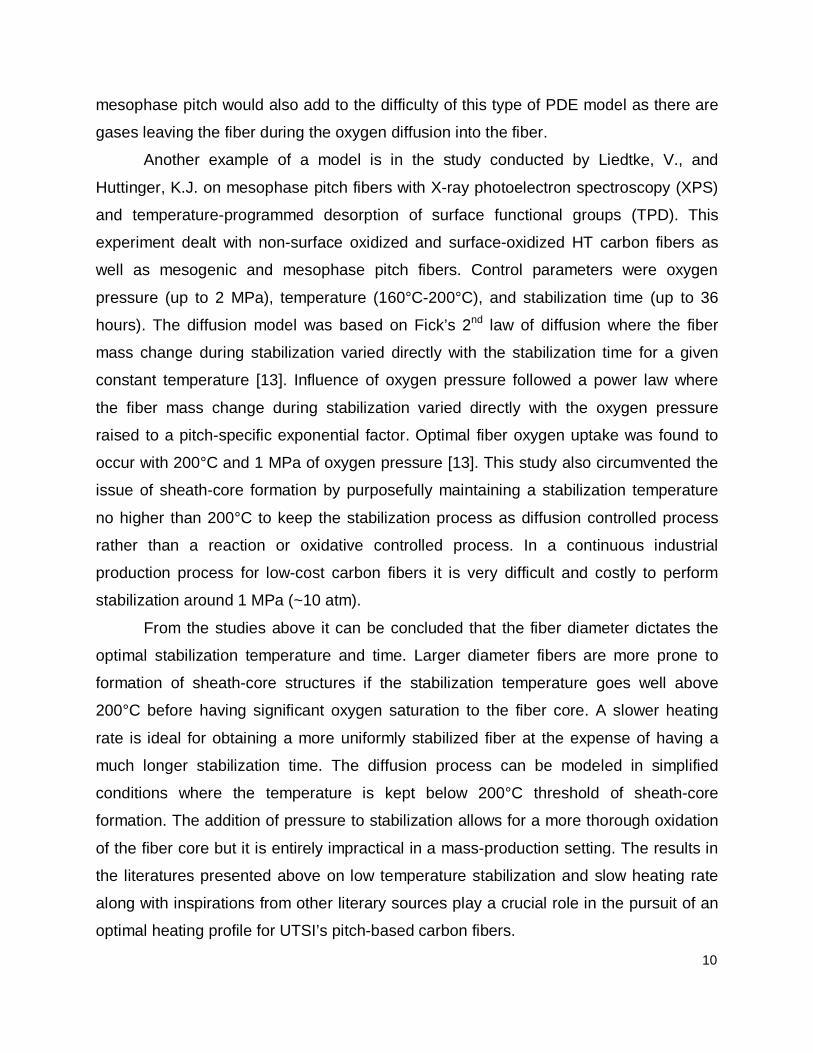
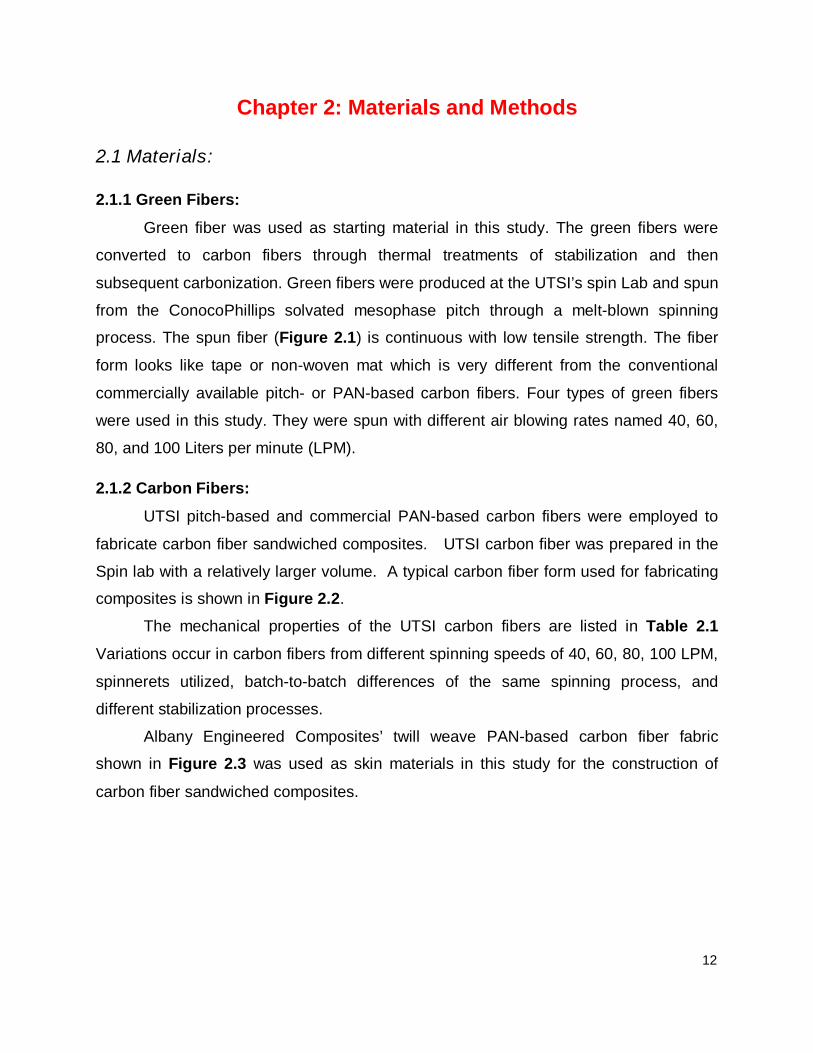
Green fiber was used as starting material in this study. The green fibers were
converted to carbon fibers through thermal treatments of stabilization and then
subsequent carbonization. Green fibers were produced at the UTSI’s spin Lab and spun
from the ConocoPhillips solvated mesophase pitch through a melt-blown spinning
process. The spun fiber (Figure 2.1) is continuous with low tensile strength. The fiber
form looks like tape or non-woven mat which is very different from the conventional
commercially available pitch- or PAN-based carbon fibers. Four types of green fibers
were used in this study. They were spun with different air blowing rates named 40, 60,
80, and 100 Liters per minute (LPM).
2.1.2 Carbon Fibers:
UTSI pitch-based and commercial PAN-based carbon fibers were employed to
fabricate carbon fiber sandwiched composites. UTSI carbon fiber was prepared in the
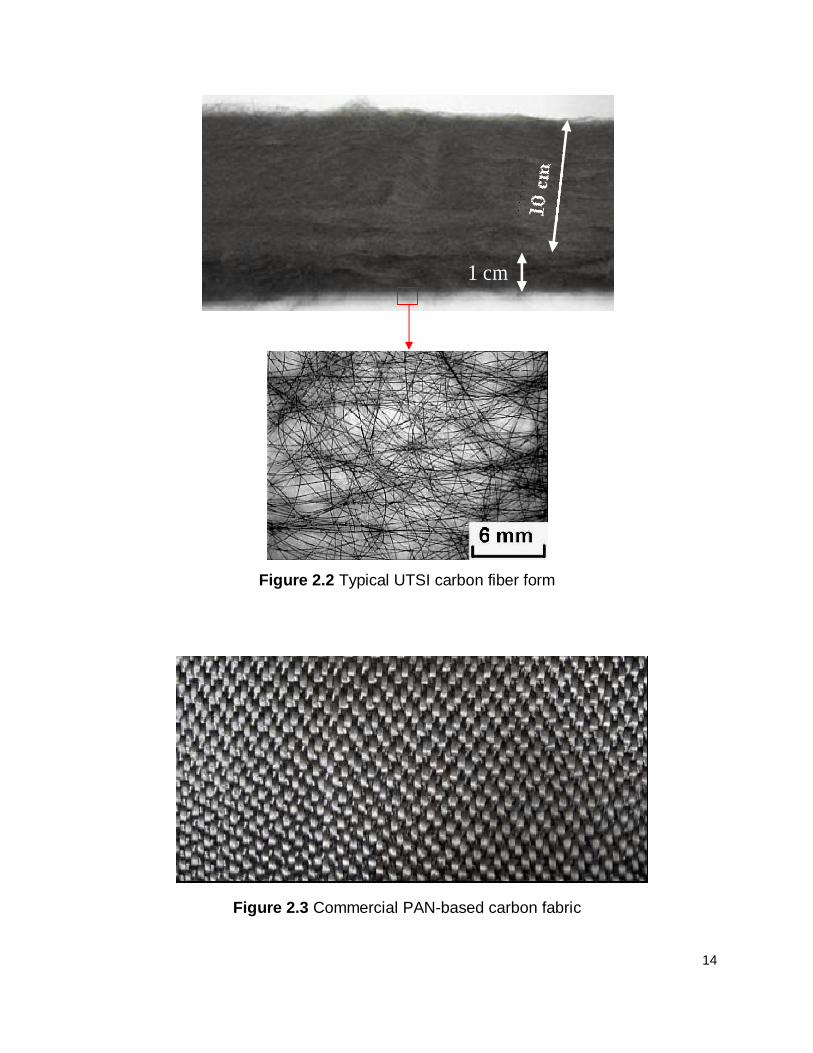
Spin lab with a relatively larger volume. A typical carbon fiber form used for fabricating
composites is shown in Figure 2.2.
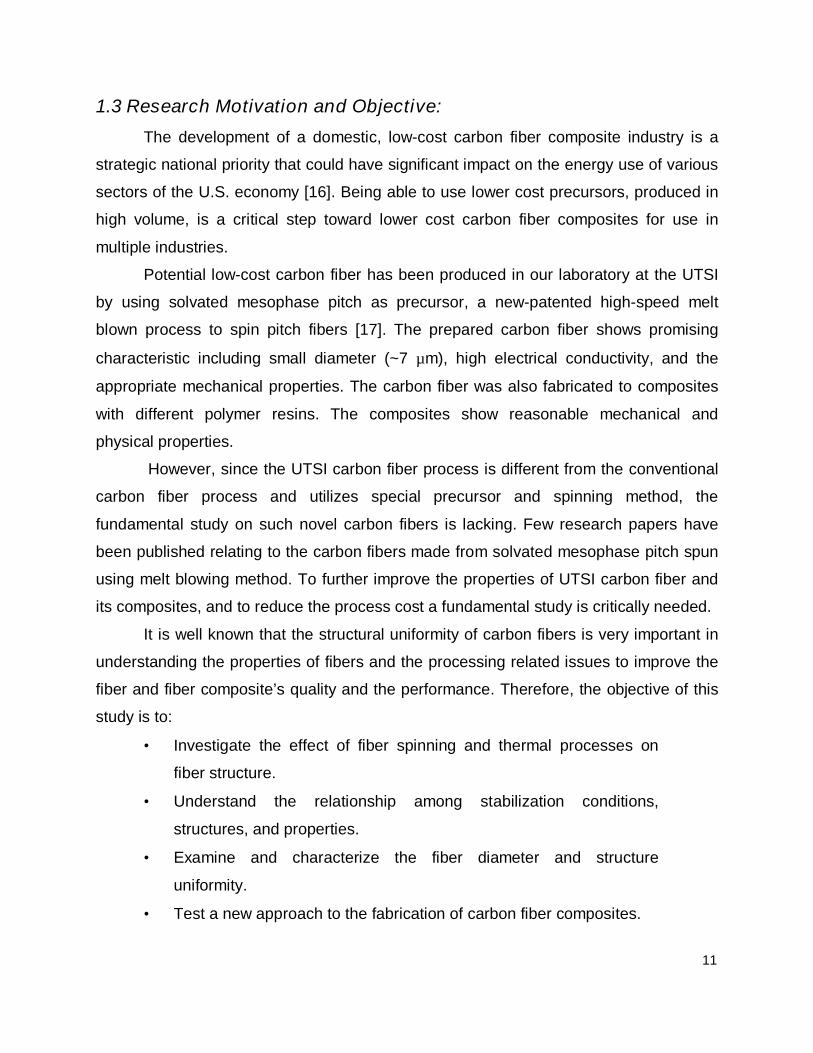
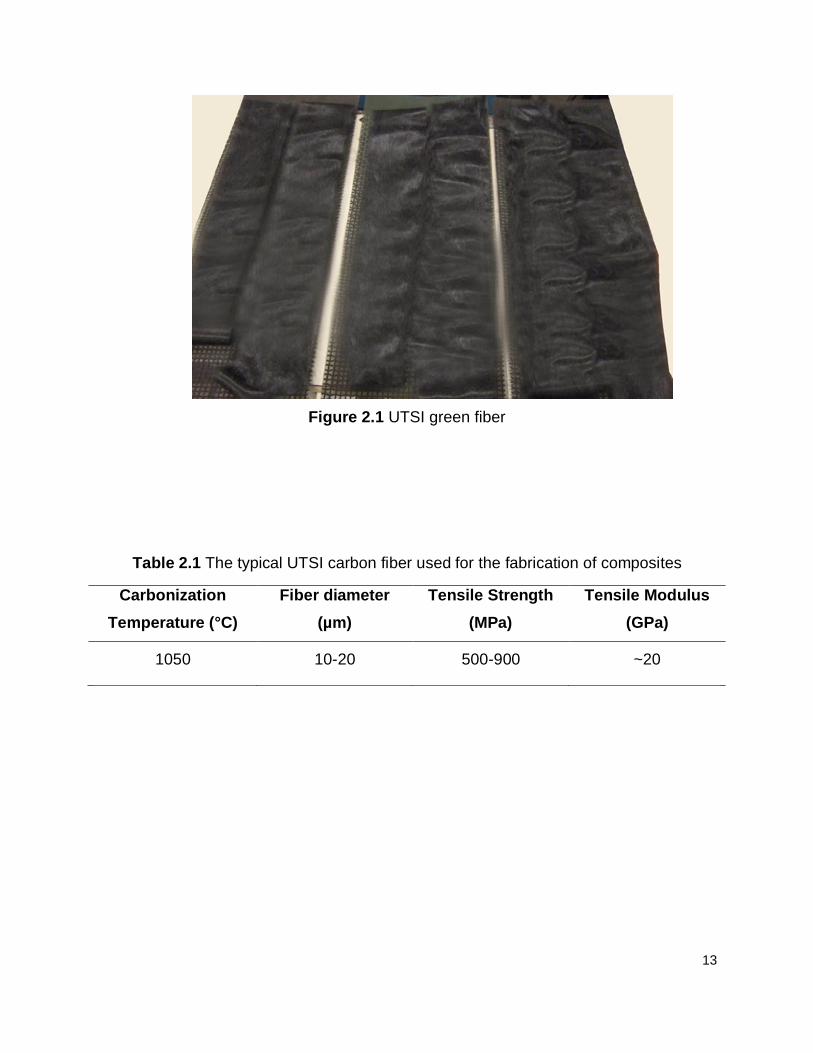
The mechanical properties of the UTSI carbon fibers are listed in Table 2.1
Variations occur in carbon fibers from different spinning speeds of 40, 60, 80, 100 LPM,
spinnerets utilized, batch-to-batch differences of the same spinning process, and
different stabilization processes.
Albany Engineered Composites’ twill weave PAN-based carbon fiber fabric
shown in Figure 2.3 was used as skin materials in this study for the construction of
carbon fiber sandwiched composites.
13
Figure 2.1 UTSI green fiber
Table 2.1 The typical UTSI carbon fiber used for the fabrication of composites
Carbonization
Temperature (°C)
Fiber diameter
(µm)
Tensile Strength
(MPa)
Tensile Modulus
(GPa)
1050 10-20 500-900 ~20
14
Figure 2.2 Typical UTSI carbon fiber form
Figure 2.3 Commercial PAN-based carbon fabric
1 cm

15
2.1.3 Resins:
West System Epoxy 105 and Hardener 206 were used throughout the research
process in making embedded samples for Optical microscope analysis as well as
fabrication of carbon fiber composites.
2.2 Thermal Process:
2.2.1 Stabilization:
Various stabilization methods were employed to determine if stabilization had
any impact on the micro-structure and tensile strength and modulus of the resulting
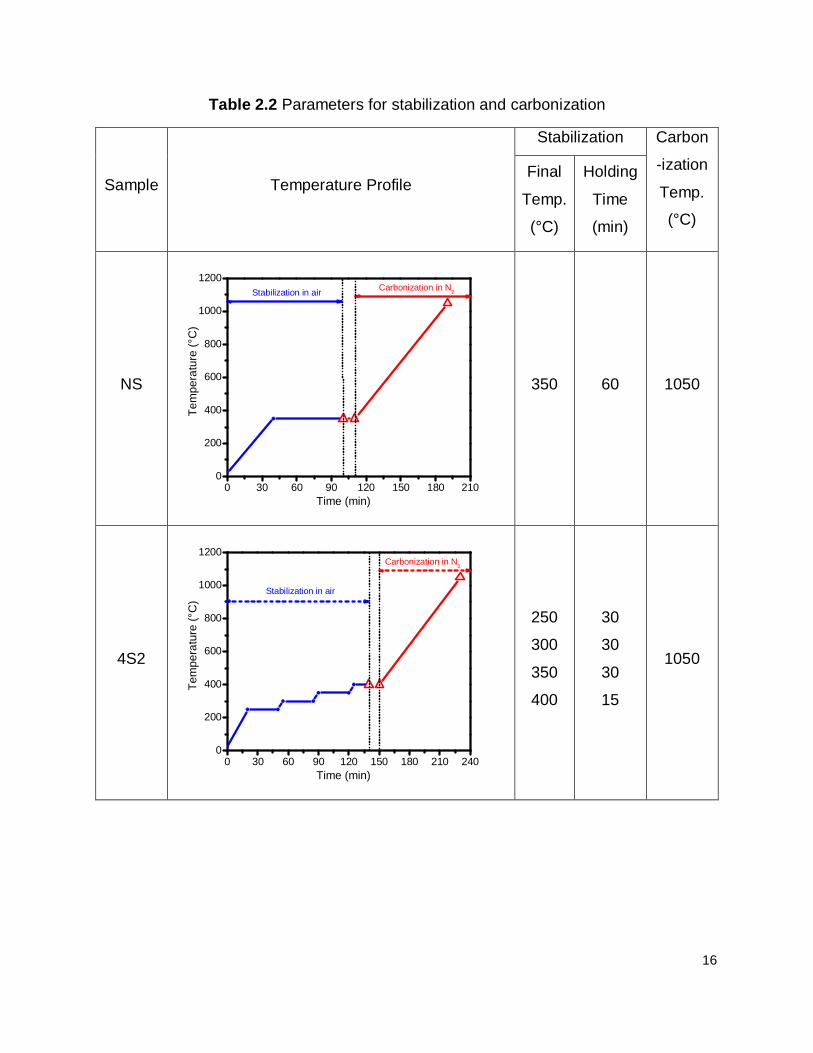
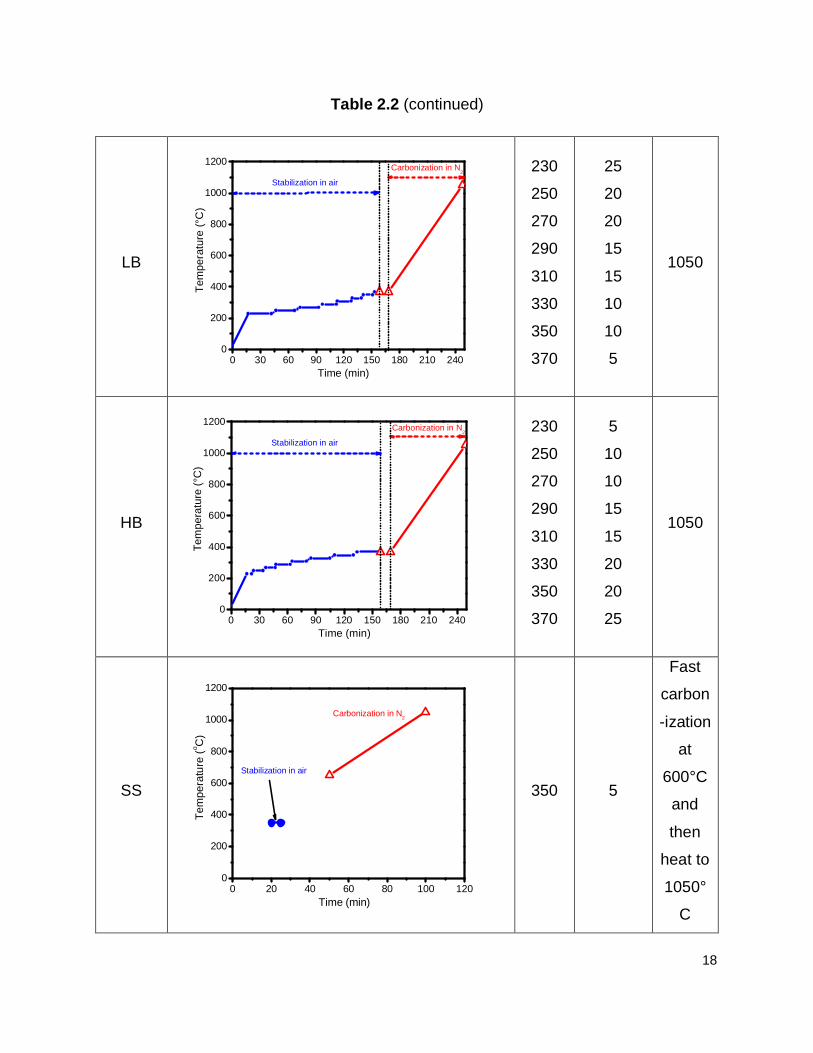
carbon fiber. Table 2.2 represents the various profiles explored with stabilization and
carbonization parameters. For instance the initial stabilization method, normal
stabilization (NS), consists of heating the tube furnace (Figure 2.1) to 350°C and
holding the green fiber at that temperature for 60 minutes. Compressed air was used for
the stabilization process for all stabilization methods explored.
Figure 2.4 Furnace for stabilization and carbonization
16
Table 2.2 Parameters for stabilization and carbonization
Sample Temperature Profile
Stabilization Carbon
-ization
Temp.
(°C)
Final
Temp.
(°C)
Holding
Time
(min)
NS
0 30 60 90 120 150 180 2100
200
400
600
800
1000
1200Carbonization in N
2
Te
mp
era
ture
(°C
)
Time (min)
Stabilization in air
350 60 1050
4S2
0 30 60 90 120 150 180 210 2400
200
400
600
800
1000
1200Carbonization in N
2
Te
mp
era
ture
(°C
)
Time (min)
Stabilization in air
250
300
350
400
30
30
30
15
1050

17
Table 2.2 (continued)
LS
0 50 100 150 200 250 300 350 400 450 5000
200
400
600
800
1000
1200Carbonization in N
2
Tem
pe
ratu
re (
°C)
Time (min)
Stabilization in air
350 360 1050
2S2
2S3
2S4
2S5
0 30 60 90 120 150 180 210 2400
200
400
600
800
1000
1200Carbonization in N
2
Te
mpera
ture
(°C
)
Time (min)
Stabilization in air
275
375
60,60
90,90
120,120
150,150
1050
8S2
0 30 60 90 120 150 180 210 240 2700
200
400
600
800
1000
1200Carbonization in N
2
Tem
pera
ture
(°C
)
Time (min)
Stabilization in air
230
250
270
290
310
330
350
370
15
15
15
15
15
15
15
15
1050
18
Table 2.2 (continued)
LB
0 30 60 90 120 150 180 210 2400
200
400
600
800
1000
1200Carbonization in N
2
Tem
pera
ture
(°C
)
Time (min)
Stabilization in air
230
250
270
290
310
330
350
370
25
20
20
15
15
10
10
5
1050
HB
0 30 60 90 120 150 180 210 2400
200
400
600
800
1000
1200Carbonization in N
2
Tem
pera
ture
(°C
)
Time (min)
Stabilization in air
230
250
270
290
310
330
350
370
5
10
10
15
15
20
20
25
1050
SS
0 20 40 60 80 100 1200
200
400
600
800
1000
1200
Carbonization in N2
Tem
pera
ture
(oC
)
Time (min)
Stabilization in air
350 5
Fast
carbon
-ization
at
600°C
and
then
heat to
1050°
C

19
2.2.2 Carbonization:
Carbonization follows stabilization which is done in an inert environment with
Nitrogen (N2). Stabilized fibers are placed in the Tube furnace (Figure 2.4) and then
furnace is flushed out with N2 to get rid of oxygen and trace amounts of other gasses
that might react with the stabilized fiber during high temperatures. After the flushing
process the furnace is set to 1050°C. Once the furnace reaches 1050°C it is held at that
temperature for Five minutes then the furnace is turned off and left for cool down with a
steady flow of N2. The carbon fibers can be removed after the furnace cools down to
about +50°C of room temperature. All temperature profiles used the same carbonization
method as shown in Table 2.2 with the exception of the last sample Short Stabilization
(SS) in this table.
2.3 Fabrication of Carbon Fiber Sandwiched Composites:
2.3.1 Vacuum Bagging Resin Infusion:
Vacuum bagging resin infusion technique was used to fabricate carbon fiber
sandwiched composites (CFSCs) and is shown in Figure 2.5. The vacuum helps the air
bubbles to escape from the composite before curing and uniformly diffuse the epoxy
resin solution throughout the entire composite. Addition of pressure from a hot press
helps to compress the composite to improve fiber density of the composite.
Figure 2.5 Vacuum bagging resin infusion method for making CFSCs
20
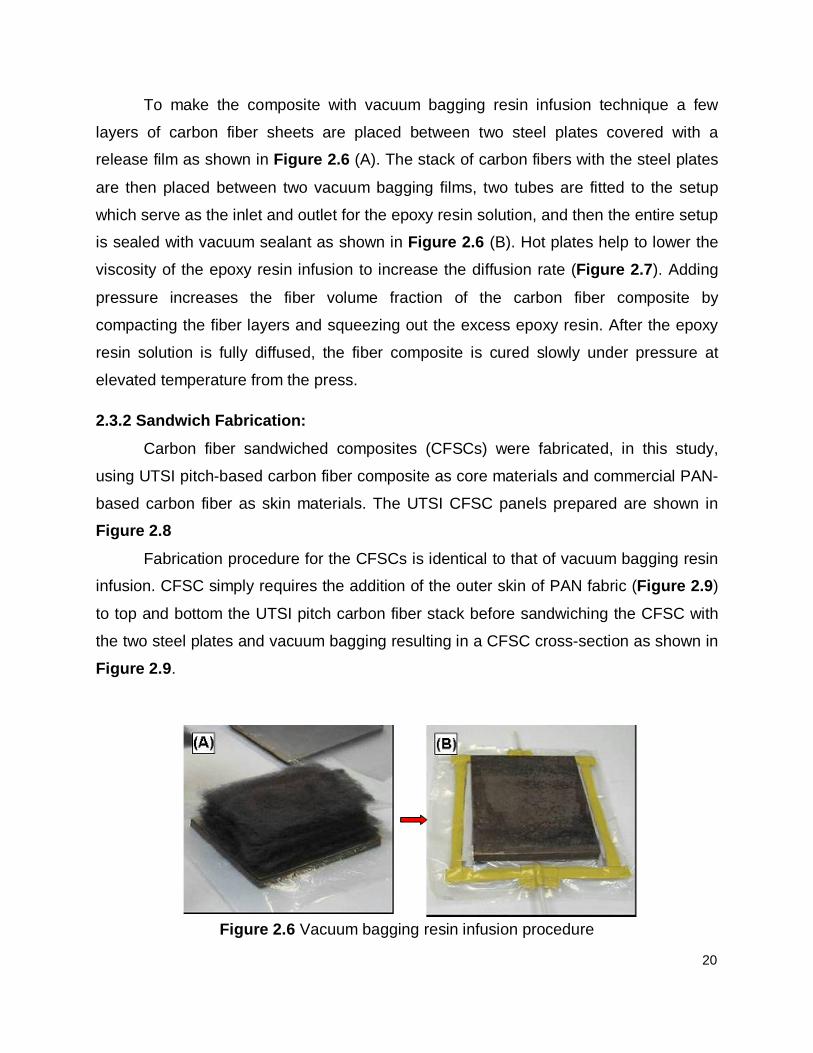
To make the composite with vacuum bagging resin infusion technique a few
layers of carbon fiber sheets are placed between two steel plates covered with a
release film as shown in Figure 2.6 (A). The stack of carbon fibers with the steel plates
are then placed between two vacuum bagging films, two tubes are fitted to the setup
which serve as the inlet and outlet for the epoxy resin solution, and then the entire setup
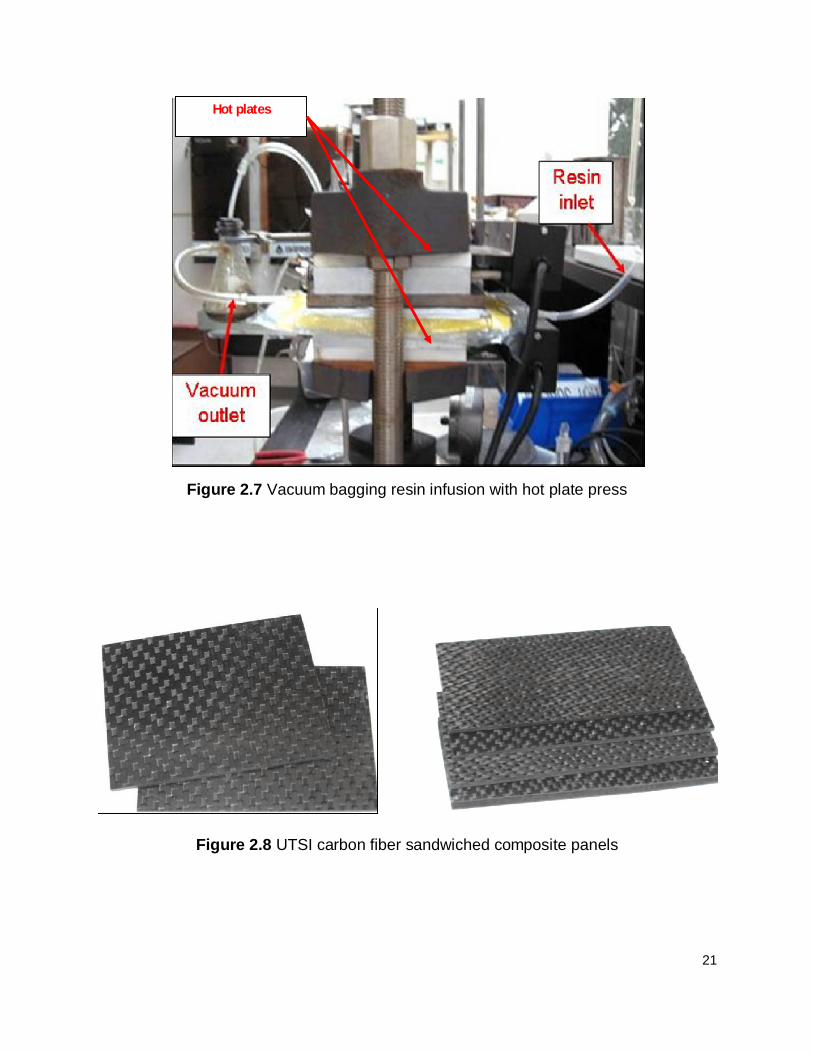
is sealed with vacuum sealant as shown in Figure 2.6 (B). Hot plates help to lower the
viscosity of the epoxy resin infusion to increase the diffusion rate (Figure 2.7). Adding
pressure increases the fiber volume fraction of the carbon fiber composite by
compacting the fiber layers and squeezing out the excess epoxy resin. After the epoxy
resin solution is fully diffused, the fiber composite is cured slowly under pressure at
elevated temperature from the press.
2.3.2 Sandwich Fabrication:
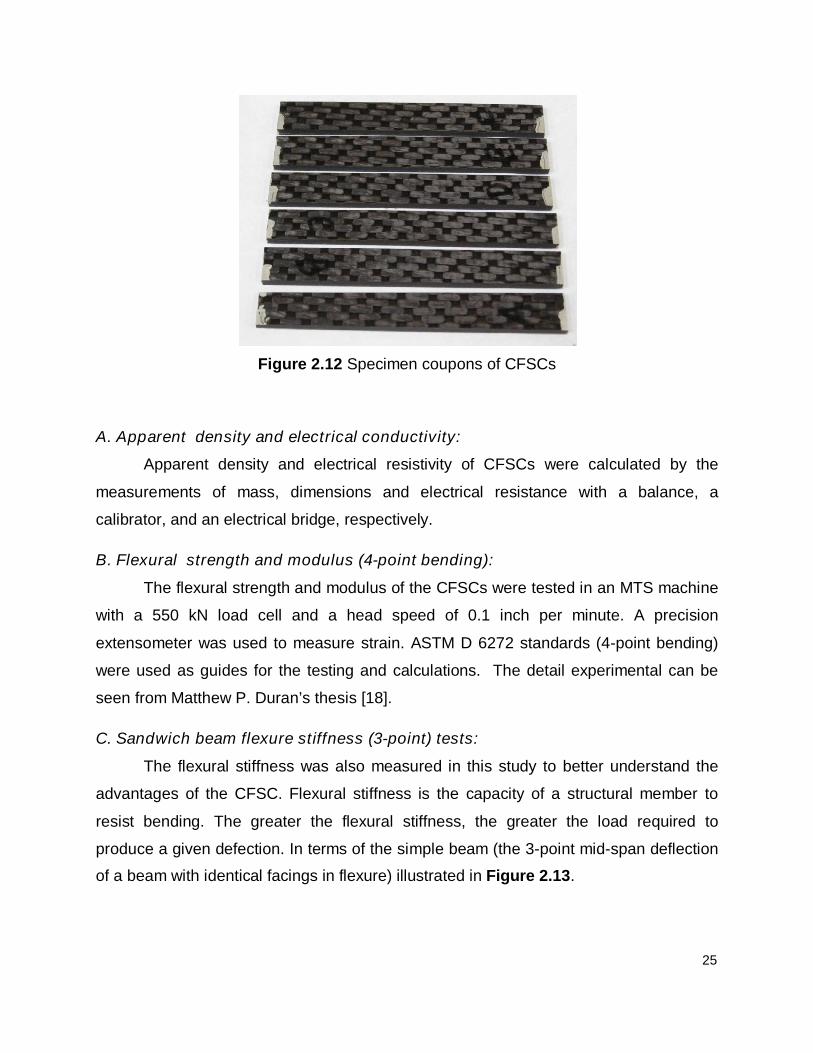
Carbon fiber sandwiched composites (CFSCs) were fabricated, in this study,
using UTSI pitch-based carbon fiber composite as core materials and commercial PAN-
based carbon fiber as skin materials. The UTSI CFSC panels prepared are shown in
Figure 2.8
Fabrication procedure for the CFSCs is identical to that of vacuum bagging resin
infusion. CFSC simply requires the addition of the outer skin of PAN fabric (Figure 2.9)
to top and bottom the UTSI pitch carbon fiber stack before sandwiching the CFSC with
the two steel plates and vacuum bagging resulting in a CFSC cross-section as shown in
Figure 2.9.
Figure 2.6 Vacuum bagging resin infusion procedure
21
Figure 2.7 Vacuum bagging resin infusion with hot plate press
Figure 2.8 UTSI carbon fiber sandwiched composite panels
Hot plates

22
Figure 2.9 Cross-section of UTSI CFSC showing core (from UTSI pitch-based carbon
fiber) and two skins (from PAN-based carbon fiber)
2.4 Measurement and Characterization:
2.4.1 Single-fiber Testing:
Individual fibers are picked from each method to ascertain their respective tensile
strength and modulus. Fibers are mounted on plastic tabs by Jeweler’s wax and placed
on a tray. The tray holds 15 samples therefore 15 single fibers are chosen from each
method for analysis. First the fiber is placed between the slots of the two tabs and then
wax is applied to the square cup to secure to fiber to the tab. After all 15 fibers have
been secured on the tabs an additional reheat sequence is done to assure a better
bond between the wax and fiber. The rapid cooling rate on the droplet of wax does not
allow for a very good bond to the surface of the fiber. If the tray of 15 fibers undergoes
tensile testing without the reheat cycle the plot of the stress-strain curve will display
abrupt spikes which usually results from fiber slippage in the wax. Applying the reheat
cycle allows trapped air bubbles to escape, the wax to melt and bond firmly to the
square cup, and most importantly allows the wax to melt and have a better adhesion to
the surface of the fiber.
Fiber diameter and tensile properties were measured using a Dia-stron® system
(Figure 2.10) which is comprised of the FDAS 765 laser scan micrometer, LEX 810
tensile tester (Figure 2.10 ), and controlled by the UV-Win software.
Skin
Core

23
Figure 2.10 Dia-stron® system
The 15 samples are transferred first to the FDAS 765 laser scan micrometer to
measure diameter of the fiber samples. This is measured by the Mitutoyo LSM 500
laser micrometer where the diameter is measured to be the difference between the
emitted and the received laser beam. Measurements are taken at every 20° rotation and
a full rotation of 180° is done for each segment or slice of the sample. The gauge length
is 10 mm and there are 10 slices observed for each sample.
After measuring the diameter with the FDAS 765 laser scan micrometer the
sample is moved to the LEX 810 tensile tester bench to measure the tensile strength.
The LEX 810 tensile tester is comprised of a DC motor for drawing the fiber and a
Sensotec semi-conductor strain gage load cell which measures the load on the sample.
The pull rate for tensile testing is 0.01 mm/s, the gauge force is 0.2 gram force (gmf),
the maximum force is 250 gmf, and the break threshold is set at three. By default UV-
Win graphs Stress-strain curve with the Y-axis as gram force (gmf) and the X-axis as
microns. Calculated results of tensile strength and modulus in Pascals are reported
based on the minimum cross-sectional area which is the most likely break-point for the
sample. The Y-axis units can be changed to Mega Pascals (MPa) from Gram force in
which case the MPa is calculated based on the minimum cross-sectional area.

24
Figure 2.11 Dia-stron® system with FDAS 765 and LEX 810
Dimensional readings from the FDAS 765 laser scan micrometer can be used to
demonstrate the diameter distribution among a bundle fibers and along a single fiber.
They can also be plotted to show a 3-Dimensional image of the carbon fibers. Each
fiber is scanned from 0-180° and rotated by 20° for each measurement. The 180°
rotation allows the fiber cross-sections to be characterized due to axial symmetry and
plotting the half-diameter (radius) measurement at each 20° rotation for 360° produces
the 3D image for one slice of the carbon fiber. Since the FDAS 765 laser scan
micrometer takes 10 slice readings along the length of the fiber each segment must be
plotted to give the 3D image for the entire fiber length.
2.4.2 Composite Testing:
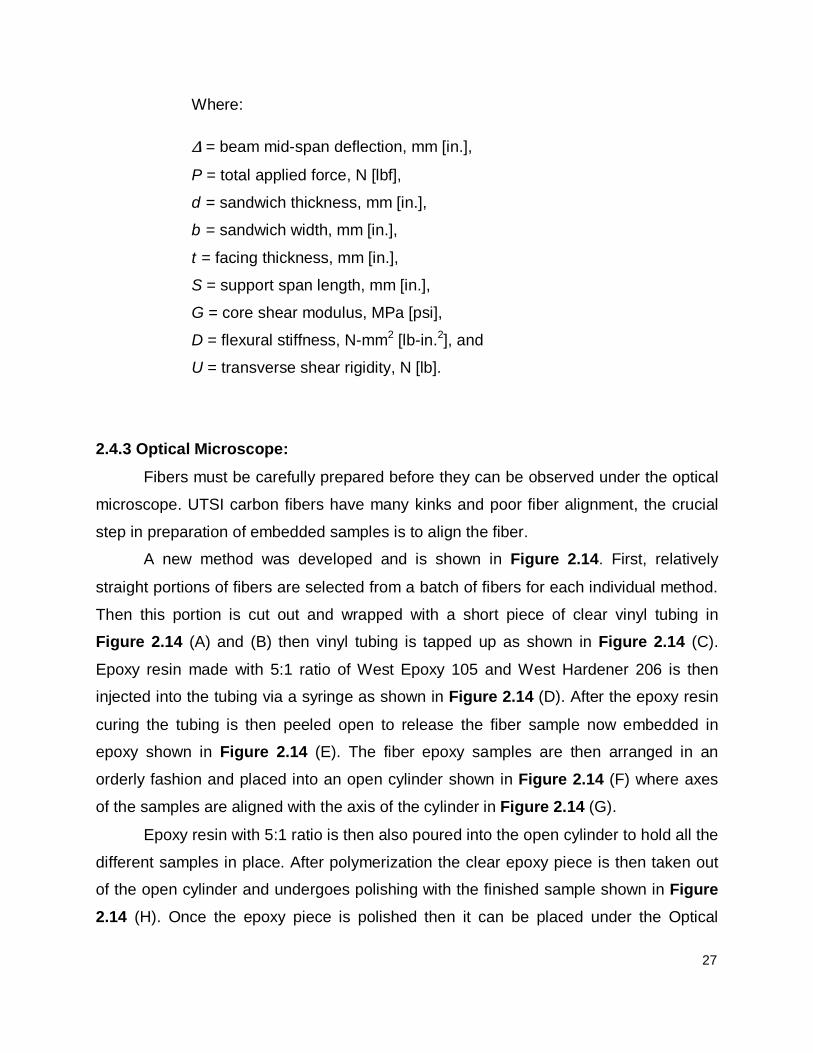
Each of the prepared UTSI CFSC panels (Figure 2.8) was cut to six rectangular
strips (Figure 2.12) according to the requirements of the ASTM D 6272 and D 7250
standards. The specimen coupons were placed overnight into an oven at 120°C before
testing. The apparent density was first measured and then silver coating was applied
on the two ends of the coupons as shown in Figure 2.12 to measure the electrical
resistivity. Flexural properties were determined after the measurement of apparent
density and resistivity.
FDAS 765
LEX 810
25
Figure 2.12 Specimen coupons of CFSCs
A. Apparent density and electrical conductivity:
Apparent density and electrical resistivity of CFSCs were calculated by the
measurements of mass, dimensions and electrical resistance with a balance, a
calibrator, and an electrical bridge, respectively.
B. Flexural strength and modulus (4-point bending):
The flexural strength and modulus of the CFSCs were tested in an MTS machine
with a 550 kN load cell and a head speed of 0.1 inch per minute. A precision
extensometer was used to measure strain. ASTM D 6272 standards (4-point bending)
were used as guides for the testing and calculations. The detail experimental can be
seen from Matthew P. Duran’s thesis [18].
C. Sandwich beam flexure stiffness (3-point) tests:
The flexural stiffness was also measured in this study to better understand the
advantages of the CFSC. Flexural stiffness is the capacity of a structural member to
resist bending. The greater the flexural stiffness, the greater the load required to
produce a given defection. In terms of the simple beam (the 3-point mid-span deflection
of a beam with identical facings in flexure) illustrated in Figure 2.13.

26
Figure 2.13 3-point mid-span deflection of a CFSC beam
ASTM D 7250 (standard practice for determining sandwich beam flexural and
shear stiffness) was used to measure the flexural stiffness, D, the transverse shear
rigidity, U, and the core shear modulus, G.
Given deflections and applied forces from results of testing the same sandwich
beam with two different loading configurations, D and U could be determined from
equations (Eqs 1 and 2) listed in ASTM D 7250 for the two loading cases., G could then
be calculated using Eq 3 listed in ASTM D 7250. Due to the length of the equations, the
solution for the general loading configuration case is not given here. The following
subsections give the solution for common combinations of loading conditions.
(1)
(2)
(3)
P
S
27
Where:
∆ = beam mid-span deflection, mm [in.],
P = total applied force, N [lbf],
d = sandwich thickness, mm [in.],
b = sandwich width, mm [in.],
t = facing thickness, mm [in.],
S = support span length, mm [in.],
G = core shear modulus, MPa [psi],
D = flexural stiffness, N-mm2 [lb-in.2], and
U = transverse shear rigidity, N [lb].
2.4.3 Optical Microscope:
Fibers must be carefully prepared before they can be observed under the optical
microscope. UTSI carbon fibers have many kinks and poor fiber alignment, the crucial
step in preparation of embedded samples is to align the fiber.
A new method was developed and is shown in Figure 2.14. First, relatively
straight portions of fibers are selected from a batch of fibers for each individual method.
Then this portion is cut out and wrapped with a short piece of clear vinyl tubing in
Figure 2.14 (A) and (B) then vinyl tubing is tapped up as shown in Figure 2.14 (C).
Epoxy resin made with 5:1 ratio of West Epoxy 105 and West Hardener 206 is then
injected into the tubing via a syringe as shown in Figure 2.14 (D). After the epoxy resin
curing the tubing is then peeled open to release the fiber sample now embedded in
epoxy shown in Figure 2.14 (E). The fiber epoxy samples are then arranged in an
orderly fashion and placed into an open cylinder shown in Figure 2.14 (F) where axes
of the samples are aligned with the axis of the cylinder in Figure 2.14 (G).
Epoxy resin with 5:1 ratio is then also poured into the open cylinder to hold all the
different samples in place. After polymerization the clear epoxy piece is then taken out
of the open cylinder and undergoes polishing with the finished sample shown in Figure
2.14 (H). Once the epoxy piece is polished then it can be placed under the Optical

28
microscope for observation and imaging of the individual cross-sections of fibers
bundles.
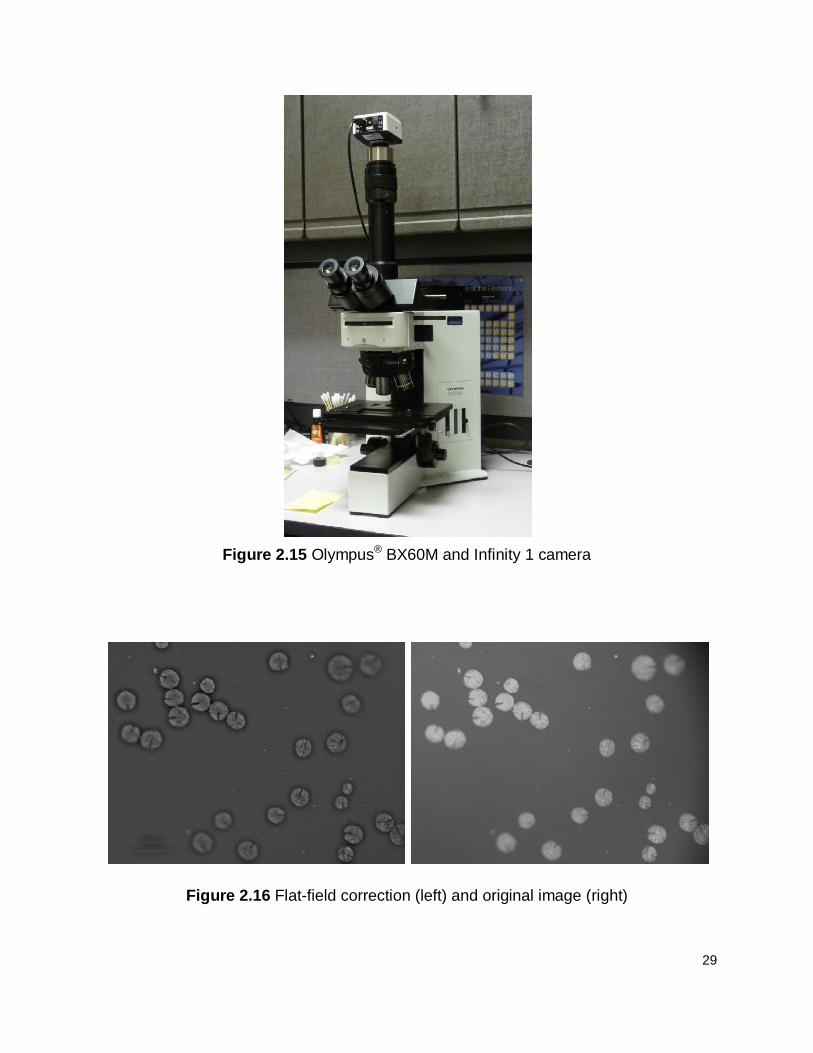
The Optical microscope Olympus® BX60M was used in conjunction with the
camera Infinity 1 (Figure 2.15) and software Infinity Analyze version 5.0.2 by
Lumenera® Corporation to capture images of the carbon fiber cross-sections. Images
can be viewed live via the Infinity Analyze software and when suitable captured. Certain
images were treated with the flat-field correction to accentuate the Pac-man features.
The flat-field correction compensates for the different dark currents and gains in
a detector, in this case the Infinity 1, by creating a uniform output from a uniform signal.
Figure 2.16 demonstrates the difference between a flat-field corrected picture vs. the
original. Notice how the flat-field correction changes the background to a uniform grey
color, outlines the carbon fibers, and accentuates Pac-man structures.
Figure 2.14 Embedded sample preparation
29
Figure 2.15 Olympus® BX60M and Infinity 1 camera
Figure 2.16 Flat-field correction (left) and original image (right)

30
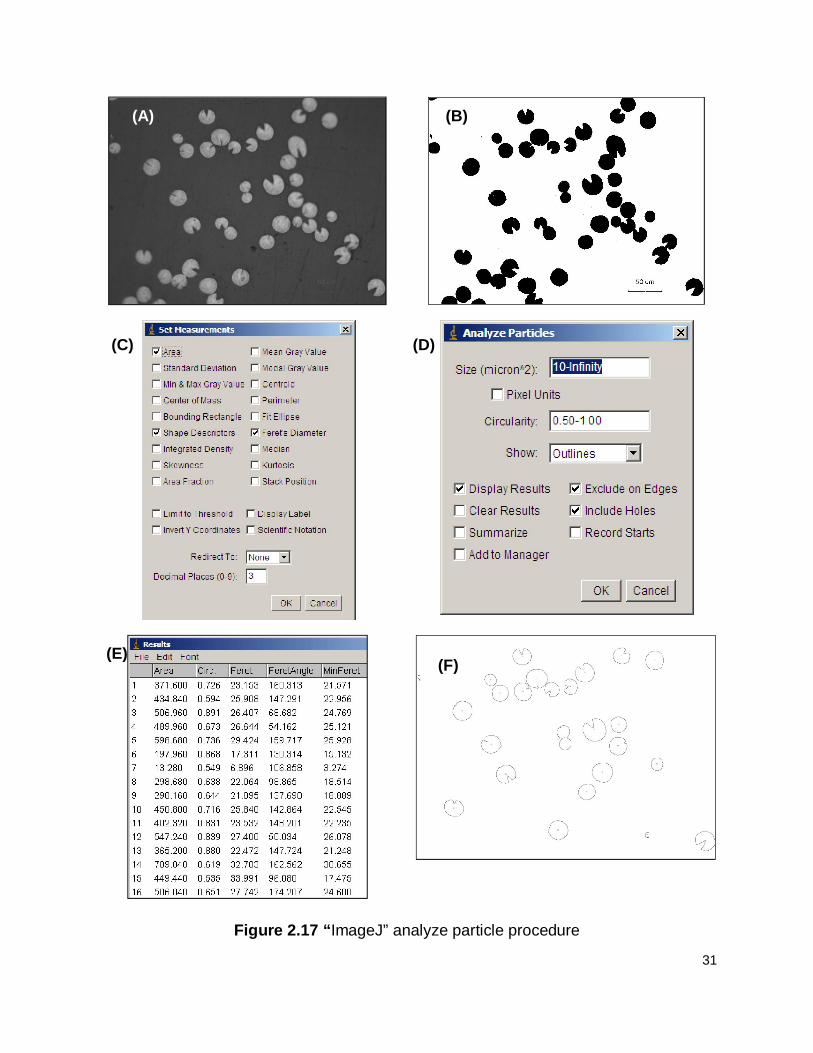
2.4.4 Image Analysis:
Image analysis was done via a freeware called ImageJ offered by the National
Institute of Health (http://rsbweb.nih.gov/ij/). Three critical metrics for optical images of
carbon fiber cross-sections are the diameter, cross-sectional area, and the angle of
existing Pac-man structures. Cross-sectional area and the fiber diameter can be
assessed with the “analyze particle” feature under Analyze in ImageJ but the image has
to meet certain requirements before the tool can be utilized.
Measurements of concern must be reported by selecting Analyze à Set
Measurements and then selecting “Area”, “Shape Descriptors”, and “Feret Diameter”
(Figure 2.17 (C)). The image must be pixel scaled so that the measurements correlate
to the scale on the image. This is done by drawing a straight line tracing the micron
marker on the image (Figure 2.17 (A)) and then selecting Analyze à Set Scale and
then setting it to the known distance which is 50 µm in this case.
The original image shown in Figure 2.17 (A) must be converted to grey scale if it
is not already in grey scale by selecting menu Image à Type à 8 bit. Then the image
must be inverted by selecting the menu Edit à Invert. After the inversion the image
must then be adjusted so that it is only black and white and this is done by menu Image
à Adjust à Threshold. The amount of adjustment should be done in such a way that
there are no black dots on the resulting image but it should not subtract so much as to
make the cross-sectional areas dramatically smaller than the original image which
would result in inaccurate measurements (Figure 2.17 (B)).
When the threshold adjustment is complete the image can finally be analyzed by
selecting Analyze à Analyze Particles. The appropriate settings are shown in Figure
2.17 (D) for this image. User can adjust the size and circularity for various images but
“Show: Outline”, “Display Results”, “Exclude on Edges”, and “Include Holes” must be
selected in order to see the full results. Results include “Area” and “Feret” which
represents the cross-sectional area and the diameter corresponding to the various
carbon fibers shown (Figure 2.17 (E)) with the outline view (Figure 2.17 (F)).
31
Figure 2.17 “ImageJ” analyze particle procedure
(A) (B)
(C) (D)
(E) (F)
32
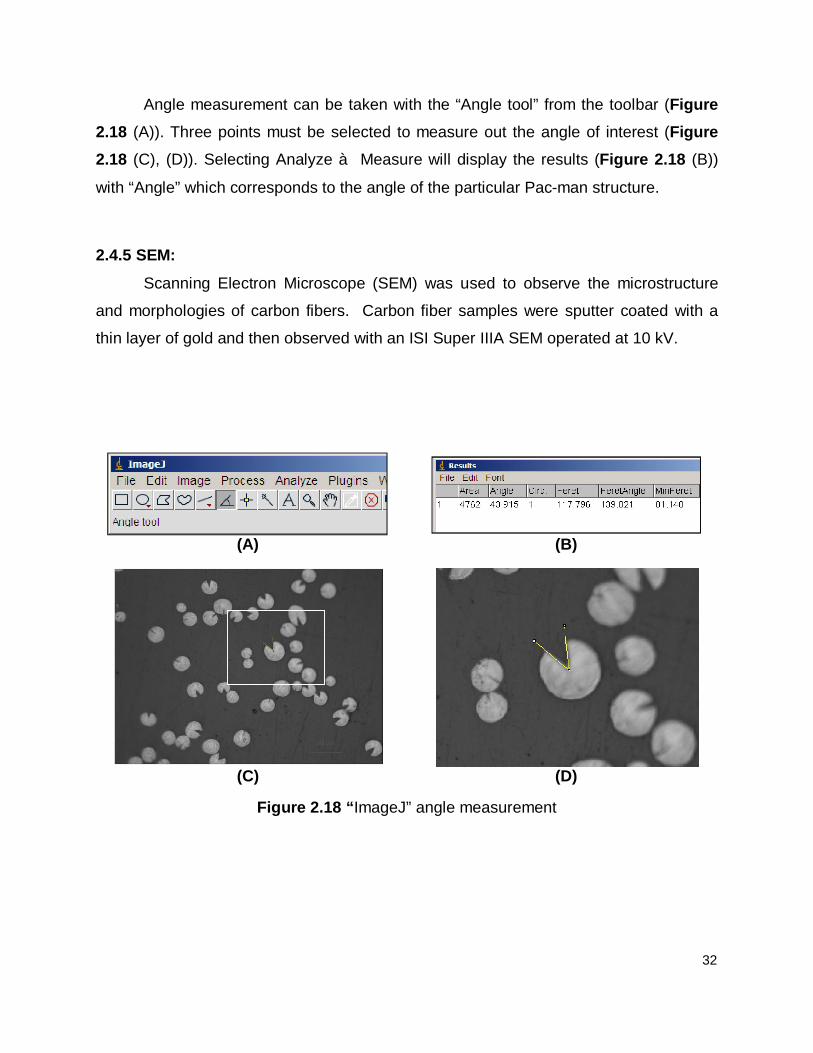
Angle measurement can be taken with the “Angle tool” from the toolbar (Figure
2.18 (A)). Three points must be selected to measure out the angle of interest (Figure
2.18 (C), (D)). Selecting Analyze à Measure will display the results (Figure 2.18 (B))
with “Angle” which corresponds to the angle of the particular Pac-man structure.
2.4.5 SEM:
Scanning Electron Microscope (SEM) was used to observe the microstructure
and morphologies of carbon fibers. Carbon fiber samples were sputter coated with a
thin layer of gold and then observed with an ISI Super IIIA SEM operated at 10 kV.
(A) (B)
(C) (D)
Figure 2.18 “ImageJ” angle measurement
33
Chapter 3: Influence of Thermal Processes on Structure and
Properties of Carbon Fibers
Thermal processes are important steps for making high performance carbon
fibers. They influence the structure and properties of the resulting carbon fibers. This
chapter will be concerned with the study and understanding of the effect of thermal
processes on the structure of stabilized and the resulting carbon fibers. Analysis of the
structural difference between fibers and fiber mechanical properties will be also
explored to understand their relations.
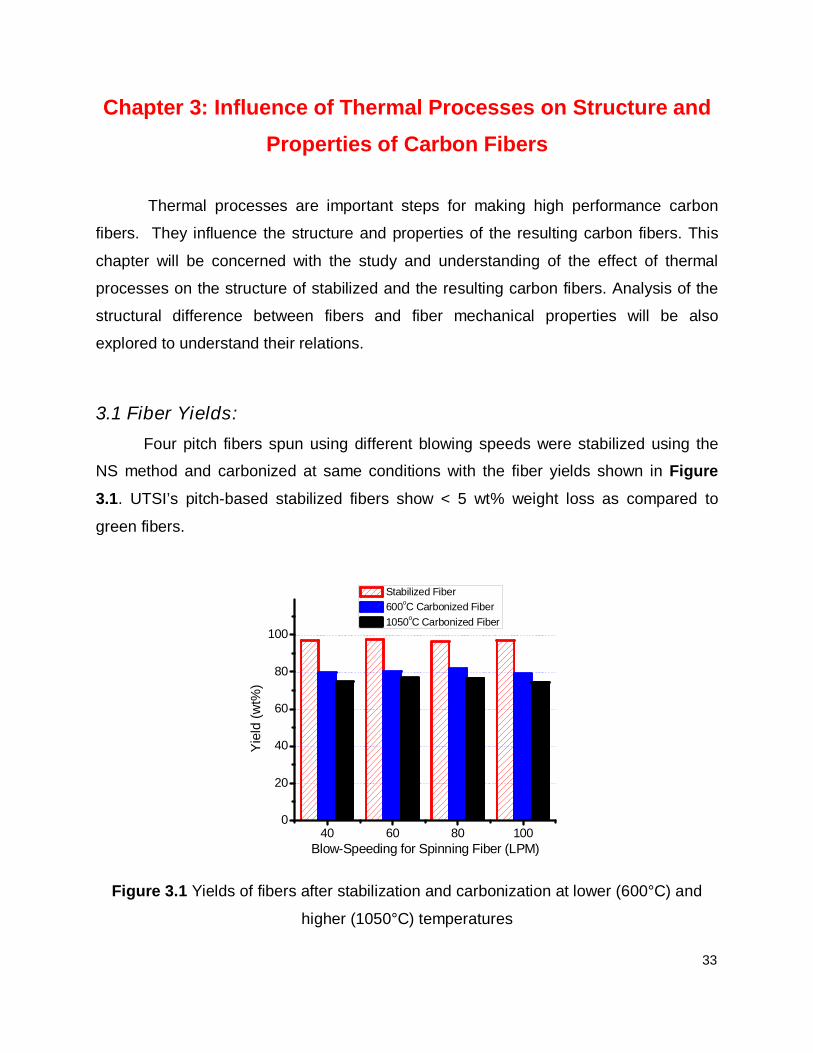
3.1 Fiber Yields:
Four pitch fibers spun using different blowing speeds were stabilized using the
NS method and carbonized at same conditions with the fiber yields shown in Figure
3.1. UTSI’s pitch-based stabilized fibers show < 5 wt% weight loss as compared to
green fibers.
40 60 80 1000
20
40
60
80
100
Yie
ld (
wt%
)
Blow-Speeding for Spinning Fiber (LPM)
Stabilized Fiber
600oC Carbonized Fiber
1050oC Carbonized Fiber
Figure 3.1 Yields of fibers after stabilization and carbonization at lower (600°C) and
higher (1050°C) temperatures
34
It was reported that the green fibers spun from solvated mesophase pitch contain
~ 12 wt% solvents [19]. Most of solvents in the fiber are removed and fiber undergoes
weight loss during the stabilization process done with air from 150 to 350°C. During the
stabilization process, the fiber will be oxidized (introduction of oxygen) and gain weight.
After the stabilization process, the stabilized fibers are carbonized in N2 at higher
temperatures to remove all other non-carbon elements. The carbonized fibers show a
weight loss of ~ 20 wt% at 600°C and ~ 25 wt% at 1050°C respectively. With
approximately 75% (even higher at ~ 87% if disregarding the solvents) carbon yield as
compared to the 50-55% carbon yield of PAN fibers [20].
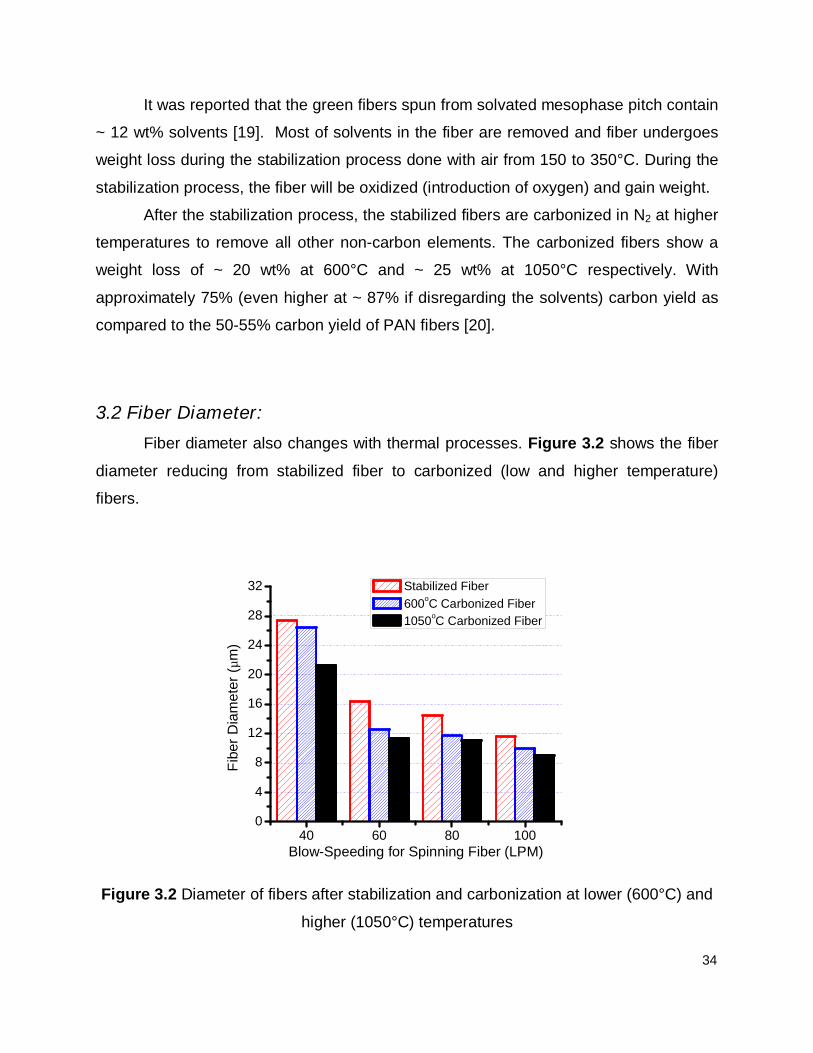
3.2 Fiber Diameter:
Fiber diameter also changes with thermal processes. Figure 3.2 shows the fiber
diameter reducing from stabilized fiber to carbonized (low and higher temperature)
fibers.
40 60 80 1000
4
8
12
16
20
24
28
32
Fib
er
Dia
mete
r (µ
m)
Blow-Speeding for Spinning Fiber (LPM)
Stabilized Fiber
600oC Carbonized Fiber
1050oC Carbonized Fiber
Figure 3.2 Diameter of fibers after stabilization and carbonization at lower (600°C) and
higher (1050°C) temperatures

35
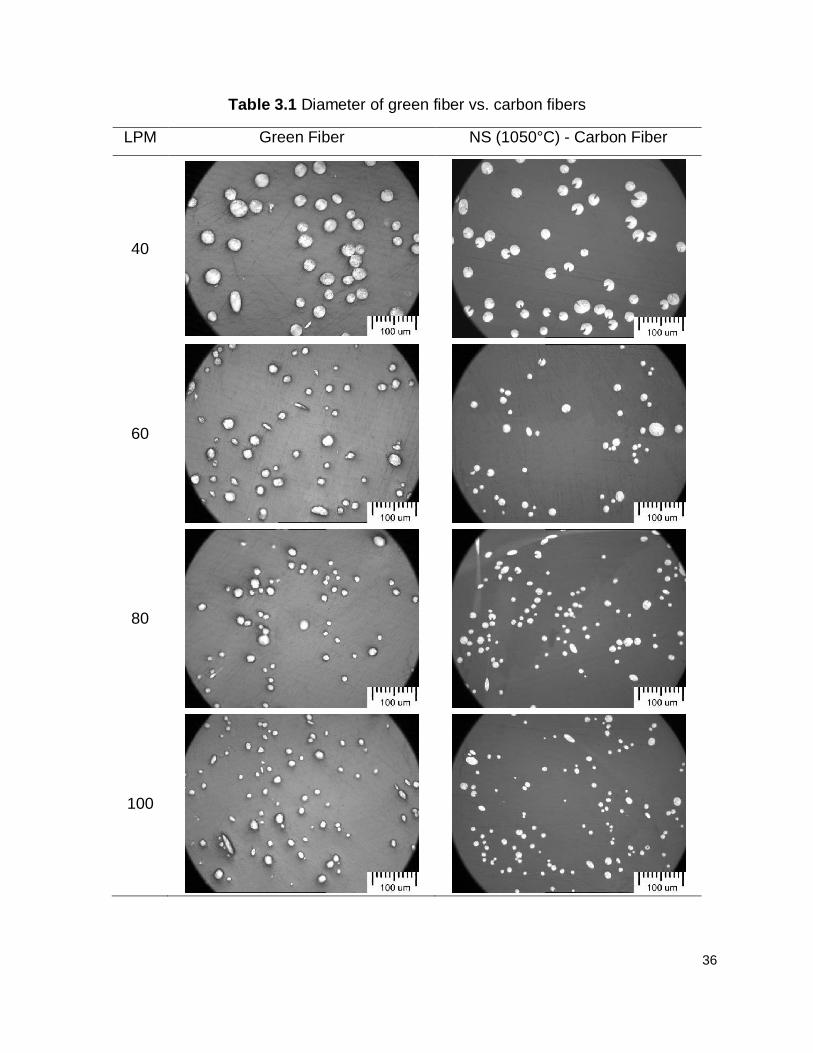
The optical microscope images shown in Table 3.1 display the obvious
difference between green and carbon fibers. Higher blowing speeds of 100 LPM
produced green fiber with smaller diameter leading to a smaller (~ 9 µm) diameter
carbon fiber. It was found that the diameter of green fiber does not change distinctly
after stabilization under normal levels but there are distinct changes during the
carbonization process. The reduction in diameter is the result of radial shrinkage of fiber
due to chemical reactions such as cross-linking and aromatic reaction. From Table 3.1
it can be seen that carbon fiber with a larger diameter usually presents a radial crack
structure or a “pac-man structure”.
3.3 Evolution of Fiber Structure:
The appearance of pac-man structure in the carbon fiber (Table 3.1) led to a
research focusing on the development and evolution of pac-man structures during the
thermal processes. Larger diameter green fiber spun with lower blowing speed at 40
LPM was chosen as a precursor fiber for the investigation of pac-man structures. The
fiber was stabilized with 2S2 method. The stabilized fiber was then carbonized in N2 at
various temperatures from 400-1000°C in 100°C increment. Eight samples, including
stabilized fiber, were observed using an optical microscope as shown in Figure 3.3 with
flat-field correction.
Formation of pac-mans in stabilized fibers is not readily detectable or as
apparent compared to the carbonized counterpart. The pac-man structures start to
reveal themselves starting from 600°C. They become distinctly noticeable at 700°C as
seen with the fiber at the center of the picture. From 800°C and onwards the pac-man
structures can be observed in almost every fiber with the angle of the pac-man mouth
being the greatest at 1000°C.
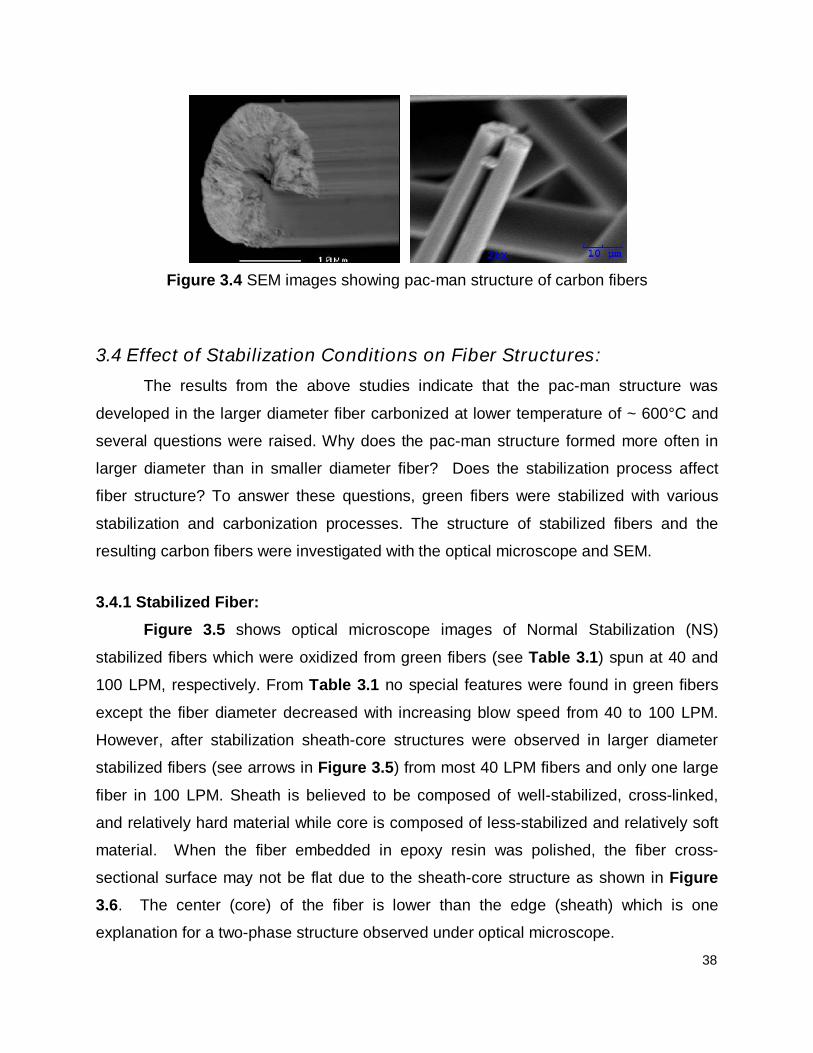
The high magnification images obtained from SEM shown in Figure 3.4 displays
the pac-man structure development along the fiber axis.
36
Table 3.1 Diameter of green fiber vs. carbon fibers
LPM Green Fiber NS (1050°C) - Carbon Fiber
40
60
80
100

37
Figure 3.3 Development of pac-man structure during carbonization
38
Figure 3.4 SEM images showing pac-man structure of carbon fibers
3.4 Effect of Stabilization Conditions on Fiber Structures:
The results from the above studies indicate that the pac-man structure was
developed in the larger diameter fiber carbonized at lower temperature of ~ 600°C and
several questions were raised. Why does the pac-man structure formed more often in
larger diameter than in smaller diameter fiber? Does the stabilization process affect
fiber structure? To answer these questions, green fibers were stabilized with various
stabilization and carbonization processes. The structure of stabilized fibers and the
resulting carbon fibers were investigated with the optical microscope and SEM.
3.4.1 Stabilized Fiber:
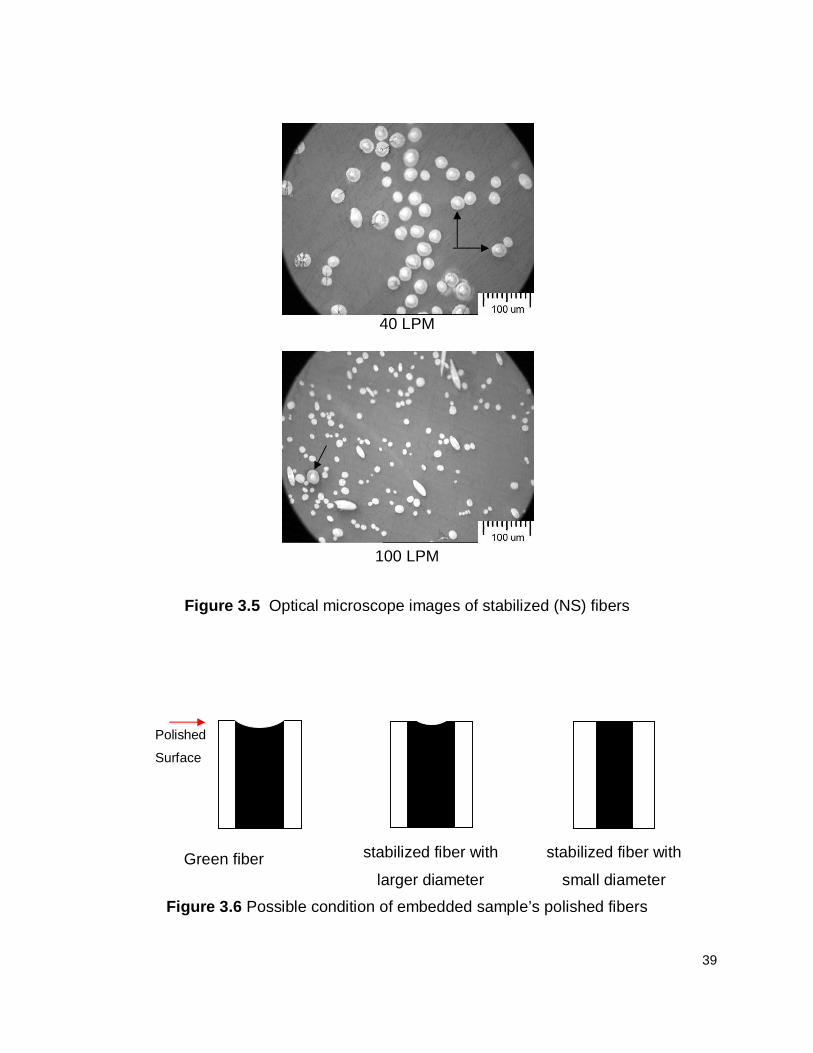
Figure 3.5 shows optical microscope images of Normal Stabilization (NS)
stabilized fibers which were oxidized from green fibers (see Table 3.1) spun at 40 and
100 LPM, respectively. From Table 3.1 no special features were found in green fibers
except the fiber diameter decreased with increasing blow speed from 40 to 100 LPM.
However, after stabilization sheath-core structures were observed in larger diameter
stabilized fibers (see arrows in Figure 3.5) from most 40 LPM fibers and only one large
fiber in 100 LPM. Sheath is believed to be composed of well-stabilized, cross-linked,
and relatively hard material while core is composed of less-stabilized and relatively soft
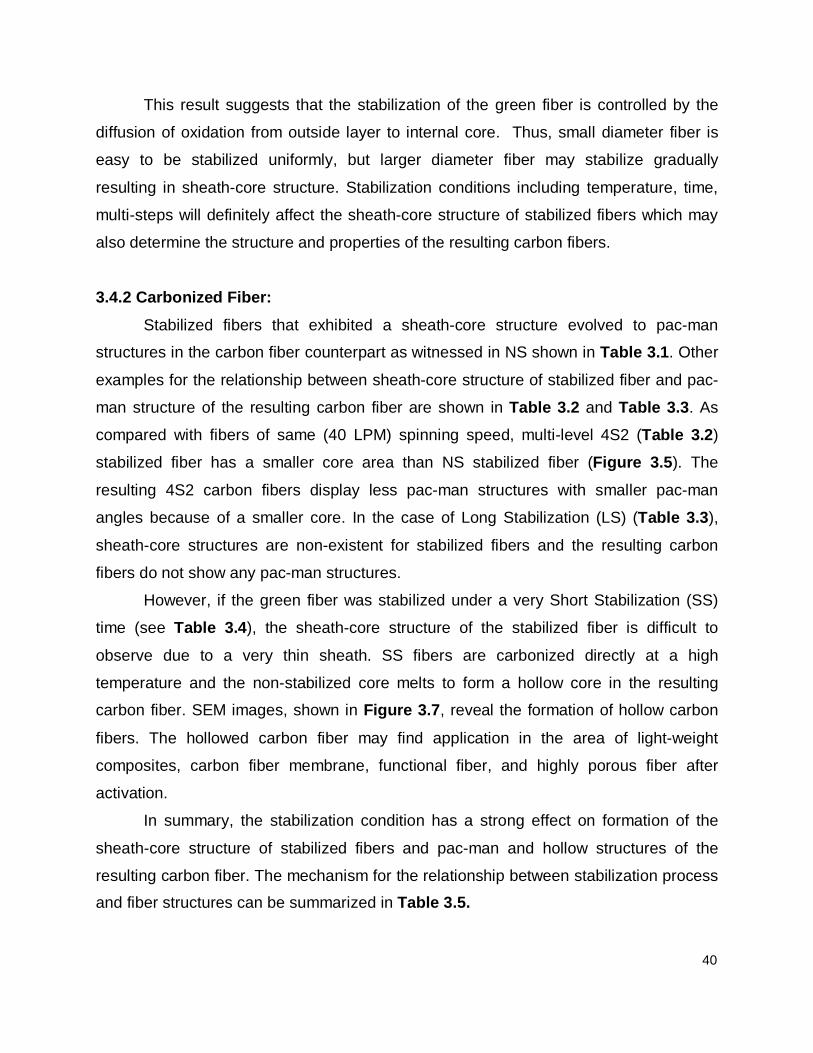
material. When the fiber embedded in epoxy resin was polished, the fiber cross-
sectional surface may not be flat due to the sheath-core structure as shown in Figure
3.6. The center (core) of the fiber is lower than the edge (sheath) which is one
explanation for a two-phase structure observed under optical microscope.
39
40 LPM
100 LPM
Figure 3.5 Optical microscope images of stabilized (NS) fibers
Green fiber stabilized fiber with
larger diameter
stabilized fiber with
small diameter
Figure 3.6 Possible condition of embedded sample’s polished fibers
Polished
Surface
40
This result suggests that the stabilization of the green fiber is controlled by the
diffusion of oxidation from outside layer to internal core. Thus, small diameter fiber is
easy to be stabilized uniformly, but larger diameter fiber may stabilize gradually
resulting in sheath-core structure. Stabilization conditions including temperature, time,
multi-steps will definitely affect the sheath-core structure of stabilized fibers which may
also determine the structure and properties of the resulting carbon fibers.
3.4.2 Carbonized Fiber:
Stabilized fibers that exhibited a sheath-core structure evolved to pac-man
structures in the carbon fiber counterpart as witnessed in NS shown in Table 3.1. Other
examples for the relationship between sheath-core structure of stabilized fiber and pac-
man structure of the resulting carbon fiber are shown in Table 3.2 and Table 3.3. As
compared with fibers of same (40 LPM) spinning speed, multi-level 4S2 (Table 3.2)
stabilized fiber has a smaller core area than NS stabilized fiber (Figure 3.5). The
resulting 4S2 carbon fibers display less pac-man structures with smaller pac-man
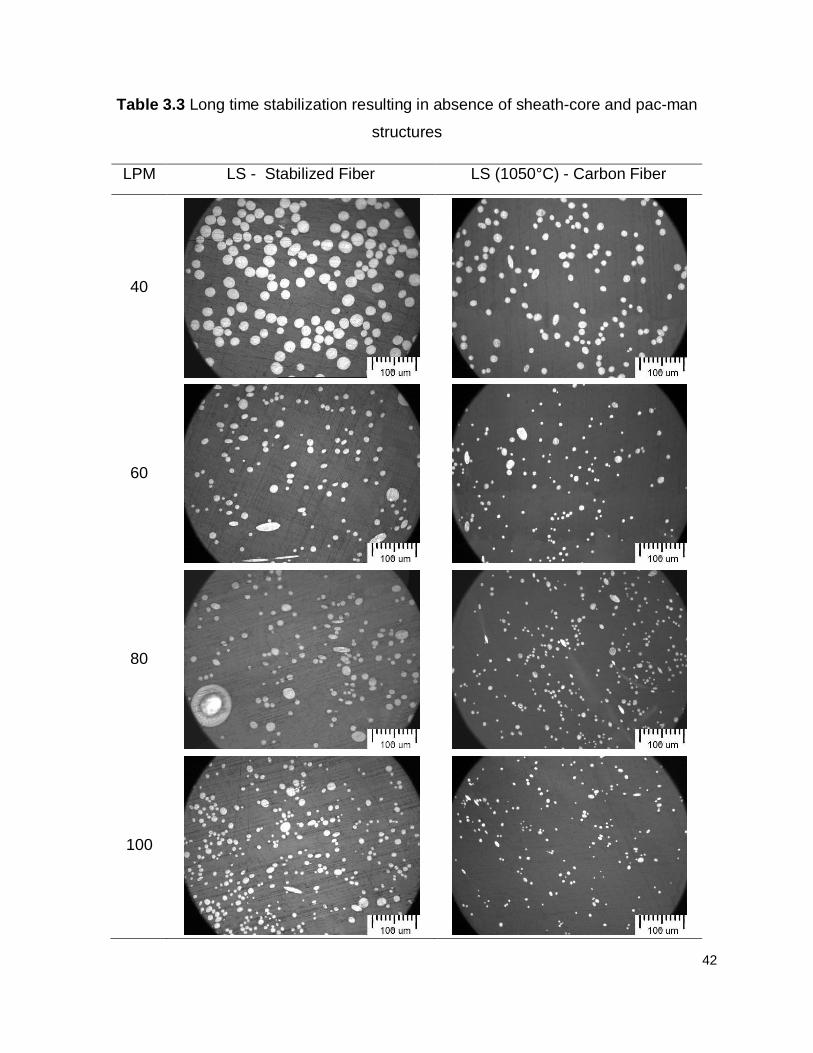
angles because of a smaller core. In the case of Long Stabilization (LS) (Table 3.3),
sheath-core structures are non-existent for stabilized fibers and the resulting carbon
fibers do not show any pac-man structures.
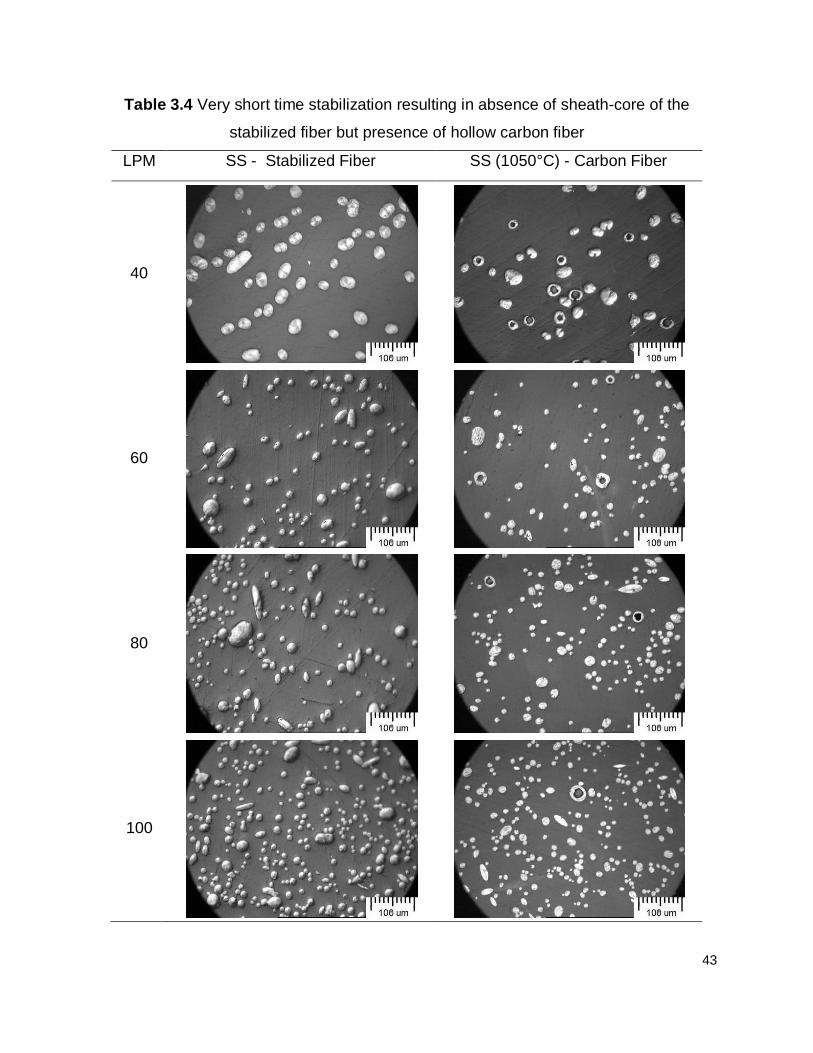
However, if the green fiber was stabilized under a very Short Stabilization (SS)
time (see Table 3.4), the sheath-core structure of the stabilized fiber is difficult to
observe due to a very thin sheath. SS fibers are carbonized directly at a high
temperature and the non-stabilized core melts to form a hollow core in the resulting
carbon fiber. SEM images, shown in Figure 3.7, reveal the formation of hollow carbon
fibers. The hollowed carbon fiber may find application in the area of light-weight
composites, carbon fiber membrane, functional fiber, and highly porous fiber after
activation.
In summary, the stabilization condition has a strong effect on formation of the
sheath-core structure of stabilized fibers and pac-man and hollow structures of the
resulting carbon fiber. The mechanism for the relationship between stabilization process
and fiber structures can be summarized in Table 3.5.

41
Table 3.2 Sheath-core structure of 4S2 stabilized fibers vs. pac-man structures of the
resulting carbon fibers
LPM 4S2 - Stabilized Fiber 4S2 (1050°C) - Carbon Fiber
40
60
80
100
42
Table 3.3 Long time stabilization resulting in absence of sheath-core and pac-man
structures
LPM LS - Stabilized Fiber LS (1050°C) - Carbon Fiber
40
60
80
100
43
Table 3.4 Very short time stabilization resulting in absence of sheath-core of the
stabilized fiber but presence of hollow carbon fiber
LPM SS - Stabilized Fiber SS (1050°C) - Carbon Fiber
40
60
80
100

44
Figure 3.7. Optical (left) and SEM (right) micrographs of the hollow carbon fibers
Table 3.5 Proposed mechanism of the formation of sheath-core, pac-man, and hollow
structures depending on the stabilization conditions
Stabilization condition
Green SS NS 4S2 LS
Level of Stabilization
Cross-section of Stabilized
Fiber
Polished status of
Stabilized fiber in epoxy
Cross-section of
Carbon fiber
20 µm

45
3.5 Effect of Stabilization Conditions on Properties of Carbon Fibers:
Mechanical properties of carbon fibers depend on many variables such as
precursor materials, fiber spinning, stabilization processes, and carbonization
temperatures. Stabilization processes not only affect the structure and properties but
also determines the cost of carbon fibers because stabilization processes usually
consume longest time in the manufacture of carbon fibers. In this study, to understand
the effect of stabilization processes on the properties of UTSI solvated pitch-based
carbon fibers, larger diameter green fiber spun at 40 LPM was chosen as precursor
fibers for the following research work. 40 LPM fiber forms distinct structure by different
stabilization processes as indicated above sections making it ideal for this investigation.
Different stabilization methods namely one-step, two-step, and multi-step, combining
with same carbonization method, and their effects on the mechanical properties of the
resulting carbon fiber were investigated.
3.5.1 One-step Stabilization:
One-step stabilization was carried out by thermally treating green fiber in air at
350°C. Generally, for a regular diameter (< 10 µm) fiber, the stabilization time was setup
around 60 min. Based on previous experience, the initial stabilization time was setup for
60 min, and the method was called Normal Stabilization (NS). The stabilization time
longer than 60 min was expected for the larger diameter green fiber used in this study.
In this study, the improvement of mechanical properties is more important than
the actual values. Low final carbonization temperature (1050°C) used and the large fiber
diameter both limit the full potential of the prepared carbon fiber’s mechanical
properties. All mechanical properties are normalized against NS’ fiber properties.
The initial experiment compares LS with NS and the results are shown in Figure
3.8. With the stabilization time increased from 60 to 360 min, the resulting carbon fiber
shows improvement in both tensile strength and modulus. This suggests that larger
diameter green fiber may need longer stabilization time at 350°C to obtain stronger
carbon fibers. However, 360 min is too long for stabilization and must be reduced to
balance time spent in stabilization with the desired properties.

46
3.5.2 Two-step Stabilization:
As compared with one-step stabilization which holds the fiber at a constant
temperature, two-step stabilization uses two temperatures steps in the stabilization
processes. Stabilization of solvated mesophase pitch fiber includes removal of solvents
and oxidation reactions which introduce functional groups into the fiber and lead to a
subsequent cross-linking of the oxidized pitch molecules. All these reactions could
occur at temperatures ranging from 150-450°C. However, each of these reactions
requires different temperatures and time to be completed. Stabilization processes with
greater than one-step is expected to reduce stabilization time and improve the
mechanical properties of the resulting carbon fibers.
In this study, two temperatures of 275°C and 375°C were employed to stabilize
the green fibers. The stabilization time is of equal proportions for both temperatures.
The total stabilization time is two, three, four, and five hours for methods 2S2, 2S3, 2S4,
and 2S5, respectively. The total time is longer than 60 min (NS) but shorter than 360
min (LS). Figure 3.9 shows the normalized strength and modulus of carbon fibers as a
function of total stabilization time. Two-step stabilization results in higher strength and
modulus as compared with one-step stabilization NS and LS shown in Figure 3.8.
From Figure 3.9, the strength increases with increased stabilization time from
two to four hours but decreases at five hours (300 min). This suggests that a long time
stabilization is not good for carbon fiber strength due to the over oxidation of the green
fiber and subsequent formation of structure defects on fiber during the carbonization
process.
Figure 3.8. Comparison between normal (NS) and long (LS) stabilization
1.00
1.46
0.80
1.00
1.20
1.40
1.60
60 360
No
rmal
ize
d S
tre
ngt
h
Stabilization Time (min)
NS
NS
LS
1.00
2.63
0.60
1.00
1.40
1.80
2.20
2.60
3.00
60 360
No
rmal
ize
d M
od
ulu
s
Stabilization Time (min)
NS
NS
LS

47
Figure 3.9. Normalized strength and modulus of carbon fibers as a function of total
stabilization time in two-step stabilization processes
1.46
1.69
2.051.90
0.60
1.00
1.40
1.80
2.20
2.60
120 180 240 300
No
rma
lize
d S
tre
ng
th
Stabilization Time (min)
2
S
2
2
S
3
2
S
4
2
S
5
3.22
4.58
4.95 5.00
1.50
2.00
2.50
3.00
3.50
4.00
4.50
5.00
5.50
120 180 240 300
Norm
aliz
ed M
odulu
s
Stabilization Time (min)
2
S
2
2
S
3
2
S
4
2
S
5
48
3.5.3 Multi-step Stabilization:
Since two-step is a promising stabilization method that can reduce stabilization
time and improve carbon fiber mechanical properties, a further investigation on multiple
(more than two temperature steps) stabilization was carried out and the results are
shown in Figure 3.10.
At first, a 4-step stabilization (2S2) method was tested. The stabilization
conditions were set: 250°C (30 min), 300oC (30 min), 350°C (30 min), and 400°C (15
min). The total time (105 min) is controlled less than 2 hours. As compared with Figure
3.9, the normalized strength of 2.48 indicates that 4-step stabilization (4S2) is much
better than 2-step stabilization (2S2, 2S3, 2S4, and 2S5) methods.
To investigate the effect of multi-step stabilization, the steps were doubled to see
if additional improvements in tensile strength and modulus of carbon fiber can be
obtained. Here, a relatively lower temperature (e.g. 230°C vs. 250°C) was chosen
based on a literature paper which gave insight into the reactions that occur at lower
stabilization temperature regions [21]. Since 4S2 had the most economical mechanical
properties for time spent in stabilization multi-step stabilization was set to two hours.
Three 8-step stabilization methods (8S2, LB, and HB) were conducted. 8S2 has
same time (15 min) in each of eight temperatures steps. With the two hours constraint
LB and HB methods were explored to investigate the effects of a bias temperature
profile. LB spends longer time at the lower temperature range and visa-versa for HB.
The results in Figure 3.10 show LB with a major improvement over other method
in tensile strength and modulus. Conversely, HB had the worst tensile strength aside
from the initial NS method and the tensile modulus is only a moderate improvement.
This suggests that stabilization at lower temperatures for longer time and at higher
temperatures for short time may be beneficial to mechanical properties of resulting
carbon fibers.
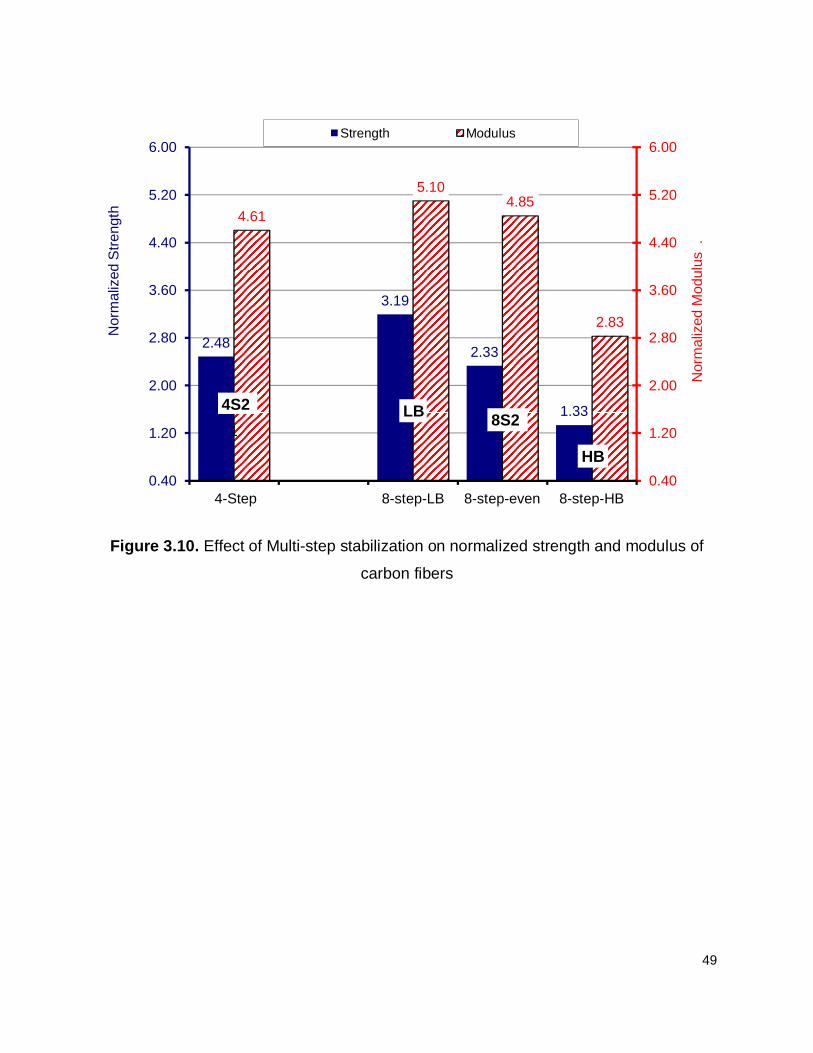
49
Figure 3.10. Effect of Multi-step stabilization on normalized strength and modulus of
carbon fibers
2.48
3.19
2.33
1.33
4.61
5.104.85
2.83
1
0.40
1.20
2.00
2.80
3.60
4.40
5.20
6.00
0.40
1.20
2.00
2.80
3.60
4.40
5.20
6.00
4-Step 8-step-LB 8-step-even 8-step-HB
Norm
aliz
ed M
odulu
s .
Norm
aliz
ed S
trength
Strength Modulus
4S2 LB8S2
HB
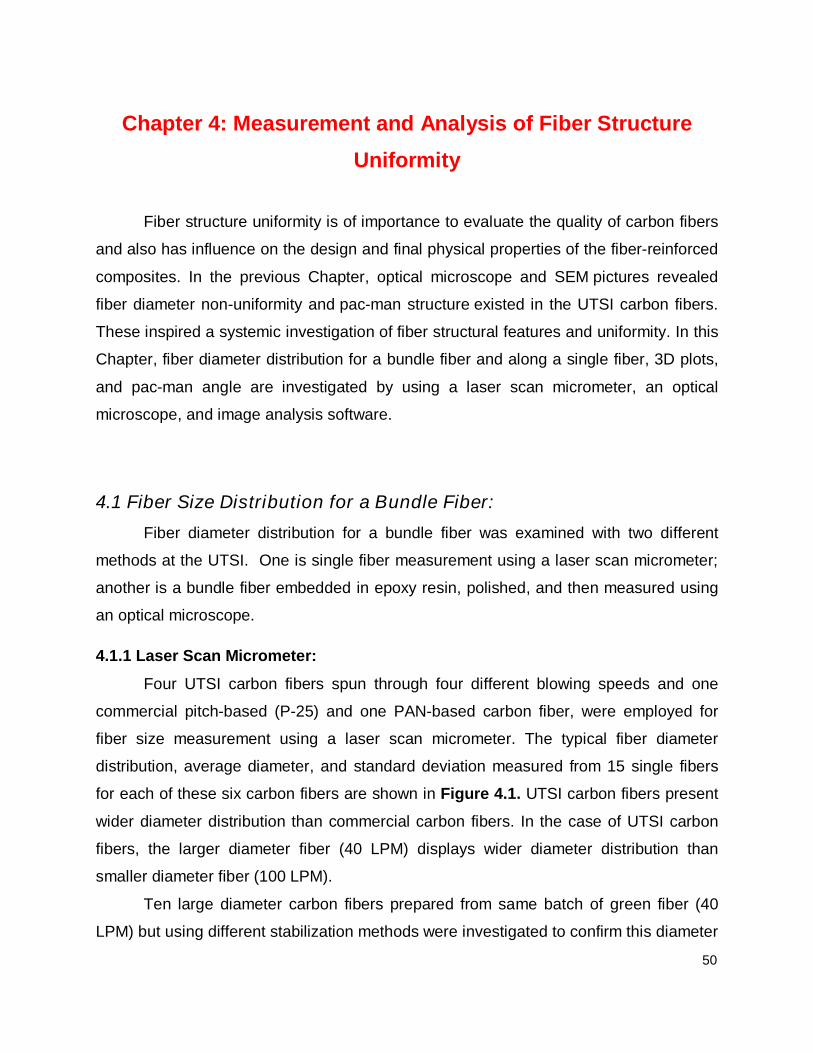
50
Chapter 4: Measurement and Analysis of Fiber Structure
Uniformity
Fiber structure uniformity is of importance to evaluate the quality of carbon fibers
and also has influence on the design and final physical properties of the fiber-reinforced
composites. In the previous Chapter, optical microscope and SEM pictures revealed
fiber diameter non-uniformity and pac-man structure existed in the UTSI carbon fibers.
These inspired a systemic investigation of fiber structural features and uniformity. In this
Chapter, fiber diameter distribution for a bundle fiber and along a single fiber, 3D plots,
and pac-man angle are investigated by using a laser scan micrometer, an optical
microscope, and image analysis software.
4.1 Fiber Size Distribution for a Bundle Fiber:
Fiber diameter distribution for a bundle fiber was examined with two different
methods at the UTSI. One is single fiber measurement using a laser scan micrometer;
another is a bundle fiber embedded in epoxy resin, polished, and then measured using
an optical microscope.
4.1.1 Laser Scan Micrometer:
Four UTSI carbon fibers spun through four different blowing speeds and one
commercial pitch-based (P-25) and one PAN-based carbon fiber, were employed for
fiber size measurement using a laser scan micrometer. The typical fiber diameter
distribution, average diameter, and standard deviation measured from 15 single fibers
for each of these six carbon fibers are shown in Figure 4.1. UTSI carbon fibers present
wider diameter distribution than commercial carbon fibers. In the case of UTSI carbon
fibers, the larger diameter fiber (40 LPM) displays wider diameter distribution than
smaller diameter fiber (100 LPM).
Ten large diameter carbon fibers prepared from same batch of green fiber (40
LPM) but using different stabilization methods were investigated to confirm this diameter

51
non-uniformity. Figure 4.2 shows fiber diameter and fiber cross-sectional area with
deviation. The diameter distribution resembles the distribution of the cross-sectional
area and this is normal because the cross-sectional area is derived from the diameter
readings. All the carbon fibers show spread diameter and cross-sectional area
distribution (large deviation) due to the nature of the spinning method and the precursor
fibers produced at 40 LPM.
It must point out that in despite of laser scan micrometer, which is believed to be
an excellent technique for the dimension measurement, there are still drawbacks for
current methods for the measurement of fiber diameter and fiber cross-sectional area.
More errors exist for a noncircular fiber and fiber with pac-man structures in the
measurement of fiber diameter and cross-sectional area which is used for the
calculation of fiber strength and modulus. There is limitation in the number of fibers
being measured as each tray holds 15 samples and takes around four to six hours to
measure the diameter and perform the tensile test. Fibers are also hand selected (“fiber
selective effect”) from a bundle fiber for diameter and tensile measurements.
To address these problems, further analysis by optical microscope method was
carried out to determine the fiber structure uniformity of a more accurate method.
0
4
8
12
16
20
24
28
32
PAN-C
FP-2
5
100
LPM
80 L
PM
60 L
PM
40 L
PM
Dia
mete
r ( µ
m)
Dis
trib
utio
n
Carbon Fibers
5
10
15
20
25
30
60 L
PM
80 L
PM
100
LPM
P-25
PAN-C
F
Carbon Fiber
40 L
PM
Mean D
iam
ete
r w
ith S
TD
EV
(µm
)
Figure 4.1 Fiber diameter distribution (left) and mean diameter with stdev (right)
comparing four UTSI carbon fibers with commercial carbon fibers.
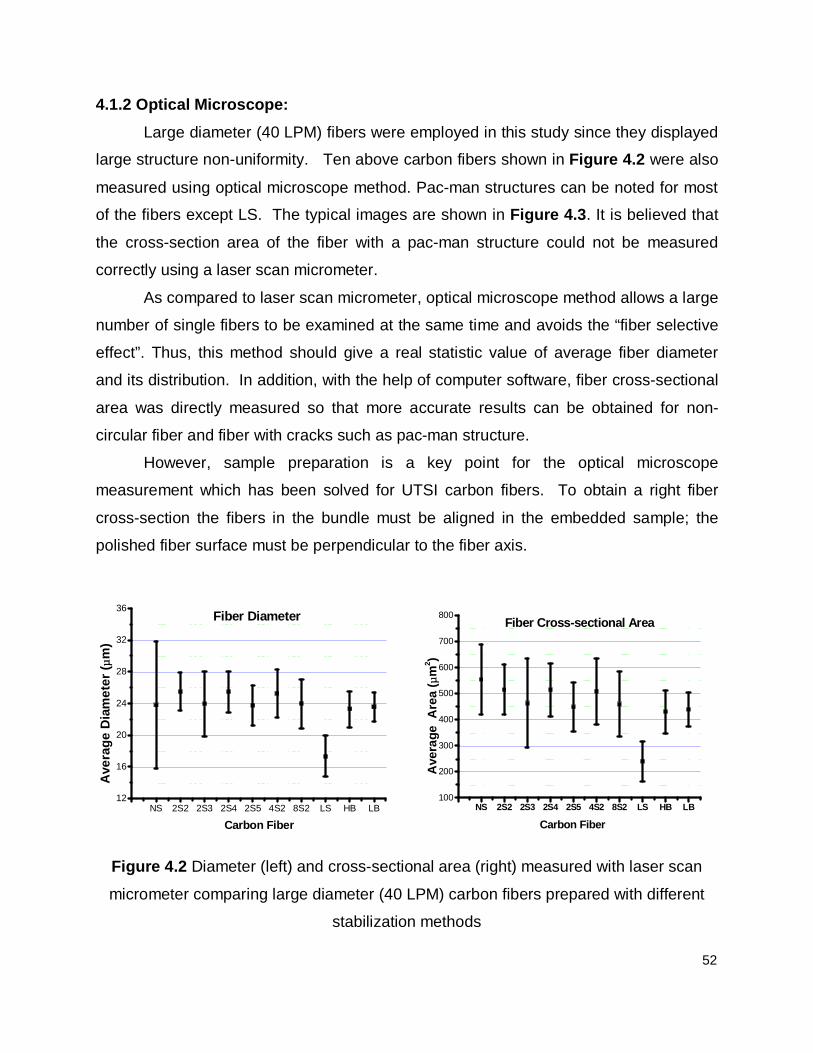
52
4.1.2 Optical Microscope:
Large diameter (40 LPM) fibers were employed in this study since they displayed
large structure non-uniformity. Ten above carbon fibers shown in Figure 4.2 were also
measured using optical microscope method. Pac-man structures can be noted for most
of the fibers except LS. The typical images are shown in Figure 4.3. It is believed that
the cross-section area of the fiber with a pac-man structure could not be measured
correctly using a laser scan micrometer.
As compared to laser scan micrometer, optical microscope method allows a large
number of single fibers to be examined at the same time and avoids the “fiber selective
effect”. Thus, this method should give a real statistic value of average fiber diameter
and its distribution. In addition, with the help of computer software, fiber cross-sectional
area was directly measured so that more accurate results can be obtained for non-
circular fiber and fiber with cracks such as pac-man structure.
However, sample preparation is a key point for the optical microscope
measurement which has been solved for UTSI carbon fibers. To obtain a right fiber
cross-section the fibers in the bundle must be aligned in the embedded sample; the
polished fiber surface must be perpendicular to the fiber axis.
NS 2S2 2S3 2S4 2S5 4S2 8S2 LS HB LB12
16
20
24
28
32
36
Ave
rag
e D
iam
ete
r ( µ
m)
Carbon Fiber
Fiber Diameter
NS 2S2 2S3 2S4 2S5 4S2 8S2 LS HB LB100
200
300
400
500
600
700
800
Ave
rag
e
Are
a (
µm
2)
Carbon Fiber
Fiber Cross-sectional Area
Figure 4.2 Diameter (left) and cross-sectional area (right) measured with laser scan
micrometer comparing large diameter (40 LPM) carbon fibers prepared with different
stabilization methods
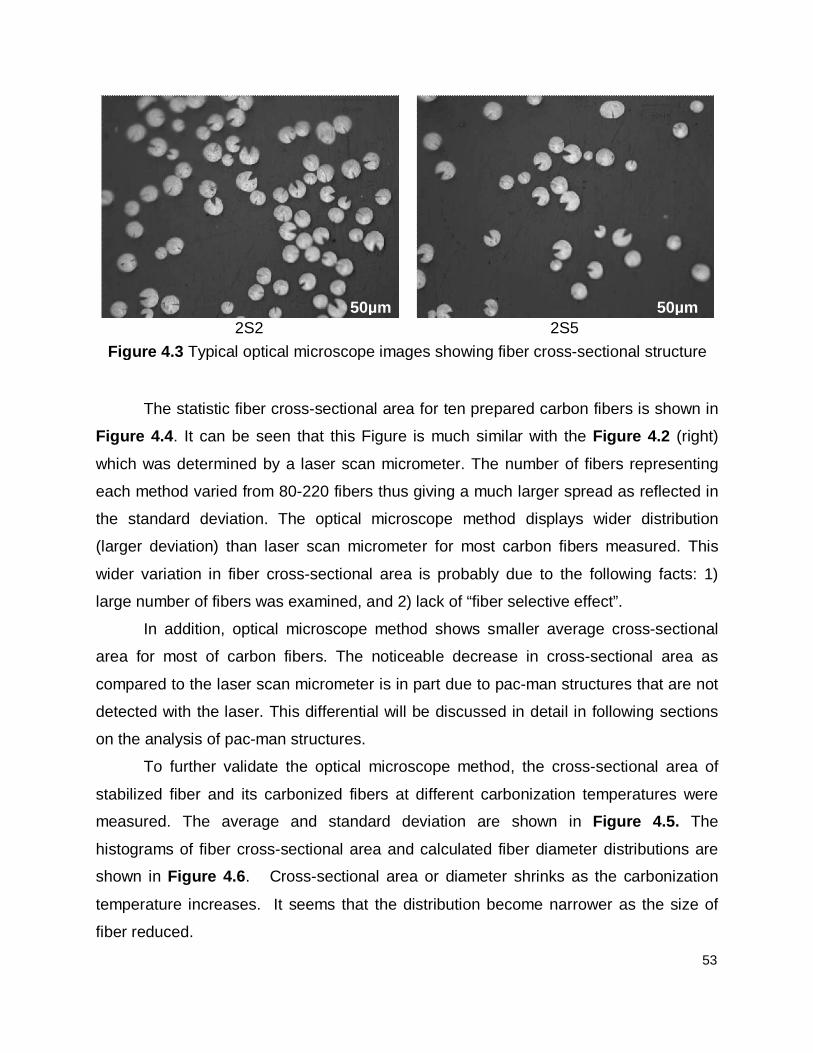
53
2S2 2S5
Figure 4.3 Typical optical microscope images showing fiber cross-sectional structure
The statistic fiber cross-sectional area for ten prepared carbon fibers is shown in
Figure 4.4. It can be seen that this Figure is much similar with the Figure 4.2 (right)
which was determined by a laser scan micrometer. The number of fibers representing
each method varied from 80-220 fibers thus giving a much larger spread as reflected in
the standard deviation. The optical microscope method displays wider distribution
(larger deviation) than laser scan micrometer for most carbon fibers measured. This
wider variation in fiber cross-sectional area is probably due to the following facts: 1)
large number of fibers was examined, and 2) lack of “fiber selective effect”.
In addition, optical microscope method shows smaller average cross-sectional
area for most of carbon fibers. The noticeable decrease in cross-sectional area as
compared to the laser scan micrometer is in part due to pac-man structures that are not
detected with the laser. This differential will be discussed in detail in following sections
on the analysis of pac-man structures.
To further validate the optical microscope method, the cross-sectional area of
stabilized fiber and its carbonized fibers at different carbonization temperatures were
measured. The average and standard deviation are shown in Figure 4.5. The
histograms of fiber cross-sectional area and calculated fiber diameter distributions are
shown in Figure 4.6. Cross-sectional area or diameter shrinks as the carbonization
temperature increases. It seems that the distribution become narrower as the size of
fiber reduced.
50µm 50µm
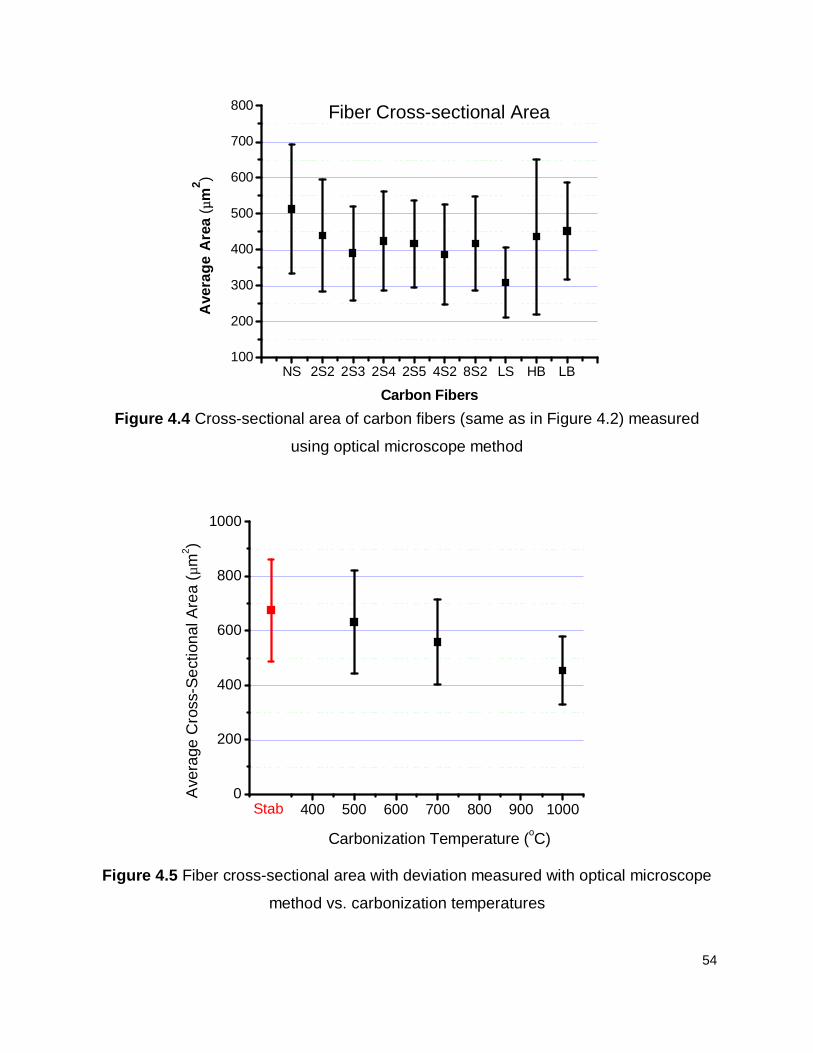
54
NS 2S2 2S3 2S4 2S5 4S2 8S2 LS HB LB100
200
300
400
500
600
700
800
Avera
ge A
rea (
µm
2)
Carbon Fibers
Fiber Cross-sectional Area
Figure 4.4 Cross-sectional area of carbon fibers (same as in Figure 4.2) measured
using optical microscope method
400 500 600 700 800 900 10000
200
400
600
800
1000
Ave
rage C
ross
-Se
ctio
nal A
rea (
µm
2)
Carbonization Temperature (oC)
Stab
Figure 4.5 Fiber cross-sectional area with deviation measured with optical microscope
method vs. carbonization temperatures
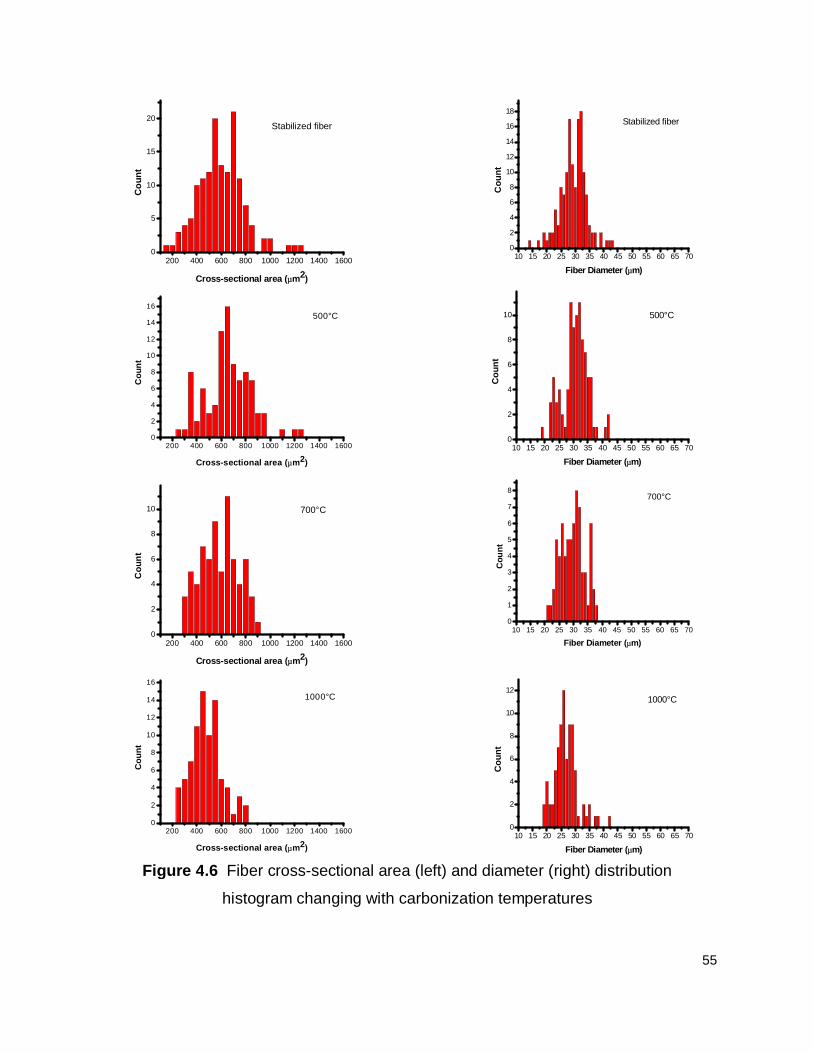
55
200 400 600 800 1000 1200 1400 16000
5
10
15
20
Co
un
t
Cross-sectional area (µm2)
Stabilized fiber
10 15 20 25 30 35 40 45 50 55 60 65 700
2
4
6
8
10
12
14
16
18
Co
un
t
Fiber Diameter (µm)
Stabilized fiber
200 400 600 800 1000 1200 1400 16000
2
4
6
8
10
12
14
16
500°C
Co
un
t
Cross-sectional area (µm2)
10 15 20 25 30 35 40 45 50 55 60 65 700
2
4
6
8
10 500°C
Co
un
t
Fiber Diameter (µm)
200 400 600 800 1000 1200 1400 16000
2
4
6
8
10 700°C
Co
un
t
Cross-sectional area (µm2)
10 15 20 25 30 35 40 45 50 55 60 65 700
1
2
3
4
5
6
7
8700°C
Co
un
t
Fiber Diameter (µm)
200 400 600 800 1000 1200 1400 16000
2
4
6
8
10
12
14
16
1000°C
Co
un
t
Cross-sectional area (µm2) 10 15 20 25 30 35 40 45 50 55 60 65 70
0
2
4
6
8
10
12
1000°C
Co
un
t
Fiber Diameter (µm)
Figure 4.6 Fiber cross-sectional area (left) and diameter (right) distribution
histogram changing with carbonization temperatures
56
4.2 Fiber Diameter Distribution along the Fiber Axis:
Fiber size distribution in a bundle fiber was characterized using a laser scan
micrometer and an optical microscope analysis method and discussed in the above
section. In the following study, fiber diameter distribution along the fiber axis will be
measured in the fiber length of 10 mm with a laser scan micrometer.
4.2.1 Diameter Variation in a Single Fiber:
Samples from UTSI’s 40, 60, 80, and 100 LPM carbon fibers were compared
against commercial pitch (P-25) and PAN-based carbon fibers with the laser scan
micrometer and the results are shown in Figure 4.7 and Figure 4.8. Commercial pitch
(P-25) and PAN-based carbon fibers both have a uniform fiber diameter along the fiber
length. In contrast, the UTSI carbon fibers lack diameter uniformity along the fiber
length. Variations in 40 LPM’s fiber diameter are less dramatic from fiber to fiber and
along the fiber axis as compared to the other spinning methods. 60 LPM has the biggest
spread of fiber diameter along the fiber axis as well as between each fiber sample.
Large diameter variation along the fiber axis could result in nonuniformity of
mechanic properties within a single fiber, but it may be of benefit to the fiber composites
where bamboo-like fiber acts as anchor (physical bonding) to prevent fiber pulled out
from matrix.
4.2.2 3D Plot:
The data obtained from fiber diameter measurement were also used to plot a 3D
image (Figures 4.9 - 4.11) to well demonstrate the structure of carbon fiber. Figure 4.9
shows typical 3D ribbon structures of commercial PAN-based and pitch-based carbon
fibers. Both fibers look smooth along the fiber axis due to their high diameter uniformity.
However, UTSI carbon fibers show more roughness on the surface due to their
lower diameter uniformity along the fiber axis, as shown in Figure 4.10. The larger
diameter carbon fiber (from 40 LPM) shows relatively smooth surface than other fibers.

57
0 1 2 3 4 5 6 7 8 9 10 114
6
8
10
12
14
16
18
20
Position (mm)
Dia
mete
r ( µ
m)
P-25
0 1 2 3 4 5 6 7 8 9 10 114
6
8
10
12
14
16
18
20
Dia
mete
r ( µ
m)
Position (mm)
PAN-CF
Figure 4.7 Typical graphs showing fiber diameter variation in commercial carbon fibers
0 1 2 3 4 5 6 7 8 9 10 114
6
8
10
12
14
16
18
20
22
24
26
28
30
32
Dia
me
ter
( µm
)
Position (mm)
40 LPM
0 1 2 3 4 5 6 7 8 9 10 114
68
10
1214
1618
202224
2628
3032
D
iam
ete
r (µ
m)
Position (mm)
60 LPM
0 1 2 3 4 5 6 7 8 9 10 114
68
10
12
14
16
18
20
22
24
26
28
30
32
Dia
me
ter
(µm
)
Position (mm)
80 LPM
0 1 2 3 4 5 6 7 8 9 10 114
6
8
10
12
14
16
18
20
22
24
26
28
30
32
Dia
me
ter
( µm
)
Position (mm)
UTSI Carbon Fiber (100 LPM)
100 LPM
Figure 4.8 Typical graphs showing fiber diameter variation in four UTSI’s carbon fibers

58
-40
-20
0
20
40
-40
-20
0
20
40
12
34
56
78
910
Pos
ition
(mm
)
Dia
me
ter
(µm
)
Diameter (µm)
P-25
-40
-20
0
20
40
-40
-20
0
20
40
12
34
56
78
910
Pos
ition
(mm
)
Dia
me
ter
(µm
)
Diameter (µm)
PAN-CF
Figure 4.9 Typical ribbon graphs showing 3D structures of commercial carbon fibers
-40
-20
0
20
40
-40
-20
0
20
40
12
34
56
78
910
Pos
ition
(mm
)
Dia
me
ter
(µm
)
Diameter (µm)
40LPM
-40
-20
0
20
40
-40
-20
0
20
40
12
34
56
78
910
Pos
ition
(mm
)
Dia
me
ter
(µm
)
Diameter (µm)
60LPM
-40
-20
0
20
40
-40
-20
0
20
40
12
34
56
78
910
Posit
ion (m
m)
Dia
me
ter
(µm
)
Diameter (µm)
80LPM
-40
-20
0
20
40
-40
-20
0
20
40
12
34
56
78
910
Pos
ition
(mm
)
Dia
me
ter
(µm
)
Diameter (µm)
100LPM
Figure 4.10 Typical ribbon graphs showing 3D structures of four UTSI’s carbon fibers
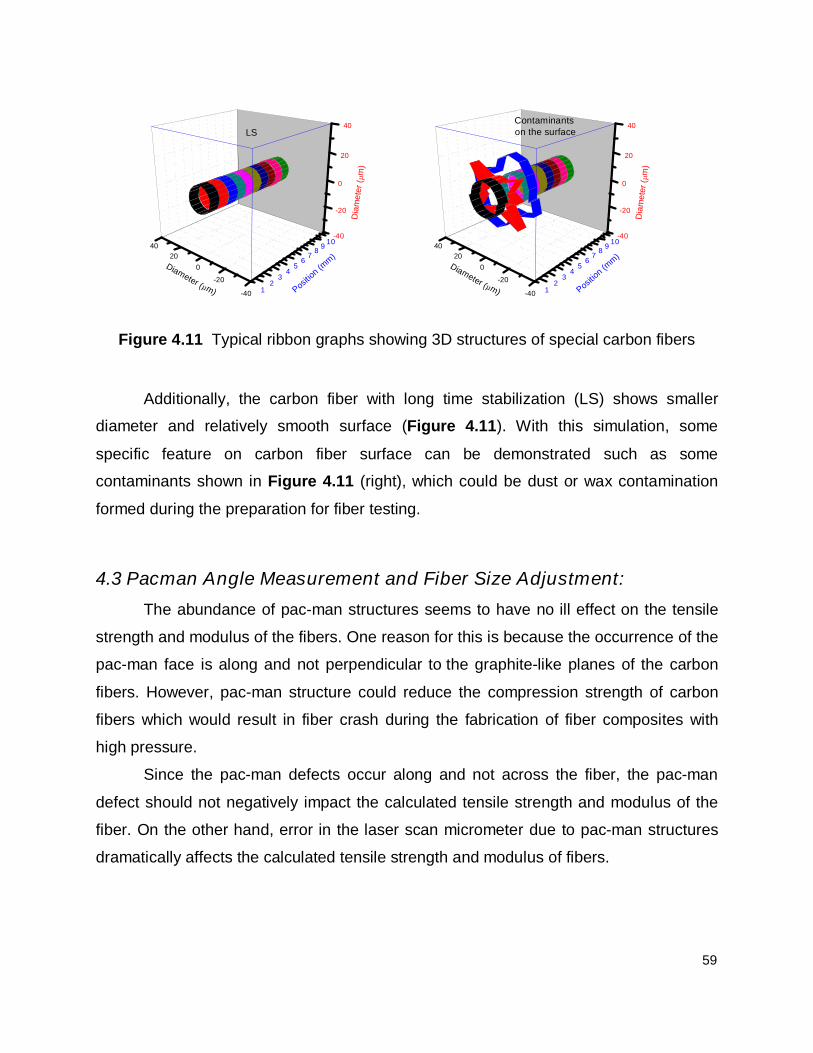
59
-40
-20
0
20
40
-40
-20
0
20
40
12
34
56
78
910
Pos
ition
(mm
)
Dia
me
ter
(µm
)
Diameter (µm)
LS
-40
-20
0
20
40
-40
-20
0
20
40
12
34
56
78
910
Pos
ition
(mm
)
Dia
me
ter
(µm
)
Diameter (µm)
Contaminants on the surface
Figure 4.11 Typical ribbon graphs showing 3D structures of special carbon fibers
Additionally, the carbon fiber with long time stabilization (LS) shows smaller
diameter and relatively smooth surface (Figure 4.11). With this simulation, some
specific feature on carbon fiber surface can be demonstrated such as some
contaminants shown in Figure 4.11 (right), which could be dust or wax contamination
formed during the preparation for fiber testing.
4.3 Pacman Angle Measurement and Fiber Size Adjustment:
The abundance of pac-man structures seems to have no ill effect on the tensile
strength and modulus of the fibers. One reason for this is because the occurrence of the
pac-man face is along and not perpendicular to the graphite-like planes of the carbon
fibers. However, pac-man structure could reduce the compression strength of carbon
fibers which would result in fiber crash during the fabrication of fiber composites with
high pressure.
Since the pac-man defects occur along and not across the fiber, the pac-man
defect should not negatively impact the calculated tensile strength and modulus of the
fiber. On the other hand, error in the laser scan micrometer due to pac-man structures
dramatically affects the calculated tensile strength and modulus of fibers.
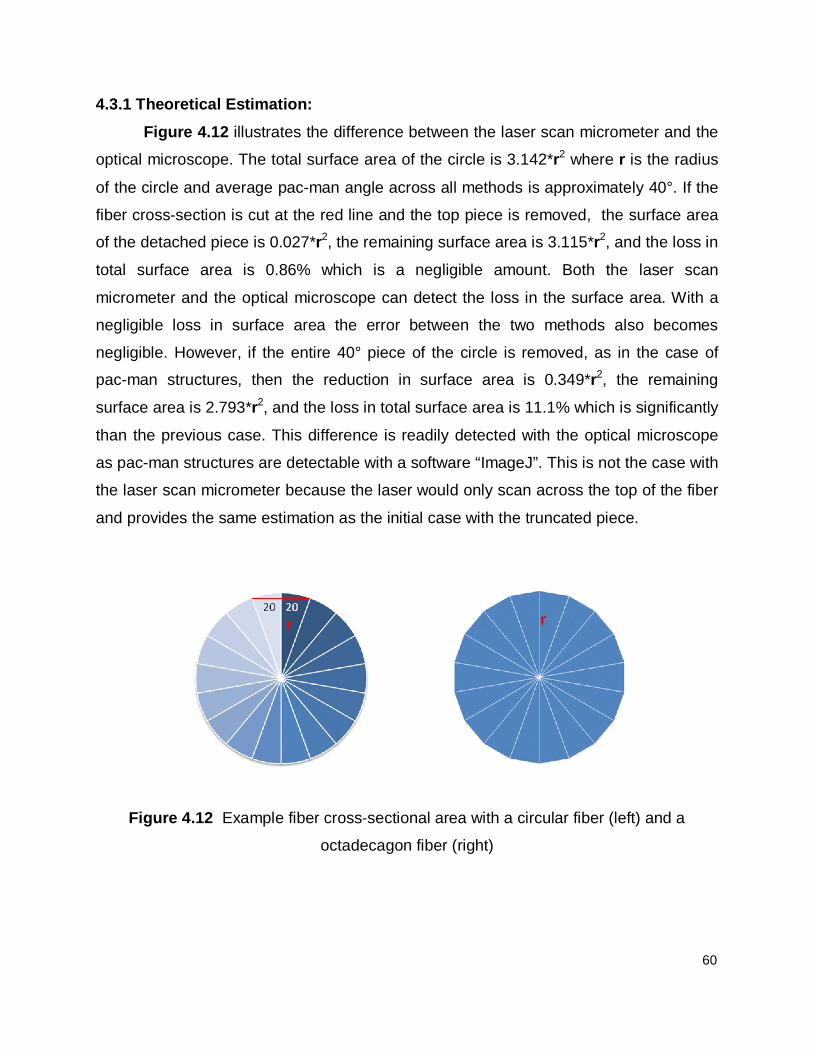
60
4.3.1 Theoretical Estimation:
Figure 4.12 illustrates the difference between the laser scan micrometer and the
optical microscope. The total surface area of the circle is 3.142*r2 where r is the radius
of the circle and average pac-man angle across all methods is approximately 40°. If the
fiber cross-section is cut at the red line and the top piece is removed, the surface area
of the detached piece is 0.027*r2, the remaining surface area is 3.115*r2, and the loss in
total surface area is 0.86% which is a negligible amount. Both the laser scan
micrometer and the optical microscope can detect the loss in the surface area. With a
negligible loss in surface area the error between the two methods also becomes
negligible. However, if the entire 40° piece of the circle is removed, as in the case of
pac-man structures, then the reduction in surface area is 0.349*r2, the remaining
surface area is 2.793*r2, and the loss in total surface area is 11.1% which is significantly
than the previous case. This difference is readily detected with the optical microscope
as pac-man structures are detectable with a software “ImageJ”. This is not the case with
the laser scan micrometer because the laser would only scan across the top of the fiber
and provides the same estimation as the initial case with the truncated piece.
Figure 4.12 Example fiber cross-sectional area with a circular fiber (left) and a
octadecagon fiber (right)
r r

61
The other source of error is the degree of rotation for the fiber. For this
experiment the diameter reading was taken at every 20° rotation by the laser scan
micrometer. Figure 4.12 (right) shows an Octadecagon with radius r. If the
Octadecagon is aligned properly with the laser as shown then the diameter reading
would be 2*r with a surface area of 3.142*r2. However, if the Octadecagon is rotated by
10° the new diameter reading would be 1.97*r resulting in a surface area of 3.047* r2
instead of 3.142*r2. Fiber alignment and radial defects becomes an issue for all non-
circular objects observed with the laser scan micrometer. Since the UTSI carbon fibers
exhibit both of these characteristics, the laser scan micrometer is prone to error
providing overestimated surface areas for the tensile strength and modulus calculations.
4.3.2 Pacman Angle:
Pac-man angles were measured for seven carbon fibers made using one, two,
four, and eight step stabilization methods. The angle average and standard deviation
are listed in Figure 4.13 and compared against the average cross-sectional areas
measured with the laser scan micrometer and optical microscope method, respectively.
NS 2S2 2S3 2S4 2S5 4S2 8S220
30
40
50
60
70
80
Ave
rag
e C
ross
-sectio
nal A
rea (
µm
2)
Ang
le A
vera
ge (
deg
ree
s)
Carbon Fiber
0
100
200
300
400
500
600
Laser Average Optical Average
Figure 4.13 Pac-man angle vs. cross-sectional area
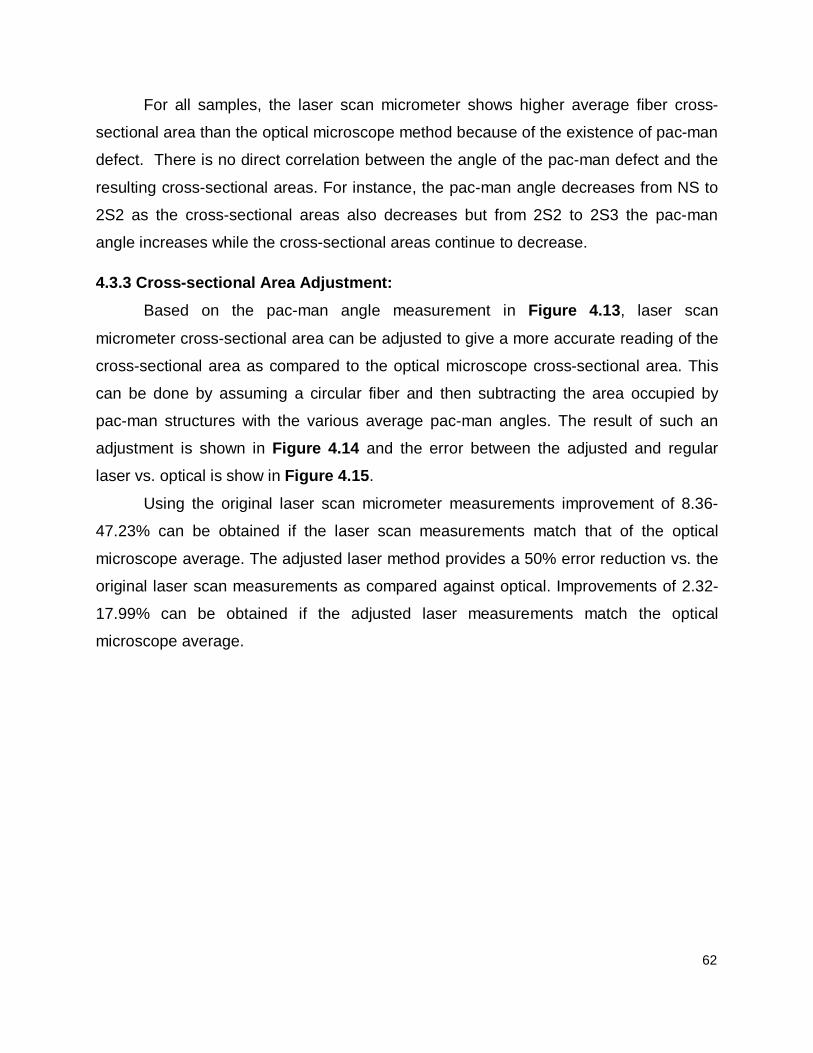
62
For all samples, the laser scan micrometer shows higher average fiber cross-
sectional area than the optical microscope method because of the existence of pac-man
defect. There is no direct correlation between the angle of the pac-man defect and the
resulting cross-sectional areas. For instance, the pac-man angle decreases from NS to
2S2 as the cross-sectional areas also decreases but from 2S2 to 2S3 the pac-man
angle increases while the cross-sectional areas continue to decrease.
4.3.3 Cross-sectional Area Adjustment:
Based on the pac-man angle measurement in Figure 4.13, laser scan
micrometer cross-sectional area can be adjusted to give a more accurate reading of the
cross-sectional area as compared to the optical microscope cross-sectional area. This
can be done by assuming a circular fiber and then subtracting the area occupied by
pac-man structures with the various average pac-man angles. The result of such an
adjustment is shown in Figure 4.14 and the error between the adjusted and regular
laser vs. optical is show in Figure 4.15.
Using the original laser scan micrometer measurements improvement of 8.36-
47.23% can be obtained if the laser scan measurements match that of the optical
microscope average. The adjusted laser method provides a 50% error reduction vs. the
original laser scan measurements as compared against optical. Improvements of 2.32-
17.99% can be obtained if the adjusted laser measurements match the optical
microscope average.

63
Figure 4.14 Cross-sectional areas of laser, optical, and laser adjusted average
Figure 4.15 Adjusted and laser error
0
100
200
300
400
500
600
700
NS 2S2 2S3 2S4 2S5 4S2 8S2
Cro
ss-s
ect
ion
al A
rea
(µm
2 )
Carbon Fiber
Laser Average Laser Adjusted Average Optical Average
0%
5%
10%
15%
20%
25%
30%
35%
NS 2S2 2S3 2S4 2S5 4S2 8S2
Pe
rce
nta
ge e
rro
r vs
. Op
tica
l
Carbon Fiber
Adjusted error Laser error
64
Chapter 5: Preliminary Study on Carbon Fiber Sandwiched
Composites (CFSCs)
In the Chapters 3 and 4, the structure and properties characterization of carbon
fibers indicates that UTSI carbon fiber exhibits some unusual structural characteristic.
How to use this novel carbon fiber is of great interest to our current research. A previous
study performed by UTSI carbon fiber research group indicated that the fabrication of
UTSI carbon fiber composite with different polymer resins is relatively simple due to its
special fiber form. The prepared composites have low density and a high electrical
conductivity [17, 22-25]. In this Chapter, a preliminary research on carbon fiber
sandwiched composites (CFSCs) was carried out by utilizing the UTSI and commercial
PAN-based carbon fibers.
A sandwich structured composite is usually fabricated by attaching two thin and
stiff skins to a thick lightweight core. The core material is normally a low strength
material but the higher thickness provides the sandwich composite with high bending
stiffness while maintaining a low overall density. Sandwich structured composites
(SSCs) have been widely used in aerospace structures, ship building, infrastructure,
due to their light weight and high strength to weight ratio.
The study on CFSCs is to fabricate sandwich structured composites using UTSI,
mesophase pitch-based carbon fiber composites as core materials and single layer of
commercially available PAN-based carbon fabric composites as skin materials. The
result should be a new sandwich composite that has high bending stiffness, and a low
overall density.
5.1. Structure:
UTSI carbon fiber sandwiched composites (CFSCs) have a similar structure with
commercial sandwich structured composites but with a solid core as shown in Table
5.1. Since the core and skin fibers were fabricated to CFSCs at same time under a high
pressure, this process is much simpler than the conventional (multi-step) methods for
the sandwich fabrication.
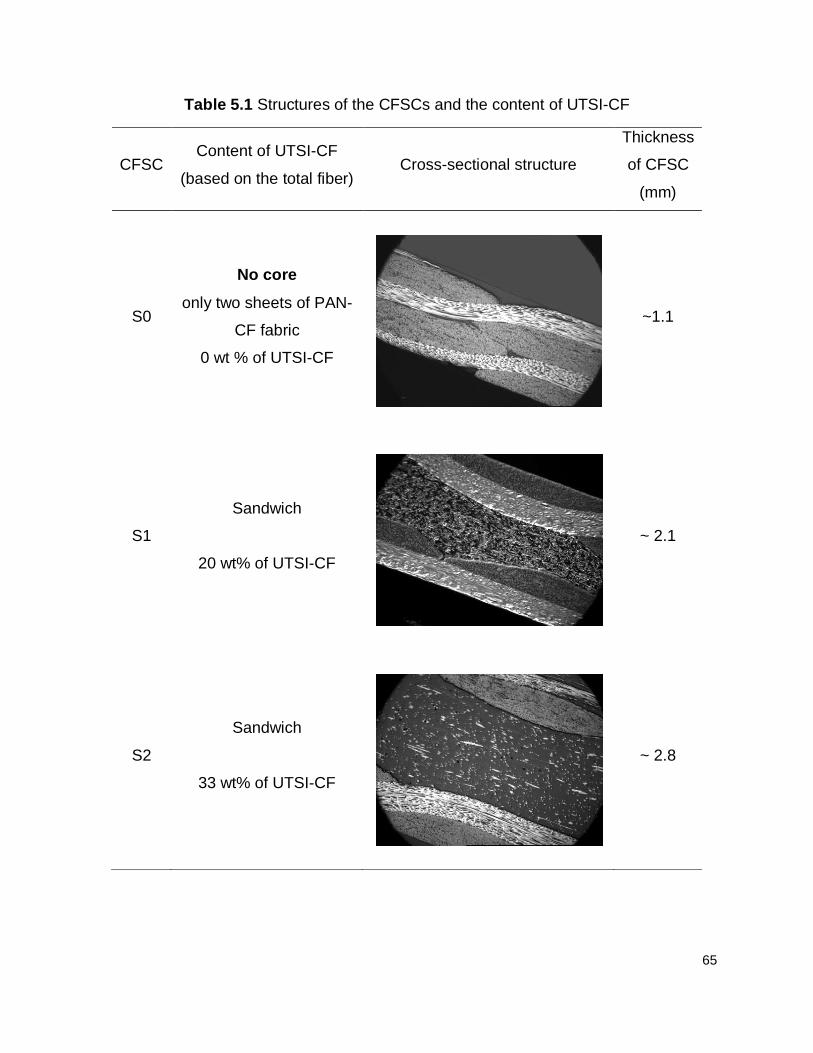
65
Table 5.1 Structures of the CFSCs and the content of UTSI-CF
CFSC Content of UTSI-CF
(based on the total fiber) Cross-sectional structure
Thickness
of CFSC
(mm)
S0
No core
only two sheets of PAN-
CF fabric
0 wt % of UTSI-CF
~1.1
S1
Sandwich
20 wt% of UTSI-CF
~ 2.1
S2
Sandwich
33 wt% of UTSI-CF
~ 2.8
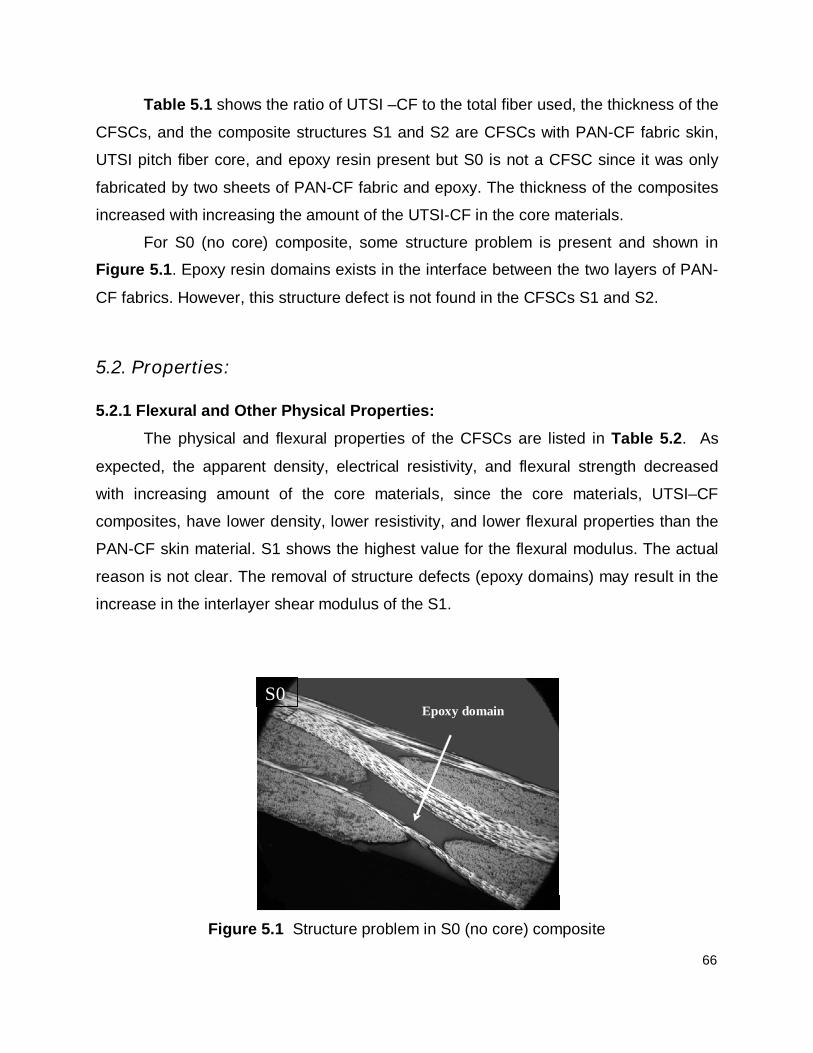
66
Table 5.1 shows the ratio of UTSI –CF to the total fiber used, the thickness of the
CFSCs, and the composite structures S1 and S2 are CFSCs with PAN-CF fabric skin,
UTSI pitch fiber core, and epoxy resin present but S0 is not a CFSC since it was only
fabricated by two sheets of PAN-CF fabric and epoxy. The thickness of the composites
increased with increasing the amount of the UTSI-CF in the core materials.
For S0 (no core) composite, some structure problem is present and shown in
Figure 5.1. Epoxy resin domains exists in the interface between the two layers of PAN-
CF fabrics. However, this structure defect is not found in the CFSCs S1 and S2.
5.2. Properties:
5.2.1 Flexural and Other Physical Properties:
The physical and flexural properties of the CFSCs are listed in Table 5.2. As
expected, the apparent density, electrical resistivity, and flexural strength decreased
with increasing amount of the core materials, since the core materials, UTSI–CF
composites, have lower density, lower resistivity, and lower flexural properties than the
PAN-CF skin material. S1 shows the highest value for the flexural modulus. The actual
reason is not clear. The removal of structure defects (epoxy domains) may result in the
increase in the interlayer shear modulus of the S1.
Figure 5.1 Structure problem in S0 (no core) composite
Epoxy domain
S0
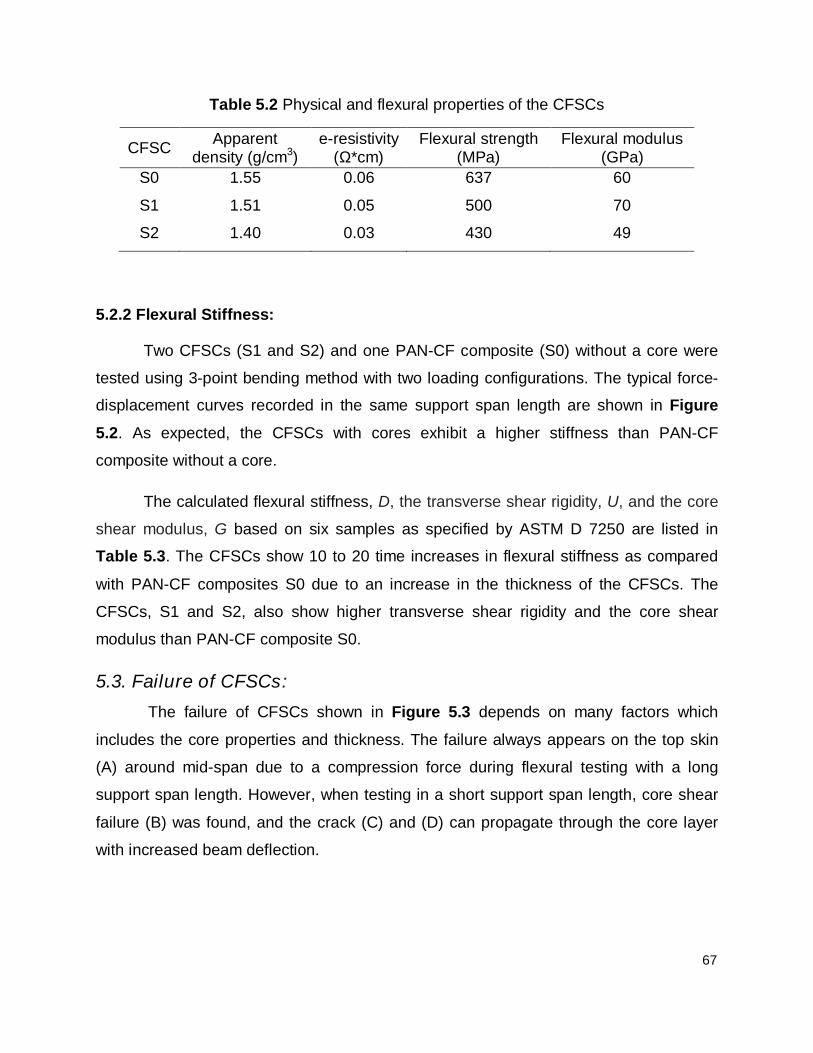
67
Table 5.2 Physical and flexural properties of the CFSCs
CFSC Apparent
density (g/cm3) e-resistivity
(Ω*cm) Flexural strength
(MPa) Flexural modulus
(GPa)
S0 1.55 0.06 637 60
S1 1.51 0.05 500 70
S2 1.40 0.03 430 49
5.2.2 Flexural Stiffness:
Two CFSCs (S1 and S2) and one PAN-CF composite (S0) without a core were
tested using 3-point bending method with two loading configurations. The typical force-
displacement curves recorded in the same support span length are shown in Figure
5.2. As expected, the CFSCs with cores exhibit a higher stiffness than PAN-CF
composite without a core.
The calculated flexural stiffness, D, the transverse shear rigidity, U, and the core
shear modulus, G based on six samples as specified by ASTM D 7250 are listed in
Table 5.3. The CFSCs show 10 to 20 time increases in flexural stiffness as compared
with PAN-CF composites S0 due to an increase in the thickness of the CFSCs. The
CFSCs, S1 and S2, also show higher transverse shear rigidity and the core shear
modulus than PAN-CF composite S0.
5.3. Failure of CFSCs:
The failure of CFSCs shown in Figure 5.3 depends on many factors which
includes the core properties and thickness. The failure always appears on the top skin
(A) around mid-span due to a compression force during flexural testing with a long
support span length. However, when testing in a short support span length, core shear
failure (B) was found, and the crack (C) and (D) can propagate through the core layer
with increased beam deflection.
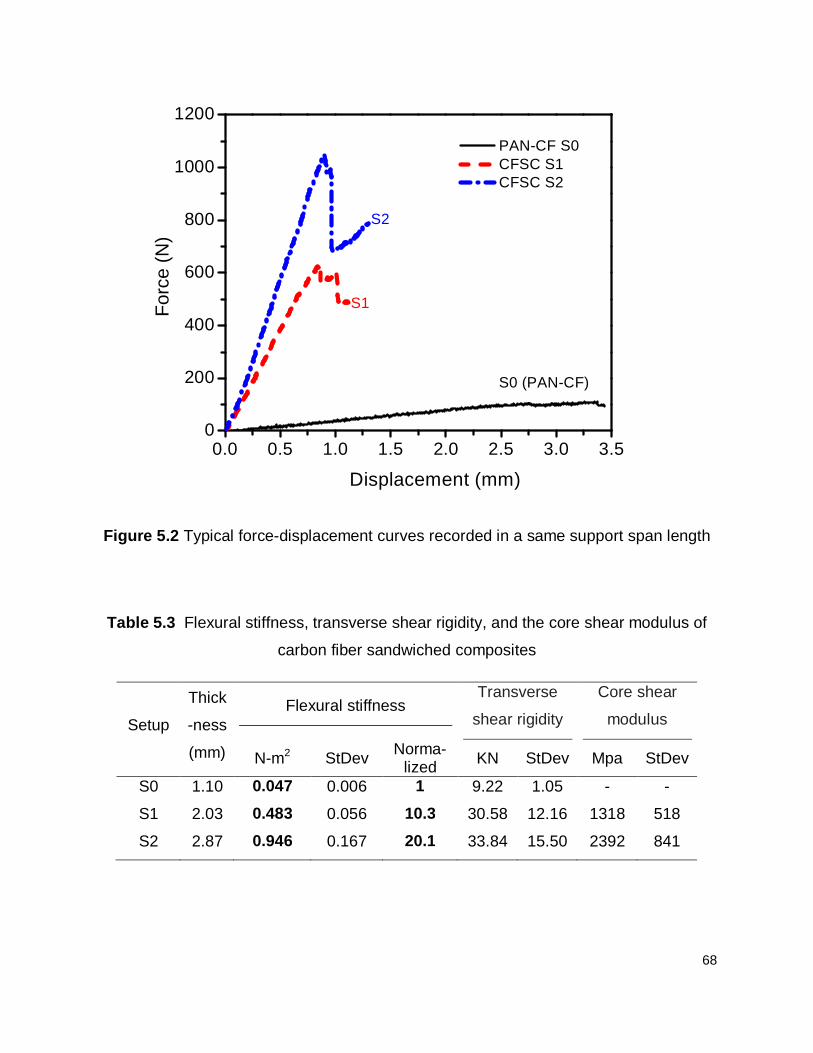
68
0.0 0.5 1.0 1.5 2.0 2.5 3.0 3.50
200
400
600
800
1000
1200
PAN-CF S0 CFSC S1 CFSC S2
S2
S1
Fo
rce
(N
)
Displacement (mm)
S0 (PAN-CF)
Figure 5.2 Typical force-displacement curves recorded in a same support span length
Table 5.3 Flexural stiffness, transverse shear rigidity, and the core shear modulus of
carbon fiber sandwiched composites
Setup
Thick
-ness
(mm)
Flexural stiffness Transverse
shear rigidity
Core shear
modulus
N-m2 StDev Norma-
lized KN StDev Mpa StDev
S0 1.10 0.047 0.006 1 9.22 1.05 - -
S1 2.03 0.483 0.056 10.3 30.58 12.16 1318 518
S2 2.87 0.946 0.167 20.1 33.84 15.50 2392 841
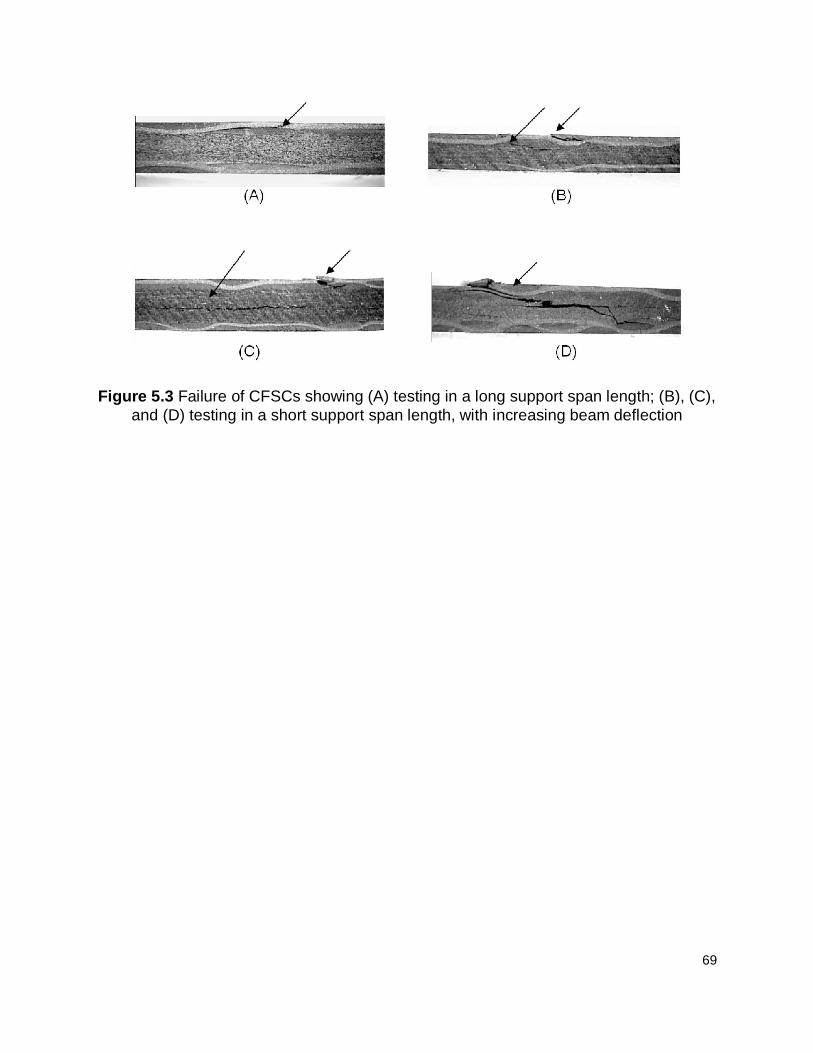
69
Figure 5.3 Failure of CFSCs showing (A) testing in a long support span length; (B), (C), and (D) testing in a short support span length, with increasing beam deflection

70
Chapter 6: Conclusion
In this study, pitch-based carbon fiber and its composites were prepared and
their structure and properties were characterized using various techniques such as,
optical microscope, Dia-stron, SEM, MTS and software ImageJ. Three aspects of
research activity were carried out to elucidate the relationship among process, structure,
and property in the manufacturing of carbon fiber and its composites. The first and main
focus of this work is the effect of thermal process on structure and properties of fibers;
the second is the characterization of carbon fiber structure uniformity; and the third is a
preliminary work on carbon fiber sandwiched composites.
Carbon fibers were prepared from solvated mesophase pitch fibers (green fibers)
through stabilization (dry and oxidation in air) and carbonization (in N2) processes. The
resulting carbon fibers show higher carbon yield of ~ 75 wt % (or ~ 87 wt% if
disregarding the solvents). Fiber diameter mainly depends on the melt blowing speeds
in the fiber spinning process. It is also affected by the thermal processes and reduces
with increasing carbonization temperatures.
Pac-man structure was observed during the carbonization processes. It develops
at 600°C and the angle becomes larger as the carbonization temperatures increased. It
was found that pac-man structure is easily formed in larger diameter fiber. It is also
affected by stabilization conditions. In the case of larger diameter fiber, sheath-core
structure are observed in the stabilized fiber due to controlled diffusion of oxidation.
Such sheath-core structure can relate with the appearance of pac-man structure of the
resulting carbon fibers. Long time, fully stabilized fiber or small diameter fiber doesn’t
show any sheath-core structure, as a result, no pac-man structure is observed after
carbonization.
Hollow carbon fiber was obtained from very short time stabilized fiber. The core
without drying and oxidation melts to form a hollow core during the carbonization
process.
Mechanical properties of the resulting carbon fibers strongly depended on the
stabilization processes including the stabilization methods, temperatures, and duration.

71
There is a significant improvement from the one to two-step stabilization and then
additional improvements were made from two to four-step and four to eight-step
stabilization. The multi-step stabilization could give the various reactions that occur
during stabilization at different stabilization temperatures sufficient time to react at each
temperature range. Stabilization time was a critical factor. The tensile strength and
modulus improved as the stabilization duration increased. However, too long
stabilization results the decrease in tensile strength due to the over oxidation.
Temperature range bias experiments confirmed that giving the lower temperature range
more stabilization time resulted in carbon fibers with higher mechanical properties.
Structure uniformity of carbon fibers were determined with two different methods
namely, laser scan micrometer and optical microscope. UTSI carbon fiber presents
wider distribution in fiber diameter (cross-sectional area) for a bundle fiber or along a
single fiber than commercial pitch and PAN-based carbon fibers. Optical microscope
method is better than laser scan micrometer to measure and statistically analyze the
fiber diameter (cross-sectional area) and its distribution, especially for noncircular fiber
or fiber with pac-man structure. 3-D plot obtained from laser scan micrometer data can
well demonstrate the fiber diameter and its uniformity.
In the case of large diameter fiber, the existence of pac-man structures in carbon
fibers accounts for a significant portion in cross-sectional area. The inability to detect
such axial defects by the laser scan micrometer presents a certain degree of error in the
estimation of the actual tensile strength and modulus of individual fibers. The actual
cross-sectional area was determined with optical microscope and pac-man angle
measurement. Statistical analysis reveals that an additional 8.36-47.23% improvement
in mechanical properties can be obtained if the cross-sectional area measured with
laser scan micrometer be adjusted with a factor.
Carbon fiber sandwiched composites (CFSCs) were fabricated by using UTSI
carbon fiber as a core material and commercial PAN-based carbon fiber as skin
materials. The fabrication process is simple. The CFSC is of solid core structure. The
comprehensive properties were obtained including high flexural strength and modulus,
lower density, high electrical conductivity, and a great improvement in flexural stiffness.

72
References

73
1. Peter Morgan, Carbon fibers and their Composites, CRC Press, Taylor &
Francis Group, LLC, 2005, p269
2. http://inventors.about.com/library/inventors/bllight2.htm
3. John D. Russell, Composites Affordability Initiative: Transitioning Advanced
Aerospace Technologies through Cost and Risk Reduction, The AMMTIAC
Quarterly, Volume 1, Number 3, 3-6.
4. http://news.thomasnet.com/IMT/archives/2006/10/aircraft_design_king_of_sky_b
oeing_dreamliner_versus_airbus_a350xwb.html
5. Cohn, S. M. and S. Das, A Cost Assessment of PAN Carbon Fiber Production
Technologies: Conventional and Microwave Cases, draft paper, Oak Ridge
National Laboratory, Oak Ridge, TN, Feb. 1999.
6. Bunsell, A. R., Fibre Reinforcements for Composite Materials, Amsterdam, The
Netherlands: Elsevier Science Publishers B.V., 1988, p. 90.
7. Vakili, A., Low Cost Mesophase Pitch-based Carbon Fiber, TANCON 2006,
Knoxville, TN.
8. Fei, Y., Meganathan A. and Vakili, A., Structure of Mesophase Pitch-Based
Carbon Fibers Produced via Melt Blow-Spinning, Carbon Conference, 2007.
9. Deborah D. L. Chung, Carbon fiber composites, Butterworth-Heinemann, 1994
10. Daniel Gay, Suong V. Hoa, Stephen W. Tsai, Composite materials design and
applications, CRC PRESS 2003.
11. Vinson, J.R., Sandwich structures: Past, present, and future, Sandwich
Structures 7: Advancing with Sandwich Structures and Materials, 2005, page 3–
12. Proceedings of the 7th International Conference on Sandwich Structures,
Aalborg University, Aalborg, Denmark, 29-31 August 2005. Edited by O.T.
Thomsen et al. Published by Springer 2005
12. Matsumoto, T., and Mochida, I. Oxygen Distribution in Oxidatively Stabilized
Mesophase Pitch Fiber. Carbon, Vol.31, No.1, pp.143-147, 1993.

74
13. Liedtke, V., and Huttinger, K.J. Mesophase Pitches as Matrix Precursor of
Carbon Fiber reinforced Carbon: II. Stabilization of Mesophase Pitch Matrix by
Oxygen Treatment. Carbon, Vol.35, No.9, pp.1067-1079, 1996.
14. Singer, L.S., and Mitchell, S. Diffusion of Oxygen into Pitch. Carbon, Vol.35,
No.5, pp.599-604, 1997.
15. Blanco, C., Lu, S., Appleyard, S.P., and Rand, B. The stabilisation of carbon
fibres studied by micro-thermal analysis. Carbon, Vol.42, pp.165-171, 2003.
16. Oak Ridge Workshop Results, Low cost carbon fiber composites for energy
applications, March 3-4, 2009.
17. Vakili, A., Yue, Z., Fei, Y., Cochran, H., Allen, L., and Duran, M. Pitch based
carbon fiber processing and composites. SAMPE 2007, Baltimore, MD, June 3-
June 7, 2007.
18. Duran, Matthew P., Production and Optimization of Continuous Roving-like UTSI
Pitch-based Carbon Fiber Composites. Masters of Science in Mechanical
Engineering, The University of Tennessee, August 2009
19. FTA final report, Low Cost Carbon Fiber Technology Development for Carbon
Fiber Composite Applications, FTA Project Number: TN-26-7028-2007.1, August
31, 2007
20. Carbon fibers and their Composites, Peter Morgan, 2005, Chapter 4, page 121
21. Yoon, S.H., Korai,Y. and Mochida, I. Assessment and Optimization of the
Stabilization Process of Mesophase Pitch Fibers by Thermal Analyses. Carbon,
Vol.32, No.2, pp. 281-287, 1994.
22. Yue, Z., Duran, M.P., Vakili, A., Fabrication of low-cost composites using roving-
like mesophase pitch-based carbon fibers, ICCE-17 proceedings, Page 1171,
July 26-August 1, 2009. Honolulu, Hawaii, USA
23. Vakili A, Yue Z, and Matthew DP., Influence of fiber surface treatments on low-
cost carbon fiber composites, ICCE-17 proceedings, Page 1061, 17th
75
International Conference on Composites or Nano Engineering, July 26-August 1,
2009. Honolulu, Hawaii, USA.
24. Yue, Z, Vakili, A, and Liu, C., Characteristics of Melt-blow Spun Solvated
Mesophase Pitch-based carbon Fiber and its Composites, Carbon 2010
proceedings, ID 651, The Annual World Conference on Carbon, July 11-16,
2010, Clemson University, SC, USA.
25. Yue, Z, Vakili, A, and Liu, C., Fabrication and Characterization of Lightweight,
Cost-effective Carbon Fiber Sandwiched Composites, Accepted by SAMPE
2010, Salt Lake City, UT, Oct.11-14, 2010.

76
Vita
Chang Liu was born in Beijing, China on January 29th of 1986. He received his
Bachelor of Science from Georgia Institute of Technology in May of 2008 in Industrial
and Systems Engineering. From there he came to University of Tennessee Space
Institute in pursuit of a Master of Science in Material Science Engineering on August of
2008.
He is currently planning a long vacation from academia and the decadent
economy after obtaining the Masters of Science to travel the world in pursuit of things
other than knowledge and money.