MERO: A Statistical Approach for Hardware Trojan Detection · MERO: A Statistical Approach for...
15
MERO : A Statistical Approach for Hardware Trojan Detection Rajat Subhra Chakraborty , Francis Wolff, Somnath Paul, Christos Papachristou, and Swarup Bhunia Department of Electrical Engineering and Computer Science, Case Western Reserve University, Cleveland OH–44106, USA [email protected] Abstract. In order to ensure trusted in–field operation of integrated circuits, it is important to develop efficient low–cost techniques to detect malicious tampering (also referred to as Hardware Trojan ) that causes undesired change in functional behavior. Conventional post– manufacturing testing, test generation algorithms and test coverage met- rics cannot be readily extended to hardware Trojan detection. In this paper, we propose a test pattern generation technique based on multiple excitation of rare logic conditions at internal nodes. Such a statistical ap- proach maximizes the probability of inserted Trojans getting triggered and detected by logic testing, while drastically reducing the number of vectors compared to a weighted random pattern based test generation. Moreover, the proposed test generation approach can be effective towards increasing the sensitivity of Trojan detection in existing side–channel ap- proaches that monitor the impact of a Trojan circuit on power or current signature. Simulation results for a set of ISCAS benchmarks show that the proposed test generation approach can achieve comparable or better Trojan detection coverage with about 85% reduction in test length on average over random patterns. 1 Introduction The issue of Trust is an emerging problem in semiconductor integrated cir- cuit (IC) security [1,2,3,8] This issue has become prominent recently due to widespread outsourcing of the IC manufacturing processes to untrusted foundries in order to reduce cost. An adversary can potentially tamper a design in these fabrication facilities by the insertion of malicious circuitry. On the other hand, third-party CAD tools as well as hardware intellectual property (IP) modules used in a design house also pose security threat in terms of incorporating mali- cious circuit into a design [3]. Such a malicious circuit, referred to as a Hardware Trojan, can trigger and affect normal circuit operation, potentially with catas- trophic consequences in critical applications in the domains of communications, space, military and nuclear facilities. The work is funded in part by a DoD seedling grant FA-8650-08-1-7859. Corresponding author. C. Clavier and K. Gaj (Eds.): CHES 2009, LNCS 5747, pp. 396–410, 2009. c International Association for Cryptologic Research 2009
Transcript of MERO: A Statistical Approach for Hardware Trojan Detection · MERO: A Statistical Approach for...

MERO: A Statistical Approach for Hardware
Trojan Detection�
Rajat Subhra Chakraborty��, Francis Wolff, Somnath Paul,Christos Papachristou, and Swarup Bhunia
Department of Electrical Engineering and Computer Science,Case Western Reserve University, Cleveland OH–44106, USA
Abstract. In order to ensure trusted in–field operation of integratedcircuits, it is important to develop efficient low–cost techniques to detectmalicious tampering (also referred to as Hardware Trojan) that causesundesired change in functional behavior. Conventional post–manufacturing testing, test generation algorithms and test coverage met-rics cannot be readily extended to hardware Trojan detection. In thispaper, we propose a test pattern generation technique based on multipleexcitation of rare logic conditions at internal nodes. Such a statistical ap-proach maximizes the probability of inserted Trojans getting triggeredand detected by logic testing, while drastically reducing the number ofvectors compared to a weighted random pattern based test generation.Moreover, the proposed test generation approach can be effective towardsincreasing the sensitivity of Trojan detection in existing side–channel ap-proaches that monitor the impact of a Trojan circuit on power or currentsignature. Simulation results for a set of ISCAS benchmarks show thatthe proposed test generation approach can achieve comparable or betterTrojan detection coverage with about 85% reduction in test length onaverage over random patterns.
1 Introduction
The issue of Trust is an emerging problem in semiconductor integrated cir-cuit (IC) security [1,2,3,8] This issue has become prominent recently due towidespread outsourcing of the IC manufacturing processes to untrusted foundriesin order to reduce cost. An adversary can potentially tamper a design in thesefabrication facilities by the insertion of malicious circuitry. On the other hand,third-party CAD tools as well as hardware intellectual property (IP) modulesused in a design house also pose security threat in terms of incorporating mali-cious circuit into a design [3]. Such a malicious circuit, referred to as a HardwareTrojan, can trigger and affect normal circuit operation, potentially with catas-trophic consequences in critical applications in the domains of communications,space, military and nuclear facilities.
� The work is funded in part by a DoD seedling grant FA-8650-08-1-7859.�� Corresponding author.
C. Clavier and K. Gaj (Eds.): CHES 2009, LNCS 5747, pp. 396–410, 2009.c© International Association for Cryptologic Research 2009

MERO : A Statistical Approach for Hardware Trojan Detection 397
(a) Generic comb. Trojan (b) Generic sequential Trojan
(c) Comb. Trojan example (d) Sequential Trojan example
Fig. 1. Generic model for combinational and sequential Trojan circuits and correspond-ing examples
An intelligent adversary will try to hide such tampering of IC’s functionalbehavior in a way that makes it extremely difficult to detect with conventionalpost–manufacturing test [3]. Intuitively, it means that the adversary would en-sure that such a tampering is manifested or triggered under very rare conditionsat the internal nodes, which are unlikely to arise during test but can occur dur-ing long hours of field operation [13]. Fig. 1 shows general models and examplesof hardware Trojans. The combinational Trojans as shown in Fig. 1(a) do notcontain any sequential elements and depend only on the simultaneous occurrenceof a set of rare node conditions (e.g. on nodes T1 through node Tn) to trigger amalfunction. An example of a combinational Trojan is shown in Fig. 1(c) wherethe node S has been modified to S�, and malfunction is triggered whenever thecondition a = 0, b = 1, c = 1 is satisfied. The sequential Trojans shown in Fig.1(b), on the other hand, undergo a sequence of state transitions (S1 through Sn)before triggering a malfunction. An example is shown in Fig. 1(d), where the3–bit counter causes a malfunction at the node S on reaching a particular count,and the count is increased only when the condition a = 1, b = 0 is satisfied atthe positive clock–edge. We refer to the condition of Trojan activation as thetriggering condition and the node affected by the Trojan as its payload.
In order to detect the existence of a Trojan using logic testing, it is not onlyimportant to trigger a rare event at a set of internal nodes, but also to propagatethe effect of such an event at the payload to an output node and observe it. Hence,it is very challenging to solve the problem of Trojan detection using conventionaltest generation and application, which are designed to detect manufacturing de-fects. In addition, the number of possible Trojan instances has a combinatorialdependence on the number of circuit nodes. As an example, even with the as-sumption of maximum 4 trigger nodes and a single payload, a relatively small

398 R.S. Chakraborty et al.
ISCAS–85 circuit such as c880 with 451 gates can have ∼109 triggers and ∼1011
distinct Trojan instances, respectively. Thus, it is not practical to enumerate allpossible Trojan instances to generate test patterns or compute test coverage.This indicates that instead of an exact approach, a statistical approach for testvector generation for Trojans can be computationally more tractable.
In this paper, we propose a methodology, referred to as MERO (MultipleExcitation of Rare Occurence) for statistical test generation and coverage de-termination of hardware Trojans. The main objective of the proposed methodol-ogy is to derive a set of test patterns that is compact (minimizing test time andcost), while maximizing the Trojan detection coverage. The basic concept is todetect low probability conditions at the internal nodes, select candidate Trojanstriggerable by a subset of these rare conditions, and then derive an optimal setof vectors than can trigger each of the selected low probability nodes individuallyto their rare logic values multiple times (e.g. at least N times, where N is a givenparameter). As analyzed in Section 3.1, this increases the probability of detec-tion of a Trojan having a subset of these nodes as its trigger nodes. By increasingthe toggling of nodes that are random–pattern resistant, it improves the proba-bility of activating a Trojan compared to purely random patterns. The proposedmethodology is conceptually similar to N-detect test [5,6] used in stuck-at ATPG(automatic test pattern generation), where test set is generated to detect eachsingle stuck-at fault in a circuit by at least N different patterns, in the processimproving test quality and defect coverage [6]. In this paper, we focus on digitalTrojans [13], which can be inserted into a design either in a design house (e.g.by untrusted CAD tool or IP) or in a foundry. We do not consider the Trojanswhere the triggering mechanism or effect are analog (e.g. thermal).
Since the proposed detection is based on functional validation using logicvalues, it is robust with respect to parameter variations and can reliably de-tect very small Trojans, e.g. the ones with few logic gates. Thus, the techniquecan be used as complementary to the side–channel Trojan detection approaches[1,9,10,11] which are more effective in detecting large Trojans (e.g. ones witharea > 0.1% of the total circuit area). Besides, the MERO approach can beused to increase the detection sensitivity of many side-channel Trojan detectiontechniques such as the ones that monitor the power/current signature, by in-creasing the activity in a Trojan circuit. Using an integrated Trojan coveragesimulation and test generation flow, we validate the approach for a set of ISCAScombinational and sequential benchmarks. Simulation results show that the pro-posed test generation approach can be extremely effective for detecting arbitraryTrojan instances of small size, both combinational and sequential.
The rest of the paper is organized as follows. Section 2 describes previous workon Trojan detection. Section 3 describes the mathematical justification of theMERO methodology, the steps of the MERO test generation algorithm and theTrojan detection coverage estimation. Section 4 describes the simulation setupand presents results for a set of ISCAS benchmark circuits with detailed analysis.Section 5 concludes the paper.

MERO : A Statistical Approach for Hardware Trojan Detection 399
2 Trojan Detection: Previous Work
Previously proposed Trojan detection approaches can be classified under twomain classes: (1) destructive approaches and (2) non–destructive approaches.In the destructive approaches, the manufactured IC is de–metallized layer bylayer, and chip microphotographs of the layers are integrated and analyzed byadvanced software to detect any tampering [4]. However, the applicability ofsuch approaches is limited by the fact that the hacker is most likely to modifyonly a small random sample of chips in the production line. This means that thesuccess of detecting the Trojan depends totally on correctly selecting a manufac-tured IC instance that has actually been tampered. Also, destructive methodsof validating an IC are extremely expensive with respect to time and cost andtechnology intensive, with validation of a single IC taking months [3]. Hence, it isimportant to investigate efficient non–destructive Trojan detection approaches.
Two non-destructive Trojan detection techniques can be categorized into twobroad classes: (1) Side-channel Analysis based and (2) Logic Testing based tech-niques. The side–channel analysis based techniques utilize the effect of an in-serted Trojan on a measurable physical quantity, e.g. the supply current [1,11]or path delays [10]. Such a measured circuit parameter can be referred as a fin-gerprint for the IC [1]. Side–channel approaches of detecting Trojans belong toa class of generic powerful techniques for IC authentication, and are conceptu-ally applicable to Trojans of all operational modes and to designs of arbitrarysize and complexity. Only local activation of the Trojans is sufficient to detectthem, and methods have been proposed to maximize the possibility of locallyactivating Trojans [9]. However, there are two main issues with the side–channelbased approaches that limit their practical applicability:
1. An intelligent adversary can craft a very small Trojan circuit with just a fewlogic gates which causes minimal impact on circuit power or delay. Thus itcan easily evade side–channel detection techniques such as the ones describedin [1,10].
2. The fingerprint is extremely vulnerable to process variations (i.e. processnoise) and measurement noise. Even advanced de–noising techniques suchas those applied in [1] fail to detect arbitrarily small Trojans under processvariations.
Logic testing based approaches, on the other hand, are extremely reliable un-der process variations and measurement noise effects. An important challengein these approaches is the inordinately large number of possible Trojans an ad-versary can exploit. Relatively few works have addressed the problem of Trojandetection using logic testing. In [12], a design methodology was proposed wherespecial circuitry was embedded in an IC to improve the controllability and ob-servability of internal nodes, thereby facilitating the detection of inserted Trojansby logic testing. However, this technique does not solve the problem of detectingTrojans in ICs which have not been designed following that particular designmethodology.

400 R.S. Chakraborty et al.
3 Statistical Approach for Trojan Detection
As described in Section 1, the main concept of our test generation approachis based on generating test vectors that can excite candidate trigger nodes in-dividually to their rare logic values multiple (at least N) times. In effect, theprobability of activation of a Trojan by the simultaneous occurrence of the rareconditions at its trigger nodes increases. As an example, consider the Trojanshown in Fig. 1(c). Assume that the conditions a = 0, b = 1 and c = 1 are veryrare. Hence, if we can generate a set of test vectors that induce these rare con-ditions at these nodes individually N times where N is sufficiently large, then aTrojan with triggering condition composed jointly of these nodes is highly likelyto be activated by the application of this test set. The concept can be extendedto sequential Trojans, as shown in Fig. 1(d), where the inserted 3–bit counteris clocked on the simultaneous occurrence of the condition ab′ = 1. If the testvectors can sensitize these nodes such that the condition ab′ = 1 is satisfiedat least 8 times (the maximum number of states of a 3–bit counter), then theTrojan would be activated. Next, we present a mathematical analysis to justifythe concept.
3.1 Mathematical Analysis
Without loss of generality, assume that a Trojan is triggered by the rare logicvalues at two nodes A and B, with corresponding probability of occurrence p1
and p2. Assume T to be the total number of vectors applied to the circuit undertest, such that both A and B have been individually excited to their rare valuesat least N times. Then, the expected number of occurrences of the rare logicvalues at nodes A and B are given by EA = T ·p1≥N and EB = T ·p2≥N , whichlead to:
T≥N
p1and T≥N
p2(1)
Now, let pj be the probability of simultaneous occurrence of the rare logic valuesat nodes A and B, an event that acts as the trigger condition for the Trojan.Then, the expected number of occurrences of this event when T vectors areapplied is:
EAB = pj ·T (2)
In the context of this problem, we can assume pj > 0, because an adversaryis unlikely to insert a Trojan which would never be triggered. Then, to ensurethat the Trojan is triggered at least once when T test vectors are applied, thefollowing condition must be satisfied:
pj ·T≥1 (3)
From inequality (1), let us assume T = c·Np1
. where c≥1 is a constant dependingon the actual test set applied. Inequality (3) can then be generalized as:
S = c·pj
p1·N (4)

MERO : A Statistical Approach for Hardware Trojan Detection 401
where S denotes the number of times the trigger condition is satisfied duringthe test procedure. From this equation, the following observations can be madeabout the interdependence of S and N :
1. For given parameters c, p1 and pj , S is proportional to N , i.e. the expectednumber of times the Trojan trigger condition is satisfied increases with thenumber of times the trigger nodes have been individually excited to theirrare values. This observation forms the main motivation behind the MEROtest generation approach for Trojan detection.
2. If there are q trigger nodes and if they are assumed to be mutually indepen-dent, then pj = p1·p2·p3· · ·pq, which leads to:
S = c·N ·q∏
i=2
pi (5)
As pi < 1 ∀i = 1, 2, · · ·q, hence, with the increase in q, S decreases for agiven c and N . In other words, with the increase in the number of triggernodes, it becomes more difficult to satisfy the trigger condition of the insertedTrojan for a given N . Even if the nodes are not mutually independent, asimilar dependence of S on q is expected.
3. The trigger nodes can be chosen such that pi≤θ ∀i = 1, 2, · · ·q, so that θis defined as a trigger threshold probability. Then as θ increases, the cor-responding selected rare node probabilities are also likely to increase. Thiswill result in an increase in S for a given T and N i.e. the probability ofTrojan activation would increase if the individual nodes are more likely toget triggered to their rare values.
All of the above predicted trends were observed in our simulations, as shown inSection 4.
3.2 Test Generation
Algorithm 1 shows the major steps in the proposed reduced test set generationprocess for Trojan detection. We start with the golden circuit netlist (withoutany Trojan), a random pattern set (V ), list of rare nodes (L) and number oftimes to activate each node to its rare value (N). First, the circuit netlist is readand mapped to a hypergraph. For each node in L, we initialize the number oftimes a node encounters a rare value (AR) to 0. Next, for each random patternvi in V , we count the number of nodes (CR) in L whose rare value is satisfied.We sort the random patterns in decreasing order of CR. In the next step, weconsider each vector in the sorted list and modify it by perturbing one bit at atime. If a modified test pattern increases the number of nodes satisfying theirrare values, we accept the pattern in the reduced pattern list. In this step weconsider only those rare nodes with AR < N . The process repeats until each nodein L satisfies its rare value at least N times. The output of the test generationprocess is a minimal test set that improves the coverage for both combinationaland sequential Trojans compared to random patterns.

402 R.S. Chakraborty et al.
Algorithm 1. Procedure MEROGenerate reduced test pattern set for Trojan detectionInputs: Circuit netlist, list of rare nodes (L) with associated rare values, list ofrandom patterns (V ), number of times a rare condition should be satisfied (N)Outputs: Reduced pattern set (RV )
1: Read circuit and generate hypergraph2: for all nodes in L do3: set number of times node satisfies rare value (AR) to 04: end for5: set RV = Φ6: for all random pattern in V do7: Propagate values8: Count the # of nodes (CR) in L with their rare value satisfied9: end for
10: Sort vectors in V in decreasing order of CR
11: for all vector vi in decreasing order of CR do12: for all bit in vi do13: Perturb the bit and re-compute # of satisfied rare values (C
′R)
14: if (C′R > CR) then
15: Accept the perturbation and form v′i from vi
16: end if17: end for18: Update AR for all nodes in L due to vector vi
19: if v′i increases AR for at least one rare node then
20: Add the modified vector v′i to RV
21: end if22: if (AR≥N) for all nodes in L then23: break24: end if25: end for
3.3 Coverage Estimation
Once the reduced test vector set has been obtained, computation of Trigger andTrojan coverage can be performed for a given trigger threshold (θ) (as defined inSection 3.1) and a given number of trigger nodes (q) using a random sampling ap-proach. From the Trojan population, we randomly select a number of q–triggerTrojans, where each trigger node has signal probability less than equal θ. We as-sume that Trojans comprising of trigger nodes with higher signal probability thanθ will be detected by conventional test. From the set of sampled Trojans, Trojanswith false trigger conditions which cannot be justified with any input pattern areeliminated. Then, the circuit is simulated for each vector in the given vector setand checked whether the trigger condition is satisfied. For an activated Trojan, ifits effect can be observed at the primary output or scan flip-flop input, the Trojanis considered “covered”, i.e. detected. The percentages of Trojans activated anddetected constitute the trigger coverage and Trojan coverage, respectively.

MERO : A Statistical Approach for Hardware Trojan Detection 403
(a) (b)
Fig. 2. Impact of sample size on trigger and Trojan coverage for benchmarks c2670and c3540, N = 1000 and q = 4: (a) deviation of trigger coverage, and (b) deviation ofTrojan coverage
(a) (b)
Fig. 3. Impact of N (number of times a rare point satisfies its rare value) on thetrigger/Trojan coverage and test length for benchmarks (a) c2670 and (b) c3540
3.4 Choice of Trojan Sample Size
In any random sampling process an important decision is to select the samplesize in a manner that represents the population reasonably well. In the con-text of Trojan detection, it means further increase in sampled Trojans, rendersnegligible change in the estimated converge. Fig. 2 shows a plot of percentagedeviation of Trigger and Trojan coverage (q = 4) from the asymptotic value fortwo benchmark circuits with varying Trojan sample size. From the plots, we ob-serve that the coverage saturates with nearly 100,000 samples, as the percentagedeviation tends to zero. To compromise between accuracy of estimated coverageand simulation time, we have selected a sample size of 100,000 in our simulations.
3.5 Choice of N
Fig. 3 shows the trigger and Trojan coverage for two ISCAS–85 benchmarkcircuits with increasing values of N , along with the lengths of the correspondingtestset. From these plots it is clear that similar to N–detect tests for stuck-at

404 R.S. Chakraborty et al.
fault where defect coverage typically improves with increasing N , the triggerand Trojan coverage obtained with the MERO approach also improves steadilywith N , but then both saturate around N = 200 and remain nearly constant forlarger values of N . As expected, the test size also increases with increasing N .We chose a value of N = 1000 for most of our experiments to reach a balancebetween coverage and test vector set size.
3.6 Improving Trojan Detection Coverage
As noted in previous sections, Trojan detection using logic testing involves si-multaneous triggering of the Trojan and the propagation of its effect to outputnodes. Although the proposed test generation algorithm increases the probabil-ity of Trojan activation, it does not explicitly target increasing the probabilityof a malicious effect at payload being observable. MERO test patterns, how-ever, achieves significant improvement in Trojan coverage compared to randompatterns, as shown in Section 4. This is because the Trojan coverage has strongcorrelation with trigger coverage. To increase the Trojan coverage further, onecan use the following low-overhead approaches.
1. Improvement of test quality: We can consider number of nodes observed alongwith number of nodes triggered for each vector during test generation. Thismeans, at step 13-14 of Algorithm 1, a perturbation is accepted if the sumof triggered and observed nodes improves over previous value. This comes atextra computational cost to determine the number of observable nodes foreach vector. We note that for a small ISCAS benchmark c432 (an interruptcontroller), we can improve the Trojan coverage by 6.5% with negligiblereduction in trigger coverage using this approach.
2. Observable test point insertion: We note that insertion of very few observabletest points can achieve significant improvement in Trojan coverage at thecost of small design overhead. Existing algorithm for selecting observabletest points for stuck-at fault test [14] can be used here. Our simulation withc432 resulted in about 4% improvement in Trojan coverage with 5 judiciouslyinserted observable points.
3. IncreasingNand/or increasing the controllability of the internal nodes: Internalnode controllability can be increased by judiciously inserting few controllabletest points or increasing N . It is well-known in the context of stuck-at ATPG,that scan insertion improves both controllability and observability of internalnodes. Hence, the proposed approach can take advantage of low-overhead de-sign modifications to increase the effectiveness of Trojan detection.
4 Results
4.1 Simulation Setup
We have implemented the test generation and the Trojan coverage determinationin three separate C programs. All the three programs can read a Verilog netlist
MERO : A Statistical Approach for Hardware Trojan Detection 405
Fig. 4. Integrated framework for rare occurrence determination, test generation usingMERO approach, and Trojan simulation
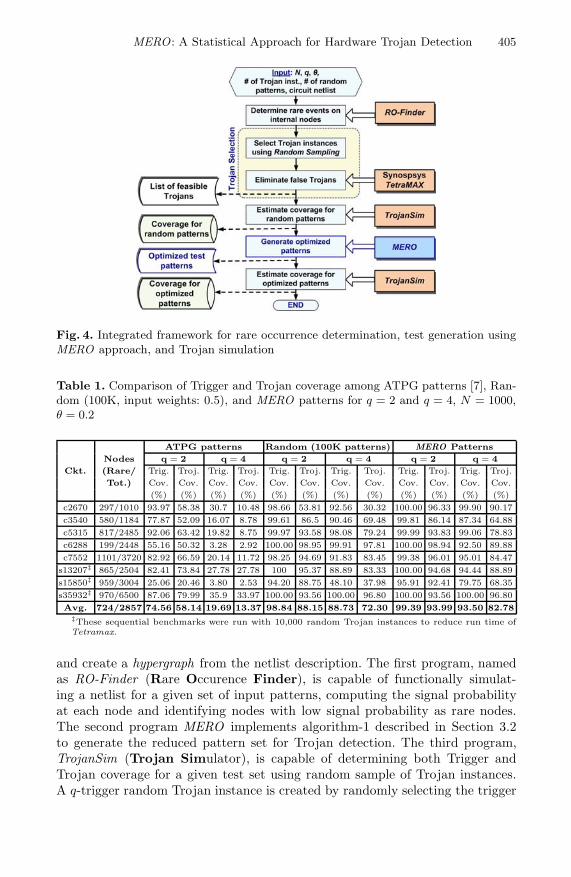
Table 1. Comparison of Trigger and Trojan coverage among ATPG patterns [7], Ran-dom (100K, input weights: 0.5), and MERO patterns for q = 2 and q = 4, N = 1000,θ = 0.2
ATPG patterns Random (100K patterns) MERO Patterns
Nodes q = 2 q = 4 q = 2 q = 4 q = 2 q = 4
Ckt. (Rare/ Trig. Troj. Trig. Troj. Trig. Troj. Trig. Troj. Trig. Troj. Trig. Troj.
Tot.) Cov. Cov. Cov. Cov. Cov. Cov. Cov. Cov. Cov. Cov. Cov. Cov.
(%) (%) (%) (%) (%) (%) (%) (%) (%) (%) (%) (%)
c2670 297/1010 93.97 58.38 30.7 10.48 98.66 53.81 92.56 30.32 100.00 96.33 99.90 90.17
c3540 580/1184 77.87 52.09 16.07 8.78 99.61 86.5 90.46 69.48 99.81 86.14 87.34 64.88
c5315 817/2485 92.06 63.42 19.82 8.75 99.97 93.58 98.08 79.24 99.99 93.83 99.06 78.83
c6288 199/2448 55.16 50.32 3.28 2.92 100.00 98.95 99.91 97.81 100.00 98.94 92.50 89.88
c7552 1101/3720 82.92 66.59 20.14 11.72 98.25 94.69 91.83 83.45 99.38 96.01 95.01 84.47
s13207‡ 865/2504 82.41 73.84 27.78 27.78 100 95.37 88.89 83.33 100.00 94.68 94.44 88.89
s15850‡ 959/3004 25.06 20.46 3.80 2.53 94.20 88.75 48.10 37.98 95.91 92.41 79.75 68.35
s35932‡ 970/6500 87.06 79.99 35.9 33.97 100.00 93.56 100.00 96.80 100.00 93.56 100.00 96.80
Avg. 724/2857 74.56 58.14 19.69 13.37 98.84 88.15 88.73 72.30 99.39 93.99 93.50 82.78‡These sequential benchmarks were run with 10,000 random Trojan instances to reduce run time ofTetramax.
and create a hypergraph from the netlist description. The first program, namedas RO-Finder (Rare Occurence Finder), is capable of functionally simulat-ing a netlist for a given set of input patterns, computing the signal probabilityat each node and identifying nodes with low signal probability as rare nodes.The second program MERO implements algorithm-1 described in Section 3.2to generate the reduced pattern set for Trojan detection. The third program,TrojanSim (Trojan Simulator), is capable of determining both Trigger andTrojan coverage for a given test set using random sample of Trojan instances.A q-trigger random Trojan instance is created by randomly selecting the trigger

406 R.S. Chakraborty et al.
nodes from the list of rare nodes. We consider one randomly selected payloadnode for each Trojan. Fig. 4 shows the flow-chart for the MERO methodology.Synopsys TetraMAX was used to justify the trigger condition for each Trojanand eliminate the false Trojans. All simulations and test generation were car-ried out on a Hewlett-Packard Linux workstation with a 2GHz dual-core Intelprocessor and 2GB RAM.
4.2 Comparison with Random and ATPG Patterns
Table 1 lists the trigger and Trojan coverage results for a set of combinational(ISCAS-85) and sequential (ISCAS-89) benchmarks using stuck-at ATPG pat-terns (generated using the algorithm in [7]), weighted random patterns andMERO test patterns. It also lists the number of total nodes in the circuit and thenumber of rare nodes identified by RO-Finder tool based on signal probability.The signal probabilities were estimated through simulations with a set of 100,000random vectors. For the sequential circuits, we assume full-scan implementation.We consider 100,000 random instances of Trojans following the sampling policydescribed in Section 3.4, with one randomly selected payload node for each Tro-jan. Coverage results are provided in each case for two different trigger pointcount, q = 2 and q = 4, at N = 1000 and θ = 0.2.
Table 2 compares reduction in the length of the testset generated by theMERO test generation method with 100,000 random patterns, along with thecorresponding run-times for the test generation algorithm. This run-time in-cludes the execution time for Tetramax to validate 100,000 random Trojan in-stances, as well as time to determine the coverage by logic simulation. We canmake the following important observations from these two tables:
1. The stuck-at ATPG patterns provide poor trigger and Trojan coverage com-pared to MERO patterns. The increase in coverage between the ATPG andMERO patterns is more significant in case of higher number of trigger points.
2. From Table 2, it is evident that the reduced pattern with N=1000 and θ =0.2 provides comparable trigger coverage with significant reduction in test
Table 2. Reduction in test length with MERO approach compared to 100K randompatterns along with runtime, q = 2, N=1000, θ=0.2
Ckt. MERO test length % Reduction Run-time (s)
c2670 8254 91.75 30051.53
c3540 14947 85.05 9403.11
c5315 10276 89.72 80241.52
c6288 5014 94.99 15716.42
c7552 12603 87.40 160783.37
s13207† 26926 73.07 23432.04
s15850† 32775 67.23 39689.63
s35932† 5480 94.52 29810.49
Avg. 14534 85.47 48641.01
†These sequential benchmarks were run with 10,000 ran-dom Trojan instances to reduce run time of Tetramax.

MERO : A Statistical Approach for Hardware Trojan Detection 407
(a) (b)
Fig. 5. Trigger and Trojan coverage with varying number of trigger points (q) forbenchmarks (a) c3540 and (b) c7552, at N = 1000, θ = 0.2
length. The average improvement in test length for the circuits consideredis about 85%.
3. Trojan coverage is consistently smaller compared to trigger coverage. Thisis because in order to detect a Trojan by applying an input pattern, besidessatisfying the trigger condition, one needs to propagate the logic error atthe payload node to one or more primary outputs. In many cases althoughthe trigger condition is satisfied, the malicious effect does not propagate tooutputs. Hence, the Trojan remains triggered but undetected.
4.3 Effect of Number of Trigger Points (q)
The impact of q on coverage is evident from the Fig. 5, which shows the decreas-ing trigger and Trojan coverage with the increasing number of trigger points fortwo combinational benchmark circuits. This trend is expected from the analysisof Section 3.1. Our use of TetraMAX for justification and elimination of the falsetriggers helped to improve the Trojan coverage.
4.4 Effect of Trigger Threshold (θ)
Fig. 6 plots the trigger and Trojan coverage with increasing θ for two ISCAS-85benchmarks, at N = 1000 and q = 4. As we can observe, the coverage valuesimprove steadily with increasing θ while saturating at a value above 0.20 inboth the cases. The improvement in coverage with θ is again consistent with theconclusions from the analysis of Section 3.1.
4.5 Sequential Trojan Detection
To investigate the effectiveness of the MERO test generation methodology in de-tecting sequential Trojans, we designed and inserted sequential Trojans modeledfollowing Fig. 1(d), with 0, 2, 4, 8, 16 and 32 states, respectively (the case withzero states refers to a combinational Trojan following the model of Fig. 1(c)). Acycle-accurate simulation was performed by our simulator TrojanSim, and the

408 R.S. Chakraborty et al.
(a) (b)
Fig. 6. Trigger and Trojan coverage with trigger threshold (θ) for benchmarks (a) c3540and (b) c7552, for N = 1000, q = 4
Table 3. Comparison of sequential Trojan coverage between random (100K) andMERO patterns, N = 1000, θ = 0.2, q = 2
Trigger Cov. for 100K Random Vectors Trigger Cov. for MERO Vectors(%) (%)
Ckt. Trojan State Count Trojan State Count0 2 4 8 16 32 0 2 4 8 16 32
s13207 100.00 100.00 99.77 99.31 99.07 98.38 100.00 100.00 99.54 99.54 98.84 97.92s15850 94.20 91.99 86.79 76.64 61.13 48.59 95.91 95.31 94.03 91.90 87.72 79.80s35932 100.00 100.00 100.00 100.00 100.00 100.00 100.00 100.00 100.00 100.00 100.00 100.00Avg. 98.07 97.33 95.52 91.98 86.73 82.32 98.64 98.44 97.86 97.15 95.52 92.57
Trojan Cov. for 100K Random Vectors Trojan Cov. for MERO Vectors(%) (%)
Ckt. Trojan State Count Trojan State Count0 2 4 8 16 32 0 2 4 8 16 32
s13207 95.37 95.37 95.14 94.91 94.68 93.98 94.68 94.68 94.21 94.21 93.52 92.82s15850 88.75 86.53 81.67 72.89 58.4 46.97 92.41 91.99 90.62 88.75 84.23 76.73s35932 93.56 93.56 93.56 93.56 93.56 93.56 93.56 93.56 93.56 93.56 93.56 93.56Avg. 92.56 91.82 90.12 87.12 82.21 78.17 93.55 93.41 92.80 92.17 90.44 87.70
Trojan was considered detectable only when the output of the golden circuitand the infected circuit did not match. Table 3 presents the trigger and Trojancoverage respectively obtained by 100,000 randomly generated test vectors andthe MERO approach for three large ISCAS-89 benchmark circuits. The superi-ority of the MERO approach over the random test vector generation approachin detecting sequential Trojans is evident from this table.
Although these results have been presented for a specific type of sequentialTrojans (counters which increase their count conditionally), they are represen-tative of other sequential Trojans whose state transition graph (STG) has no“loop”. The STG for such a FSM has been shown in Fig. 7. This is a 8-stateFSM which changes its state only when a particular internal node condition Ci
is satisfied at state Si, and the Trojan is triggered when the FSM reaches stateS8. The example Trojan shown in Fig. 1(d) is a special case of this model, wherethe conditions C1 through C8 are identical. If each of the conditions Ci is asrare as the condition a = 1, b = 0 required by the Trojan shown in Fig. 1(d),

MERO : A Statistical Approach for Hardware Trojan Detection 409
Fig. 7. FSM model with no loop in state transition graph
then there is no difference between these two Trojans as far as their rareness ofgetting triggered is concerned. Hence, we can expect similar coverage and testlength results for other sequential Trojans of this type. However, the coveragemay change if the FSM structure is changed (as shown with dotted line). In thiscase, the coverage can be controlled by changing N .
4.6 Application to Side-Channel Analysis
As observed from the results presented in this section, the MERO approach canachieve high trigger coverage for both combinational and sequential Trojans.This essentially means that the MERO patterns will induce activity in the Tro-jan triggering circuitry with high probability. A minimal set of patterns thatis highly likely to cause activity in a Trojan is attractive in power or currentsignature based side-channel approach to detect hardware Trojan [1,9,11]. Thedetection sensitivity in these approaches depends on the induced activity in theTrojan circuit by applied test vector. It is particularly important to enhance sen-sitivity for the Trojans where the leakage contribution to power by the Trojancircuit can be easily masked by process or measurement noise. Hence, MERO ap-proach can be extended to generate test vectors for side-channel analysis, whichrequires amplifying the Trojan impact on side-channel parameter such as poweror current.
5 Conclusions
Conventional logic test generation techniques cannot be readily extended todetect hardware Trojans because of the inordinately large number of possibleTrojan instances. We have presented a statistical Trojan detection approachusing logic testing where the concept of multiple excitation of rare logic values atinternal nodes is used to generate test patterns. Simulation results show that theproposed test generation approach achieves about 85% reduction in test lengthover random patterns for comparable or better Trojan detection coverage. Theproposed detection approach can be extremely effective for small combinationaland sequential Trojans with small number of trigger points, for which side-channel analysis approaches cannot work reliably. Hence, the proposed detectionapproach can be used as complementary to side-channel analysis based detectionschemes. Future work will involve improving the test quality which will help inminimizing the test length and increasing Trojan coverage further.

410 R.S. Chakraborty et al.
References
1. Agrawal, D., Baktir, S., Karakoyunlu, D., Rohatgi, P., Sunar, B.: Trojan detectionusing IC fingerprinting. In: IEEE Symp. on Security and Privacy, pp. 296–310(2007)
2. Ravi, S., Raghunathan, A., Chakradhar, S.: Tamper resistance mechanisms forsecure embedded systems. In: Intl. Conf. on VLSI Design, pp. 605–611 (2006)
3. DARPA BAA06-40: TRUST for Integrated Circuits,http://www.darpa.mil/BAA/BAA06-40mod1/html
4. Kumagai, J.: Chip Detectives. IEEE Spectrum 37, 43–49 (2000)5. Amyeen, M.E., Venkataraman, S., Ojha, A., Lee, S.: Evaluation of the Quality of
N-Detect Scan ATPG Patterns on a Processor. In: Intl. Test Conf., pp. 669–678(2004)
6. Pomeranz, I., Reddy, S.M.: A Measure of Quality for n-Detection Test Sets. IEEE.Trans. on Computers. 53, 1497–1503 (2004)
7. Mathew, B., Saab, D.G.: Combining multiple DFT schemes with test generation.IEEE Trans. on CAD. 18, 685–696 (1999)
8. Adee, S.: The Hunt for the Kill Switch. IEEE Spectrum 45, 34–39 (2008)9. Banga, M., Hsiao, M.S.: A Region Based Approach for the Identification of Hard-
ware Trojans. In: Intl. Workshop on Hardware-oriented Security and Trust, pp.40–47 (2008)
10. Jin, Y., Makris, Y.: Hardware Trojan Detection Using Path Delay Fingerprint. In:Intl. Workshop on Hardware-oriented Security and Trust, pp. 51–57 (2008)
11. Rad, R.M., Wang, X., Tehranipoor, M., Plusqellic, J.: Power Supply Signal Cali-bration Techniques for Improving Detection Resolution to Hardware Trojans. In:Intl. Conf. on CAD, pp. 632–639 (2008)
12. Chakraborty, R.S., Paul, S., Bhunia, S.: On-Demand Transparency for ImprovingHardware Trojan Detectability. In: Intl. Workshop on Hardware-oriented Securityand Trust, pp. 48–50 (2008)
13. Wolff, F., Papachristou, C., Bhunia, S., Chakraborty, R.S.: Towards Trojan-FreeTrusted ICs: Problem Analysis and Detection Scheme. In: Design, Automation andTest in Europe, pp. 1362–1365 (2008)
14. Geuzebroek, M.J., Van der Linden, J.T., Van de Goor, A.J.: Test Point Insertionthat Facilitates ATPG in Reducing Test Time and Data Volume. In: Intl. TestConf., pp. 138–147 (2002)