Melt Electrospinning Writing as a Method to Form Novel Hydrogel Architectures and...
112
Melt Electrospinning Writing as a Method to Form Novel Hydrogel Architectures and Constructs Submitted by Jodie Nicole Haigh BAppSc (Chemistry) In fulfilment of the requirements of the degree of SC80 Masters of Science (Research) Chemistry, Physics and Mechanical Engineering (CPME) Science and Engineering Faculty Queensland University of Technology 2017
Transcript of Melt Electrospinning Writing as a Method to Form Novel Hydrogel Architectures and...

Melt Electrospinning Writing as a Method to Form Novel
Hydrogel Architectures and Constructs
Submitted by
Jodie Nicole Haigh
BAppSc (Chemistry)
In fulfilment of the requirements of the degree of
SC80 Masters of Science (Research)
Chemistry, Physics and Mechanical Engineering (CPME)
Science and Engineering Faculty
Queensland University of Technology
2017

i
ABSTRACT
Hydrogels are attractive materials for use in biomedical, biosensor, drug delivery, and tissue
engineering applications. While hydrogels are routinely used in those various applications, they
continue to lack both the three-dimensional (3D) structural architecture and mechanical
properties required to fulfil certain criteria. Two deficiencies of hydrogels, namely
micro-porosity and lack of mechanical strength, were the focus of this thesis. While
micro-porosity has previously been introduced into hydrogels using various techniques,
micro-porosity with high-fidelity in the low micron range was reported herein for the first time.
The simple and universal method to introduce 3D controlled architectures into soft hydrogels
using sacrificial poly-Ɛ-caprolactone (PCL) templates produced via melt electrospinning writing
(MEW) was successfully completed. Moreover, hydrogels that are inherently soft have low
mechanical strength, and recent 3D-printed reinforcement of hydrogels shows promise to
produce composites with greatly improved strength. While PCL is a degradable polymer that is
readily melt electrospun written, the reinforcement of hydrogels with a non-degradable
polymer widens the applications in which such fiber-hydrogel composites could be used. Thus,
the MEW of polypropylene (PP) was completed for the first time. Optimization of the MEW
process was undertaken to obtain PP scaffolds that could be used in fiber-hydrogel composites.
Both the addition of hierarchical structure in hydrogels and the development of MEW for PP
provides a foundation for the production of more complex hydrogel systems for a variety of
applications.

ii
ACKNOWLEDGEMENTS
I would like to thank my primary supervisor Dr Tim Dargaville for providing me with his
encouragement and support throughout this Masters exploration. Thank you for being always
reliable and only ever an email away.
I would also like to thank my co-supervisors Prof Dr Paul Dalton and Dr Kathleen Mullen. I
thank Prof Dalton for happily welcoming me to Würzburg, and Dr Mullen for her support in my
undergraduate and graduate coursework.
The following list of QUT faculty and staff helped me throughout my undergraduate and
graduate studies, without them I would not have made it this far. In no particular order, I am
endlessly grateful for Drs. Madeleine Schultz, Dennis Arnold, Llew Rintoul, Ian MacKinnon,
Lorraine Caldwell, John McMurtrie, Eric Waclawik, Sara Couperthwaite, Graeme Millar, Wayde
Martens, John Colwell, Godwin Ayoko, Mark Selby, and Mark Wellard.
Furthermore, I would like to thank the Institute of Future Environments team at QUT, including
Dr Peter Hines, Donald McAuley, Dr Chris East, Rachel Hancock, Tri Nguyen and Dr Sanjleena
Singh for all their help and training on various instruments.
My fellow QUT students and friends for encouraging me and making me laugh. I thank many, but
in short I thank Anna Worthy, Emily Grundgeiger, Amy Shilling, Liam Walsh, Liam Hegarty,
Camille Fromageot, Roland Agoston, Pabhon Poonpatana, Sarah Fletcher, Vanessa Lussini,
Jasmine Jensen, Sean Byrne, Henry Spratt and Daniel Jäger.
I thank the whole FMZ team at the University of Würzburg for welcoming me to Germany and
supporting me in my research. Especially, I thank Michael Schmitz, Tomasz Jüngst, Julia
Blöhbaum, Andrei Hrynevich and Almoatazbellah Youssef. I also wish to thank Mylène de
Ruijter for her help, support and friendship while she was in Würzburg.
I would like to thank my family for supporting me throughout my life and showing me that great
obstacles can be overcome to achieve great things.
Last, but not least, I would like to thank Daimon Hall for his enduring and ongoing support,
humour and love. A part of my sanity remains intact, because of his belief in my abilities.

iii
AUTHOR’S PUBLICATIONS AND CONFERENCE POSTERS
Part I. Publications from this thesis
Jodie N. Haigh, Ya-Mi Chuang, Brooke Farrugia, Richard Hoogenboom, Paul D. Dalton, Tim R.
Dargaville, Hierarchically Structured Porous Poly(2-oxazoline) Hydrogels, Macromolecular Rapid
Communications, 37 (1), 2016, 93-99.
Jodie N. Haigh, Tim R. Dargaville, Paul D. Dalton, Optimization and Characterization of
Polypropylene Fibers produced by Melt Electrospinning Writing, Target Journal: Polymer. In
preparation.
Part II. Publications related to this thesis subject
Gernot Hochleitner, Almoatazbellah Youssef, Andrei Hyrnevich, Jodie N. Haigh, Tomasz Jungst,
Jürgen Groll, Paul D. Dalton, Fiber Pulsing During Melt Electrospinning Writing,
BioNanoMaterials, Published Online May 2016.
Mylène de Ruijter, Andrei Hrynevich, Jodie N. Haigh, Gernot Hochleitner, Jürgen Groll, Jos
Malda, Paul D. Dalton, Accurate Placement of Electrospun Written Fibers onto Existing Structures.
Target Journal: Advanced Materials. In preparation.
Part III. Conference Posters presented by Author
Jodie N. Haigh, Kathleen Mullen, Richard Hoogenboom, Paul D. Dalton and Tim R. Dargaville.
Designer Synthetic 3D Hydrogels for Cell Culture. Nanotechnology and Molecular Science HDR
Symposium, February 25, 2014, Brisbane, Australia.
Jodie N. Haigh, Ya-Mi Chuang, Brooke Farrugia, Richard Hoogenboom, Paul D. Dalton and Tim
R. Dargaville. Controlling Macro-porosity in Hydrogels with Sacrificial Fibres Prepared from Melt
Electrospinning Writing. Nanotechnology and Molecular Science HDR Symposium, February
12-13, 2015, Brisbane, Australia.
Jodie N. Haigh, Ya-Mi Chuang, Brooke Farrugia, Richard Hoogenboom, Paul D. Dalton and Tim
R. Dargaville. Controlling Macro-porosity in Hydrogels with Sacrificial Fibres Prepared from Melt
Electrospinning Writing. 27th European Conference on Biomaterials, August 30-September 3,
2015, Kraków, Poland.
Jodie N. Haigh, Ya-Mi Chuang, Brooke Farrugia, Richard Hoogenboom, Paul D. Dalton and Tim
R. Dargaville. Fabrication of Poly(2-Oxazoline) Hydrogels with Controlled Porosity by Indirect
Printing of Melt Electrospun Templates. International Conference on Biofabrication,
November 7-9, 2015, Utrecht, The Netherlands.

iv
TABLE OF CONTENTS
ABSTRACT ............................................................................................................................................ i
ACKNOWLEDGEMENTS .................................................................................................................. ii
AUTHOR’S PUBLICATIONS AND CONFERENCE POSTERS .................................................. iii
Part I. Publications from this thesis .................................................................................................................................... iii
Part II. Publications related to this thesis subject ......................................................................................................... iii
Part III. Conference Posters presented by Author ........................................................................................................ iii
TABLE OF CONTENTS .................................................................................................................... iv
LIST OF FIGURES ............................................................................................................................. vi
LIST OF TABLES .............................................................................................................................. xii
LIST OF ABBREVIATIONS ........................................................................................................... xiii
Statement of Original Authorship ........................................................................................... xv
Chapter 1 Introduction ................................................................................................................ 16
1.1 Overview ............................................................................................................................................................... 16
1.2 Fiber-Hydrogel Composites and Methods for Fiber Production ................................................... 20
1.3 Sacrificial Templating ...................................................................................................................................... 29
1.4 Poly(2-alkyl-2-oxazoline) (PAOx) Hydrogels ........................................................................................ 33
1.4.1 PAOx Networks from Thiol-Ene and Thiol-Yne Reactions .......................................................................... 33
1.4.2 PAOx Networks from Reaction of Amines with Epoxides ............................................................................ 37
1.5 Thesis and Research Questions ................................................................................................................... 40
1.5.1 Research Questions ....................................................................................................................................................... 40
Chapter 2 Controlling Pore-Architecture in Hydrogels by Fiber Templating using
Melt Electrospinning Writing ................................................................................................... 41
2.1 Introduction ......................................................................................................................................................... 42
2.1.1 Overview ............................................................................................................................................................................ 42
2.1.2 The Melt Electrospinning Writing Technique ................................................................................................... 48
2.2 Materials and Methods .................................................................................................................................... 51
2.2.1 Template Production .................................................................................................................................................... 51
2.2.2 Hydrogel Synthesis and Template Dissolution ................................................................................................. 51
2.2.3 Microscopy ........................................................................................................................................................................ 52
2.3 Results and Discussion .................................................................................................................................... 54
2.5 Chapter 2 Conclusions ..................................................................................................................................... 67
Chapter 3 Melt Electrospinning Writing of Polypropylene ............................................ 68

v
3.1 Introduction ......................................................................................................................................................... 68
3.1.1 Melt Electrospinning of Polypropylene ................................................................................................................ 68
3.1.2 Effect of Tacticity of Polypropylene on Fiber Diameters .............................................................................. 69
3.1.3 Effect of Changing Processing Parameters on Fiber Diameters ................................................................ 71
3.1.4 Effect of Polymer Parameters on Fiber Diameters .......................................................................................... 74
3.1.5 Effect of Additives on Fiber Diameters ................................................................................................................. 75
3.1.6 Important Phenomena to Consider in Optimising the Printing of PP ..................................................... 76
3.1.7 Rationale for 3D printing PP via MEW .................................................................................................................. 76
3.2 Materials and Methods .................................................................................................................................... 78
3.2.1 Polypropylene .................................................................................................................................................................. 78
3.2.2 Rheology of PP ................................................................................................................................................................. 78
3.2.3 Differential Scanning Calorimetry of PP .............................................................................................................. 78
3.2.4 Blending of PP .................................................................................................................................................................. 78
3.2.5 Initial Melt Electrospinning of PP ........................................................................................................................... 79
3.2.6 Melt Electrospinning onto a Heated Collector .................................................................................................. 79
3.2.7 Microscopy of MEW PP ................................................................................................................................................ 79
3.3 Results and Discussion .................................................................................................................................... 81
3.3.1 Polypropylene Characterization .............................................................................................................................. 81
3.3.2 Initial MEW of PP ............................................................................................................................................................ 85
3.3.3 Heated Collector Design and Construction for MEW ..................................................................................... 86
3.3.4 Heated Collector Temperature Variation ............................................................................................................ 88
3.3.5 Effect of Collector Speed ............................................................................................................................................. 89
3.3.6 Effect of Air Pressure .................................................................................................................................................... 92
3.3.7 Effect of MEW Printing Different Arrays of PP .................................................................................................. 98
3.3.8 Layer-by-Layer Deposition ...................................................................................................................................... 100
3.5 Chapter 3 Conclusions ................................................................................................................................... 103
Chapter 4 Future Directions ................................................................................................... 104
4.1 Drug Delivery Devices ................................................................................................................................... 104
4.2 Fiber-Hydrogel Reinforced Composites with Controlled, Aligned Porosity ........................... 104
4.3 Crystal Structure Investigation of Polymer Fibers after processing via Melt
Electrospinning Writing ....................................................................................................................................... 105
Chapter 5 Final Conclusion ..................................................................................................... 106
REFERENCES ................................................................................................................................. 107

vi
LIST OF FIGURES
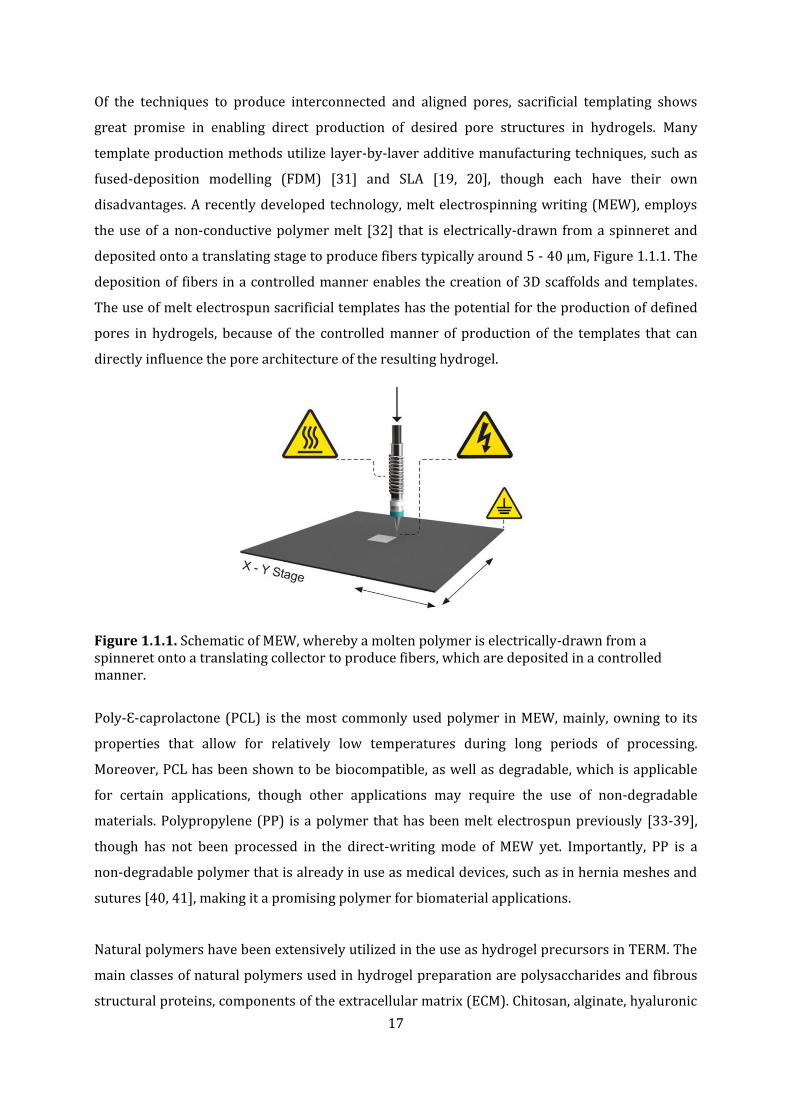
Figure 1.1.1. Schematic of MEW, whereby a molten polymer is electrically-drawn from a spinneret onto a translating collector to produce fibers, which are deposited in a controlled manner.
16
Figure 1.1.2. The structures of PAOx (left) and poly(amino acid)s (right), showing that PAOx has a similar structure to poly(amino acid)s. EG = end group, R = alkyl.
17
Figure 1.2.1. Schematic of the elastic modulus of selected native tissues.
19
Figure 1.2.2. Schematic depicting the biofabrication window that exists for hybrid composites to meet the mechanical and biological requirements of synthetic tissues.
20
Figure 1.2.3. Surface view of the X–Y plane of the woven 3D scaffold (SEM), cross-sectional view of the Y–Z plane and cross-sectional view of the X–Z plane.
21
Figure 1.2.4. Schematic of the molecular structure arrangement of an IPN hydrogel.
22
Figure 1.2.5. Solution electrospun non-woven scaffolds from PCL blends with 10 and 35% poly glycidol, respectively.
23
Figure 1.2.6. Schematic for the mechanism of crosslinking between the gelatin present in the nanofibers of the scaffold to the gelatin hydrogel.
23
Figure 1.2.7. 3D-printed thermoplastic network (a) and the thermoplastic-hydrogel construct.
25
Figure 1.2.8. Schematic diagram of the box-like printed structure of MEW scaffolds (a) and optimal microscope image of box-like printed MEW scaffolds (b).
26
Figure 1.2.9. Left: Uncompressed fiber-hydrogel composite (top) and fiber-hydrogel composite after compressive strain of 30% (bottom). Scale bars: 1 mm. Right: MEW PCL scaffolds (blue) act to reinforce GelMA hydrogels (yellow) in axial compression.
27
Figure 1.3.1. Sacrificial templating methods. Top: Schematic images (a, c), OM image (b) and SEM image (d) using native kidney tissue. PCL solution is perfused into the kidney tissue (a), PCL vascular cast after tissue digestion (b), collagen coated PCL cast (c), and hollow collagen micro-vascularized scaffold after dissolution of PCL cast (d), scale bar 200 µm. Middle: Schematic diagram method using MEW PCL templates. MEW PCL scaffold (a), PCL templated embedded into PAOx hydrogel (b), and hollow channels within PAOx hydrogel after PCL template dissolution (c). Bottom: Schematic diagram of CaCO3 vaterite template method, dispersion of templates in alginate (a, b), and formation of hydrogel and dispersion of CaCO3 upon addition of HCl.
28
Figure 1.3.2. Left: Sacrificial PMMA template fibers (grey) were bundled within a Teflon mold (a). Fibrinogen in phosphate-buffered saline was back-filled around the aligned fiber bundle via centrifugation (b) and polymerized to fibrin (brown). PMMA was dissolved using acetone, producing aligned hollow channels (white) within the fibrin matrix. Right: SEM images of hydrogels after templating showing the hollow channels.
30

vii
Figure 1.4.1.1. Formation of P(MeOx-DecEnOx) and P(EtOx-DecEnOx) hydrogels with EDDET crosslinking dithiol, via UV-irradiation crosslinking methods, showing the alkene-functionality of the DecEnOx moiety in the polymer side-chains.
33
Figure 1.4.1.3. Formation of P(ButEnOx-co-EI) hydrogels with EDDET crosslinking dithiol, via UV-irradiation crosslinking methods, showing the alkene-functionality of the ButEnOx moiety in the polymer side-chains.
34
Figure 1.4.2.1. (a)1,6-hexanediol di-glycidyl ether, (b)1,6-hydroxyethyl disulfide-bis-diglycidyl ether.
36
Figure 1.4.2.2. Formation of P(EtOx-AmOx) hydrogels with epichlorhydrin crosslinking epoxide, showing the amine-functionality of the AmOx moiety in the polymer side-chains.
37
Figure 2.1.1.1. SEM images of porous scaffolds (a, b) and human tissues (c, d) showing interconnected porosity of the tissues.
41
Figure 2.1.1.2. CLSM images of hydrated PDMSstar–PEG hydrogels prepared by solvent-induced phase separation with different wt.% ratios of PDMSstar-MA:PEG-DA from a DCM precursor solution (i.e. via SIPS). PDMS-enriched regions stained with hydrophobic dye. Scale bars = 250 μm.
43
Figure 2.1.1.3. Confocal images of HA-furan/PEG cryogels that were formed at (A) a −15 °C thaw temperature, (B) a −15 °C thaw temperature in the presence of 220 mM galactose, (C) a −6 °C thaw temperature, and (D) a −6 °C thaw temperature in 220 mM galactose.
44
Figure 2.1.1.4. SEM images of poly(acrylamide-co-acrylic acid) conventional hydrogel (a) and super porous hydrogels (b, c). Scale bars 10 µm, 100 µm and 1mm.
45
Figure 2.1.1.5. SEM images of agarose scaffold sectioned longitudinally (a) or cross-sectioned (b). Scale bars 200 µm, 200 µm and 100 µm.
45
Figure 2.1.1.6. Multi-channel PEG hydrogel via SLA: isometric view (a, c) and top-down view (b, d).
46
Figure 2.1.2.1. Schematic diagram showing the shape of the melt electrospinning jet profile, which is dependent on the speed of the collector (Sc) relative to the jet speed (Sj) (a) and image of MEW PCL below CTS and above CTS (b).
48
Figure 2.3.1. The thiol-ene photo-gelation reaction of PEtOx-ButenOx copolymers with DTT as crosslinking agent and I2959 as photoinitiator, using 365 nm wavelength UV light.
53
Figure 2.3.2. MEW printed PCL sacrificial templates. a) 200 µm programmed spacing, b) 400 µm programmed spacing, c) 600 µm programmed spacing and d) 800 µm programmed spacing. Scale bars a) and c) 100 µm, and b) and d) 200 µm.
55
Figure 2.3.3. MEW printed PCL templates showing the smooth surface morphology of the fibers. Scale bars 100 and 200 µm respectively.
56

viii
Figure 2.3.4. PCL fibers upon cooling of the polymer fibers in ambient air can produce visible crystallization. One crystallization point is shown in a white box (left) with other crystallization points visible in both images. Scale bars 20 µm.
56
Figure 2.3.5. Fiber junctions of 200 µm programmed spaced templates (a-e) at various annealing times: 0 min - ‘as printed’ (a), 3 mins (b), 5 mins (c), 10mins (d) and 15 mins (e). A softened scaffold top-down view after 10 minutes of softening treatment shows the overall template morphology still intact (f). Scale bars: a – b, e) 2 µm, c-d) 1 µm and f) 100 µm.
57
Figure 2.3.6. SEM images of PCL templates showing the sagging effect due to slow cooling of the molten polymer jet. Note, images b-d show the templates in the inverse position to the orientation they were printed. Scale bars: a-c) 100 µm and d) 10 µm.
58
Figure 2.3.7. SEM image of PCL fibers printed directly onto collector plate (a), OM image of PCL fibers after being printed directly onto hydrogel with encapsulation in precursor solution and irradiation to form complete hydrogel (b) and hydrogel after washing to remove PCL with residual PCL remaining (c).
59
Figure 2.3.8. Schematic of the sacrificial templating method employed, where the PCL template (white) is printed via MEW (a, b), then embedded into the hydrogel (c). The empty channels within the hydrogel (d) remain after washing away the PCL template and finally, backfilling with FITC-dextran (e) for imaging of the resulting channels.
60
Figure 2.3.9. A hydrogel with embedded 3D PCL sacrificial template (a), and hydrogel after dissolution of the PCL from the construct (b). Scale bars 200 µm.
61
Figure 2.3.10. PCL template only (a), PCL template embedded into PAOx hydrogel (b) and mostly dissolved PCL template from PAOx hydrogel. Scale bars: a) 1 mm, b – c) 250 µm.
61
Figure 2.3.11. The structures of the fluorescent dye structures, fluorescein (left) and FITC-dextran (right), utilized for hydrogel channel imaging.
62
Figure 2.3.12. The diffusion of fluorescein (a) through the hydrogel after submersion for 5 mins. The time-dependent diffusion of FITC-dextran 70 kDa (b) through the channels after 5 hours of submersion and from the channels into the hydrogel (c) after 22 hours.
63
Figure 2.3.13. CLSM image of cross fiber and junction.
64
Figure 2.3.14. CLSM image of 3D templated hydrogels, backfilled with FITC-dextran.
64
Figure 2.3.15. Top slice from confocal microscopy image (left) and SEM image (right).
65
Figure 3.1.2.1. Structural representations of the different tactic forms of PP.
68
Figure 3.1.2.2. SEM images of melt electrospun PP. Left: Isotactic PP with Mw of 12000. Right: Atactic PP with a Mw of 14000.
69
Figure 3.1.2.3. SEM of solution electrospun syndiotactic PP fibers (left) and fiber diameter distribution (right).
70

ix
Figure 3.1.3.1. The effect of voltage on fiber diameter of melt electrospun PP at heating temperatures of 200 °C (circles) and 240 °C (squares).
70
Figure 3.1.3.2. The effect of electric field strength on the fiber diameter during melt electrospinning of PP.
71
Figure 3.1.3.3. The effect of applied voltage on the fiber diameter of melt electrospun PP at two different collector distances.
71
Figure 3.1.3.4. The schematic diagram of needleless melt electrospinning system employed by Li et al. (top), the processing parameters used (bottom left) and resulting fiber diameters (bottom right).
72
Figure 3.1.3.5. The effect of applied voltage on the fiber diameter of melt electrospun PP.
72
Figure 3.1.3.6. The effect of temperature on the fiber diameter of two PPs, with melt indices of 900 and 1500, respectively.
73
Figure 3.1.4.1. The effect of crystallinity on the fiber diameter. Crystallinity percentage measured via DSC.
73
Figure 3.1.6.1. SEM images of MEW PP fibers showing the phenomena of “pulsing”, where an unstable polymer jet results in alternating thick and thin sections along the fiber. Scale bar 20 µm. Unpublished results as part of this thesis exploration.
75
Figure 3.3.1.1. Thermal properties of commercial PPs with peak melt temperature listed for each.
81
Figure 3.3.1.2. Left to right: 20% PP6502/80% PP1014H1, 80% PP6502/20% PP1014H1, 20% PP6102/80% PP1014H1, 80% PP6102/20% PP1014H1.
83
Figure 3.3.2.1. Left: Photograph of MEW printed 20/80 blended PP6502 and PP1014H1, scale bar 1 cm. Right: OM images of MEW printed 20/80 blended PP6502 and PP1014H1.
84
Figure 3.3.3.1. Top: Schematic of the aluminium collector plate (top), silicone heating mat (middle) and PEEK non-conducting base plate (bottom). Bottom left: Photo of the components of the heating mat. Bottom right: The PID system that controls the silicone mat temperature.
86
Figure 3.3.3.2. Left: PP scaffold printed onto the heated collector at a temperature of 70 °C, with non-adherence of fibers visible. Right: PP scaffold printed onto the heated collector at a temperature of 80 °C, with structure integrity due to adherence of fibers to one another. Scale bar 0.5 mm.
87
Figure 3.3.4.1. SEM images of printed onto heated collector at 70 °C (a), 80 °C (b) and 90 °C, with all other parameters remaining the same. The effect of heated collector temperature on fiber morphology and fiber formation can be observed. Scale bars 20 µm.
88
Figure 3.3.5.1. Schematic of the printing path for each array regardless of collector translation speed, where the direction of printing is indicated by arrows and lines 2 to 19 are used for analysis.
88

x
Figure 3.3.5.2. Top: The average fiber diameter of PP fibers printed onto a heated collector set to a temperature of 70 °C, using a pressure of 1 bar using different collector translation speeds (25, 50, 75, 100, 125, 150 mm/min). Bottom: SEM images of the fibers corresponding to the average fiber diameters (top) where CTS occurs at 75 mm/min. Scale bars 100 µm.
89
Figure 3.3.5.3. Top: The average fiber diameter of PP fibers printed onto a heated collector set to a temperature of 80 °C, using a pressure of 1 bar using different collector translation speeds (25, 50, 75, 100, 125, 150 mm/min). Bottom: SEM images of the fibers corresponding to the average fiber diameters (top) where CTS occurs at 75 mm/min. Scale bars 100 µm.
90
Figure 3.3.5.4. Top: The average fiber diameter of PP fibers printed onto a heated collector set to a temperature of 90 °C, using a pressure of 1 bar using different collector translation speeds (25, 50, 75, 100, 125, 150 mm/min). Bottom: SEM images of the fibers corresponding to the average fiber diameters (top) where CTS occurs at 75 mm/min. Scale bars 100 µm.
91
Figure 3.3.6.1. Top: The average fiber diameter of PP fibers printed onto a heated collector set to a temperature of 70 °C, using a pressure of 0.5 bar using different collector translation speeds (25, 50, 75, 100, 125, 150 mm/min). Bottom: SEM images of the fibers corresponding to the average fiber diameters (top) where CTS occurs at 75 mm/min. Scale bars 100 µm.
92
Figure 3.3.6.2. Top: The average fiber diameter of PP fibers printed onto a heated collector set to a temperature of 80 °C, using a pressure of 0.5 bar using different collector translation speeds (25, 50, 75, 100, 125, 150 mm/min). Bottom: SEM images of the fibers corresponding to the average fiber diameters (top) where CTS occurs at 75 mm/min. Scale bars 100 µm.
93
Figure 3.3.6.3. Top: The average fiber diameter of PP fibers printed onto a heated collector set to a temperature of 90 °C, using a pressure of 0.5 bar using different collector translation speeds (25, 50, 75, 100, 125, 150 mm/min). Bottom: SEM images of the fibers corresponding to the average fiber diameters (top) where continuous, stable straight printing was not observed. Scale bars 100 µm.
95
Figure 3.3.6.4. Top: The average fiber diameter of PP fibers printed onto a heated collector set to a temperature of 90 °C, using a pressure of 0.5 bar using different collector translation speeds (175, 200, 225, 250, 275, 300 mm/min). Bottom: SEM images of the fibers corresponding to the average fiber diameters (top) where CTS is observed at 175 mm/min. Scale bars 100 µm.
97
Figure 3.3.7.1. The average fiber diameters across two arrays, where array 1 with slow collector speeds of 125 and 150 mm/min, and array 2 with the faster collector speeds of 175, 200, 225 and 250 mm/min are shown.
99
Figure 3.3.7.2. The average fiber diameters across three arrays of increase collector translation speed, where array 1 reflects collector speeds 325 to 450 mm/min, array 2 reflects collector speeds of 475 to 600 mm/min and array 3 reflects collector speeds of 625 to 750 mm/min.
100
Figure 3.3.8.1. SEM images of the stacking of fibers for arrays with 10 layers printed using collector speeds of 625 to 750 mm/min. Scale bars 20 µm.
101

xi
Figure 3.3.8.2. SEM images of the scaffolds printed using collector speed 750 mm/min with 0.2 mm fiber spacing (left) and 1 mm fiber spacing (right). Scale bars 20 µm.
102

xii
LIST OF TABLES
Table 3.2.1.1. Commercial PP sourced for the experiments herein.
75
Table 3.3.1.1. Viscosity of pure PP samples at zero-shear.
79
Table 3.3.1.2. Viscosity of blended PP samples at zero-shear.
81

xiii
LIST OF ABBREVIATIONS
3D three-dimensional
aPP atactic polypropylene
BSA bovine serum albumin
ButenOx 2-(3-butenyl)-2-oxazoline
CA cellulose acetate
CLSM confocal laser scanning microscopy
CROP cationic ring-opening polymerization
CTS critical translation speed
DecEnOx 2-ethyl-2-oxazoline
DSC differential scanning calorimetry
DTAB dodecyl trimethyl ammonium bromide
DTT dithiothreitol
ECM extracellular matrix
EDDET 2,2’-(ethylenedioxy)diethanethiol
EtOx 2-ethyl-2-oxazoline
FDM fused-deposition modelling
FITC fluorescein isothiocyanate
FR-CDM fiber-reinforced cartilage-derived matrix
GelMA gelatin-methacrylate
I2959 Irgacure 2959
IPN interpenetrating polymeric network
iPP isotactic polypropylene
IQR interquartile range
MeOx 2-methyl-2-oxazoline
MEW melt electrospinning writing
MFR melt flow rate
Mw molecular weight
OM optical microscopy
PAOx poly(2-alkyl-2-oxazoline)
PButEnOx-EI poly(2-(3-butenyl)-2-oxazoline-co-ethylene imine)
PCL poly-Ɛ-caprolactone
PDMS polydimethylsiloxane
PEEK poly ether ketone

xiv
PEG poly(ethylene glycol)
PEGDA poly(ethylene glycol)-diacrylate
PEI polyethyleneimine
PEtOx poly-2-ethyl-2oxazoline
PEtOx-co-EI pEtOx-co-(ethylene imine)
PLA poly(lactic acid)
PLGA poly(lactic-co-glycolic acid)
PMMA poly(methyl methacrylate)
PP polypropylene
RGD arginine-glycine-aspartic acid
SEM scanning electron microscope
SLA stereolithography
sPP syndiotactic polypropylene
TERM tissue engineering and regenerative medicine

xv
Statement of Original Authorship
The work contained herein this thesis has not been previously submitted to meet
requirements for an award at this or any higher education institution. To the best of my
knowledge and belief, the thesis contains no material previously published or written
by another person except where due reference is made.
Signature:
Date: 10/02/2017
QUT Verified Signature

16
Chapter 1 Introduction
1.1 Overview
Synthetic hydrogels are one of the key enabling materials in the field of tissue engineering and
regenerative medicine (TERM), this can be attributed to their high water content, similarity to
natural tissue, and their compatibility with cells and proteins [1]. The design demands for
modern hydrogels are ever increasing, as tissue engineered scaffolds aim to mimic complex
native structures [2]. There is, therefore, a continuing need for the development of new hydrogel
materials that can be tailored with full control over the architecture, functional groups and
mechanical properties of these materials.
Hydrogels are water insoluble networks that hold a minimum of 20% of their mass as water [3],
even up to 98.4 % water in some cases [4]. While hydrogels with a defined network size can be
considered porous structures, the porous network structure of the hydrogel is inherently much
denser than the micrometer-sized porosity required for biomedical, biosensor, drug delivery
and tissue engineering applications [5-8]. Many techniques have been developed to introduced
micro- and macro-porosity into hydrogels, including porogen leaching [6, 9], phase separation
[10, 11], gas foaming [12-14], cryogelation [15-17], solution electrospinning [18],
stereolithography (SLA) [19-21], and sacrificial templating [22-27]. These techniques can be
separated into two classes depending on the type of porosity that is produced, being either
random or non-random. For this thesis, random refers to the distribution of pores throughout a
hydrogel in a random, non-controlled fashion such as formed via gas foaming [12-14], whereas
non-random refers to controlled and designed porosity, such as in sacrificial templating from
defined printed templates. Interconnected, aligned pores are desirable for many applications,
including for tissue engineering of vascular networks [27], hydrogel microfluidics [5, 28],
self-healing materials [29] and soft robotics [30]. While efforts to produce aligned channel
features in the low micron range have resulted in two-dimensional pore structures [22],
three-dimensional (3D) features at such a small range are less successfully in pore fidelity. The
capacity to fabricate interconnected pores within the denser hydrogel network results in
hierarchically structured hydrogels, where there are multiple levels of structure, such as the
microscale (channel diameters) and molecular scale (hydrogel network). Not only is the ability
to design and produce hierarchically structured 3D hydrogels important, the ability to produce
features in the micrometer range is of desired for many applications.
17
Of the techniques to produce interconnected and aligned pores, sacrificial templating shows
great promise in enabling direct production of desired pore structures in hydrogels. Many
template production methods utilize layer-by-laver additive manufacturing techniques, such as
fused-deposition modelling (FDM) [31] and SLA [19, 20], though each have their own
disadvantages. A recently developed technology, melt electrospinning writing (MEW), employs
the use of a non-conductive polymer melt [32] that is electrically-drawn from a spinneret and
deposited onto a translating stage to produce fibers typically around 5 - 40 µm, Figure 1.1.1. The
deposition of fibers in a controlled manner enables the creation of 3D scaffolds and templates.
The use of melt electrospun sacrificial templates has the potential for the production of defined
pores in hydrogels, because of the controlled manner of production of the templates that can
directly influence the pore architecture of the resulting hydrogel.
Figure 1.1.1. Schematic of MEW, whereby a molten polymer is electrically-drawn from a spinneret onto a translating collector to produce fibers, which are deposited in a controlled manner.
Poly-Ɛ-caprolactone (PCL) is the most commonly used polymer in MEW, mainly, owning to its
properties that allow for relatively low temperatures during long periods of processing.
Moreover, PCL has been shown to be biocompatible, as well as degradable, which is applicable
for certain applications, though other applications may require the use of non-degradable
materials. Polypropylene (PP) is a polymer that has been melt electrospun previously [33-39],
though has not been processed in the direct-writing mode of MEW yet. Importantly, PP is a
non-degradable polymer that is already in use as medical devices, such as in hernia meshes and
sutures [40, 41], making it a promising polymer for biomaterial applications.
Natural polymers have been extensively utilized in the use as hydrogel precursors in TERM. The
main classes of natural polymers used in hydrogel preparation are polysaccharides and fibrous
structural proteins, components of the extracellular matrix (ECM). Chitosan, alginate, hyaluronic

18
acid and collagen are natural materials that are commonly and amply used to prepare hydrogels
for TERM applications. While natural polymers mentioned tend to be intrinsically bioactive, they
are not well characterized. Moreover, such natural polymers exhibit large batch-to-batch
variation and are less controllable than synthetic polymers, resulting in less ability to produce
specific and desired chemical and physical properties [42]. Synthetic polymers used to produce
hydrogels that lack the inherent biological stimuli that natural polymers possess, providing no
chemical or physical signals for cellular responses. However, synthetic hydrogels can be
functionalized in a more controlled manner than naturally-derived hydrogels. Therefore, specific
functionalization can occur for synthetic polymers and hydrogels, while tailoring of naturally-
derived polymers is more difficult. The production of synthetic polymers leads to base materials
that are a more reliable source than natural polymers, having the ability to produce a broad
range of materials with specific properties, because synthetic polymers give more control and
reproducibility of the chemical and physical properties, than natural polymers [42]. Therefore,
synthetic hydrogels have greater ability to be tune to achieve a range of desired range chemical
and mechanical properties.
Poly(ethylene glycol) (PEG), poly(N-isopropylacrylamide, poly(vinyl alcohol), poly(propylene
fumarate), and poly(hydroxyethyl methacrylate) are some of the most widely used synthetic
polymers for hydrogels [43-45]. PEG, also known as poly(oxyethylene) or poly(ethylene oxide),
has been hailed as the “gold-standard” for numerous applications. A promising alternative to
PEG, is a class of peptidomimetic polymers, first synthesized in the 1960’s collectively known as
poly(2-alkyl-2-oxazoline)s (PAOx), Figure 1.1.2. PAOx were largely ignored until improvements
in the synthesis sparked renewed interest [46-48].
Figure 1.1.2. The structures of PAOx (left) and poly(amino acid)s (right), showing that PAOx has a similar structure to poly(amino acid)s. EG = end group, R = alkyl. Adapted from [47].
Both, poly-2-ethyl-2-oxazoline (PEtOx) and poly-2-methyl-2-oxazoline have been shown to be
biocompatible, non-fouling polymers [47-49], though little attention has been given to the use of
PAOx for hydrogel applications, particularly in the use as biomaterials. A review of PAOx
hydrogels [47] highlighted the paucity of hydrogel preparation methods that are compatible
with biological systems, even though it is of extreme importance in enabling the implementation
of PAOx hydrogels within medical devices. Hence, in part, the literature review within this thesis
19
will summarize the use of PAOx for hydrogel preparation under conditions that could render it
useful for biomaterial applications where cell and protein compatibility are essential.
While the mechanical properties of hydrogels can be tuned to produce stronger hydrogels, the
mechanical properties cannot meet the requirements of native tissue. Recently, however,
research on the introduction of PCL scaffolds into gelatin-methacrylamide (GelMA) hydrogels
resulted in constructs with stiffness’s approaching that of native cartilage, with an increase of up
to 54 times [50]. Within this thesis, fiber reinforcement methods to achieve improved
mechanical properties of hydrogels will be discussed.
As stated above, there is a great need for the development of new hydrogel materials that can be
tailored with full control over the architecture, functional groups and mechanical properties.
PAOx offers opportunities for hydrogel crosslinking and functionalization, while the
implementation of MEW to produce both sacrificial templates and reinforcing scaffolds enables
the production of both hierarchically structured hydrogels and fiber-reinforced constructs,
respectively. Herein, hydrogels with controlled hierarchical architectures are presented, as well
as an investigation into the MEW of PP, a polymer that up to this point has not been processed in
this way. The MEW of PP could provide a non-degradable reinforcement approach for novel
composites that should provide increased mechanical strengths.

20
1.2 Fiber-Hydrogel Composites and Methods for Fiber Production
Tissue engineering aims to produce both soft and hard synthetic tissue replacements, when
alternatives for healing and recovery of injuries are not available. Hydrogels provide many of the
requirements for effective synthetic tissue replacements and are commonly used as a
framework where cells are included [42]. Moreover, the scaffolds supporting the de novo tissue
are required to be biocompatible and in most cases, biodegradable. Furthermore, porosity
throughout the hydrogel enables transportation of nutrients and the migration of cells
throughout such constructs, which is needed for cell viability and ECM formation. Mechanically,
the synthetic tissues have to be easy to handle prior to and during implantation and additionally
possess sufficient mechanical stability to complement the natural tissue surrounding it once
implanted. While, hydrogels can be used to mimic native tissue, they commonly possess poor
mechanical strength [51, 52], especially when compared with the requirements of many native
tissues, see Figure 1.2.1 for an overview of the elastic modulus of some native tissues [53].
Figure 1.2.1. Schematic of the elastic modulus of selected native tissues compared with polymer/glass. Reproduced from [53].
While the mechanical properties of hydrogels can be improved by increasing the crosslink
density or the polymer concentration, these changes lead to a more dense network structure
that can inhibit the migration of cells in and through the hydrogel [54]. Moreover, increasing the
density of the hydrogel may compromise the performance of a hydrogel by lessening the extent
nutrients and waste products can be transported in and out of the hydrogel. The unique balance
to achieve optimal hydrogel properties for cells and mechanical stability remains a challenge.
Additionally, when using hydrogels for fabrication of 3D structures using extrusion based
printing processes, shape fidelity remains intact with stiffer, mechanically more stable
hydrogels, whereas cells prefer a less stiff material, as illustrated in Figure 1.2.2 [55]. Therefore,

21
there exists a need for the biofabrication of hybrid constructs that meet both the mechanical and
biological requirements for TE applications.
Figure 1.2.2. Schematic depicting the biofabrication window that exists for hybrid composites to meet the mechanical and biological requirements of synthetic tissues. Reproduced from [55].
Recently, fiber-hydrogel composites have been produced whereby structural reinforcement has
been achieved by embedding scaffolds with 3D architectures, into hydrogels [50]. Distinct from
this, fiber-hydrogel composites with randomly dispersed fibers throughout the hydrogel matrix
have been fabricated. Random distribution of fibers in such hydrogel composites is achieved by
the use of fibers derived from natural sources, such as silk fibroin [56-58] and cotton [59]. While
it is possible to produce nanofiber-hydrogel composites in this way, composites produced from
microfibers provide greater strength in comparison with nanofiber-hydrogel composites [60];
therefore, random-nanofiber-hydrogel composites will not be discussed herein.
Microfiber-hydrogel composites showed increased strength capabilities compared with the
hydrogel only controls. Yodmuang et al. showed a maximum compressive modulus for a
silk-fiber silk composite of 34.0 ± 3.1 kPa, while the silk only hydrogel had a compressive
modulus of ~18 kPa [57]. Conversely, Visser et al. showed a maximum compressive modulus for
a PCL scaffold-GelMA composite of 405 ± 68 kPa, while the GelMA only hydrogel had a
compressive strength of 7.5 ± 1.0 kPa [50]. Simply, an increase in mechanical strength can be
obtained by using microfiber scaffolds, instead of random microfibers embedded in a hydrogel.

22
Microfiber-hydrogel composites have also been fabricated using woven [61, 62] and non-woven
scaffolds [18, 63]. Moutos et al. constructed woven scaffolds from bundles of continuous poly
glycolic acid yarn embedded into agarose and fibrin hydrogels [61]. Individual fibers were 104
µm in diameter, with bundles of fibers used to produce the woven scaffolds, see Figure 1.2.3. The
maximum Young’s modulus of any composite produced was 77 ± 24 kPa, with an overall
porosity of ~70% of the void volume of the 3D scaffold.
Figure 1.2.3. Surface view of the X–Y plane of the woven 3D scaffold (SEM), cross-sectional view of the Y–Z plane and cross-sectional view of the X–Z plane. Reproduced from [61].
Further research by Moutos et al., produced similar woven scaffolds using 154 µm multifilament
PCL yarn [62]. These scaffolds were used to form a fiber-reinforced cartilage-derived matrix
(FR-CDM) composite. This composite was seeded with human adipose-derived stem cells and
cultured in vitro up to 42 days showing that this method provides mechanical support, as well as
biological stimulation for seeded cells. While the properties of the PCL scaffold alone showed a
Young’s modulus of 224 ± 24 kPa, the FR-CDM composite had a lower Young’s modulus of 48 ± 3
kPa. This difference in compressive modulus was attributed to the manufacturing technique that
resulted in thick zones of CDM on the upper and lower surfaces of the PCL scaffold that
significantly reduced the load-bearing potential of the PCL scaffolds. Due to the tight-woven
nature of these scaffolds, the composite manufacture becomes more difficult when addition of
components is required. Non-woven scaffolds enable stronger complex architectures compared
with woven scaffolds and provide a significant void volume that can facilitate hydrogels, cells or
ECM components.
Hydrogel composites of two independently crosslinked polymers are called interpenetrating
polymeric network (IPN) hydrogels, see Figure 1.2.4 for a schematic representation of an IPN.
IPNs can exhibit higher toughness than single polymer hydrogels, as well as form a more dense

23
structure that results in a hydrogel composite with increased mechanical strength [64]. The
combination of IPN hydrogels with woven scaffolds leads to IPN-hydrogel-scaffold composites
with Young’s modulus 4 times higher compared with the single hydrogel-scaffold composite
controls. The maximum Young’s modulus achieved was 220 kPa for alginate/polyacrylamide
IPN’s with PCL-woven scaffolds [65]. The compressive strength is therefore still lower than
more recent microfiber composites produced with non-woven scaffolds with single polymer
hydrogels [66], while the woven scaffold provides less void volume for hydrogel infiltration and
subsequent, cell invasion to occur throughout.
Figure 1.2.4. Schematic of the molecular structure arrangement of an IPN. Reproduced from [64].
A common technique to produce non-woven scaffolds is solution electrospinning, which can be
used with both synthetic and natural polymers [67-69]. Randomly dispersed fibers are
deposited onto a collector to produce the non-woven mats, where the diameters are in the
nano- and micro-meter range. PCL is a common polymer of use for electrospinning, either on its
own or in blends with other polymers. The typical morphology of the scaffolds produced from
solution electrospinning is shown in Figure 1.2.5.

24
Figure 1.2.5. Solution electrospun non-woven scaffolds from PCL blends with 10 and 35% poly glycidol, respectively. Used with permission from Michael Schmitz, unpublished results.
Kai et al. produced solution electrospun PCL/gelatin blend or coaxial (core-shell) non-woven
scaffolds that were subsequently embedded into 5 wt% gelatin hydrogels to form composites.
The gelatin hydrogel by itself exhibited a Young’s modulus of 20.5 ± 1.3 kPa. While, the blended
non-woven scaffolds had a Young’s modulus of 130 ± 40 kPa and the coaxial non-woven scaffold
had a Young’s modulus of 560 ± 90 kPa. The authors suggested that the covalent attachment of
the nanofibers of the scaffold to the hydrogel, as shown in Figure 1.2.6, provides better
mechanical strength than pure gelatin hydrogels. However, the highest Young’s modulus
achieved for the composites was shown for blended PCL/gelatin fibers-gelatin hydrogel
composite with compressive strength of 94.5 ± 15.7 kPa [70].
Figure 1.2.6. Schematic for the mechanism of crosslinking between the gelatin present in the nanofibers of the scaffold to the gelatin hydrogel. Reproduced from [70].
Coburn et al. embedded PCL scaffolds into poly(ethylene glycol)-diacrylate (PEGDA) hydrogels
to produce composite sheets that were stacked to produce the larger composites [71]. Solution
electrospun scaffolds from poly(vinyl alcohol)-methacrylate and chondroitin
sulfate-methacrylate were also assessed. The maximum Young’s modulus achieved from the

25
fiber-hydrogel composites was ~180 kPa, in comparison with the PEGDA hydrogel only of
~50 kPa.
Strange et al. used solution electrospun PCL scaffolds to reinforce alginate hydrogels of 1, 3 and
5 wt%, where the scaffolds were backfilled with the alginate. While there was an increase in
indention elastic modulus from PCL scaffolds to composites, there was no significant change
from alginate hydrogels to PCL-alginate hydrogel composites [72]. Compressive modulus was
not measured in this study.
Mirahmadi et al. produced laminated electrospun silk-fiber chitosan hydrogels composites,
produced in a layer by layer approach. However, the resulting composites lacked significant
mechanical strength, whereby chitosan hydrogels without the electrospun scaffolds exhibited a
compressive modulus of ~0.2 kPa, while the fiber-hydrogel composite exhibited a compressive
modulus of ~0.6 kPa [73].
Additionally, non-woven scaffolds that have designed architectures via controlled deposition of
fibers, as opposed to the randomly distributed fibers of solution electrospinning, have also been
produced by layer by layer approaches [74, 75], though the translation of such scaffolds for use
in fiber-hydrogel composites is limited.
Boere et al. printed a two-component hydrogel into 3D structures with the co-printing of a
thermoplastic-supporting-polymer to produce reinforced hydrogels, see Figure 1.2.7. The
scaffold-hydrogel composite showed increased Young’s modulus in comparison with the
hydrogel only. The maximum Young’s modulus obtained for the scaffold-hydrogel composite
was 645 ± 12 kPa, while the Young’s modulus for the hydrogel only was 17 ± 1 kPa [66]. The
polymers and crosslinking agents used within the Boere research were all synthesized in their
own laboratory, and are not available commercially, which is an impediment to the wide-scale
use of this method due to the specific viscosities required for both the hydrogel and the
thermoplastic polymer used for printing.

26
Figure 1.2.7. 3D-printed thermoplastic network (a) and the thermoplastic-hydrogel construct. Reproduced from [66].
Visser et al. produced fiber-reinforced composites via embedding MEW scaffolds into hydrogels.
However, they also touched on the use of scaffolds produced by the traditional 3D printing
technique of FDM and found that the FDM scaffold-hydrogel composites lacked the required
mechanical strength, showing sudden loss of integrity at ~10% strain. FDM scaffolds also have
the added disadvantage of having low porosity of 72 – 88%, compared with MEW scaffolds of 93
– 97%. Moreover, the relatively thick fibers of the FDM scaffolds where shown to compress
under compressive strain, but did not elongate, as seen in the thinner fibers in MEW scaffolds
[50].
The MEW scaffolds fabricated by Visser et al. were produced by printing fibers in layers
perpendicular to each other, producing box-like scaffold structures, as shown in Figure 1.2.8.
These MEW scaffolds were produced from medical-grade PCL with overall void volumes of 93 to
98%. The scaffolds were embedded into GelMA or alginate hydrogels, with unconstrained
compressive tests of the hydrogels only, scaffolds only and composites completed. Compressive
measurements of hydrogels only showed maximum stiffness of 15.8 ± 2.0 kPa for the alginate
hydrogels, while PCL scaffolds only showed a maximum stiffness of 15.2 ± 2.2 kPa for PCL
scaffolds with 93% void volume. The maximum compressive strength for the scaffold-hydrogel
composite was attained for scaffolds with 93% void volume with alginate as the hydrogel, where
the maximum stiffness was 405 ± 68 kPa [50].

27
Figure 1.2.8. Schematic diagram of the box-like printed structure of MEW scaffolds (a) and optimal microscope image of box-like printed MEW scaffolds (b). Reproduced from [50].
The work by Visser et al. shows that the box-like structures within the MEW scaffolds work to
confine the hydrogels within the box-columns of the scaffolds. Because of stacking that occurs in
the MEW of PCL, the fibers produce mostly closed-walled boxes in which the hydrogel cannot
move past when the composite is compressed. However, some gaps in the closed-walled boxes
were observed, due to a lack of control when the deposition of fibers occurs during printing,
though this may simply be overcome by heat treatment of the scaffolds prior to embedding to
facilitate the closing of the gaps to achieve closed-walled boxes. Figure 1.2.9 shows that when
axial, unconfined compression is applied to fiber-hydrogel composites the PCL fibers of the
scaffolds are stretched laterally due to the displacement of the hydrogel against the box-column
walls [50]. This shows that designed scaffolds can be advantageous in producing fiber-hydrogel
composites with high strength, while providing enough void volume within the reinforcing
scaffold to retain a large area for hydrogel infiltration, which can be exploited for its biomimicry
of native tissue.

28
Figure 1.2.9. Left: Uncompressed fiber-hydrogel composite (top) and fiber-hydrogel composite after compressive strain of 30% (bottom). Scale bars: 1 mm. Right: MEW PCL scaffolds (blue) act to reinforce GelMA hydrogels (yellow) in axial compression. Reproduced from [50].
As with solution electrospinning, PCL is the most commonly used polymer for melt
electrospinning [50, 76-81], though other polymers have been used, namely,
poly(lactic-co-glycolic acid) (PLGA) [82], poly(lactic acid) (PLA) [83], PEG-block-PCL [84-88],
poly(L-lactide-co-ε-caprolactone-co-acryloyl carbonate) [89], poly (methyl methacrylate)
(PMMA) [90] and PEtOx [91]. PP has been melt electrospun by several groups (see Chapter 3),
though PP has not been processed in the direct-writing mode of ME. PP fibers have been
produced by other melt spinning methods at an industrial scale, and improvement of the tensile
properties of such fibers has been explored recently [92]. The tensile properties of PP single
fibers produced by traditional melt spinning methods are influenced by the take-up velocity
used, though take-up spinning is a variable that is not present in MEW. However, isotatic PP
single fibers exhibited a tensile modulus of 1.6 ± 0.2 GPa when the take-up velocity was 200
cm/min [92], by comparison, the tensile modulus of PCL single fibers was ~0.3 GPa, produced
via melt spinning with take-up velocity of 200 cm/min [93].
PP has excellent mechanical properties, is a low density polymer and has a high ease of
processing. Therefore, the exploration of MEW of PP to produce non-degradable scaffolds may
have numerous applications, including as meshes for hernia repair [94].

29
1.3 Sacrificial Templating There is a growing interest in hydrogels with controlled porosity, owing to their importance in
applications such as in biomedical, biosensor, drug and gene deliver, and tissue engineering [26,
95-100]. A commonly used method to produce porosity in hydrogels is sacrificial templating.
Various types of sacrificial templates have been used (Figure 1.3.1), including the use of native
kidney tissue [101], the fabrication of 3D printed templates [102] and the precipitation calcium
carbonate to form spherical vaterite templates [103].
Figure 1.3.1. Sacrificial templating methods. Top: Schematic images (a, c), OM image (b) and SEM image (d) using native kidney tissue. PCL solution is perfused into the kidney tissue (a), PCL vascular cast after tissue digestion (b), collagen coated PCL cast (c), and hollow collagen micro-vascularized scaffold after dissolution of PCL cast (d), scale bar 200 µm. Adapted from [101]. Middle: Schematic diagram method using MEW PCL templates. MEW PCL scaffold (a), PCL templated embedded into PAOx hydrogel (b), and hollow channels within PAOx hydrogel after PCL template dissolution (c). Adapted from [102]. Bottom: Schematic diagram of CaCO3 vaterite template method, dispersion of templates in alginate (a, b), and formation of hydrogel and dispersion of CaCO3 upon addition of HCl. Reproduced from [103].
However, certain methods do not provide design control over the architectural features of the
resulting hydrogel by only reproducing perfusable natural architectures, such as the use of the
native kidney tissue as templates. Moreover, the use of precipitation of a salt to form spherical
30
crystals as sacrificial templates also has limitations in control over the size of template particles
and does not provide the opportunity for complex 3D designs. Conversely, a 3D printed
sacrificial template provides control over the architectures that are fabricated, yielding
templates with defined features that can then be translated directly to the porous structure
within the hydrogels.
The concept of using 3D printed templates to introduce porosity into hydrogels was recently
demonstrated by Miller et al. using an elegant approach starting with a lattice of glass sugar
fibers. These were produced using a commercial 3D printer from a mixture of glucose, sucrose,
and dextran. The fibers were coated with a thin layer of PLGA to prevent dissolution before
being embedded into the hydrogel precursor solution. The lattice template that was embedded
within the hydrogel was dissolved away to leave pores with dimensions of 150 to 750 µm [27].
Agarose has also been used as a sacrificial sugar template, whereby fibers were printed using a
commercial bioprinter by extrusion through a capillary, and subsequent submersion of the
fibers into hydrogel precursor solutions before gelation. After gelation, the removal of the fibers
was achieved by vacuum aspiration or by manual pulling which resulted in porous hydrogels,
composed of methacrylate gelatin, star poly(ethylene glycol-co-lactide), poly(ethylene glycol)
dimethacrylate and poly(ethylene glycol) diacrylate. The dimensions of the channels attainable
using this method were 150 to 1000 μm, and different channel diameters could be used in a
single hydrogel. A disadvantage of this method is the fiber removal technique, which limits the
complexity of the microchannel design [96].
Another sacrificial or ‘fugitive’ ink is Pluronic, which is temperature sensitive; provides a simple
approach for fiber removal. (Pluronic is a registered trademark of BASF.) By extruding aqueous
Pluronic F127 through 30 to 200 μm diameter nozzles into a reservoir of thermally gelled but
not chemically crosslinked F127 diacrylate or gelatine-methacrylamide, omnidirectional
patterns could be generated. Once the acrylate or methacrylamide groups were photochemically
crosslinked the removal of the fugitive ink was achieved by cooling and application of a mild
vacuum to the pores. Using this method, bifurcating channels as large as 600 μm and as small as
18 μm were possible, although the smaller channels contain some surface aberrations. The
lower limit for pore diameter reported using sugars or Pluronic as the printed sacrificial
templates is approximately 20 μm with loss of precision for these lower channel sizes occurring
[104, 105].

31
Scott et al. successfully introduced aligned pores into fibrin constructs, whereby the production
of pores, with average diameters of 11.7 µm was achieved by employing sacrificial templates of
cellulose acetate (CA). Moreover, they successfully added porosity to other fibrin constructs
using sacrificial templates of melt-extruded PMMA fibers and produced pore diameters between
18 – 250 µm, Figure 1.3.2. Acetone was used as solvent to dissolve both CA and PMMA fibers. Of
importance is that the diameter of the sacrificial fibers was replicated in the diameter of the
resulting pores for both CA and PMMA fiber bundles. To validate the hypothesis that aligned
channels help in axonal growth more so than non-aligned porosity control-constructs were
produced for comparison. The non-aligned porosity was completed by creating 3D structures
with tortuous paths via spherical templates. The importance of aligned constructs compared
with non-aligned constructs for axonal extension was demonstrated with increased rates of
extension in the aligned constructs. Thus, aligned channels provided the necessary physical
guidance cues to support axonal migration at higher rates than the non-aligned constructs [106].
Figure 1.3.2. Left: Sacrificial PMMA template fibers (grey) were bundled within a Teflon mold (a). Fibrinogen in phosphate-buffered saline was back-filled around the aligned fiber bundle via centrifugation (b) and polymerized to fibrin (brown). PMMA was dissolved using acetone, producing aligned hollow channels (white) within the fibrin matrix. Right: SEM images of hydrogels after templating showing the hollow channels. Reproduced from [106].
MEW produces fibers typically around 5 – 40 μm [32] and can be deposited to manufacture 3D
constructs. It is hypothesized that this technique could be used to fill the gap in low micron
printed pores that can contain clearly-defined smaller diameters in three dimensions. The use of
melt electrospun sacrificial templates seems highly promising for the production of pores in
hydrogels due to the controlled manner of production for the templates, which can directly
influence the pore architecture of the resulting hydrogel.
Micro/macro-porous hydrogels are highly promising for uses in many fields, including in tissue
engineering , though the need to obtain control over the porous architecture of such hydrogels is

32
very important to licit the continued advancement in many areas of fundamental and
translational research. The porosity-inducing techniques discussed within this chapter show
some of the ways to induce such controlled linear porosity while noting some challenges that are
apparent in these fabrication methods. MEW holds promise in filling a gap in the need for highly
controlled hydrogel architectures by way of sacrificial templates providing a route to hydrogels
that are highly-defined and with low micron pore diameters.

33
1.4 Poly(2-alkyl-2-oxazoline) (PAOx) Hydrogels Previous research showed that PEtOx and poly-2-methyl-2-oxazoline are biocompatible and
non-fouling polymers [47-49]. Owning to the multimodal-functionality that can be included
easily into the backbone of PAOx polymers, hydrogel preparation can be achieved in facile and
biologically compatible conditions. However, a review about PAOx hydrogels [47] showed the
lack of such preparation methods. A summary of PAOx hydrogel preparation under relevant
conditions that could render it useful for biomaterial applications is provided in the remaining
portion of this chapter.
1.4.1 PAOx Networks from Thiol-Ene and Thiol-Yne Reactions
Practically, the use of thiol-ene or thiol-yne chemistry enables the execution of a simple
hydrothiolation of an alkene or an alkyne, via a radical pathway. The versatility and flexibility of
this type of reaction can be seen in its facile reaction conditions, whereby they can be performed
in water, and at room temperature, and can proceed rapidly with near quantitative conversion.
The utility of thiol-ene chemistry has seen it adopted and widely used within polymer research.
Dargaville et al. have shown that statistically random copolymers of 2-methyl-2-oxazoline
(MeOx) or 2-ethyl-2-oxazoline (EtOx) and 2-(dec-9-enyl)-2-oxazoline (DecEnOx) can be
synthesized via cationic ring-opening polymerization (CROP). The resulting copolymers with
alkene side-chain functionality were crosslinked utilizing facile and mild reaction conditions, by
employing the use of UV-initiated thiol-ene chemistry to crosslink the polymer chains with a
di-functional thiol, 2,2’-(ethylenedioxy)diethanethiol (EDDET), see Figure 1.4.1.1 [107].

34
Figure 1.4.1.1. Formation of P(MeOx-DecEnOx) and P(EtOx-DecEnOx) hydrogels with EDDET crosslinking dithiol, via UV-irradiation crosslinking methods, showing the alkene-functionality of the DecEnOx moiety in the polymer side-chains. The hydrogel monoliths had tunable physical properties in direct relation to the swelling degree,
resulting from the hydrophilicity of starting monomers and the crosslinking density being
dependent on the alkene side-chain proportions. The ability for addition of biological moieties
onto the side chains of PAOx copolymers and the subsequent formation of a network via
thiol-ene chemistry is demonstrated by this work. The additional functionalization is another
advantage of PAOx-based networks as biomaterials, especially in comparison with PEG star
polymers in which functionalization is limited to the end-groups of the polymer chains.
Furthermore, a degradable dithiol, namely ethylene glycol bis(3-mercaptopropionate), was
utilized as crosslinking agent and the degradation of the resulting hydrogel was investigated.
This work demonstrates the versatility of this crosslinking method for future applications [107].
Dargaville and co-workers subsequently extended the use of hydrogels based on copolymers of
MeOx and DecEnOx, by moving from ethanol as a solvent to the more biologically-mild aqueous
conditions during crosslinking. The copolymers were initially functionalized with the peptide
CRGDSG, before being crosslinked using a dithiol crosslinking agent [108]. The tripeptide
arginine-glycine-aspartic acid (RGD) is a popular choice to mediate cell-attachment and is a
sequence found in extracellular proteins, such as fibronectin, laminin, and collagen. The
hydrogels were subsequently used as cell culture surfaces for the growth of human fibroblasts.
Of note, the amount of incorporated peptide dictated the fibroblast spreading and morphology.
The method Dargaville et al. employed easily enabled the synthesis of peptide-modified
hydrogels that promoted cellular adhesion on the surface. Stealth behavior of the hydrogels was

35
observed in control gels that were crosslinked without incorporation of the peptide into the
structure [108].
Huang et al. investigated PAOx polymers with long fatty-acid side-chains in the formation of
micelles in 2006, using the alkene-functionality in the fatty-acid side-chain [109]. Similar work
by Brummelhuis and Schlaad in 2011, utilized alkyne-functionality for miscellization, but
investigated diblock co-polymers from EtOx with 2-(3-butynyl)-2-oxazoline that had a triple
bond presents in the side chain [110]. Both research groups investigated the use of these
micelles as drug delivery carriers. Both groups, employed UV-irradiation to perform crosslinking
reactions at the core of micelles, and showed that UV-initiated thiol-ene and thiol-yne chemistry
are both a facile and effective method of crosslinking polymers for biological applications [109,
110].
Schubert and co-workers investigated the use of poly(2-(3-butenyl)-2-oxazoline-co-ethylene
imine) (PButEnOx-EI) –based hydrogels for application in DNA concentration and analysis, see
Figure 1.4.1.3. Linear PEI was produced from the hydrolysis of poly(2-ethyl-2-oxazoline), before
reaction with N-succinimidyl-4-pentate for the addition of 3-butenyl at some of the secondary
amines in the LPEI backbone via an amidation reaction, to produce P(ButEnOx-co-EI). The
network formation was achieved by the reaction of the alkene-functionality present in
P(ButenEnOx-co-EI) with the dithiol using 365 nm UV radiation. Ethanol was used as the solvent
and the sample was irradiated for 24 hours [111].
Figure 1.4.1.3. Formation of P(ButEnOx-co-EI) hydrogels with EDDET crosslinking dithiol, via UV-irradiation crosslinking methods, showing the alkene-functionality of the ButEnOx moiety in the polymer side-chains. Subsequently, selected hydrogels were investigated to determine their ability to bind and
release DNA. Genomic herring DNA was treated with ethidium bromide to produce an ethidium

36
bromide assay, which determined the interaction of the DNA with the hydrogel. These studies
showed that these hydrogels are able to bind and release DNA reversibly via the secondary
amine groups. The binding capacity was found to be directly related to the proportion of PEI in
the polymer backbone [111].
Release studies were performed employing the use of a heparin assay. Heparin is a polyanion
that can effectively bind the positively charged hydrogel, causing the DNA to be released. The
release studies showed that at room temperature, the release of DNA from the hydrogels upon
addition of heparin did not occur. However at 90 °C they showed that 50% of the bound DNA
was detached within 80 minutes [111]. Further studies to optimize the effectiveness of binding
and release of DNA are needed, to enable more cell compatible temperature conditions.
The use of hydrogels with reversible binding properties in the isolation and purification of
nucleic acids from highly complex samples provides an alternative to the use of two-dimensional
substrates, in fields such as diagnostics. An advantage of using a hydrogel, in comparison with a
flat substrate, is that in utilising a 3D structure the loading capacity is increased.
An example of the functionalization of a hydrogel after gel formation and not
post-polymerization was recently reported by Wiesbrock and co-workers. They produced
networks based on EtOx, 2-nonyl-2-oxazoline, DecEnOx and bis-2-oxazoline
2,2’-tetramethylene-bis-2-oxazoline. All four monomers were copolymerized via microwave
irradiation and due to the presence of the bis-functional monomer, the polymerization resulted
in the hydrogel being formed at this point. Fluorescein isothiocyanate (FITC) was incorporated
in the hydrogel via the end chains of the polymer network [112].
The resulting hydrogels were ground to particles in the micrometer range. After the milling
process, the addition of cysteine-bearing peptides via thiol-ene chemistry, onto the
alkene-moiety of the side-chain belonging to the DecEnOx subunit, was completed. This
FITC- and RGD-functionalized hydrogel was then utilized in cell tests. The
surface-functionalization of the hydrogel with the RGD-motif enabled integrin recognition at
cancer cell surfaces and the FITC-functionalization enabled the fluorescent imaging of the
resulting RGD/cell interactions. It was observed that adherence of the RGD-motifs to the human
pancreatic carcinoid BON cells was significant, in contrast to limited adherence of the
RGD-motifs to non-cancerous human endothelial cells [112].

37
1.4.2 PAOx Networks from Reaction of Amines with Epoxides
As an alternative to thiol-ene crosslinking, the crosslinking of amine-functionalized PAOx with
epoxides has recently been explored in the literature and the network formation of PAOx via the
amine-epoxide reaction is discussed, detailing the reaction conditions and potential applications
of each resulting network.
Legros et al. recently produced nanogels for potential applications as protein delivery carriers.
The proposed nanogels* could be utilized as protein delivery devices, whereby the cleavage of
di-sulfide bonds under acidic or reducing conditions occurs, similar to the conditions that may
occur in tumor tissue [113].
Legros et al. investigated the crosslinking of PEtOx, via two different methods, to produce
nanogels, both of which utilized 1,6-hexanediol diglycidyl ether, see Figure 1.4.2.1a as the
crosslinking agent to form nanogels. They also developed hydrogels utilizing the first method.
Both methods required the partial hydrolysis of PEtOx to form PEtOx-co-(ethylene imine)
(PEtOx-co-EI) resulting in a secondary amino group in the polymer backbone. This amino group
present on the polyethyleneimine (PEI) portion of the polymer chain was subsequently
crosslinked with the diglycidyl ether moiety. The second of the two methods also employed the
use of a disulfide-diglycidyl ether, see Figure 1.4.2.1b, to provide a point of cleavability at the
disulfide bonds to produce degradable gels [113].
Figure 1.4.2.1. (a)1,6-hexanediol di-glycidyl ether, (b)1,6-hydroxyethyl disulfide-bis-diglycidyl ether.
* The structures produced by Legros et al. that were identified as nanogels in their paper will identified as nanogels here, to enable
differentiation from the hydrogels that were also produced in that paper. Strictly speaking the nanogels produced in that paper were
larger than the IUPAC standard of 1 to 100 nm for nanogels, but due to the wide use of the term nanogel for structures larger than
100 nm in the current literature, that convention will be employed here [113].

38
The reaction conditions employed by Legros et al. used water as a solvent to produce the
non-degradable hydrogels, at a temperature of 80 °C [113]. The reaction conditions, such as
reduction temperature and the use of crosslinkers that are non-toxic, to induce the epoxide-
amine coupling would need to be explored to provide more biologically-viable reaction
conditions, to enable for example the gelation of the hydrogel in the presence of cells.
Potentially, utilizing a primary amine instead of a secondary amine would enable lower
temperatures to be used, though the addition of the primary amine into the side-chain of the
polymer would need to be obtained via an alternate pathway than the hydrolysis of PEtOx,
which will only form a secondary amine, in the form of the PEI polymer subunits. Furthermore,
solubility of 1,6-hydroxyethyl disulfide-bis-diglycidyl ether in water would also need to be
investigated, especially if a degradable-type hydrogel was required using that particular
crosslinking agent.
Schubert and co-workers investigated the use of PAOx-based polymers for the formation of
hydrogels and their subsequent binding and release of DNA. In recent years, they have looked at
the formation of co-polymers with primary amine-functionality on the side-chains [114]. A
Boc-protected 2-oxazoline was synthesized and utilized in the CROP reaction with EtOx
monomer to produce water-soluble co-polymers, with subsequent deprotection of the primary
amine moiety. The primary amine-functionality available on the co-polymer side-chains was
reacted with an epoxide crosslinking agent, epichlorhydrin, to produce the hydrogel network,
see Figure 1.4.2.2. Most recently, Schubert and co-workers introduced an inert polymer-based
matrix of either PP or polyethylene (porous filter substrates) to provide added structure-
stability to the hydrogel [115].

39
Figure 1.4.2.2. Formation of P(EtOx-AmOx) hydrogels with epichlorhydrin crosslinking epoxide, showing the amine-functionality of the AmOx moiety in the polymer side-chains.
Schubert and coworkers stated that the reaction of epichlorhydrin with the primary amine
moiety of the side-chain of the co-polymer, under basic conditions, proceeds via a ring-opening
reaction at the epoxide with the primary amine of the co-polymer, whereby the chlorine of
epichlorhydrin can than undergo a reformation of an epoxide with the resulting OH group, by
elimination of HCl. A second ring-opening reaction of this newly formed epoxide with another
primary amine group produces the resulting hydrogel network [114, 115]. However,
epichlorhydrin is also toxic and therefore, as stated above alternate crosslinkers should be
explored.
The DNA binding and release studies on both the non-matrix-supported [114] and
matrix-supported hydrogels [115] showed that both pure hydrogels and the composites were
able to bind DNA, with release assisted by the addition of heparin. The release of genetic
material from the hydrogels after binding needs continued research to find different release
stimuli, as in the later work with matrix-modified gels, both pH and temperature stimuli did not
enable release of gene material to an appreciable amount [115].

40
1.5 Thesis and Research Questions
As outlined above, hydrogels are important in many fields of research, including in TERM.
Moreover, porosity of such monolith structures is required for my applications, from soft
robotics to vascularization of tissue. Therefore, techniques to produce controlled, aligned
porosity with high fidelity are needed.
The disadvantage of hydrogels from a mechanical strength perspective was highlighted, while a
focus on the literature for methods to increase the mechanical strength of hydrogels was
discussed. Reinforcement of hydrogels using polymeric scaffolds was shown to be a facile and
effective method to increase the mechanical strength of hydrogels. Moreover, the relatively new
technique of MEW was shown to be an ideal method to fabricate reinforcing scaffolds for
fiber-hydrogel composites with high mechanical strength.
A new polymer for MEW, namely PP, is proposed as an alternative to the commonly used PCL. PP
has been used extensively in medical devices, and is a non-degradable polymer with high tensile
strength. Therefore, the use of PP as a reinforcing scaffold for hydrogels provides an opportunity
to produce fiber-hydrogel composites with increased strength. Furthermore, PP provides an
opportunity to fabricate medical devices without fiber degradation, which is the case for PCL
and other commonly used MEW polymers.
Techniques to produce porosity within hydrogels were discussed, with MEW of sacrificial
templates being proposed as a facile method of fabrication of hierarchically structure hydrogels,
with potential applications in tissue engineering, drug delivery and soft robotics.
Lastly, an overview of the synthesis of PAOx hydrogels in biologically relevant crosslinking
conditions was provided. PAOx polymers show potential to be an alternative to the much used
PEG, with the added advantage of high functionality.
1.5.1 Research Questions
Can MEW sacrificial templates be used to create novel and intentionally designed hierarchical
structured PAOx hydrogels in high fidelity?
Can commercial PP’s be processed via MEW to create scaffolds? What processing conditions and
parameters are required for MEW of PP?

41
Chapter 2 Controlling Pore-Architecture in Hydrogels by Fiber
Templating using Melt Electrospinning Writing
Parts of this chapter were published in: Jodie N. Haigh, Ya-Mi Chuang, Brooke Farrugia, Richard Hoogenboom, Paul D. Dalton, Tim R. Dargaville, Hierarchically Structured Porous Poly(2-oxazoline) Hydrogels, Macromolecular Rapid Communications, 37 (1) (2016) 93-99.
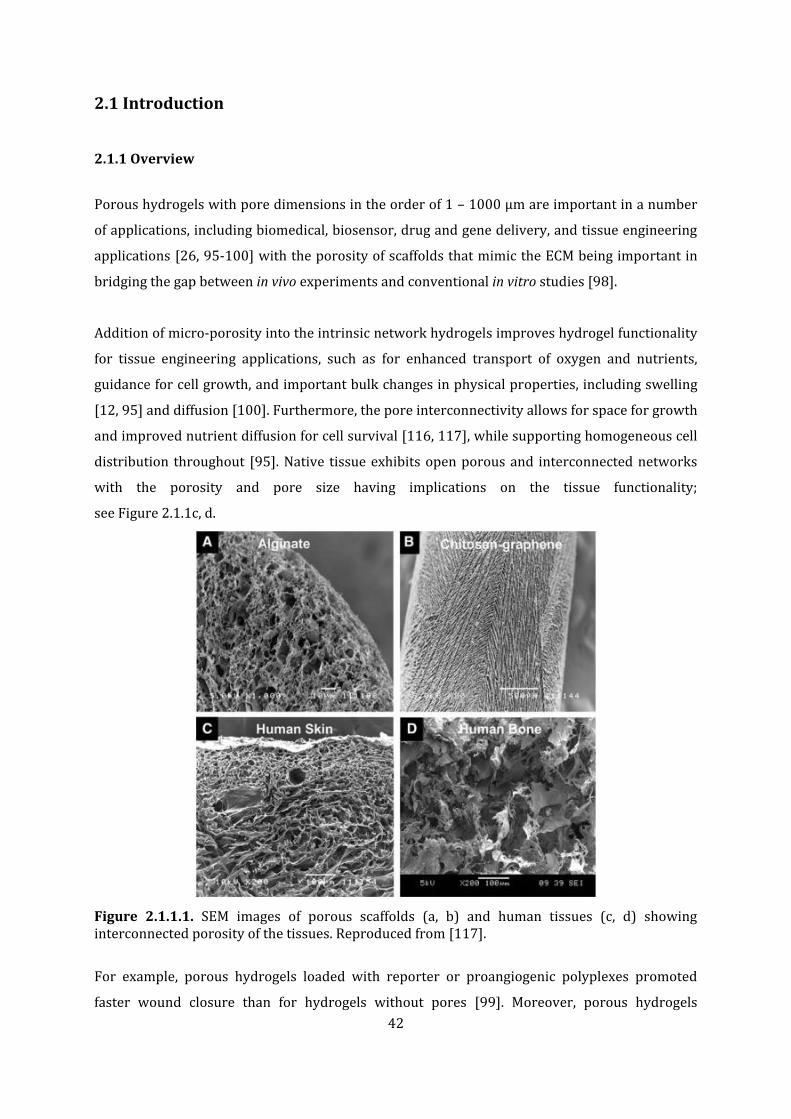
42
2.1 Introduction
2.1.1 Overview
Porous hydrogels with pore dimensions in the order of 1 – 1000 µm are important in a number
of applications, including biomedical, biosensor, drug and gene delivery, and tissue engineering
applications [26, 95-100] with the porosity of scaffolds that mimic the ECM being important in
bridging the gap between in vivo experiments and conventional in vitro studies [98].
Addition of micro-porosity into the intrinsic network hydrogels improves hydrogel functionality
for tissue engineering applications, such as for enhanced transport of oxygen and nutrients,
guidance for cell growth, and important bulk changes in physical properties, including swelling
[12, 95] and diffusion [100]. Furthermore, the pore interconnectivity allows for space for growth
and improved nutrient diffusion for cell survival [116, 117], while supporting homogeneous cell
distribution throughout [95]. Native tissue exhibits open porous and interconnected networks
with the porosity and pore size having implications on the tissue functionality;
see Figure 2.1.1c, d.
Figure 2.1.1.1. SEM images of porous scaffolds (a, b) and human tissues (c, d) showing interconnected porosity of the tissues. Reproduced from [117].
For example, porous hydrogels loaded with reporter or proangiogenic polyplexes promoted
faster wound closure than for hydrogels without pores [99]. Moreover, porous hydrogels

43
showed promotion of angiogenesis, even in the absence of proangiogenic factors. Therefore, it is
suggested that porosity within hydrogels can enhance tissue recovery/regeneration.
Recently, Duffy et al. fabricated porous hydrogels that were robust, and capable of retaining and
releasing both hydrophobic and hydrophilic therapeutics [100]. The tunability of the porosity in
such hydrogels gives the opportunity to provide an appropriate drug delivery system where
precise control over delivery rates of therapeutic molecules is easily achieved, either by tuning
porosity alone to increase surface area or by combining porosity with chemical functionality.
Hydrogels that have specific drug release profiles can mitigate high costs, reduce the risk of
certain drugs by decreasing drug amounts, and increase the bioavailability of drugs.
Verhulsel et al. highlighted the continued need for hydrogel structuring at the micrometer scale
level in their review, which explored both the recent trends, improvements, and challenges in
the development of ‘organs on chip’. The need for in vitro substrates that can mimic the in vivo
3D environment was highlighted [98].
Hydrogels are typically either utilized by immersion into the cell medium or by placement on a
porous membrane above the medium with the cells being seeded either on the surface of the
hydrogel or inside the hydrogel depending on the cell type. Synthetic engineered tissue for use
in in vivo applications has certain requirements that are of significance when designing 3D
networks. In most in vitro systems the supply of oxygen and the removal of waste are both
governed by diffusion, while in in vivo environments the diffusion of oxygen through tissues is
not sufficiently achieved by diffusion alone. The diffusion limit for the supply of oxygen and
nutrients as well as the removal of waste is approximately 200 µm [118]. Therefore, the
introduction of pores into artificial tissue constructs is vital for providing the necessary
microenvironment for the transport of oxygen and other nutrients, via convective means [119].
Moreover, the channels of the synthesized porous networks can be used to promote axonal
regeneration in the injured spinal cord in a highly directed manner [120]. This provides a basis
for the biofabrication of specifically designed synthetic tissue structures for biomedical
applications, much like structure of biological tissue.
The introduction of porosity into hydrogels can be completed using a number of techniques,
including phase separation [121, 122], gas foaming [12-14], cryogelation [15-17], solution
electrospinning [18], SLA [19, 20], and sacrificial templates [22-27]. The pore size, as well as the
interconnectivity and alignment of the pores are all dependent on the technique employed to

44
obtain the porosity. The latter two features are desirable for many applications including tissue
engineering of vascular networks, hydrogel microfluidics, self-healing materials and soft
robotics.
Porous networks formed by phase separation have relatively broad pore diameter distribution
and the agglomeration of the particles represents the final morphology of such hydrogels with
irregular interconnected voids of various sizes being reproduced throughout the synthetic
tissue. Figure 2.1.2 shows cross-sections of hydrogels produced using solvent-induced phase
separation where the size-distribution can be controlled by altering the polymer concentration,
though control over the alignment of the pores cannot be achieved with this method [121].
Figure 2.1.1.2. CLSM images of hydrated PDMSstar–PEG hydrogels prepared by solvent-induced phase separation with different wt.% ratios of PDMSstar-MA:PEG-DA from a DCM precursor solution (i.e. via SIPS). PDMS-enriched regions stained with hydrophobic dye. Scale bars = 250 μm. Reproduced from [121].

45
Cryogelation is conducted at subzero temperatures with frozen polymeric or monomeric
precursor solutions and can be used to produce both physically and chemically crosslinked
polymer networks that can be either homogeneous or heterogeneous constructs. The formation
of pores within the hydrogels occurs due to the formation of small ice crystals, which form larger
ice crystals as they recrystallize throughout the process as the temperature gradually increases.
The temperatures range from -196 to -15 or -6 °C in the study completed by Owen et al. with the
difference in thawing temperature influencing the final pore size distribution throughout the
hydrogel, see Figure 2.1.3 [17].
Figure 2.1.1.3. Confocal images of HA-furan/PEG cryogels that were formed at (A) a −15 °C thaw temperature, (B) a −15 °C thaw temperature in the presence of 220 mM galactose, (C) a −6 °C thaw temperature, and (D) a −6 °C thaw temperature in 220 mM galactose. Reproduced from [17].
Gas foaming can be used by employing a blowing agent at high pressures, then quenching of the
polymer/gas mixture to a super-saturated state, before the nucleation and growth of gas cells
throughout the polymer matrix to produce pores within the hydrogel. This technique can result
in homogenous hydrogels, though heterogeneity at high-energy regions can be introduced such
as at phase boundaries, where the free energy necessary to nucleate a stable void is lower [12].
Figure 2.1.4 shows the difference in pore structure and density of poly(acrylamide-co-acrylic
acid) hydrogels without gas foaming (a) and with gas foaming (b, c). Similarly to phase
separation techniques, gas foaming produces pores where size distribution may be controlled,
though controlled alignment of the pores is not achieved.
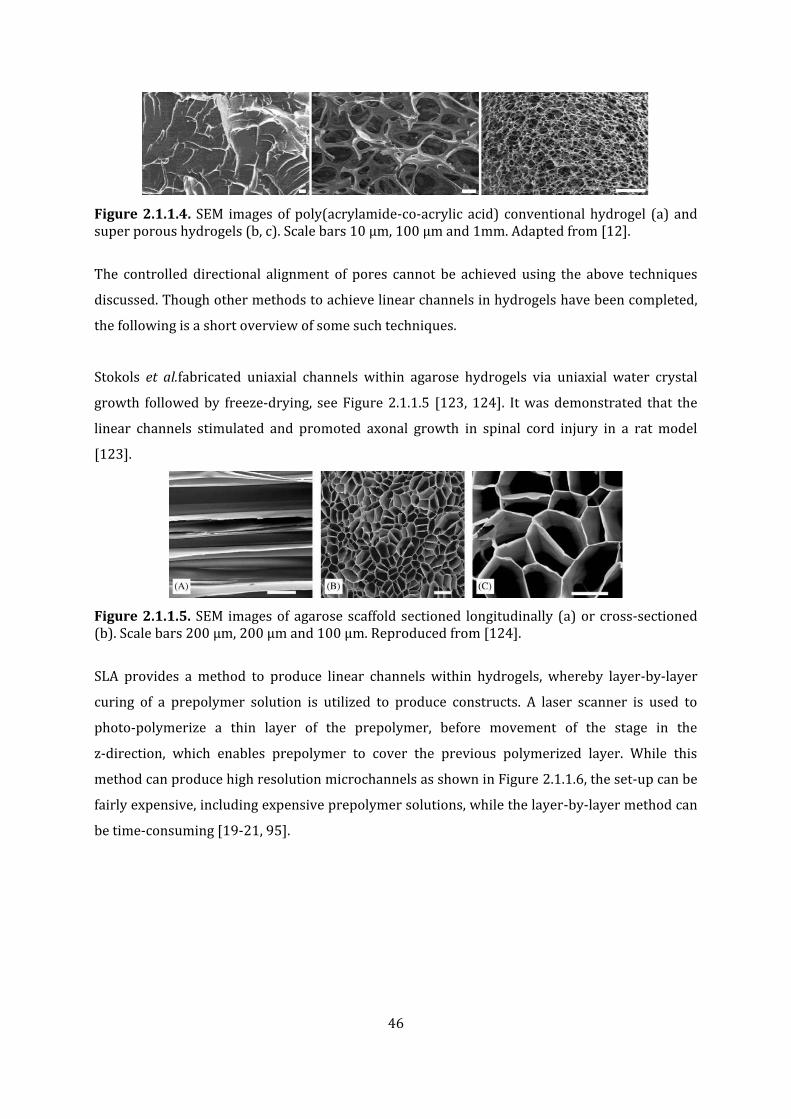
46
Figure 2.1.1.4. SEM images of poly(acrylamide-co-acrylic acid) conventional hydrogel (a) and super porous hydrogels (b, c). Scale bars 10 µm, 100 µm and 1mm. Adapted from [12].
The controlled directional alignment of pores cannot be achieved using the above techniques
discussed. Though other methods to achieve linear channels in hydrogels have been completed,
the following is a short overview of some such techniques.
Stokols et al.fabricated uniaxial channels within agarose hydrogels via uniaxial water crystal
growth followed by freeze-drying, see Figure 2.1.1.5 [123, 124]. It was demonstrated that the
linear channels stimulated and promoted axonal growth in spinal cord injury in a rat model
[123].
Figure 2.1.1.5. SEM images of agarose scaffold sectioned longitudinally (a) or cross-sectioned (b). Scale bars 200 µm, 200 µm and 100 µm. Reproduced from [124].
SLA provides a method to produce linear channels within hydrogels, whereby layer-by-layer
curing of a prepolymer solution is utilized to produce constructs. A laser scanner is used to
photo-polymerize a thin layer of the prepolymer, before movement of the stage in the
z-direction, which enables prepolymer to cover the previous polymerized layer. While this
method can produce high resolution microchannels as shown in Figure 2.1.1.6, the set-up can be
fairly expensive, including expensive prepolymer solutions, while the layer-by-layer method can
be time-consuming [19-21, 95].

47
Figure 2.1.1.6. Multi-channel PEG hydrogel via SLA: isometric view (a, c) and top-down view (b, d). Reproduced from [21].
Golden and Tien employed polydimethylsiloxane (PDMS) molds to produce 2D gelatin networks
that were used as sacrificial templates for the formation of porous collagen hydrogels. The
gelatin networks had features as small as 6 µm and were removed from the collagen hydrogels
by melting (37 °C) of the gelatin networks and flushing with saline or 1% BSA. It is noted that
swelling of the gelatin networks occurred during release from the PDMS stamp and before being
used as the sacrificial template for formation of porous hydrogels, therefore the pores size from
stamp through to final hydrogel construct are not directly reproducible using this method [22].
Furthermore, these channels were fabricated in two dimensions and therefore do not represent
the 3D environment of native ECM.
Sacrificial templates are prepared by using 3D printing techniques that enable the printing of a
positive mould that can subsequently embedded within a hydrogel, before dissolution of the
template to leave a negative of the design within the hydrogel. Various groups have successfully
employed the use of sacrificial templates to produce porous hydrogels, as discussed in detail in
Chapter 1, Section 1.3. These techniques provide the much needed control over specific pore
alignment, pore interconnectivity and 3D architecture that other techniques have lacked in some
form.
A new technique to process polymer in the molten state is MEW, which can produce highly
controlled sacrificial templates in a layer-by-layer additive manufacturing approach. The
architectures possible by way of MEW sacrificial templates provide a solution to producing
hydrogels that have highly-defined 3D channels, with channel diameters in the low micron
range.

48
2.1.2 The Melt Electrospinning Writing Technique
MEW was employed in this study to produce the templates for the sacrificial templating of
hydrogels (this Chapter), as well as being introduced in processing of commercial PP (Chapter
3). MEW is an additive manufacturing technique that enables a melt of a polymer to be
electrostatically printed via a computer program with pre-coded format to produce a construct
of designed and known architecture. The polymer used in this Chapter was PCL, which has been
utilized previously in the production of geometrically-defined 3D scaffolds. Similar to FDM, MEW
is deposited onto a collector, though MEW enables fiber production with much smaller
diameters, because of electrostatic drawing effects [76].
Melt electrospinning itself was initially described in a patent by Charles Norton from MIT that
was approved in 1936 [125], though the term melt electrospinning came later. In 1981 the
publication of the first scientific papers on the topic of electrospinning polymer melts occurred,
though the three part series of papers only mentioned melt electrospinning in the first of the
three [126]. The work showed that a polymer melt could be electrostatically drawn and that the
formation of the Taylor cone of these melts showed the same characteristics as per other fluids,
as Taylor had previously described [127].
PCL is the most commonly used for melt electrospinning [50, 76-81] in part due to the relatively
low processing temperature that can be used. PCL has also been shown to be biocompatible,
though no long term degradation studies have yet to be published. Other polymers such as PLGA
[82], PLA [83], PEG-block-PCL [84-88], PLA -co-PCL [89], PMMA [90] and PEtOx [91] have also
been melt electrospun.
In melt electrospinning, as well as in MEW, a viscous melt polymer jet is drawn through the air
towards a collector. This attraction towards the collector is established because of a potential
difference between the spinneret and the collector, as well as a relative higher viscosity of the
melt (when compared with polymer solutions). As stable jet can via the electrostatic drawing of
the molten polymer. Moreover, MEW operates within the region where the polymer jet does not
exhibit buckling, aiding in controlled fiber deposition when coupled with a translating collector.
Therefore, MEW provides control over the print design with the aid of a translating collector
plate and a computer-programmed design, while melt electrospinning exhibits fiber deposition
that is random and dynamic in nature [83].

49
MEW is termed an additive manufacturing or 3D printing technique, since layer-by-layer
assembly of fibers produces a 3D scaffold or template [128]. MEW operating parameters such
temperature, pressure, spinneret diameter, voltage of the spinneret and collector plate, and
spinneret to collector distance (also known as gap distance) can be varied. Furthermore, the
translating speed with respect to the fiber deposition speed enables the straight jet to be
deposited without buckling or excessive of the jet occurring, see Figure 2.1.2.1 [76]. The
translation speed at which a fiber begins to be deposited in a straight manner onto the collector
is called the critical translation speed (CTS), and varies depending on the operating parameters
and environmental conditions during printing.
Figure 2.1.2.1. Schematic diagram showing the shape of the melt electrospinning jet profile, which is dependent on the speed of the collector (Sc) relative to the jet speed (Sj) (a) and image of MEW PCL below CTS and above CTS (b). Reproduced from [76].
The temperature of the melt influences the viscosity of the polymer and together with the
extrusion rate affect both the jet stability and the diameter of the fiber produced [32, 87]. The
flow rate of the molten polymer to the spinneret is low compared with solution electrospinning
and is controlled by pressure, which proportionally increases the fiber diameter. Moreover, the
gap distance used is small compared with solution electrospinning. The small gap distances of 2
–5 mm enables the MEW of the polymer to be completed in the straight, stable jet path [32, 129].
The higher viscosity of polymer melts compared with polymer solutions limits the amount of
fluid that can be delivered to the spinneret. Moreover, smaller spinnerets can be restrictive to
the polymer flow due to this higher viscosity [32, 129]. Deng et al. states that the optimum
spinneret diameter is 0.4 mm [130].
The influence of applied voltage on the fiber diameter is not completely clear, as some groups
have stated that there is a strong correlation between fiber diameter and voltage, while others

50
have shown the opposite, with another showing a small correlation only. However, the applied
voltage is required to enable polymer flow, while it is important in stabilizing the polymer jet
during the process [32, 129].
Finally, operating just above the CTS, the collector speed that first produces fibers, ensures the
production of straight fibers that are not affected by increased translation speeds, which would
result in stretched fibers [91].
MEW exhibits an inherent advantage in that the process is solvent-free, resulting in no solvent
accumulation and therefore no additional solvent removal steps. Moreover, polymers such as PP
that are not soluble in most common solvents can be processed using this technique.
Furthermore, scaffolds and templates produced via MEW have much smaller fiber diameters
than traditional techniques, such as FDM, which leads to the production of markedly softer and
more flexible constructs.

51
2.2 Materials and Methods
2.2.1 Template Production
Melt electrospun templates were produced using a previously described melt electrospinning
technique, whereby scaffold fibers were printed onto a computer-programmed-translated x-y
stage, as collector [79]. PCL (Capa 6500C from Perstorp) pellets were loaded into a 5 mL glass
syringe (Hamilton; model gastight #1005) and subsequently, heated to 80 °C, and left at this
temperature overnight to displace any air bubbles from the melt. A blunt 23 G needle spinneret
was affixed to the syringe, before being placed into an electrically heated Macor™ ceramic
cylinder heated to 110 °C. The PCL melt was electrospun onto the stage at a distance of 15 mm
from needle tip to collector using a flow rate of 20 µL/hr and 11.7 kV potential. Printed
templates were simply removed from the stage by lifting and stored until use.
Softening experiments were completed by placing PCL template samples in falcon tubes before
immersion of the tubes into a recirculating water bath set to 58.7 °C for set various times.
Samples of 0, 3, 5, 10 and 15 minutes softening times were analyzed by scanning electron
microscopy (SEM).
2.2.2 Hydrogel Synthesis and Template Dissolution
In the exploration of the dissolution of the PCL templates from a hydrogel matrix, copolymers of
EtOx and 2-(3-butenyl)-2-oxazoline (ButenOx), with ratios of 380:20 or 190:10, were chosen to
be used as the hydrogel precursor polymer. We would like to extend a thank you to our
collaborators at Ghent University, Belgium, in the research group of Professor Richard
Hoogenboom, for the donation of these copolymers of EtOx with ButenOx.
Hydrogels were either formed around pre-produced 3D templates, by submersion of the scaffold
into the hydrogel precursor solution, or by printing of fibers onto pre-produced hydrogels,
before encasing with extra precursor solution and crosslinked. Hydrogel precursor solutions
were UV-irradiated to produced crosslinked networks surrounding the fibers. Irradiation was
performed using an Omnicure S1500 with a 365 nm filter and a 3 mm light-guide situated 5 cm
directly above the sample. Typically the polymer, the photoinitiator (Irgacure 2959 - I2959) and
dithiothreitol (DTT) were prepared in MilliQ water to obtain stock solutions. Volumes of each
stock solution were pipetted together and vortexed to facilitate mixing, producing the hydrogel
precursor solution with final polymer concentration of 10% w/v for the polymer and final I2959
concentration of 0.1% w/v.

52
The leaching of PCL templates from the hydrogels was completed by washing the 3D constructs
in acetone/water, until complete dissolution of the fibers. The optimal acetone:water ratio was
found to be 9:1, and a controlled increase of acetone from 100% water was employed to reach
the desired acetone concentration without adverse effects occurring, such as cracking of the
hydrogel network. The controlled increase to achieve 90% acetone from 100% water was
completed by using a syringe pump to add acetone dropwise into the vessel with the hydrogel
and water. A usual timeframe for changing from 100% water to 90% acetone took 1 hour. Once
the concentration of acetone was at 90%, the hydrogel in the solution mixture was left until
dissolution of the PCL was complete. It should be noted that sonication was utilized in some
instances to expedite the leaching of the PCL fibers from the hydrogel matrices. After dissolution
of the fibers, the hydrogels were returned to 100% water using a similar controlled method as
used for the increase in acetone above.
2.2.3 Microscopy
Optical microscopy (OM) was performed using a Leica M125 Zoom Stereo Microscope. Samples
of the templates, templates in gels and gels with channels (after dissolution of the template from
the gel) were placed on glass slides, with hydrogels being hydrated with water before imaging.
SEM of the PCL fiber templates was performed using a Zeiss Sigma Field Emission SEM,
equipped with a Zeiss Gemini column at an accelerating voltage of 5 kV. Prior to imaging, the
samples were gold-coated using a Leica EM-SCD005 Sputter Coater, with a thickness of
approximately 3-4 nm.
OM images were obtained of the templates and imprinted hydrogels through the various stages
of fabrication. The architecture and morphology of the PCL fibers, plus the architecture and
morphology of the hydrogels with embedded templates before, during and after template
dissolution were analyzed to ascertain the fidelity of template reproducibility during the
imprinting process.
Similarly, SEM was employed to analyze the morphology of the constructs produced. These
images provide qualitative information complementary to OM that enabled further elucidation
of the architecture and morphology of the templates and hydrogels produced. Sample
preparation for the templates required mounting on SEM stubs prior to the sputtering
mentioned above. Porous hydrogels required the use of rapid freezing followed by manual

53
breaking and subsequent freeze-drying to obtain cross-sections of the samples before mounting
and sputter coating.
Confocal laser scanning microscopy (CLSM) was completed on a Nikon A1R CLCM with the aid of
a fluorescent probe, namely FITC-dextran 70 kDa, to analyze the imprinted hydrogels. After the
dissolution of the template, the hydrogel was immersed in a dilute solution of FITC-dextran 70
kDa (6.8 × 10⁻³ w/v%) for approximately 1 minute before imaging in the hydrated state. Z-stack
images were obtained to provide 3D images of the channels within the hydrogels. Fluorescein as
the fluorescent probe was later used in the same manner as FITC-dextran 70 kDa above, to
compare the infiltration behavior of each dye into the bulk hydrogel.

54
2.3 Results and Discussion
The alkene-functionalized PAOx polymers can be crosslinked simply and quickly by using a
crosslinking agent that contains dithiol functionality and a photo-initiator such as I2959, as
shown in Figure 2.3.1. This thiol-ene photo-gelation method has been used extensively due to
the ease of both the crosslinking reaction and the synthesis of the starting polymers by cationic
ring opening polymerization of EtOx and ButenOx. PAOx hydrogels not only are easily
synthesized but have high potential as biomaterials [47] because of their biocompatibility and
multimodal-functionality that can be obtained.
Figure 2.3.1. The thiol-ene photo-gelation reaction of PEtOx-ButenOx copolymers with DTT as crosslinking agent and I2959 as photoinitiator, using 365 nm wavelength UV light.
Previous cell-seeding studies demonstrate that the choice of hydrogel for this study was justified
due to the potential use of these constructs produced herein for future tissue engineering
applications [108]. This type of PAOx hydrogel system can employ functionalization reactions
pre-, concurrent- or post-crosslinking with short chain peptides that contain
cysteine-functionality. This type of reaction can provide the necessary base for future
experiments to produce functionalized hydrogel constructs coupled with controlled porosity
(discussed later in this chapter) to produce physically hierarchical and chemically more complex
structures.

55
It is important to mention that I2959 is the photo initiator used in the crosslinking reaction and
is known to be toxic at high concentration. However, I2959 exhibits negligible toxicity below a
concentration of 0.05%, as shown when used to cure acrylate-PEG polymers with UV irradiation
at 365 nm of intensity of approximately 6 mW cm-2 [131]. The concentration of I2959 used in the
crosslinking of hydrogels herein was 0.05 wt % and therefore would exhibit minimal toxicity.
The crosslinking of the hydrogels in this study was completed using relatively short irradiation
times (less than 6 minutes) with UV light with a wavelength of 365 nm. Previously, these
reaction conditions were shown to be compatible when used in the encapsulation of cells in
MeOx and DecEnOx copolymers [108]. Though, EtOx and ButenOx copolymers were used in this
study, the Farrugia et al. study provides a sound basis for the use of PAOx polymers as the
hydrogel portion for tissue engineering applications. The crosslinking reaction conditions
employed are mild and facile in nature. Moreover, the ability to quickly crosslink hydrogels is
highly advantageous.
PCL was chosen as the model polymer for the sacrificial templates in this study, since it can be
processed over a wide range of temperatures, has a relatively low melting point of 60 °C and has
high thermal stability [93]. Moreover, PCL can be dissolved in common solvents, such as
chloroform, tetrahydrofuran and acetone, aiding in the removal of the templates from the
hydrogel constructs.
MEW PCL sacrificial templates were printed as wood-pile structures with varying template
thicknesses. To investigate the reproducibility of the pre-coded designs from code to printed
template, templates with varying spacing between parallel fibers were printed and the average
spacing of the templates by analysis of the SEM images with Image J software was completed.
Multiple spacing measurements from the center of one junction to the center of the next junction
were taken and the average was obtained. The analysis of the template obtained from printing
the pre-coded 200 µm spacing showed actual fiber spacing of 200 ± 73 µm. Similarly, the
printing of the pre-coded 400, 600 and 800 µm spacing obtained templates with actual fiber
spacing of 430 ± 58 µm, 600 ± 86 µm and 780 ± 33 µm. Though the average spacing
measurements correlate with the programmed spacing, the images in Figure 2.3.2 show definite
spacing irregularities in the actual printed templates, more so in the 200 µm spaced templates.
The deviation of the printed spacing arises from the built up charge associated with the layering
of fibers on top of each other and close to one another as discussed in the technical section about
MEW, section 2.1.2.

56
Figure 2.3.2. MEW printed PCL sacrificial templates. a) 200 µm programmed spacing, b) 400 µm programmed spacing, c) 600 µm programmed spacing and d) 800 µm programmed spacing. Scale bars a) and c) 100 µm, and b) and d) 200 µm.
Due to instabilities in the molten jet during MEW, fiber breakage is sometimes observed, Figure
2.3.2b. Many fiber breaks can be observed throughout the image 2.3.2b, where missing sections
of the linear fibers are visible throughout. Sagging of printed fibers is also observed, indicating a
slow rate of cooling; Figure 2.3.2c – d. As discussed in more detail later in this chapter, fiber
breakage and sagging can be remedied by simple parameter changes in the printing process,
such as changing the gas pressure or the speed of the collector.
The fiber topography is important in determining the final pore surface topography. It is
important to produce pores within hydrogels that are smooth, providing a non-tortuous
environment. The MEW produced PCL fibers exhibit surface topographies that are relatively
smooth, see Figure 2.3.3. However, crystallization occurs upon the cooling of the polymer in
ambient air, with spherulites present on the surface of the PCL fibers, Figure 2.3.4. While,
crystallization leads to surface aberrations on the fiber surface these are relatively negligible
with respect to the fiber curvature and diameter. Crystallization of PCL is dependent on a
number of factors including the polymer processing temperature, molecular chain length and
cooling rate [93]. The crystallinity of the PCL fibers is not of great importance within this study,
as they are sacrificial templates and will not be used in load-bearing or otherwise mechanical

57
applications where the alignment of crystals within the fibers may be of importance. The
crystallinity of the printed fibers may also have some effect on the degradation profile. Further
research into the crystallization of PCL under these processing conditions and subsequent
degradation studies of the fibers would be helpful to determine the effect of crystallinity on the
degradation time of the fibers.
Figure 2.3.3. MEW printed PCL templates showing the smooth surface morphology of the fibers. Scale bars 100 and 200 µm respectively.
Figure 2.3.4. PCL fibers upon cooling of the polymer fibers in ambient air can produce visible crystallization. One crystallization point is shown in a white box (left) with other crystallization points visible in both images. Scale bars 20 µm.
Another important factor of the template morphology is the fiber junctions, which enable the
imprinting of interconnected channels within the resulting hydrogel. The fiber junctions of the
PCL templates with 200 µm programmed spacing are shown in Figure 2.3.5 with a) showing the
fiber junctions of the PCL templates in the ‘as printed’ state after the completion of MEW
printing. The images b – e) show the PCL fibers junctions after annealing was completed. During
the MEW process the PCL fiber cools in the air as it is being printed, though residual heat is
present in the fiber as it being laid on the collector and onto previously printed fibers. Due to
this residual heat the junctions can fuse slightly, as shown in a). The fusion at the junctions can
be induced further by softening treatment, as shown in images b – e where softening treatment

58
using various times from 3 to 15 minutes was completed at 58.7 °C. The overall structure of the
3D template remains intact f) though increased fusion at the junctions can be produced b – e.
Depending on the application of use for the resulting porous hydrogels, the need to have
different degrees of junction fusion may be important. The templates employed to produce the
channels in the hydrogels later in this chapter were not subjected to softening treatment, as the
junction fusion ‘as printed’ was sufficient for that further study. Of note, while the fiber in Figure
2.3.5b shows roughness, this occurred during handling during the softening process and is not
representative of the fiber morphology of the majority of the MEW printed fibers.
Figure 2.3.5. Fiber junctions of 200 µm programmed spaced templates (a-e) at various annealing times: 0 min - ‘as printed’ (a), 3 mins (b), 5 mins (c), 10mins (d) and 15 mins (e). A softened scaffold top-down view after 10 minutes of softening treatment shows the overall template morphology still intact (f). Scale bars: a – b, e) 2 µm, c-d) 1 µm and f) 100 µm.
Sagging effects during printing are due to the slow rate of cooling of the molten polymer jet. As
the fiber is deposited onto the collector and across junctions of the previously printed layer, the
still cooling polymer deforms due to gravity across those junctions leading to the phenomenon
of sagging that can be seen in Figure 2.3.6. Note, image b – d show SEM images of the templates
inverse to the orientation they were printed, therefore the sagging appears upside down. Image
d) shows a magnified section of the junction where the newly printed fiber sags down over the
junction and onto the already printed fiber below. This sagging effect can be seen in the printed
templates and may be used as evidence of the template reproducibility as the template is
directly related to the final channel morphology within the hydrogel. Though, sagging may be
unwanted for many applications, it can provide an architecturally different structure that may
be important for certain studies or applications, such as fiber reinforcement of hydrogels [50]
where the wall-like structure that arises from parallel fiber fusing increases the Young’s

59
modulus of fiber-hydrogel composites by confining hydrogels with walled boxes. The fiber
reinforcement capability of such scaffolds will be discussed later in Chapter 4.
Figure 2.3.6. SEM images of PCL templates showing the sagging effect due to slow cooling of the molten polymer jet. Note, images b-d show the templates in the inverse position to the orientation they were printed. Scale bars: a-c) 100 µm and d) 10 µm.
As a proof of concept for this sacrificial templating technique MEW was used to produce
intersecting fibers, which were embedded into hydrogels. The intersecting fibers were printed
onto pre-fabricated PAOx hydrogels before the fibers were covered in hydrogel precursor
solution and irradiated to produce 3D hydrogels with encapsulated fibers, see Figure 2.3.7b. As a
comparison, cross fibers were printed directly onto the collector plate and imaged by SEM, see
Figure 2.3.7a. PCL fibers were removed from the hydrogel by washing with an acetone:water
mixture of 9:1 ratio, which enabled sufficient hydration of the hydrogel to limit cracking. As
stated above, PCL is soluble in acetone, as well as chloroform and THF. Acetone was selected as
it is miscible with water and eliminates the need to use three solvents to transition from water
to the dissolution solvent mixture. Chloroform was initially used as a solvent though the
hydrogel integrity was compromised showing deformation of the hydrogel matrix leading to
cracking. Furthermore, as chloroform is not miscible with water, a third solvent needed to be
employed to cycle from 100% water to 100% chloroform. This third solvent, in this case, was
acetone. Using a two solvent system made more sense, therefore an actone:water solvent
mixture was employed. The dissolution of PCL was expedited in some instances by sonication,
though dissolution can occur without it. Furthermore, to achieve faster dissolution of the PCL
fibers the fiber ends were open to the solvent mixture.

60
Figure 2.3.7. SEM image of PCL fibers printed directly onto collector plate (a), OM image of PCL fibers after being printed directly onto hydrogel with encapsulation in precursor solution and irradiation to form complete hydrogel (b) and hydrogel after washing to remove PCL with residual PCL remaining (c).
The average fiber diameter of the PCL fiber as imaged by SEM was measured to be
20.0 ± 0.3 µm. The average fiber diameter of the PCL fiber as imaged by OM through the
hydrogel matrix was measured to be 25 ± 1 µm. The difference may be attributed to the
following factors: the analysis of the fiber diameter from the SEM image a) is relatively easy as
the edges of the fiber are well-defined, which aids in measuring the distance from one edge of
the fiber to the other. Conversely, the hydrogel matrix surrounding the fiber in image b)
increases the difficulty of accurately measuring from one edge of the fiber to the other to obtain
the diameter due to the undefined fiber edge resulting from imaging through a hydrogel matrix.
This PAOx hydrogel has a similar refractive index to water, which may suggest the fiber appears
larger when viewed through the hydrogel matrix, similar to how objects in water appear larger
when viewed from air due to the different in refractive indices of air and water. Therefore, the
diameter associated with the OM image may not be as accurate as the diameter obtain from the
SEM image and may attribute to the difference in fiber diameters observed. The diameter of the
channel produced within the hydrogel due to the dissolution of the PCL fiber was measured to
be 27 ± 3 µm, though again the edge of the channel is difficult to determine accurately through
the hydrogel matrix.
After successfully embedding single fibers into hydrogels, entire 3D PCL templates were
embedded. Unlike single fiber encapsulation, 3D templates were not printed directly onto
preformed hydrogels. Longer printing times and the requirement of the hydrogel to remain
hydrated, as well as overcoming the issue of construct size as the spinneret needs to be a certain
distance from the charged collector plate, made direct printing onto the hydrogel not possible.
Therefore, 3D PCL templates produced above and described as wood-pile structures were used.
These templates were cut to fit within a shallow cylindrical Teflon mould. Hydrogel precursor
solution was pipetted into the mould and fully surrounded the template. In the case of bubbles
forming, though not often, the template was moved slightly with a spatula aid in the removal of

61
these. It is hypothesised that due to the amphiphilic nature [132] of these copolymer compared
with the more hydrophilic PEtOx, the polymer solution itself aids in the wetting of the
hydrophobic PCL fibers. The mould with hydrogel precursor solution and submersed template
were placed under the UV light and irradiated for less than 6 minutes. The hydrogel/template
constructs were stored in MilliQ water and gelation was confirmed as the hydrogels retained
their shape and structural integrity. A schematic of the 3D template encapsulation and removal
is shown in Figure 2.3.8.
Figure 2.3.8. Schematic of the sacrificial templating method employed, where the PCL template (white) is printed via MEW (a, b), then embedded into the hydrogel (c). The empty channels within the hydrogel (d) remain after washing away the PCL template and finally, backfilling with FITC-dextran (e) for imaging of the resulting channels.
Similar to the single fiber hydrogel constructs, 3D hydrogel/template constructs were washed in
an acetone:water (9:1) mixture to dissolve the PCL. Sonication again was used to expedite this
process. In initial constructs fiber edges were not directly exposed to the solvent mixture, but
instead hydrogel encased all sides and edges of the template. Later constructs had the fibers

62
exposed on the edges, simply by cutting away the hydrogel. The dissolution of the PCL template
from the initial constructs was longer than the later constructs, though dissolution did still
occur; therefore the dissolution of PCL can occur through the hydrogel mesh, though it occurs
faster when the PCL fibers are exposed directly to the solvent/mixture. Figure 2.3.9 shows
photographs of the hydrogels prior to PCL dissolution (a) and after PCL dissolution (b).
Figure 2.3.9. A hydrogel with embedded 3D PCL sacrificial template (a), and hydrogel after dissolution of the PCL from the construct (b). Scale bars 200 µm.
Similar to the single fiber hydrogel constructs, the ability to effectively image the 3D
template/hydrogel constructs was a challenge with OM. Figure 2.3.10 shows the PCL template
prior to being embedded within the hydrogel (a), after being embedded into the hydrogel (b)
and after dissolution of the majority of the PCL template with some residual PCL remaining (c).
The optical images that can be obtained when the template is present, either by itself (a) or
embedded into the gel (b), are representative of the template and hydrogel/template construct.
Optical imaging of such constructs can be achieved due to the transparent nature of the PAOx
hydrogels, which for many applications is an advantage, such as in the encapsulation of cells into
these constructs. However, once the template is dissolved the optical imaging of the hydrogel is
more difficult (c) as the microscope can only focus on the top layer of the channels and lower
layers are no longer in focus. Z stacks of the channels within the hydrogels were attempted, but
due to the lack of defined object (such as the PCL template) within the image, the compositing of
such images did not yield any desirable images.
Figure 2.3.10. PCL template only (a), PCL template embedded into PAOx hydrogel (b) and mostly dissolved PCL template from PAOx hydrogel. Scale bars: a) 1 mm, b – c) 250 µm.

63
A different method was needed to better image the resulting channels within the hydrogel after
dissolution of the PCL templates. CLSM was investigated as an alternate imaging technique
employing the use of a fluorescent dye. Initial experiments to determine the best dye for the
method produced some interesting results related to the diffusion of the dye through the
hydrogel and from the channels into the hydrogel. Figure 2.3.11 shows the structure of the two
dyes employed initially.
Figure 2.3.11. The structures of the fluorescent dye structures, fluorescein (left) and FITC-dextran (right), utilized for hydrogel channel imaging.
Fluorescein in the free acid form was used and is a simple molecule of 332.31 g mol-1.
FITC-dextran 70 is fluorescein isothiocyanate conjugated to dextran, a polymer of
anhydroglucose. This particular FITC-dextran is 70 kDa in size, which correlates to a Stokes’
radii of approximately 60 Angstroms being much larger in size than the fluorescein molecule.
Firstly, Figure 2.3.12 shows the diffusion of fluorescein throughout the hydrogel network within
5 minutes of submersion of the gel in the fluorescein solution (a). This indicates that the size of
the fluorescein molecule is too small to enable effective imaging of the channels as the
concentration of fluorescein is higher in the hydrogel matrix than the channels. Furthermore,
hydrogels submersed in FITC-dextran from 5 mins retained the dye within the channels to
enable accurate imaging of those channels. This dye also remains in the channels in the highest
concentration even after the submersion of the hydrogel in the solution for 5 hours (b). Diffusion
of FITC-dextran occurs from the channels into the bulk hydrogel as time progresses and image c)
shows the accumulation of the dye within the hydrogel network by diffusion of the dye from the
channels. The use of fluorescent micro-beads as the imaging dye was also attempted, though no
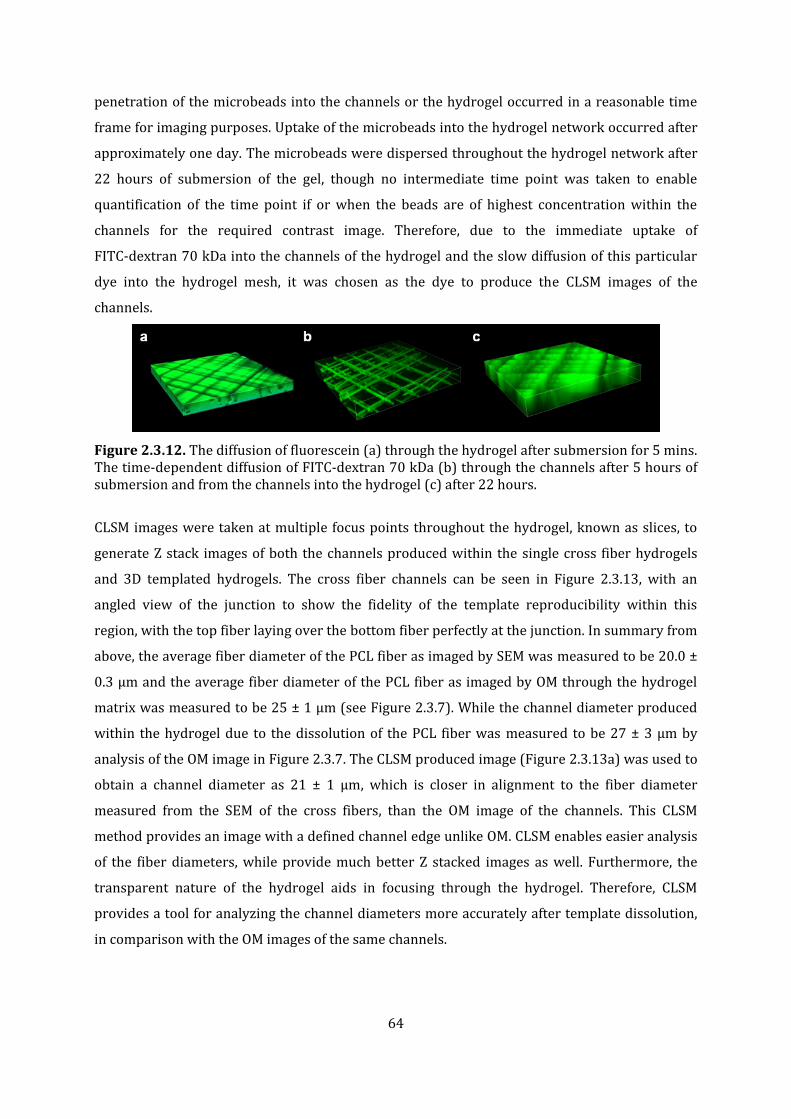
64
penetration of the microbeads into the channels or the hydrogel occurred in a reasonable time
frame for imaging purposes. Uptake of the microbeads into the hydrogel network occurred after
approximately one day. The microbeads were dispersed throughout the hydrogel network after
22 hours of submersion of the gel, though no intermediate time point was taken to enable
quantification of the time point if or when the beads are of highest concentration within the
channels for the required contrast image. Therefore, due to the immediate uptake of
FITC-dextran 70 kDa into the channels of the hydrogel and the slow diffusion of this particular
dye into the hydrogel mesh, it was chosen as the dye to produce the CLSM images of the
channels.
Figure 2.3.12. The diffusion of fluorescein (a) through the hydrogel after submersion for 5 mins. The time-dependent diffusion of FITC-dextran 70 kDa (b) through the channels after 5 hours of submersion and from the channels into the hydrogel (c) after 22 hours.
CLSM images were taken at multiple focus points throughout the hydrogel, known as slices, to
generate Z stack images of both the channels produced within the single cross fiber hydrogels
and 3D templated hydrogels. The cross fiber channels can be seen in Figure 2.3.13, with an
angled view of the junction to show the fidelity of the template reproducibility within this
region, with the top fiber laying over the bottom fiber perfectly at the junction. In summary from
above, the average fiber diameter of the PCL fiber as imaged by SEM was measured to be 20.0 ±
0.3 µm and the average fiber diameter of the PCL fiber as imaged by OM through the hydrogel
matrix was measured to be 25 ± 1 µm (see Figure 2.3.7). While the channel diameter produced
within the hydrogel due to the dissolution of the PCL fiber was measured to be 27 ± 3 µm by
analysis of the OM image in Figure 2.3.7. The CLSM produced image (Figure 2.3.13a) was used to
obtain a channel diameter as 21 ± 1 µm, which is closer in alignment to the fiber diameter
measured from the SEM of the cross fibers, than the OM image of the channels. This CLSM
method provides an image with a defined channel edge unlike OM. CLSM enables easier analysis
of the fiber diameters, while provide much better Z stacked images as well. Furthermore, the
transparent nature of the hydrogel aids in focusing through the hydrogel. Therefore, CLSM
provides a tool for analyzing the channel diameters more accurately after template dissolution,
in comparison with the OM images of the same channels.
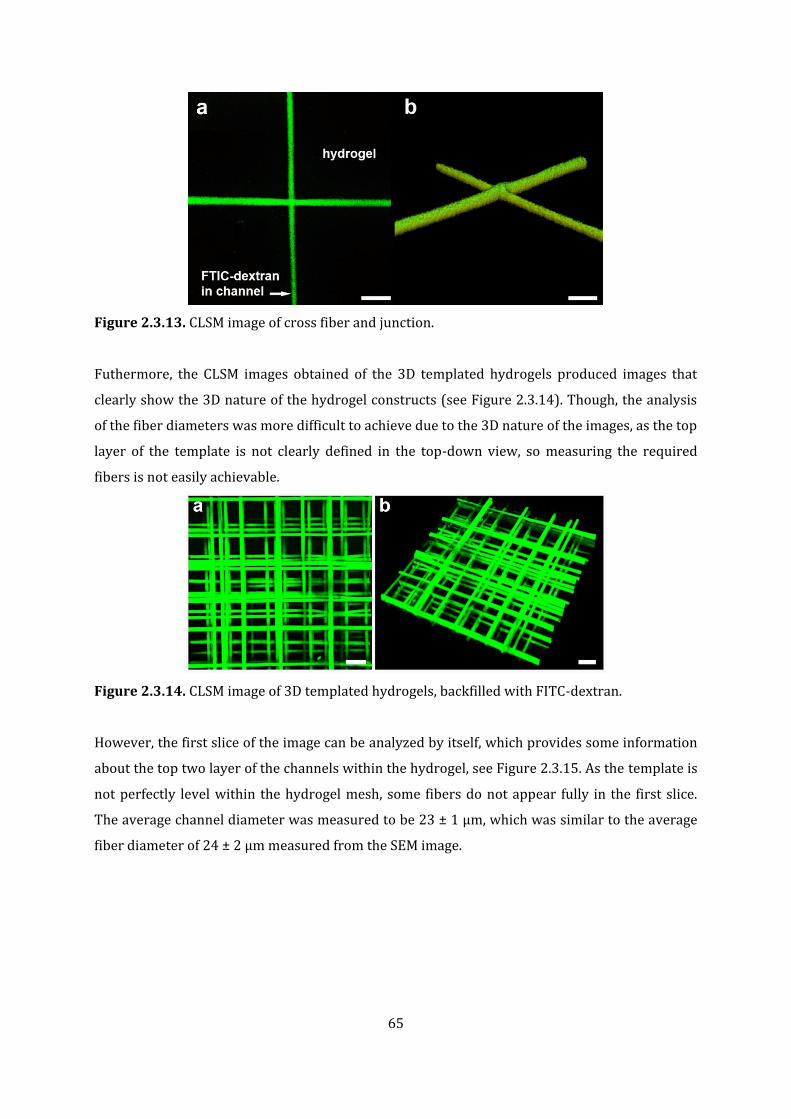
65
Figure 2.3.13. CLSM image of cross fiber and junction.
Futhermore, the CLSM images obtained of the 3D templated hydrogels produced images that
clearly show the 3D nature of the hydrogel constructs (see Figure 2.3.14). Though, the analysis
of the fiber diameters was more difficult to achieve due to the 3D nature of the images, as the top
layer of the template is not clearly defined in the top-down view, so measuring the required
fibers is not easily achievable.
Figure 2.3.14. CLSM image of 3D templated hydrogels, backfilled with FITC-dextran.
However, the first slice of the image can be analyzed by itself, which provides some information
about the top two layer of the channels within the hydrogel, see Figure 2.3.15. As the template is
not perfectly level within the hydrogel mesh, some fibers do not appear fully in the first slice.
The average channel diameter was measured to be 23 ± 1 µm, which was similar to the average
fiber diameter of 24 ± 2 µm measured from the SEM image.

66
Figure 2.3.15. Top slice from confocal microscopy image (left) and SEM image (right).
The fine detail of the PCL sacrificial templates was clearly reproduced within the hydrogels
confirmed by the CLSM images obtained of the indirectly printed channels. The details of the
template including the smooth fiber surfaces, template fiber junctions and the sagging
phenomenon of parallel fibers were reproduced within the hydrogels with high fidelity.

67
2.5 Chapter 2 Conclusions
This sacrificial templating technique provides a simple and universal way to induce designed
porosity into 3D hydrogels. MEW was a suitable method to design and print fiber templates in
the low micron range and with further improvements in the MEW field making more advances
in fiber size and construct design. In the coming years, MEW should develop into a technique
with more printable polymers, including water-soluble one, which will increase the desirability
of this sacrificial templating technique as the method should ultimately be able to be used
directly with cells present within the hydrogel precursor solution. Moreover, PAOx polymers
provide a facile and simple route to produce hydrogels in short reaction times, with the
polymers having multi-modal functionality that lends itself to being a promising biomaterial in
tissue engineering.

68
Chapter 3 Melt Electrospinning Writing of Polypropylene
3.1 Introduction
A limited number of polymers have been processed via MEW with PCL being the most commonly
used polymer to date. PCL is ductile, has a low melting point and can be processed over longer
times with minimal degradation, and these properties lend it to be readily processed. However,
these same properties limited the applications in which PCL can be used, and therefore are
undesirable for many applications. More recently, photo-crosslinkable polymers [89] and water
soluble polymers [91] have been processed via MEW.
PP is noticeable absent from the list of polymers that has been successfully processed via MEW.
Compared with PCL, PP has higher strength, is non-degradable and has a higher melting point.
Moreover, it cannot be dissolved in most solvents, and therefore is one of the commonly melt
electrospun polymers [129].
3.1.1 Melt Electrospinning of Polypropylene
Melt electrospinning of pure PP has been achieved by numerous research groups using various
electrospinning configurations. Various nozzle types have been used, ranging from standard
stainless steel spinnerets to the more unique needleless nozzles [34], as well as different heating
methods that include multiple and distinct heating areas of the polymer reservoir [37, 133], or
heat guns directed at the polymer jet to aid in electrospinning [86]. The heating temperatures
used have varied from 180 to 320 °C depending on the commercial polymer type employed. The
previously used commercial PPs have had various tacticities, molecular weights (Mw) and
melt-flow rates (MFR). MFR is the flow of a molten material under pressure. The MFR for PP is
measured as per ISO 1133, which is conducted at 230 °C with a pressure weighing 2.16 kg.
Furthermore, additives have been used to increase plastization and polarizability of the molten
PP [33, 35, 36, 86].
Research completed so far has shown that PP with higher MFR can produce fibers as low as 1.89
– 6.5 µm, depending on the experimental parameters [34, 92]. The MFR of a particular polymer
can be related to the polymer Mw, showing that higher Mw PPs produce larger fiber diameters
than their lower Mw counterparts. Commonly only MFR or Mw are reported in the literature
when PP is produced via melt electrospinning. This is because only one is usually provided by
the commercial supplier, which increases the difficulty of comparing the experimental results
from different research groups. Further increasing the difficulty of characterizing the raw PP

69
materials is that PP is not soluble in most solvents, making characterization techniques such as
solution state NMR and size exclusion chromatography not viable. However, PP is employed in
commercial melt spinning, where PPs with MFR from 400 to 1200 g/10 min are commonly used
[130].
3.1.2 Effect of Tacticity of Polypropylene on Fiber Diameters
Structure-property relationships exist throughout nature and the chemistry of PP is no different.
Due to the stereogenic center in the backbone of PP the methyl group attached to this carbon can
influence the overall properties of the polymer depending on the overall structure. The methyl
groups of isotatic PP (iPP) are all found on the same side of the polymer chain, while syndiotactic
PP (sPP) have specific alternation of the methyl groups. Lastly, atactic PP has a completely
random arrangement of methyl groups along the polymer chain. This phenomenon is referred to
as the tacticity of the polymer, see Figure 3.1.2.1 for a schematic representation of tacticity in PP.
Figure 3.1.2.1. Structural representations of the different tactic forms of polypropylene.
The physical properties of PPs are dramatically different depending on the polymer tacticity.
The atatic PP (aPP) form is a soft, elastic substance that is somewhat sticky, and exhibits lower
mechanical strength than iPP of the same Mw [134, 135]. Banks and Hogan, of Phillips
Petroleum, first invented a type vinyl polymerization with the use of a chromium oxide catalyst,
which enabled the production of iPP in commercial quantities, however, the more well-known
Ziegler-Natta polymerization that used a titanium-based catalyst is widely regarded as the
starting point of commercial PP production [136, 137]. IPP has long-range order enabling it to

70
exhibit high crystallinity which gives this type of PP higher mechanical strength than aPP, which
is amorphous and does not exhibit long-range order. Moreover, sPP also possess long-range
order with specific, defined tacticity, though is less commercially available.
Multiple crystalline forms of iPP exist, which include α, β and γ forms, depending on the
processing conditions. The α-crystal form is the most common, while β-crystals that are formed
can also undergo β⟶α recrystallization, where the melting of the β-crystals partially overlap in
the crystallization process of the α-crystal form [138]. Moreover, morphology, crystallinity,
microstructure, and melting and crystallization behaviors of iPP blends are strongly dependent
on the processing conditions including temperature and temperature gradients, as well as the
blend components [138, 139].
In ME of PP, Lyons et al. investigated various PP polymers with differing molecular weights
using both isotactic and atactic types to study the effect of tacticity on the resulting fiber
morphology and diameter [133]. IPP and aPP of similar Mw were melt electrospun using a 2 cm
gap between collector and spinneret, and voltage of 15 kV cm-1. The results showed that iPP
produced lower micron diameter fibers (avg. 3.55 µm), than aPP fibers (avg. 13.06 µm), Figure
3.1.2.2.
Figure 3.1.2.2. SEM images of melt electrospun PP. Left: Isotactic PP with Mw of 12000. Right: Atactic PP with a Mw of 14000. Adapted from [133].
More recent work by Kadomae et al. observed the same trend when investigating pure iPP and
pure aPP, as well as blends of iPP/aPP. The work showed that increasing the percentage of aPP
in the polymer blends resulted in larger fiber diameters during melt electrospinning, even
though the viscosity of both molten PPs was relatively the same [38]. These results suggest that
fiber diameter can be influenced by the tacticity of the PP, which is possibly due to aPP being
amorphous and inhibiting the ability for the PP polymer chains to align and be drawn into
thinner fibers during electrospinning of the molten polymer.

71
Solution electrospinning of sPP has been reported by Lee et al. [140] using a solvent
combination of acetone, cyclohexane and dimethylformamide (1/8/1 wt ratio); however, the
melt electrospinning of sPP has yet to be reported. Though it cannot be assumed that the melt
electrospinning of sPP would be similar to the SE of sPP, the average fiber diameter of SE sPP
was 0.65 ± 0.05 µm with heterogeneous fiber morphology, Figure 3.1.2.2.
Figure 3.1.2.3. SEM of solution electrospun syndiotactic PP fibers (left) and fiber diameter distribution (right). Adapted from [140].
3.1.3 Effect of Changing Processing Parameters on Fiber Diameters
Larrondo et al. showed that by increasing the voltage during electrospinning the fiber diameter
of the resulting PP fibers decreased. While also showing that increasing the temperature from
200 to 240 °C resulted in PP fibers with smaller diameters also, see Figure 3.1.3.1 [126].
Figure 3.1.3.1. The effect of voltage on fiber diameter of melt electrospun PP at heating temperatures of 200 °C (circles) and 240 °C (squares). Reproduced from [126].
Lyon et al. showed that increasing the voltage difference from tip to collector resulted in small
diameters of the PP fibers, see Figure 3.1.3.2. This is consistent with other electrospinning
research, whereby an increase in the electric field strength coupled with a steady amount of

72
polymer at the spinneret, increases the forces exerted onto the polymer melt, reducing the fiber
diameter during drawing of the polymer melt to the collector [133].
Figure 3.1.3.2. The effect of electric field strength on the fiber diameter during melt electrospinning of PP. Reproduced from [133].
Fang et al. showed that increasing the applied voltage had a slight effect on the resulting fiber
diameter, though with large deviation within each sample. Moreover, increasing the gap
between the spinneret and collector increased the diameter of the collected fibers, see Figure
3.1.3.3 [36].
Figure 3.1.3.3. The effect of applied voltage on the fiber diameter of melt electrospun PP at two different collector distances. Adapted from [36].
The Yang group used a needleless nozzle and a rotating copper collector to melt electrospin PP
at 240 °C and voltages from 20 to 50 kV [141]. All samples showed a decrease in fiber diameter
when the voltage was increased, for any given collector distance and rotational speed of the
collector, see Figure 3.1.3.4. Furthermore, the distance of the nozzle to the collector affected the
fiber diameter of the produced fibers. For experiments where the changing variable was the
increase in the gap distance from 5 cm to 8 cm, an increase in the fiber diameter was observed,
see specifically samples 7 and 9, and sample 8 and 10 [141].

73
Figure 3.1.3.4. The schematic diagram of needleless melt electrospinning system employed by Li et al. (top), the processing parameters used (bottom left) and resulting fiber diameters (bottom right). Adapted from [141].
However, an increase in voltage does not always leads to a decrease in fiber diameter, as shown
by further work from the Yang group where the voltage was increased from 30 to 33 kV and
then 36 kV. The results show that the fiber diameter increases with the increased voltages for a
standard collector system, see Figure 3.1.3.5. Moreover, when employing a collector with a
voltage set at 65 kV, the diameter decreased with increasing voltage until reaching 33 kV [34].
Whereas, Lee and Obendorf observed no notable change in fiber diameter from changing the
applied voltage, though they only utilized a range of 10 – 20 kV [142]. Therefore, decreasing the
fiber diameter is not as straight-forward as increasing voltage, as shown from the variation in
experimental results in the literature.
Figure 3.1.3.5. The effect of applied voltage on the fiber diameter of melt electrospun PP. Reproduced from [34].

74
An increase in temperature used for the polymer melt has been shown to decrease the fiber
diameter of the resultant PP fibers, see Figure 3.1.3.1 [126]. While, Kong et al. showed
decreasing fiber diameters for PP with a melt index of 900 over increasing temperatures, the
results for a PP with a higher melt index of 1500 showed a stable fiber diameter across all four
temperatures, see Figure 3.1.3.6 [143]. While, an increase in temperature can work to decrease
the viscosity of the polymer melt, there is a limit to which this applies.
Figure 3.1.3.6. The effect of temperature on the fiber diameter of two PPs, with melt indices of 900 and 1500, respectively. Reproduced from [143].
3.1.4 Effect of Polymer Parameters on Fiber Diameters
Kadomae et al. showed that the overall crystallinity of blended samples of PPs effected the
resulting fiber diameter, see Figure 3.1.3.7 [38]. Blends of iPP and aPP were melt electrospun to
observe the effect of the polymer crystallinity on fiber diameter. The average fiber diameter
decreased with increasing proportion of iPP being the more crystalline of iPP and aPP.
Figure 3.1.4.1. The effect of crystallinity on the fiber diameter. Crystallinity percentage measured via DSC. Reproduced from [38].

75
The MFR, sometimes referred to as melt index, can also effect the fibers diameters that are
produced, this is because the MFR directly reflects the Mw of the polymer, where larger MFR’s
correspond to lower Mw. Kong et al. demonstrated that a PP with higher MFR (lower Mw)
produced small fibers, than a PP with a smaller MFR (higher Mw) [143], as shown in Figure
3.1.3.6 in previous section. Dalton et al. also investigated commercial PPs with different MFR’s,
where the PP with the lower MFR (higher Mw) produced fibers with an average diameter of 35.6
± 1.7 µm, while the PP with the higher MFR (lower Mw) produced fibers with average diameters
of 8.6 ± 1.0 µm [86].
3.1.5 Effect of Additives on Fiber Diameters
Melt electrospinning has been conducted with additives to the PP polymer melts to produce
smaller fiber diameters. Recently, Chen et al. used steric acid and sodium stearate to achieve low
micron diameter fibers [33]. The smallest average fiber diameter of 1.8 µm was achieved by
using a stearic acid content of 10 wt %. Both additives achieved an overall reduction in fiber
diameter when printed with PP in comparison with fibers produced using only pure PP, which
was attributed to the polarizing and plasticization effect of the additives. Important to note, is
that the fibers had less crystallinity than the melt electrospun PP, therefore it is suggested that
the microstructure and thermal properties of the polymer are affected by the use of additives
[33].
The addition of a cationic surfactant, namely dodecyl trimethyl ammonium bromide (DTAB), to
the PP polymer melt resulted in smaller fiber diameters with respect to pure PP. This research
employing a needleless melt electrospinning device by Fang et al. produced fiber diameters
being less than 2 µm for the PP with DTAB, and only as small as 3.31 µm for pure PP. The
smallest fiber diameters produced were 400 ± 290 nm, though these fibers were did not
represent a large amount of the fibers and did not reflect the majority of fibers produced. The
DTAB may act in a way to reduce chain entanglement and promote chain alignment in the
electrospinning process, enable the production of smaller fiber diameters [36].
The introduction of additives to PP for melt electrospinning should be considered carefully, as
the additive will remain after printing, which may lead to mechanical instability of the fibers or
toxicity issues for biomedical applications. However, in other melt processing techniques, the
use of β-nucleating agents to increase the β-crystal form lead to increased tensile impact
strength and higher elongation at break [144].

76
3.1.6 Important Phenomena to Consider in Optimising the Printing of PP
Pulsing of the electrified molten jet was first reported when printing PEtOx [91]. During pulsing,
the fiber alternates between thick and thin (Figure 3.1.6.1), in an undesired sectional oscillation
of the fiber diameter. More recently, pulsing observed for PCL was described as a force
imbalance that leads to mass flow fluctuation from the spinneret to the collector [145].
Figure 3.1.6.1. SEM images of MEW PP fibers showing the phenomena of pulsing, where an unstable polymer jet results in alternating thick and thin sections along the fiber. Scale bar 20 µm. Images were taken as part of this thesis exploration.
It was demonstrated that pulsing can be simply observed using SEM imaging, and the fibers and
fiber placement of simple print designs can be evaluated. After analysis, the fluctuation of the
mass flow can be corrected and the best printing parameters can be employed. By reducing this
pulsing phenomenon the quality of the produced scaffolds can be increased [145].
3.1.7 Rationale for 3D printing PP via MEW
Higher resolution additive manufacturing technologies are needed for numerous applications,
including tissue engineering, catalysts, fabrics, membranes and filters. FDM is a low cost additive
manufacturing class, which is a similar technique to MEW as discussed in Chapter 2, though
limits exist to produce smaller fiber diameters when using FDM. A challenge of FDM is that die
swell occurs, due to extrusion of a viscous thermoplastic through small diameter nozzles [78].
The processing of polymers from the molten state, as opposed to from solution, provides the
advantage of no solvent accumulation in the final product, which is very important for many
applications, including in the production of medical devices. The surface topography of melt
electrospun fibers is smooth, with facile preparation of scaffolds and templates using
direct-writing providing structures with advantages in tissue engineering because of fiber
diameters in the micron range [76, 146-148]. MEW of PP provides an opportunity to exploit the

77
good mechanical, stability and biocompatible properties of PP by the production of novel
constructs. Especially, the development of such constructs as medical devices in a field where PP
is already extensively used and commercial PP is available in medical grade is promising.

78
3.2 Materials and Methods
3.2.1 Polypropylene
Commercially available PP samples were sourced from two different suppliers. The different
types of PP, the supplier details and certain physical properties are listed in Table 3.2.1.1. The
two polymers supplied by ExxonMobil Chemical were both medical-grade polymers.
Table 3.2.1.1. Commercial PP sourced for the experiments herein. Name Reference Supplier MFR
ISO1133 230 °C/2.16kg
[g/min]
MW [Da]
PP1014H1 PP1014H1 ExxonMobil Chemical
16 -
PP1013H1 PP1013H1 ExxonMobil Chemical
7.5 -
Licocene® PP7502
PP7502 Clariant - 22900
Licocene® PP6502
PP6502 Clariant - 17800
Licocene® PP6102
PP6102 Clariant - 7200
3.2.2 Rheology of PP
Rheology was performed using a Physica MCR 301 rheometer (Anton Paar GmbH, Ostlidern,
Germany). The samples were tested in a controlled stress measuring mode, with a cone-plate
measuring system. The measurements were performed under heating in air, with samples
allowed to equilibrate at a given temperature before shear force was applied. Rheology was
performed on both pure PP and blended PP.
3.2.3 Differential Scanning Calorimetry of PP
DSC was performed on a STA 409 PC TGA/DSC (NETZSCH Gerätebau GmbH, Selb, Germany). The
samples were run in an Al2O3 pan under nitrogen via a Heat/Cool/Heat cycle, whereby the heat
and cooling rate were set to 5 °C/min. DSC was performed on pure PP’s.
3.2.4 Blending of PP
Pure polymers and blends were both used in this exploration. Each blend consisted of two
different polymer types with these two polymers of a given blend being placed in a beaker
before being co-melted in an oven at 180 °C under nitrogen. To facilitate mixing of both
polymers the molten samples were mixed thoroughly throughout the process.

79
3.2.5 Initial Melt Electrospinning of PP
MEW of pure PP and blends of PP was undertaken at the University of Würzburg on a custom-
built MEW device. PP pellets, in the case of pure PP, or blended PP’s were loaded in a 3 mL glass
syringe (Carl Roth GmbH, Karlsruhe, Germany), which was affixed with a blunt 25 G needle, as
spinneret. The syringe was placed inside the electrically heated Macor™ ceramic cylinder
heating jacket of the MEW device with the gas-flow tube attached to the top. The pressure to
push the molten polymer out of the spinneret was achieved by gas flow regulated by a regulator
gauge. Subsequently, the polymer was heated to a certain temperature depending on the type or
blend. All polymers and blends were heated under a flow of nitrogen, unless otherwise stated.
The polymer melt was electrospun onto the collector, metal slides or glass slides affixed to the
collector. The distance from needle tip to collector or slide was set at a distance of 3 – 4 mm. A
pressure of 0.5 – 2 bar and accelerating voltages of 4.0 – 6.2 kV was used, depending on the PP
or blend melt being spun.
3.2.6 Melt Electrospinning onto a Heated Collector
Experiments were also completed utilizing a heated collector designed to fit the melt
electrospinning device. The heated collector consists of an upper metal collector plate
(aluminum, custom-fabricated at the University of Würzburg) and a lower non-conductive base
plate (polyether ether ketone, also custom-fabricated in-house), with a silicone heating mat
hotform® silicone heating mat (Hotset Heizpatronen und Zubehör, Lüdenscheid, Germany)
sandwiched in the middle. The silicone heating mat was controlled by a connected hotset® PID
system (Hotset Heizpatronen und Zubehör, Lüdenscheid, Germany).
3.2.7 Microscopy of MEW PP
OM was performed using a Zeiss stereomicroscope (Discovery V20, Carl Zeiss Microscopy,
Göttingen, Germany). Samples of printed fibers and scaffolds were placed on glass slides or
plastic sample storage containers prior to imaging. SEM of the PP fibers and scaffolds was
performed using a Zeiss Crossbeam 340 SEM (Carl Zeiss Microscopy, Göttingen, Germany,
equipped with a Zeiss Gemini column at accelerating voltages of 1 - 2 kV. Samples were imaged
without sputtering, unless otherwise stated.
OM was initially employed to verify the degree of successful printing by analysis of fibers and
scaffolds, specifically stacking or fiber diameter. Moreover, SEM was employed to analyze the
fiber diameter more clearly than OM, and to ascertain information related to the morphology of

80
the fibers and scaffolds produced. These images provide qualitatively information
complementary to OM that enabled further elucidation of the architecture and morphology,
including the degree of stacking and fiber surface information.

81
3.3 Results and Discussion
The PP samples used throughout are commercially available polymers from either, ExxonMobil
Chemical or Clariant. The ExxonMobil polymers are medical-grade polymers that are designed
for a variety of applications, including as medical devices and in drug delivery systems. These
polymers also can be sterilized via heat, chemical or radiation methods, which is advantageous
for constructs and devices made from them. Moreover, devices made from these polymers may
be more readily accepted for application in the medical field, due to their already proven
medical capabilities. Furthermore, non-medical-grade polymers were sourced from Clariant, to
provide a larger representation of PPs with respect to Mw for initial MEW experiments.
3.3.1 Polypropylene Characterization
The viscosity and thermal properties of the PP samples were obtained by rheology and thermal
characterization. The thermal properties of the PPs are shown in Figure 3.3.1.1 for the first run
prior to thermal history erasure (top), and after heating to 220 °C to removed thermal history
and cooling to room temperature before repeating a second heating run (bottom). The Tg of all
polymers was different from each other, which can be attributed to the different molecular
weights, molecular distributions and the potentially varying additives in each different polymer.

82
Figure 3.3.1.1. Thermal properties of commercial PPs prior to (top) and after (bottom) thermal history erasure with peak melt temperature listed for each.
Rheology of the polymers was completed and Table 3.3.1.1 shows the viscosity of the PP’s at
zero-shear for a temperature of 200 °C (180 °C for PP6102). As expected, the low Mw polymers
(PP6102, PP6502) showed substantially lower viscosities, than the larger chain polymers
(PP1013H1, PP1014H1). While the MWs of PP1013H1 and PP1014H1 are not known, their
molecular size can be inferred from their MFRs that are both an order of magnitude larger than

83
the MFR of PP6502. Moreover, initial melt electrospinning experiments of the lower MW
polymers resulted in no processing, because of their very low viscosities, which resulted in large
amounts of molten polymer falling out of the spinneret without applied force.
While the maximum melt temperature of the commercial PPs from the DSC measurements was
168.8 °C for PP1013H1, the maximum temperature threshold chosen initially for the melt
electrospinning of the higher Mw polymers was 215 °C, because the commercially available PPs
include additives. These additives aid in processing the polymer during manufacturing, while the
can help to improve physical properties (i.e. strength) and aesthetics (i.e. transparency) of the
final product. However, these additives can also act to degrade the polymer, whereby radicals
formed within the polymer/additive mixture may lead to crosslinking or chain scission.
Moreover, when the radicals produced from the additives react with oxygen they can form
peroxides and hydroperoxides leading to further degradation of the polymer, especially at high
temperatures. Therefore, to minimize any degradation of the polymer a maximum temperature
threshold was chosen. The minimum melt-spinning temperature of each polymer was
determined by introducing each polymer to the device, whereby the temperature was
incrementally increased until fibers were obtained. These experiments were performed under
air. Collection of fibers was not observed at the maximum temperature for PP1013H1 or
PP1014H1, therefore the maximum temperature threshold was increased from 215 to 230 °C.
Here, electrospinning was observed, though there was no adherence of the fiber to the collector
or to the previously deposited fiber.
Table 3.3.1.1. Viscosity of pure PP samples at zero-shear.
Polymer Viscosity at Zero-Shear
200 °C
PP1014H1 2790
PP1013H1 6290
PP6502 4.47
PP6102 0.15 (180 °C)
Lower Mw polymers (PP6102, PP6502) when close to their melting temperature had low
viscosity and the polymer dripped profusely from the spinneret. No MEW was obtained, due to
the polymer melt pushing out of the spinneret much too readily.

84
Firstly, to attempt to overcome issues with adherence to the collector, it was decided to blend
the commercially available PP samples. Blending was attempted to provide a ratios of different
MW PPs that would lead to a MEW-printable composition. A high Mw PP and a mid-range MW
PP were considered to provide both low viscosity of the melt, while keeping a certain amount of
long chain entanglements to produce uniform fibers.
Blending of PP was achieved by co-melting two different PP samples in a beaker and placing in
an oven at 180 °C under nitrogen, with mixing to induce homogeneity in the mixtures. Blends
that did not show significant yellowing were used. The blends that were finally used comprised
combinations of PP1014H1 with either PP6502 or PP6102, in ratios of either 20/80 or 80/20.
Figure 3.3.1.2 shows the blends after the completion of the blending and after cooling showing
obvious yellowing for samples containing PP1014H1. This yellow may be due to additives in the
polymer to aid in processing. PP6502 has an average polymer chain length of 17,800 Da.
PP1014H1 is a medical-grade PP and the average polymer chain length was not provided to us
though the MFR is 16 g/10 min for the polymer, which can be cross-referenced with other PP’s
with known size and MFR. Therefore, it is thought that PP1014H1 is approximately 200,000 Da.
Figure 3.3.1.2. Blends of PP polymers showing yellowing of samples containing larger amount
of PP1014H1. Left to right: 20% PP6502/80% PP1014H1, 80% PP6502/20% PP1014H1, 20%
PP6102/80% PP1014H1, 80% PP6102/20% PP1014H1.
Rheology of the blends was completed with the viscosity at zero-shear listed in Table 3.3.2.2,
showing that the viscosity of the blends in between the viscosity of low viscous pure PPs and
high viscous PPs, as shown in Table 3.3.1, which is to be expected.

85
Table 3.3.1.2. Viscosity of blended PP samples at zero-shear.
Polymer Viscosity at Zero-Shear
180 °C
20% PP6502/80% PP1014H1 984
80% PP6502/20% PP1014H1 311
20% PP6102/80% PP1014H1 1500
80% PP6102/20% PP1014H1 0.627
3.3.2 Initial MEW of PP
The four types of PP blends were investigated for their compatibility with the MEW process.
Beginning with the most viscous material, the printing of the PP blends with 80% PP1014H1
produced fibers, albeit with the unwanted phenomenon of pulsing. Fiber pulsing refers to the
undesired sectional oscillation of the fiber diameter leading to thin and thick fiber portions, as
discussed [145] and visualized in Section 3.1.6 (Figure 3.1.6.1). The printed PP fibers could not
be removed from the collector, due to poor adherence of the depositing fibers onto the previous
fibers, leading to scaffolds that lacked the structural integrity to be removed successfully. Figure
3.3.2.1, shows a printed construct P6502/PP1014H1 of ratio 20/80 that was unable to be
removed from the collector.
Figure 3.3.2.1. Left: Photograph of MEW printed 20/80 blended PP6502 and PP1014H1, scale bar 1 cm. Right: OM images of MEW printed 20/80 blended PP6502 and PP1014H1 Scale bar = 1cm (left). While Figure 3.3.2.1, shows fibers printed onto glass slides of the same polymer blend with
pulsing occurring (though no adherence to the slides occurred), where the largest diameter is
approximately 78 µm and the smallest diameter is approximately 42 µm. Polymer blends with

86
80% PP6502 did not produce uniform fibers, which is due to limited long chain entanglements
that would provide the ability to produce good fibers. Polymer blends could only be heated once
in the syringe and only for a short period of time, before significant degradation occurred, which
is evidenced by both, the change in colour of the remaining polymer in the syringe and the loss
of printability. Furthermore, printing onto glass slides could not be achieved as the printed
fibers were not attracted to the glass and could not be deposited accurately, if at all. Frequently,
the fiber would be dragged with the movement of the collector, instead of being deposited. While
well-formed PP fibers could in some cases be produced from blends, the cooling and subsequent
non-fusion of the PP required an improvement in the MEW collection hardware.
3.3.3 Heated Collector Design and Construction for MEW
It was hypothesized, that the non-adherence of the fiber to the collector or to previously
deposited fibers was due to the rapid rate of crystallization of the PP fiber when printed. Of note,
is that there is a large difference between the polymer melt (215 °C) and the collector (~22 °C)
temperatures, giving a temperature difference of ~193 °C. For comparison, PCL is routinely
printed using the same apparatus from the melt at 85 °C onto a collector at room temperature,
which is a temperature difference of approximately 60 °C. When PCL is deposited, it begins to
cool in the air, but is not yet completely cooled by the time is reaches the collector or previous
fiber and therefore can adhere successfully. Furthermore, PP may tend to crystallize more
readily due to the fact that it commonly exhibits a higher degree of crystallinity of 70-80% [149]
than PCL, which is less crystalline with a degree of crystallinity of 40-60% [150]. Due to these
observations a heated collector was implemented to investigate the ability to print PP fibers
when the temperature difference between the melt and the collector was reduced.
While blended PP samples showed promise in their ability to be printed, the medical-grade
polymers were mixed with non-medical-grade polymers to achieved the require viscosity. A
disadvantage to this method is that the mixing is not completely homogenous. Moreover, the
potential for degradation of the polymers during blending is high, due to the temperature used
(180 °C) and hours of heating required. Therefore, it was decided to revisit pure PP, namely
PP1014H1, but instead raise the temperature of the collector.
The introduction of a heated collector enabled the processing of pure PP, due to lowering the
temperature difference between the melt and cooled temperature of the polymer during
printing. The heated collector that was utilized is shown in Figure 3.3.3.1, where a silicone heat

87
mat was sandwiched between an aluminium plate and a poly ether ketone (PEEK)
non-conducting base.
Figure 3.3.3.1. Top: Schematic of the aluminium collector plate (top), silicone heating mat (middle) and PEEK non-conducting base plate (bottom). Bottom left: Photo of the components of the heating mat. Bottom right: The PID system that controls the silicone mat temperature.
Initial temperature measurements of the heated mat showed that there is fluctuation in the
heating temperature for any given set temperature, whereby the actual temperature could be 6
to 8 degrees either side of the set temperature. Furthermore, once the heated collector was
installed onto the melt electrospinning device, there was also a temperature influence from the
housing that surrounds the heating elements to heat the syringe to melt the polymer. Therefore,
throughout this exploration when the set temperature for the heated collector is given as single
temperature, such as 80 °C, it should be noted that the temperature actual corresponds to a
temperature range from ~72 - 88 °C. To overcome this issue, a full enclosed climate controlled
device would need to be built. A more complex climate controlled device is outside the scope of
this study, though would be helpful for future experiments.
Initial printing with the heated collector was performed at 70 and 80 °C. A 5 cm2 90° laydown
pattern with a total of 14 layers was printed at the two different temperatures, to assess the
degree of adherence of the fibers to the collector plate and onto to the previously printed fibers.
At completion of the printing, but prior to removal from the heated collector, neither scaffold
contained defects, while the fiber diameters were homogeneous for both. However, the scaffold
that had been printed onto the heated collector with a temperature of 70 °C showed no
adherence of the fibers to each other, specifically non-adherence of the fibers at the fiber

88
junctions. Moreover, the scaffold printed onto the heated collector with a temperature of 80 °C
showed adherence at the junctions, yielding a 3D structure with good structural integrity. The
scaffold printed onto the heated collector with a temperature of 80 °C could be removed
successfully from the collector with the structure remaining intact, while the other scaffold could
not be removed to yield a structurally intact scaffold; Figure 3.3.3.2 shows the scaffolds after
removal from the collector.
Figure 3.3.3.2. Left: PP scaffold printed onto the heated collector at a temperature of 70 °C, with non-adherence of fibers visible. Right: PP scaffold printed onto the heated collector at a temperature of 80 °C, with structure integrity due to adherence of fibers to one another. Scale bar 0.5 mm.
3.3.4 Heated Collector Temperature Variation
To observe the effect of the heated collector temperature on the surface morphology and fiber
formation of the printed PP fibers, three temperatures were chosen — 70, 80 and 90 °C, where
70 and 90 °C were below and above the temperature shown to be high enough for fiber
adherence. In Figure 3.3.4.1, a change in the fiber surface is observed across the three different
heated collector temperatures. The fibers printed onto the heated collector at 70 °C showed
good fiber formation, though had visible spherulites on the fiber surface, which are thought to
occur when rapid cooling occurs on the surface of the fibers. The morphology of the fibers
printed onto the heated collector with a temperature of 80 °C showed good fiber formation,
except the fiber was beginning to exhibit melting and flattening where the fiber was in direct
contact with the collector, due to less rapid cooling of the polymer jet prior to deposition of the
fiber onto the heated collector. This is attributed to the increase in temperature of the air in the
area between the heat jacket and the heated collector, and can also be observed by the decrease
in visible spherulites on the fiber surface, because of the reduced rate of cooling of the polymer
jet. Lastly, the fibers printed onto the heated collector at 90 °C showed little fiber formation, due
to the jet still being molten when accelerated towards and deposited onto the collector. The
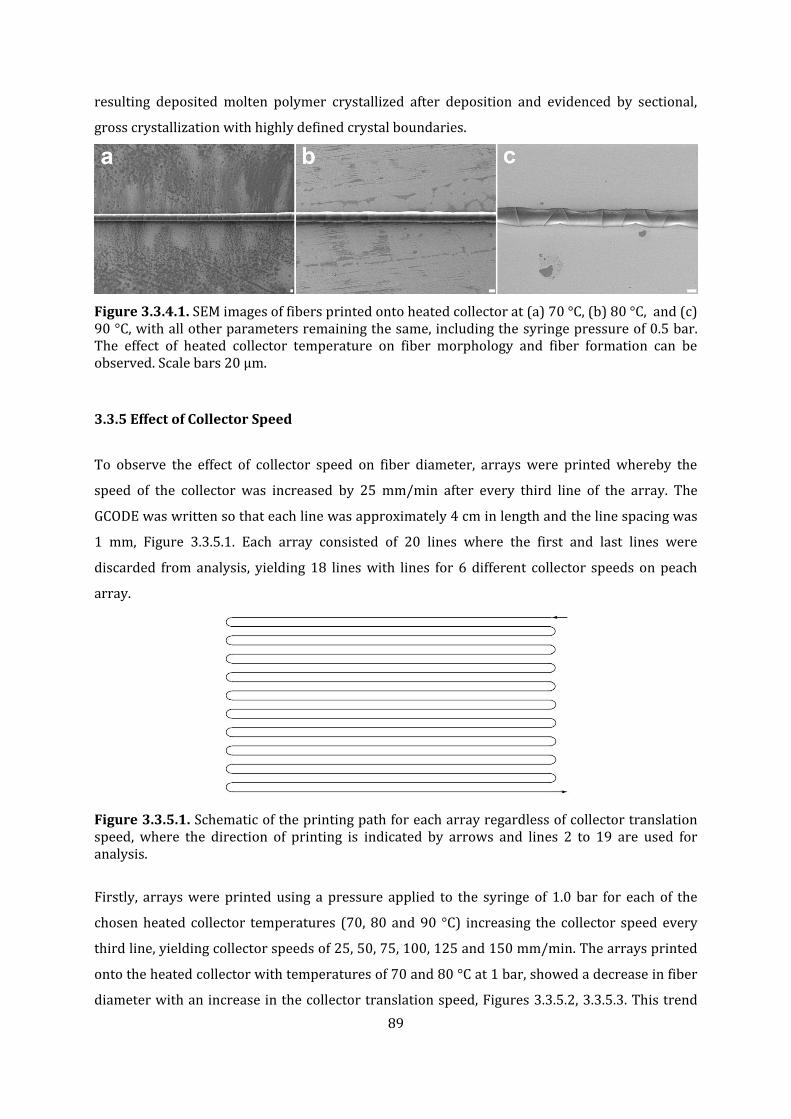
89
resulting deposited molten polymer crystallized after deposition and evidenced by sectional,
gross crystallization with highly defined crystal boundaries.
Figure 3.3.4.1. SEM images of fibers printed onto heated collector at (a) 70 °C, (b) 80 °C, and (c) 90 °C, with all other parameters remaining the same, including the syringe pressure of 0.5 bar. The effect of heated collector temperature on fiber morphology and fiber formation can be observed. Scale bars 20 µm.
3.3.5 Effect of Collector Speed
To observe the effect of collector speed on fiber diameter, arrays were printed whereby the
speed of the collector was increased by 25 mm/min after every third line of the array. The
GCODE was written so that each line was approximately 4 cm in length and the line spacing was
1 mm, Figure 3.3.5.1. Each array consisted of 20 lines where the first and last lines were
discarded from analysis, yielding 18 lines with lines for 6 different collector speeds on peach
array.
Figure 3.3.5.1. Schematic of the printing path for each array regardless of collector translation speed, where the direction of printing is indicated by arrows and lines 2 to 19 are used for analysis.
Firstly, arrays were printed using a pressure applied to the syringe of 1.0 bar for each of the
chosen heated collector temperatures (70, 80 and 90 °C) increasing the collector speed every
third line, yielding collector speeds of 25, 50, 75, 100, 125 and 150 mm/min. The arrays printed
onto the heated collector with temperatures of 70 and 80 °C at 1 bar, showed a decrease in fiber
diameter with an increase in the collector translation speed, Figures 3.3.5.2, 3.3.5.3. This trend
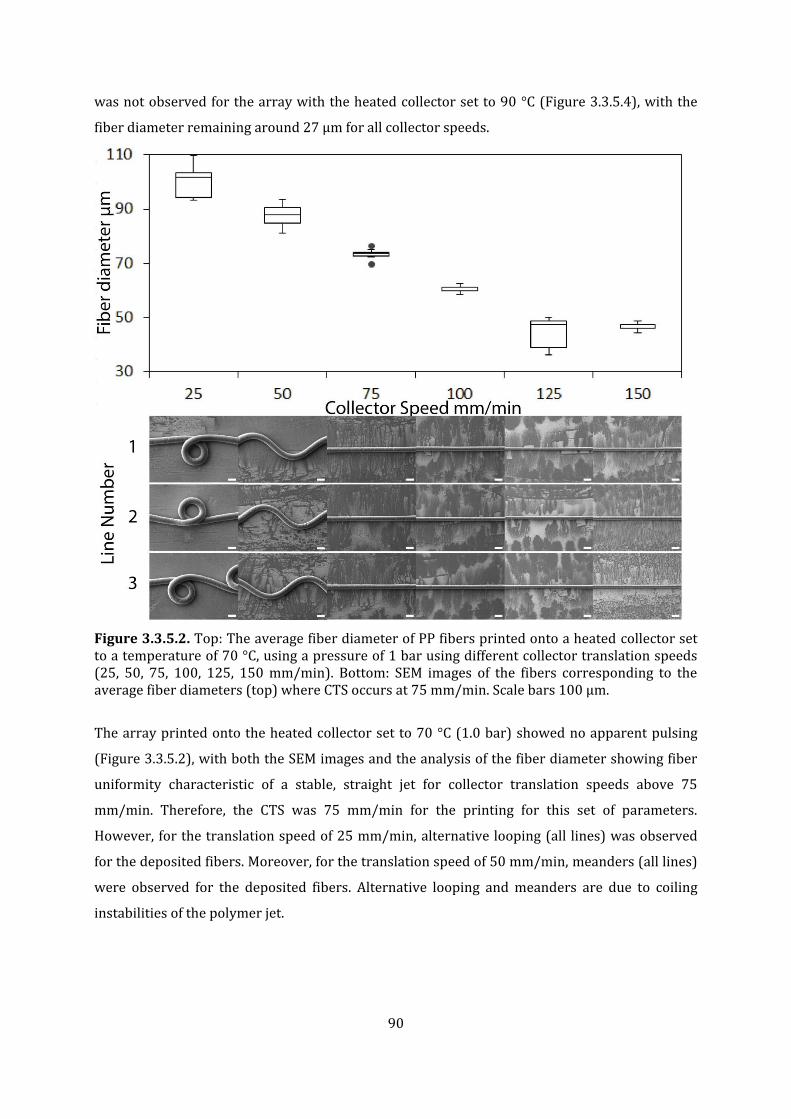
90
was not observed for the array with the heated collector set to 90 °C (Figure 3.3.5.4), with the
fiber diameter remaining around 27 µm for all collector speeds.
Figure 3.3.5.2. Top: The average fiber diameter of PP fibers printed onto a heated collector set to a temperature of 70 °C, using a pressure of 1 bar using different collector translation speeds (25, 50, 75, 100, 125, 150 mm/min). Bottom: SEM images of the fibers corresponding to the average fiber diameters (top) where CTS occurs at 75 mm/min. Scale bars 100 µm.
The array printed onto the heated collector set to 70 °C (1.0 bar) showed no apparent pulsing
(Figure 3.3.5.2), with both the SEM images and the analysis of the fiber diameter showing fiber
uniformity characteristic of a stable, straight jet for collector translation speeds above 75
mm/min. Therefore, the CTS was 75 mm/min for the printing for this set of parameters.
However, for the translation speed of 25 mm/min, alternative looping (all lines) was observed
for the deposited fibers. Moreover, for the translation speed of 50 mm/min, meanders (all lines)
were observed for the deposited fibers. Alternative looping and meanders are due to coiling
instabilities of the polymer jet.

91
Figure 3.3.5.3. Top: The average fiber diameter of PP fibers printed onto a heated collector set to a temperature of 80 °C, using a pressure of 1 bar using different collector translation speeds (25, 50, 75, 100, 125, 150 mm/min). Bottom: SEM images of the fibers corresponding to the average fiber diameters (top) where CTS occurs at 75 mm/min. Scale bars 100 µm.
The array printed onto the heated collector set to 80 °C (1.0 bar) showed no apparent pulsing
(Figure 3.3.5.3), with both the SEM images and the analysis of the fiber diameter showing fiber
uniformity characteristic of a stable, straight jet for collector translation speeds above
75 mm/min. The CTS was observed at 75 mm/min, as per the array printed onto the heated
collector with set temperature of 70 °C (1 bar). For the translation speed of 25 mm/min,
meanders (line 1) and ‘transient coiling’ (lines 2 and 3) were observed for the deposited fibers.
Moreover, for the translation speed of 50 mm/min, meanders (all lines) were observed for the
deposited fibers.

92
Figure 3.3.5.4. Top: The average fiber diameter of PP fibers printed onto a heated collector set to a temperature of 90 °C, using a pressure of 1 bar using different collector translation speeds (25, 50, 75, 100, 125, 150 mm/min). Bottom: SEM images of the fibers corresponding to the average fiber diameters (top) where CTS occurs at 75 mm/min. Scale bars 100 µm.
The array printed onto the heated collector set to 90 °C (1.0 bar) showed no apparent pulsing
(Figure 3.3.5.4); however, CTS was not observed for these collector translation speeds. For all
translation speeds a mixture of transient coiling, alternative looping, stretched coiling,
disordered coiling and meanders were observed.
3.3.6 Effect of Air Pressure
To observe the effect of changing the rate of the polymer flow to the spinneret, the pressure was
reduced from 1 bar to 0.5 bar. The arrays were printed with 0.5 bar pressure for each of the
chosen heated collector temperatures (70, 80 and 90 °C) with collector speeds of 25, 50, 75, 100,
125 and 150 mm/min. The arrays printed onto the heated collector with temperatures of 70 and
90 °C showed a decrease in fiber diameter with an increase in the collector translation speed,

93
Figures 3.3.6.1, 3.3.6.3. No trend was observed for the array with the heated collector set to
80 °C, Figure 3.3.6.2.
Figure 3.3.6.1. Top: The average fiber diameter of PP fibers printed onto a heated collector set to a temperature of 70 °C, using a pressure of 0.5 bar using different collector translation speeds (25, 50, 75, 100, 125, 150 mm/min). Bottom: SEM images of the fibers corresponding to the average fiber diameters (top) where CTS occurs at 75 mm/min. Scale bars 100 µm.
The array printed onto the heated collector set to 70 °C showed no apparent pulsing (Figure
3.3.6.1), with both the SEM images and the analysis of the fiber diameter showing fiber
uniformity characteristic of a stable, straight jet for collector translation speeds above 75
mm/min, signifying the CTS of 75 mm/min for the printing of this polymer for these set
parameters. However, for the translation speed of 25 mm/min, transient coiling (line 1 and 3)
and alternative looping (line 2) were observed for the deposited fibers. Moreover, for the
translation speed of 50 mm/min, meanders (line 3) and minimal meanders (line 1 and 2) were
observed. Minimal meanders refer to meanders with amplitude that is approaching a straight
line, but prior to reaching the CTS. Just as alternative looping and meanders are due to coiling
instabilities of the polymer jet, so too are transient coiling and minimal meanders.

94
The effect of pressure (0.5 or 1.0 bar) on fiber morphology was examined by printing fibers onto
the heated collector (70 °C). As expected, the average fiber diameter for a given collector
translation speed was larger for fibers printed using 1 bar pressure. This is because the mass
flow to the spinneret is larger when a higher pressure is used, which results in more polymer
deposited onto the collector.
Figure 3.3.6.2. Top: The average fiber diameter of PP fibers printed onto a heated collector set to a temperature of 80 °C, using a pressure of 0.5 bar using different collector translation speeds (25, 50, 75, 100, 125, 150 mm/min). Bottom: SEM images of the fibers corresponding to the average fiber diameters (top) where CTS occurs at 75 mm/min. Scale bars 100 µm.
The array printed onto the heated collector set to 80 °C (0.5 bar) showed pulsing (Figure
3.3.6.2), with the analysis of the average fiber diameter showing large variation of the
interquartile ranges (IQR) and significant pulsing observed within the SEM images, evidenced by
the alternating thin and thick fiber diameters for a given translation speed. While the CTS was
observed at 75 mm/min, as per the array printed onto the heated collector with the set
temperature of 70 °C (0.5 bar), the array printed onto heated collector set to 80 °C (0.5 bar) did
not possess the optimal printing parameters, as evidenced by visible pulsing. For the translation
speed of 25 mm/min, disordered coiling (line 1 and 2) and alternative looping (line 3) were

95
observed for the deposited fibers. Moreover, for the translation speed of 50 mm/min, alternative
looping (line 3) and straight printing (line 1 and 2) were observed. While straight lines were
achieved for line 1 and 2 (50 mm/min), line 3 exhibited alternative looping or stretched coiling,
therefore, CTS was observed only at 75 mm/min consistently.
The effect of pressure (0.5 or 1.0 bar) on fibers morphology was examined by printing fibers
onto the heated collector (80 °C). As expected, and similar to the 70 °C (0.5 and 1 bar)
comparison, the average fiber diameter for a given collector translation speed was larger for
fibers printed using 1 bar pressure. While, this can be explained by the mass flow to the
spinneret being larger when a higher pressure is used, resulting in more polymer deposited onto
the collector, the pulsing associated with the 0.5 bar array (80 °C) printing meant that this trend
was partially concealed in the data. The pulsing signifies that the parameters (0.5 bar, 80 °C) are
not optimized for stable printing due to a force imbalance leading to mass flow fluctuation from
the spinneret to the collector.

96
Figure 3.3.6.3. Top: The average fiber diameter of PP fibers printed onto a heated collector set to a temperature of 90 °C, using a pressure of 0.5 bar using different collector translation speeds (25, 50, 75, 100, 125, 150 mm/min). Bottom: SEM images of the fibers corresponding to the average fiber diameters (top) where continuous, stable straight printing was not observed. Scale bars 100 µm.
As discussed above, the observed fibers printed onto the heated collector set to 90 °C (0.5 bar)
showed sectional, gross crystallization with highly defined crystal boundaries, due to the
polymer jet being molten at the time of deposition, which resulted in non-defined,
heterogeneous fiber formation. While the array printed onto the heated collector set to 90 °C
(0.5 bar) showed an decrease in fiber diameter with an increase in collector translation speed,
similar to the fibers printed onto the 70 °C heated collector, the average fiber diameters showed
large variation in the IQR for some translation speeds, as well as outliers for other collector
speeds. This is because of the molten nature of the jet when deposited (Figure 3.3.6.3). The CTS
was not observed for these collector translation speeds. For the collector translation speed of 25
mm/min, only ‘transient coiling’ was observed. The other translation speeds (50, 75, 100, 125
and 150 mm/min) showed a mixture of transient coiling, alternative looping, stretched coiling,
‘disordered coiling, and straight printing or minimal meanders. Straight printing and minimal

97
meanders cannot be distinguished within this set. Moreover, the ability to observe pulsing is an
ambiguous task due to the nature of the flattened deposited fibers.
To obtain the CTS for the fibers printed onto the 90 °C heated collector, arrays were printed at
increased collector translation speeds, namely, 175 mm/min through to 300 mm/min, Figure
3.3.6.4. Only straight lines are observed for all collector translation speed, therefore the CTS is
observed at the translation speed of 175 mm/min first. Pulsing was observed in the SEM images,
evidenced by the variation of the fiber diameters within each translation speed set (Figure
3.3.6.4).
Figure 3.3.6.4. Top: The average fiber diameter of PP fibers printed onto a heated collector set to a temperature of 90 °C, using a pressure of 0.5 bar using different collector translation speeds (175, 200, 225, 250, 275, 300 mm/min). Bottom: SEM images of the fibers corresponding to the average fiber diameters (top) where CTS is observed at 175 mm/min. Scale bars 100 µm.

98
3.3.7 Effect of MEW Printing Different Arrays of PP
Up to this point, simple printing conditions were used; however, more complex printing would
be needed in the future, therefore an investigation into the effect of printing fibers closer
together in parallel was completed by printing samples in a series of arrays.
For the fibers printed onto the heated collector set to 90 °C (0.5 bar), a decrease in the average
fiber diameter was observed as the speed of the collector was increased. However, unexpectedly
the average fiber diameter for the faster translation speeds of 175, 200, 225 and 250 mm/min
was larger than the average fiber diameter for the slower translation speeds of 125 and 150
mm/min, Figure 3.3.7.1. The average fiber diameter for the translation speeds of 175, 200, 225
and 250 mm/min were 36.1, 33.1, 30.3 and 28.3 µm respectively, whereas the average fiber
diameters for the translation speeds of 125 and 150 mm/min were 22.3 and 19.2 µm
respectively. As discussed earlier, the sectional, gross crystallization of the molten jet was
observed in the array printed onto the 90 °C (0.5 bar) heated collected with the slower
translation speeds of 25 to 150 mm/min, leading to flattened fiber morphologies. This flattening
effect may have affected the diameter of the resulting fibers. The fiber formation observed was
more defined for the array printed with the faster translation speeds, albeit, edge-crystallization
was observed, because the jet, in part, was still molten at the time of deposition, Figure 3.3.6.3.
However, the fiber diameter similarity across arrays of different speeds may be due to a method
design error.

99
Figure 3.3.7.1. The average fiber diameters across two arrays, where array 1 with slow collector speeds of 125 and 150 mm/min, and array 2 with the faster collector speeds of 175, 200, 225 and 250 mm/min are shown. For the different fiber line arrays, the stage accelerates, maintains speed and then decelerates
before changing direction and accelerating again. However, while the command for the stage is
to immediately establish a certain velocity, in reality, there is significant inertia and the real
speed is not the same as the set speed. When the collector moves it does so from a stationary
position and (due to the weight of the collector and consequent load on the linear axis) the
collector does not reach the set speed immediately. Therefore, each single array contains a
sequence of stage movements, whereby straight translational speed and the turn speed were the
same for all arrays and line printing speeds. The turn speed was slower than the straight
translation speed, in all cases. The lag to reach the speed may lead to lower printing speeds than
the desired set speed. When printing different arrays, this repetition of collector movement is
interrupted as the fiber moves from one array to another.
To investigate the influence collector speed lag on the fiber diameter, three arrays were printed
with increasing translation speeds from 325 mm/min to 750 mm/min, using the same turn
speed across all printing speeds at 80 °C. The first array was printed using collector translation
speeds of 325, 350, 375, 400, 425 and 450 mm/min, the second array was printed collector
translation speeds of 475, 500, 525, 550, 575 and 600 mm/min, and the third array was printed
using collector translation speeds of 625, 650, 675, 700, 725 and 750 mm/min, Figure 3.3.7.2.

100
While, the average fiber diameter decreased with an increased translation speed for each
individual array set, the same continued decrease with increased speed was not observed when
the arrays were compared with each other. The average fiber diameters for the slowest
translation speed of each array (325, 475 and 625 mm/min) were 20.8, 20.8 and 19.9 µm,
respectively. Moreover, the average fiber diameters for the fastest translation speed of each
array (450, 600 and 750 mm/min) were 16.3, 17.1 and 16.3 µm, respectively. Similarly, the
average fiber diameters were comparable with each other for the middle translation speeds on
each array, namely, the average fiber diameters were 19.6, 19.0 and 17.2 µm for 350, 500 and
650 mm/min, 18.0, 18.4, 17.7 µm for 375, 525, 675 mm/min, 17.4, 17.8, 17.2 µm for 400, 550
and 700 µm, and 16.6, 17.3 and 16.6 µm for 425, 575, 725 mm/min. More experiments need to
be completed in the future, to overcome the lag of the collector translation speed.
Figure 3.3.7.2. The average fiber diameters across three arrays of increase collector translation speed, where array 1 reflects collector speeds 325 to 450 mm/min, array 2 reflects collector speeds of 475 to 600 mm/min and array 3 reflects collector speeds of 625 to 750 mm/min.
3.3.8 Layer-by-Layer Deposition
MEW can produce 3D structures by layer-by-layer addition of fibers onto one another. This
process requires that the previously deposited fiber does not accumulate unwanted charge that
can result in the next fiber being repelled and not being deposited into the desire location. The
ability to accurately deposit fibers layer by layer is a desired feature in MEW, and therefore it is
an important phenomenon to study for any polymer, as every polymer has a different behaviour
when electrostatically drawn and written. To study the deposition accuracy of PP fibers during
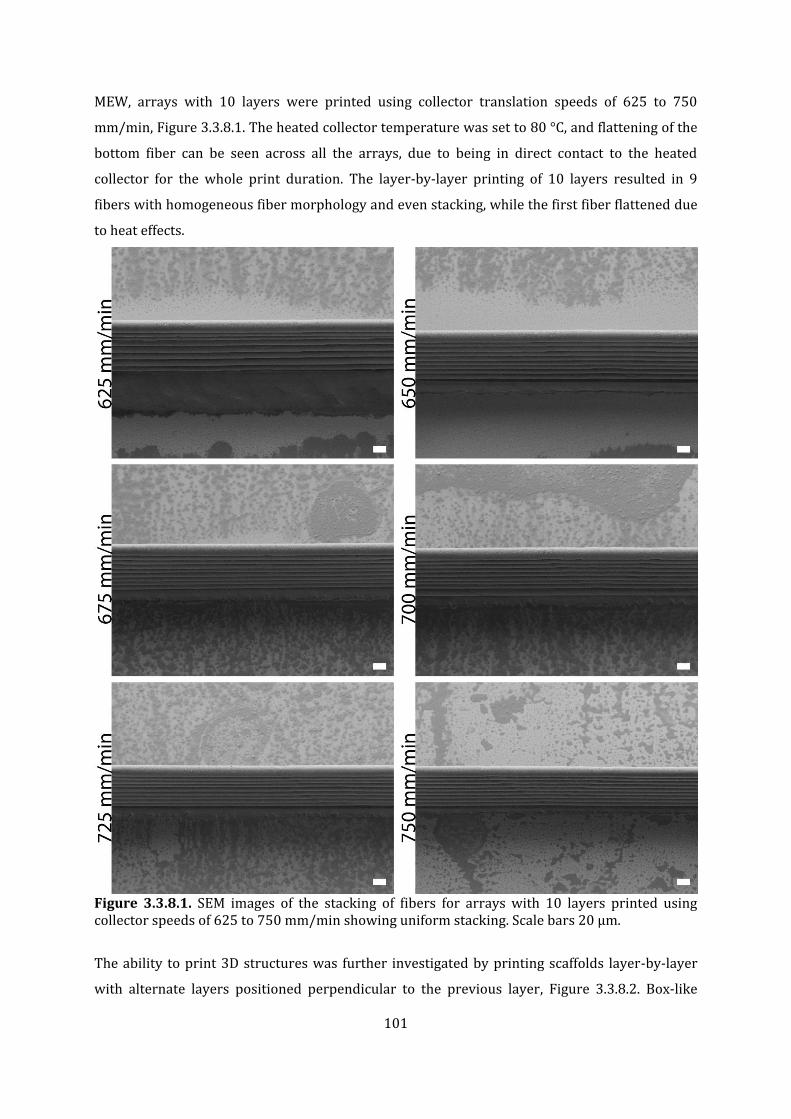
101
MEW, arrays with 10 layers were printed using collector translation speeds of 625 to 750
mm/min, Figure 3.3.8.1. The heated collector temperature was set to 80 °C, and flattening of the
bottom fiber can be seen across all the arrays, due to being in direct contact to the heated
collector for the whole print duration. The layer-by-layer printing of 10 layers resulted in 9
fibers with homogeneous fiber morphology and even stacking, while the first fiber flattened due
to heat effects.
Figure 3.3.8.1. SEM images of the stacking of fibers for arrays with 10 layers printed using collector speeds of 625 to 750 mm/min showing uniform stacking. Scale bars 20 µm.
The ability to print 3D structures was further investigated by printing scaffolds layer-by-layer
with alternate layers positioned perpendicular to the previous layer, Figure 3.3.8.2. Box-like

102
structures are produced with fibers being at 90° to one another. Two different fiber spacing’s,
0.2 mm and 1 mm, were used to see the effect of spacing on fiber placement. Fiber stacking
occurred throughout both scaffold, with fiber walls observed for both spacing’s. Sagging of
parallel fibers occurred, whereby each subsequently printed parallel fiber rested on top of the
previous fiber without a spaced gap between them. While sagging of the parallel fibers occurred
significantly for the 1 mm spacing, it occurred less for the 0.2 mm spacing. Sagging occurs with
MEW of PCL as well, as discussed in Chapter 2.
Figure 3.3.8.2. SEM images of the scaffolds printed using collector speed 750 mm/min with 0.2 mm fiber spacing (left) and 1 mm fiber spacing (right). Scale bars 20 µm.
Pulsing of the fiber jet occurred in the MEW of PP (Figure 3.3.8.2, bottom right), where the fiber
diameter fluctuated throughout the printing. Again pulsing can also occur in the MEW of PCL, as
discussed in Chapter 2. Moreover, the surface morphology of PP fibers shows sectional
crystallization, as discussed above. The lower layer of both scaffolds showed flattening due to
the direct and extended contact to this fiber to the heated collector. Further investigation into
the structural properties of the 3D scaffolds needs to be undertaken to ascertain the mechanical
strength of these constructs, specifically in comparison with PCL scaffolds produced with similar
fiber diameters and spacings.

103
3.5 Chapter 3 Conclusions
MEW of PP greatly improved through the use of a heated collector that enabled the production
of fiber arrays, stacked fibers and, ultimately scaffolds. The effect of collector temperature,
collector translation speed and applied pressure were investigated to optimize the MEW process
for PP. Interestingly, printing fibers in arrays likely requires attention to the MEW translation
conditions for depositing fibers, which has never been seen previously with PCL. The
establishment of PP writing provides a future opportunity for the fiber-reinforcement of
hydrogels with PP fibers. The expected high tensile strength of such PP fibers coupled with their
non-degradability overcomes certain challenges in certain TE applications. Moreover, the
development of a heated collector plate was essential for the processing of PP, paving the way
for other polymers with high crystallinity and higher melting points to be processed via MEW.

104
Chapter 4 Future Directions
There are numerous directions that the MEW techniques developed throughout this thesis may
be utilized in the future. The benefit of MEW is both the magnitude of small fiber diameters that
can be achieved and the capacity to direct-write objects with such fibers. Moreover, there are
fundamental scientific questions regarding the macromolecular structure and crystallization
that occurs during the MEW process. Furthermore, the development of scaffold designs also
needs to be addressed.
4.1 Drug Delivery Devices Hydrogels with hierarchical pore architectures, demonstrated in this thesis in Chapter 2, have
applicability within drug delivery applications, or “on-chip” technologies [151]. As shown in this
thesis as a proof of concept, the channels imprinted within a hydrogel are both 3D and within
the microscale range in diameter. This imprinting allows for significant alteration of the
therapeutic loading and release capacity of hydrogels, while stimuli-responsive hydrogels as the
encapsulating matrix further extends the potential application of such constructs. Expanding this
approach to other polymers, hydrogels and therapeutic loading molecules are just a few of the
options available in the future. Furthermore, the design possibilities of 3D printing are vast and
can be used to control release rates. This approach could be used for generating microvascular
structures; a recent example is from the Lewis group who produced thick vascularized synthetic
tissues using bioprinting methods and sacrificial templates [152].
4.2 Fiber-Hydrogel Reinforced Composites with Controlled, Aligned
Porosity
It is already known that MEW reinforcement of hydrogels can provide significant increases in
compressive moduli. According to Visser et al., the mechanical load of compression is directed
through the MEW fibers and places them in tension [50]. Therefore, comparing the same 3D
printed structures (made from either PCL or PP) in the same hydrogel should yield different
results. With a higher elastic modulus (and ultimate strength), PP reinforced hydrogels should
be even stronger than their PCL counterparts. Again, the ability to design the fiber placement
provides opportunities for hydrogels to be reinforced with anisotropic approaches.

105
4.3 Crystal Structure Investigation of Polymer Fibers after processing via
Melt Electrospinning Writing The mechanical properties of melt processed polymers can be strongly influenced by the
resulting crystallinity [153]. While this is known, there is little knowledge as to how melt
electrospinning can affect crystallinity and therefore the mechanical properties of MEW
scaffolds. Moreover, the degree of crystallinity and the variations in the different
amorphous/crystalline regions of PCL fibers may lead to surface degradation or different levels
of autocatalysis inside the fibers. Therefore, the crystallinity may determine the mechanism for
degradation of specific constructs.
MEW parameters such as polymer melt processing temperature, surrounding air temperature
upon deposition, collector speed, accelerating voltage, additives, post-process annealing,
post-process surface treatment and more may have an effect on the crystallinity of the MEW PCL
fibers. An investigation into how such parameters affect the crystallinity and the subsequent,
degradation rate and mechanisms is needed. If one could vary the degradation rate of PCL, then
this would have significant ramifications and opportunities for PCL melt spun medical devices.
For the non-degradable PP, the crystallinity has implications, particularly for the mechanical
strength. Isotactic PP exhibits a higher degree of crystallinity than most polymers and readily
cools, producing large surface-visible spherulites, when the temperature difference from melt to
cooling is large, indicating rapid surface cooling. Furthermore, surface crystallinity of PP fibers
produced via MEW, varies depending a number of factors including the temperature of the melt,
the surrounding air temperature when deposited, the heated-collector temperature and
collector speed.
The final crystallinity of PP products that have been melt-processed has a large influence on the
mechanical strength of those products. Therefore, it is important to understand the
crystallization mechanisms for MEW PP for future applications of high-strength devices
developed this technique.

106
Chapter 5 Final Conclusion
The aim of thesis was to answer three fundamental questions relating to the MEW of polymers
to produce templates or scaffolds. Firstly, this thesis explored whether MEW sacrificial
templates could be generated to produce novel and intentionally designed hierarchical
structured PAOx hydrogels in high fidelity. Secondly, an investigation into the MEW
process-ability of commercial PP’s to create scaffolds was undertaken. Thirdly, the processing
conditions and parameters required for the MEW of PP were investigated.
The sacrificial templating technique discussed in Chapter 2, explored the potential of MEW
sacrificial templates to provide a simple and universal way to induce designed porosity into 3D
hydrogels. It was shown that MEW was a suitable method to design and print fiber templates in
the low micron range that could be used to pattern PAOx hydrogels. Moreover, PAOx polymers
provided a facile and simple route to produce hydrogels in short reaction times, with the
polymers having multi-modal functionality that lends itself to being a promising biomaterial in
tissue engineering. These interconnected, aligned pores are desirable for many applications,
including for tissue engineering of vascular networks, hydrogel microfluidics, self-healing
materials and soft robotics.
The MEW of PP was successfully completed, whereby the use of a heated collector was required
to produce the desired process-ability of commercial PPs. The optimization of the processing
conditions led to elucidation of the effect that the collector temperature, collector translation
speed and applied pressure had on the MEW of PP. As a result of this information, specifically
the control of PP fiber placement and diameter, the fiber-reinforcement of hydrogels using PP
can now be explored. PP constructs produced via MEW will have particular application where
non-degradability and increased mechanical strength are required and an advantage.

107
REFERENCES [1] M. P. Lutolf, Nat. Mater. 2009, 8, 451. [2] C. M. Magin, D. L. Alge, and K. S. Anseth, Biomed. Mater. 2016, 11, 022001. [3] T. Graham, P. Roy. Soc. Lond. 1864, 13, 335. [4] Y. Hong, T. V. Chirila, S. Vijayasekaran, W. Shen, X. Lou, and P. D. Dalton, J. Biomed. Mater.
Res. 1998, 39, 650. [5] G. Y. Huang, L. H. Zhou, Q. C. Zhang, Y. M. Chen, W. Sun, F. Xu and T. J. Lu, Biofabrication
2011, 3, 012001. [6] J. M. Karp, P. D. Dalton, and M. S. Shoichet, MRS Bull. 2011, 28, 301. [7] Y. J. Lee and P. V. Braun, Adv. Mater. 2003, 15, 563. [8] P. Zorlutuna, N. Annabi, G. Camci-Unal, M. Nikkhah, J. M. Cha, J. W. Nichol, A. Manbachi, H.
Bae, S. Chen and A. Khademhosseini, Adv. Mater. 2012, 24, 1782. [9] Y. Hong, J. G. Zhou, and D. Yao, J. Manuf. Sci. Eng. 2014, 136, 031013. [10] T. V. Chirila, I. J. Constable, G. J. Crawford, S. Vijasekara, D. E. Thompson, Y-C. Chen, W. A.
Fletcher and B. J. Griffin. Biomater. 1993, 14, 26. [11] T. V. Chirila, Y.-C. Chen, B. J. Griffin, and I. J. Constable, Polym. Int. 1993, 32, 221. [12] J. Chen, H. Park, and K. Park, J. Biomed. Mater. Res. 1999, 44, 53. [13] C. Ji, N. Annabi, A. Khademhosseini, and F. Dehghani, Acta Biomater. 2011, 7, 1653. [14] P. A. M. Lips, I. W. Velthoen, P. J. Dijkstra, M. Wessling, and J. Feijen, Polym. 2005, 46, 9396. [15] T. Dispinar, W. Van Camp, L. J. De Cock, B. G. De Geest, and F. E. Du Prez, Macromol. Biosci.
2012, 12, 383. [16] J. J. Wu, Q. Zhao, J. Z. Sun, and Q. Y. Zhou, Soft Matter 2012, 8, 3620. [17] S. C. Owen, S. A. Fisher, R. Y. Tam, C. M. Nimmo, and M. S. Shoichet, Langmuir 2013, 29,
7393. [18] L. Li and Y.-L. Hsieh, Nanotechnol. 2005, 16, 2852. [19] A. R. Studart, Chem. Soc. Rev. 2016, 45, 359. [20] K. V. Wong and A. Hernandez, ISRN Mech. Eng. 2012, 2012, 208760. [21] K. Arcaute, B. K. Mann, and R. B. Wicker, Ann. Biomed. Eng. 2006, 34, 1429. [22] A. P. Golden and J. Tien, Lab Chip 2007, 7, 720. [23] X. Y. Wang, Z. H. Jin, B. W. Gan, S. W. Lv, M. Xie, and W. H. Huang, Lab Chip 2014, 14, 2709. [24] C. Gualandi, A. Zucchelli, M. Fernandez Osorio, J. Belcari, and M. L. Focarete, Nano Lett. 2013,
13, 5385. [25] L. M. Bellan, S. P. Singh, P. W. Henderson, T. J. Porri, H. G. Craighead, and J. A. Spector, Soft
Matter 2009, 5, 1354. [26] L. Flynn, P. D. Dalton, and M. S. Shoichet, Biomater. 2003, 24, 4265. [27] J. S. Miller, K. R. Stevens, M. T. Yang, B. M. Baker, D. H. Nguyen, D. M. Cohen, E. Toro, A. A.
Chen, P. A. Galie, X. Yu, R. Chaturvedi, S. N. Bhatia and C. S. Chen, Nat. Mater. 2012, 11, 768. [28] B. M. Baker, B. Trappmann, S. C. Stapleton, E. Toro, and C. S. Chen, Lab Chip 2013, 13, 3246. [29] K. S. Toohey, N. R. Sottos, J. A. Lewis, J. S. Moore, and S. R. White, Nat. Mater., 2007, 6, 581. [30] D. Huh, B. D. Matthews, A. Mammoto, M. Montoya-Zavala, H. Y. Hsin, and D. E. Ingber,
Science, 2010, 328, 1662. [31] H. N. Chia and B. M. Wu, J. Bio. Eng. 2015, 9, 4. [32] D. W. Hutmacher and P. D. Dalton, Chem. - Asian J. 2011, 6, 44. [33] C. Zhiyuan, J. He, Z. Fengwen, L. Yuexing, L. Yong, and Y. Huilin, J. Serb. Chem. Soc. 2014, 79,
587. [34] H. Li, W. Wu, M. M. Bubakir, H. Chen, X. Zhong, Z. Liu, Y. Ding and W. Yang, J. Appl. Polym.
Sci. 2014, 131, 40080. [35] L. Cao, M. Dong, A. Zhang, Y. Liu, W. Yang, Z. Su, and X. Chen, Polym. Eng. Sci. 2013, 53,
2674. [36] J. Fang, L. Zhang, D. Sutton, X. Wang, and T. Lin, J. Nanomater. 2012, 2012, 1. [37] D. Cho, H. Zhou, Y. Cho, D. Audus, and Y. L. Joo, Polym. 2010, 51, 6005.

108
[38] Y. Kadomae, Y. Maruyama, M. Sugimoto, T. Taniguchi, and K. Koyama, Fibers Polym. 2009, 10, 275.
[39] M. L. Muerza-Cascante, D. Haylock, D. W. Hutmacher, and P. D. Dalton, Tissue Eng., Part B 2015, 21, 187.
[40] A. J. T. Teo, A. Mishra, I. Park, Y.-J. Kim, W.-T. Park, and Y.-J. Yoon, ACS Biomater. Sci. Eng. 2016, 2, 454.
[41] C. Yag-Howard, Dermatol. Surg. 2014, 40, S3. [42] J. A. Hunt, R. Chen, T. van Veen, and N. Bryan, J. Mater. Chem. B 2014, 2, 5319. [43] A. Zahoranová and J. Kronek, in Handbook of Polymers for Pharmaceutical Technologies:
Bioactive and Compatible Synthetic/Hybrid Polymers, (Eds: V. K. Thakur and M. K. Thakur) John Wiley & Sons, Vol. 4, Hoboken, NJ, USA, 2015.
[44] E. Caló and V. V. Khutoryanskiy, Eur. Polym. J. 2015, 65, 252. [45] M. F. Maitz, Biosurf. Biotribio. 2015, 1, 161. [46] R. Konradi, C. Acikgoz, and M. Textor, Macromol. Rapid Comm. 2012, 33, 1663. [47] R. Hoogenboom, Angew. Chem. Int. Ed. 2009, 48, 7978. [48] O. Sedlacek, B. D. Monnery, S. K. Filippov, R. Hoogenboom, and M. Hruby, Macromol. Rapid
Comm. 2012, 33, 1648. [49] N. Adams and U. S. Schubert, Adv. Drug Deliv. Rev. 2007, 59, 1504. [50] J. Visser, F. P. Melchels, J. E. Jeon, E. M. van Bussel, L. S. Kimpton, H. M. Byrne W. J. A. Dhert,
P. D. Dalton, D. W. Hutmacher and J. Malda., Nat. Commun., 2015, 6, 6933. [51] X. Li, Y. Yang, Y. Fan, Q. Feng, F. Z. Cui, and F. Watari, J. Biomed. Mater. Res. Part A, 2014,
102, 1580. [52] S. D. McCullen, C. M. Haslauer, and E. G. Loboa, J. Mater. Chem. 2010, 20, 8776. [53] T. R. Cox and J. T. Erler, Dis. Models & Mech. 2011, 4, 165. [54] F. Brandl, F. Sommer, and A. Goepferich, Biomater. 2007, 28, 134. [55] J. Malda, J. Visser, F. P. Melchels, T. Jungst, W. E. Hennink, W. J. Dhert, J. Groll and D. W.
Hutmacher, Adv. Mater. 2013, 25, 5011. [56] G. Li, F. Li, Z. Zheng, T. Luo, J. Liu, J. Wu, X. Wang and D. L. Kaplan., J. Mater. Sci. 2015, 51,
3025. [57] S. Yodmuang, S. L. McNamara, A. B. Nover, B. B. Mandal, M. Agarwal, T. A. Kelly, P. H. Chao,
C. Hung, D. L. Kaplan and G. Vunjak-Novakovic, Acta Biomater. 2015, 11, 27. [58] M. A. de Moraes, E. Paternotte, D. Mantovani, and M. M. Beppu, Macromol. Biosci. 2012, 12,
1253. [59] W. Laftah and S. Hashim, Chem. Pap. 2014, 68, 798. [60] U. Boudriot, R. Dersch, A. Greiner, and J. H. Wendorff, Artif. Organs 2006, 30, 785. [61] F. T. Moutos, L. E. Freed, and F. Guilak, Nat. Mater. 2007, 6, 162. [62] F. T. Moutos, B. T. Estes, and F. Guilak, Macromol. Biosci. 2010, 10, 1355. [63] W. J. C. M. Marijnissen, G. J. V. M. van Osch, J. Aigner, S. W. van der Veen, A. P. Hollander, H.
L. Verwoerd-Verhoef and J. A. Verhaar, Biomater. 2002, 23, 1511. [64] R. Singhal and K. Gupta, Polym.-Plast. Technol. Eng. 2015, 55, 54. [65] I. C. Liao, F. T. Moutos, B. T. Estes, X. Zhao, and F. Guilak, Adv. Funct. Mater. 2013, 23, 5833. [66] K. W. M. Boere, M. M. Blokzijl, J. Visser, J. E. A. Linssen, J. Malda, W. E. Hennink and T.
Vermonden, J. Mater. Chem. B 2015, 3, 9067. [67] K. H. Lee, H. Y. Kim, M. S. Khil, Y. M. Ra, and D. R. Lee, Polym. 2003, 44, 1287. [68] G. E. Wnek, M. E. Carr, D. G. Simpson, and G. L. Bowlin, Nano Lett. 2003, 3, 213. [69] W. Cui, X. Li, S. Zhou, and J. Weng, Polym. Degrad. Stab. 2008, 93, 731. [70] D. Kai, M. P. Prabhakaran, B. Stahl, M. Eblenkamp, E. Wintermantel, and S. Ramakrishna,
Nanotechnol. 2012, 23, 095705. [71] J. Coburn, M. Gibson, P. A. Bandalini, C. Laird, H. Q. Mao, L. Moroni, D. Seliktar and J.
Elisseeff, Smart Struct. Syst. 2011, 7, 213. [72] D. G. Strange, K. Tonsomboon, and M. L. Oyen, J. Mater. Sci. Mater. Med. 2014, 25, 681.

109
[73] F. Mirahmadi, M. Tafazzoli-Shadpour, M. A. Shokrgozar, and S. Bonakdar, Mater. Sci. Eng. C Mater. Biol. Appl. 2013, 33, 4786.
[74] D. W. Hutmacher, M. Sittinger, and M. V. Risbud, Trends Biotechnol. 2004, 22, 354. [75] I. Zein, D. W. Hutmacher, K. C. Tan, and S. H. Teoh, Biomater. 2002, 23, 1169. [76] T. D. Brown, P. D. Dalton, and D. W. Hutmacher, Adv. Mater. 2011, 23, 5651. [77] T. D. Brown, A. Slotosch, L. Thibaudeau, A. Taubenberger, D. Loessner, C. Vaquette, P. D.
Dalton and D. W. Hutmacher, Biointerphases 2012, 7, 13. [78] G. Hochleitner, T. Jungst, T. D. Brown, K. Hahn, C. Moseke, F. Jakob, P. D. Dalton and J. Groll.,
Biofabrication 2015, 7, 035002. [79] B. L. Farrugia, T. D. Brown, Z. Upton, D. W. Hutmacher, P. D. Dalton, and T. R. Dargaville,
Biofabrication 2013, 5, 025001. [80] T. D. Brown, F. Edin, N. Detta, A. D. Skelton, D. W. Hutmacher, and P. D. Dalton, Mater. Sci.
Eng. C Mater. Biol. Appl. 2014, 45, 698. [81] T. Jungst, M. L. Muerza-Cascante, T. D. Brown, M. Standfest, D. W. Hutmacher, J. Groll and P.
D. Dalton, Polym. Int. 2015, 64, 1086. [82] S. J. Kim, D. H. Jang, W. H. Park, and B.-M. Min, Polym. 2010, 51, 1320. [83] H. Zhou, T. B. Green, and Y. L. Joo, Polym. 2006, 47, 7497. [84] P. D. Dalton, K. Klinkhammer, J. Salber, D. Klee, and M. Moller, Biomacromolecules, 2006, 7,
686. [85] P. D. Dalton, J. Lleixa Calvet, A. Mourran, D. Klee, and M. Moller, Biotechnol. J. 2006, 1, 998. [86] P. D. Dalton, D. Grafahrend, K. Klinkhammer, D. Klee, and M. Möller, Polym. 2007, 48, 6823. [87] N. Detta, T. D. Brown, F. K. Edin, K. Albrecht, F. Chiellini, E. Chiellini, P. D. Dalton and D. W.
Hutmacher, Polym. Int. 2010, 59, 1558. [88] P. D. Dalton, N. T. Joergensen, J. Groll, and M. Moeller, Biomed. Mater. 2008, 3, 034109. [89] F. Chen, G. Hochleitner, T. Woodfield, J. Groll, P. D. Dalton, and B. G. Amsden,
Biomacromolecules 2016, 17, 208. [90] X.-F. Wang and Z.-M. Huang, Chin. J. Polym. Sci. 2009, 28, 45. [91] G. Hochleitner, J. F. Hümmer, R. Luxenhofer, and J. Groll, Polym. 2014, 55, 5017. [92] Z. Liu, G. Zheng, K. Dai, C. Liu, and C. Shen, J. Appl. Polym. Sci. 2016, 133, 43454. [93] A. Charuchinda, R. Molloy, J. Siripitayananon, N. Molloy, and M. Sriyai, Polym. Int. 2003, 52,
1175. [94] W. S. Cobb, K. W. Kercher, and B. T. Heniford, Surg. Innov. 2005, 12, 63. [95] N. Annabi, J. W. Nichol, X. Zhong, C. Ji, S. Koshy, A. Khademhosseini, F. Dehghani, Tissue Eng.
Part B 2010, 16, 371. [96] L. E. Bertassoni, M. Cecconi, V. Manoharan, M. Nikkhah, J. Hjortnaes, A. L. Cristino, G.
Barabaschi, D. Demarchi, M. R. Dokmeci, Y. Yang and A. Khademhosseini, Lab Chip 2014, 14, 2202.
[97] N. Annabi, A. Tamayol, J. A. Uquillas, M. Akbari, L. E. Bertassoni, C. Cha, G. Camci-Unal, M. R. Dokmeci, N. A. Peppas and A. Khademhosseini, Adv. Mater. 2014, 26, 85.
[98] M. Verhulsel, M. Vignes, S. Descroix, L. Malaquin, D. M. Vignjevic, and J. L. Viovy, Biomater. 2014, 35, 1816.
[99] T. Tokatlian, C. Cam, and T. Segura, Adv. Healthcare Mater. 2015, 4, 1084. [100] C. V. Duffy, L. David, and T. Crouzier, Acta Biomater. 2015, 20, 51. [101] J. Huling, I. K. Ko, A. Atala, and J. J. Yoo, Acta Biomater. 2016, 32, 190. [102] J. N. Haigh, Y. M. Chuang, B. Farrugia, R. Hoogenboom, P. D. Dalton, and T. R. Dargaville,
Macromol. Rapid Comm. 2016, 37, 93. [103] A. Sergeeva, N. Feoktistova, V. Prokopovic, D. Gorin, and D. Volodkin, Adv. Mater. Interfaces
2015, 2, 10. [104] D. B. Kolesky, R. L. Truby, A. S. Gladman, T. A. Busbee, K. A. Homan, and J. A. Lewis, Adv.
Mater. 2014, 26, 3124. [105] W. Wu, A. DeConinck, and J. A. Lewis, Adv. Mater. 2011, 23, H178.

110
[106] J. B. Scott, M. Afshari, R. Kotek, and J. M. Saul, Biomater. 2011, 32, 4830. [107] T. R. Dargaville, R. Forster, B. L. Farrugia, K. Kempe, L. Voorhaar, U. S. Schubert and R.
Hoogenboom, Macromol. Rapid Comm. 2012, 33, 1695. [108] B. L. Farrugia, K. Kempe, U. S. Schubert, R. Hoogenboom, and T. R. Dargaville, Biomacromol.
2013, 14, 2724. [109] H. Huang, R. Hoogenboom, M. A. Leenen, P. Guillet, A. M. Jonas, U. S. Schubert and Jean-
François Gohy, J. Am. Chem. Soc. 2006, 128, 3784. [110] N. T. Brummelhuis and H. Schlaad, Polym. Chem. 2011, 2, 1180. [111] C. Englert, L. Tauhardt, M. Hartlieb, K. Kempe, M. Gottschaldt, and U. S. Schubert,
Biomacromol. 2014, 15, 1124. [112] V. Schenk, E. Rossegger, C. Ebner, F. Bangerl, K. Reichmann, B. Hoffmann, M. Höpfner and F.
Wiesbrock, Polym. 2014, 6, 264. [113] C. Legros, M.-C. De Pauw-Gillet, K. C. Tam, S. Lecommmandoux, and D. Taton, Polym. Chem.
2013, 4, 4801. [114] M. Hartlieb, D. Pretzel, K. Kempe, C. Fritzsche, R. M. Paulus, M. Gottschaldt and U. S.
Schubert, Soft Matter, 2013, 9, 4693. [115] M. Hartlieb, D. Pretzel, C. Englert, M. Hentschel, K. Kempe, M. Gottschaldt and U. S.
Schubert, Biomacromol. 2014, 15, 1970. [116] A. N. Stachowiak, A. Bershteyn, E. Tzatzalos, and D. J. Irvine, Adv. Mater. 2005, 17, 399. [117] Q. L. Loh and C. Choong, Tissue Eng. Part B 2013, 19, 485. [118] C. K. Colton, Cell Transplant. 1995, 4, 415. [119] S. M. Ehsan and S. C. George, Tissue Eng. Part A 2013, 19, 1433. [120] M. I. Gunther, N. Weidner, R. Muller, and A. Blesch, Acta Biomater. 2015, 27, 140. [121] B. M. Bailey, R. Fei, D. Munoz-Pinto, M. S. Hahn, and M. A. Grunlan, Acta Biomater. 2012, 8,
4324. [122] D. Wang, D. J. T. Hill, F. Rasoul, and A. K. Whittaker, Radiat. Phys. Chem. 2011, 80, 207. [123] S. Stokols and M. H. Tuszynski, Biomater. 2006, 27, 443. [124] S. Stokols and M. H. Tuszynski, Biomater. 2004, 25, 5839. [125] C. L. Norton, Method of and apparatus for producing fibrous or filamentary material, Google
Patents US2048651 A , 1936. [126] L. Larrondo and R. St. John Manley, J. Polym. Sci. 1981, 19, 909. [127] G. Taylor, in Proc. R. Soc. A, 1969, 313. [128] P. D. Dalton, C. Vaquette, B. L. Farrugia, T. R. Dargaville, T. D. Brown, and D. W. Hutmacher,
Biomater. Sci. 2013, 1, 171. [129] T. D. Brown, P. D. Dalton, and D. W. Hutmacher, Prog. Polym. Sci. 2016, 56, 116. [130] R. Deng, Y. Liu, Y. Ding, P. Xie, L. Luo, and W. Yang, J. Appl. Polym. Sci. 2009, 114, 166. [131] S. J. Bryant, C. R. Nuttelman, and K. S. Anseth, J. Biomater. Sci. Polym. 2000, 11, 439. [132] N. Zhang, R. Luxenhofer, and R. Jordan, Macromol. Chem. Phys. 2012, 213, 973. [133] J. Lyons, C. Li, and F. Ko, Polym. 2004, 45, 7597. [134] J. D. Roberts and M. C. Caserio, Basic Principles of Organic Chemistry, WA Benjamin Inc.
Menlo Park, CA, USA 1977. [135] G. Natta, J. Poly. Sci. 1959, 34, 531. [136] H. R. Sailors and J. P. Hogan, J. Macromol. Sci. Part A – Chem. 2006, 15, 1377. [137] Bringing Order to Polymers, Nat. Mater. 2013, 12, 773. [138] J. Varga, J. Therm. Anal. 1986, 31, 165. [139] J.-H. Chen and Y.-L. Chang, J. Appl. Polym. Sci. 2007, 103, 1093. [140] K.-H. Lee, O. Ohsawa, K. Watanabe, I.-S. Kim, S. R. Givens, B. Chase and J. F. Rabolt,
Macromol. 2009, 42, 5215. [141] X. Li, Y. Zhang, H. Li, H. Chen, Y. Ding, and W. Yang, Desalination 2014, 344, 266. [142] S. Lee and S. Kay Obendorf, J. Appl. Polym. Sci. 2006, 102, 3430. [143] C. S. Kong, K. J. Jo, N. K. Jo, and H. S. Kim, Polym. Eng. Sci. 2009, 49, 391.

111
[144] P. Jacoby, B. H. Bersted, W. J. Kissel, and C. E. Smith, J. Polym. Sci. Part B: Polym. Phys. 1986, 24, 461.
[145] G. Hochleitner, A. Youssef, A. Hrynevich, N. Haigh Jodie, T. Jungst, J. Groll and P. D. Dalton, BioNanoMater. 2016, 17, 159.
[146] Z.-M. Huang, Y. Z. Zhang, M. Kotaki, and S. Ramakrishna, Compos. Sci. Technol. 2003, 63, 2223.
[147] S. Megelski, J. S. Stephens, D. B. Chase, and J. F. Rabolt, Macromol. 2002, 35, 8456. [148] P. D. Dalton, M. L. Muerza-Cascante, and D. W. Hutmacher, in Electrospinning : Principles,
Practice and Possibilities (Ed: Geoffrey R Mitchell) 2015, pp. 100-120. [149] G. W. Ehrenstein, Polymeric Materials Structure – Properties – Applications, Carl Hanser
Verlag GmbH & Co. KG, Munich, Germany 2001. [150] S. H. Barbanti, C. A. C. Zavaglia, and E. A. D. R. Duek, Mater. Res. 2008, 11, 75. [151] J. Ribas, H. Sadeghi, A. Manbachi, J. Leijten, K. Brinegar, Y. S. Zhang, L. Ferreira and A.
Khademhosseini, Appl. In Vitro Toxicol. 2016, 2, 82. [152] D. B. Kolesky, K. A. Homan, M. A. Skylar-Scott, and J. A. Lewis, in Proc. Nat. Acad. Sci. USA
2016, 113, 3179. [153] C. De Rosa and F. Auriemma, Crystals and Crystallinity in Polymers: Diffraction Analysis of
Ordered and Disordered Crystals, John Wiley & Sons, Hoboken, NJ, USA 2013.
![A new prototype melt-electrospinning device for the production of … · 2019. 3. 29. · [41]. The applications of sub-microfibers and nanofibers depend on their physical and mechanical](https://static.fdocuments.in/doc/165x107/60a9e162c6a7443c07440680/a-new-prototype-melt-electrospinning-device-for-the-production-of-2019-3-29.jpg)