IL SONNO VISTO DAL NEUROLOGO Luigi Ferini Strambi Università Vita-Salute San Raffaele, Milano.

AAllmmaa MMaatteerr SSttuuddiioorruumm –– UUnniivveerrssiittàà ddii BBoollooggnnaa
DOTTORATO DI RICERCA IN
Medicina del Sonno
Ciclo XXII
Settore scientifico-disciplinare di afferenza: MED / 26
ADVANCED MR TECHNIQUES IN THE STUDY OF RESTLESS LEGS SYNDROME
Presentata da: Dott. Giovanni Rizzo
Coordinatore Dottorato Relatore
Prof. Pasquale Montagna Prof. Pasquale Montagna
Esame finale anno 2010

1
A mio padre
A Sara

2
CONTENTS
INTRODUCTION ......................................................................................... 3
Historical note ................................................................................................ 4
Clinical features and diagnosis ...................................................................... 5
Essential diagnostic criteria for RLS ......................................................... 5
Supportive clinical features of RLS ........................................................... 6
Associated features of RLS ........................................................................ 6
Genetics .......................................................................................................... 8
Pathophysiology ............................................................................................. 9
Central nervous structures and networks ................................................. 10
Structural and microstructural abnormalities in MR studies.................... 11
Dopaminergic system ............................................................................... 12
Iron metabolism ....................................................................................... 15
OBJECTIVES .............................................................................................. 18
METHODS .................................................................................................. 23
Setting, timing and subjects ......................................................................... 24
MR protocols ................................................................................................ 24
RESULTS .................................................................................................... 31
Structural and microstructural analysis ........................................................ 32
Subjects .................................................................................................... 32
MR data .................................................................................................... 32 1H-MRS ........................................................................................................ 33
Subjects .................................................................................................... 33
MR data .................................................................................................... 33
Phase imaging .............................................................................................. 33
Subjects .................................................................................................... 33
MR data .................................................................................................... 34
DISCUSSION .............................................................................................. 35
TABLES AND FIGURES ........................................................................... 41
REFERENCES ............................................................................................. 57

3
INTRODUCTION

4
Restless legs syndrome (RLS) is the most common disorder of movement
and quiet wakefulness, with a prevalence in the general population of 10–
12% (with a range of 5–20% among different studies), that increases with
age and is higher in women than in men (Trenkwalder C et al, 2005; Allen
RP et al, 2003). It is characterised by an irresistible urge to move the legs,
associated with unpleasant paraesthesias in the legs and sometimes in the
arms. These sensations occur at rest, in particular in the evening or at night,
and are relieved by movement. Many patients also have periodic limb
movements in sleep (PLMS) and wakefulness (PLMW) and they may
complain of insomnia and/or hypersomnia (Trenkwalder C et al, 2005;
Allen RP et al, 2003). In the 70-80% of cases it is an idiopathic disorder
with no apparent cause and in the remaining part is described as a
symptomatic syndrome associated with pregnancy, uremia, iron depletion,
polyneuropathy, spinal disorders, and rheumatoid arthritis (Bassetti C et al,
2001, Trenkwalder C et al, 2005), which is probably more correct to
consider “risk factors” (Zucconi M, Ferini-Strambi L, 2004).
Historical note
The first clinical description of restless legs is attributed to Thomas Willis,
which described the syndrome in 1672 (Willis, 1685). In 1861 Wittmaack
called the disorder "anxiety tibiarum," and wrote that it was a frequent
symptom of hysteria (Wittmaack, 1861). Oppenheim was the first to define
the disease as a neurologic illness and the first to recognize the genetic
component of the disease (Oppenheim, 1923). The first significant clinical
review of restless legs syndrome was written by Ekbom in 1945. He
provided the basic modern description of the disorder and first suggested the
currently accepted term “restless legs syndrome”. His monograph described
2 forms of the disorder: one form presents with prominent paresthesia,
"asthenia crurum paresthetica," and the other form presents with prominent
pain, "asthenia crurum dolorosa" (Ekbom, 1945). In 1953 Nils-Brage

5
Nordlander was the first to propose that iron deficiency may play a primary
role in restless legs syndrome (RLS) (Nordlander NB, 1953). In 1953
Symonds described 5 patients with jerking of the extremities during sleep.
He thought it could represent an epileptic disorder and called it "nocturnal
myoclonus" (Symonds CP et al, 1953). In 1965, Lugaresi and colleagues
first videopolysomnographically documented the presence of PLMS
(adopting the Symonds’ definition) in patients with RLS (Lugaresi E et al,
1965).
Clinical features and diagnosis
In 1995, clinical diagnostic criteria for the restless legs syndrome were
established by the International Restless Legs Syndrome Study Group
(IRLSSG) (Walters AS, 1995), and reviewed in 2003 (Allen RP et al, 2003).
These include four essential criteria that all must be met and three
supportive criteria. Furthermore additional significant clinical features are
associated with the disorder.
Essential diagnostic criteria for RLS 1) An urge to move the legs, usually accompanied or caused by
uncomfortable and unpleasant sensations in the legs (Sometimes the
urge to move is present without the uncomfortable sensations and
sometimes the arms or other body parts are involved in addition to
the legs)
2) The urge to move or unpleasant sensations begin or worsen during
periods of rest or inactivity such as lying or sitting
3) The urge to move or unpleasant sensations are partially or totally
relieved by movement, such as walking or stretching, at least as long
as the activity continues

6
4) The urge to move or unpleasant sensations are worse in the evening
or night than during the day or only occur in the evening or night
(When symptoms are very severe, the worsening at night may not be
noticeable but must have been previously present)
Supportive clinical features of RLS 1) Family history: he prevalence of RLS among first-degree relatives of
people with RLS is 3 to 5 times greater than in people without RLS.
2) Response to dopaminergic therapy: nearly all people with RLS show
at least an initial positive therapeutic response to either L-dopa or a
dopamine-receptor agonist at doses considered to be very low in
relation to the traditional doses of these medications used for the
treatment of Parkinson disease. This initial response is not, however,
universally maintained.
3) Periodic limb movements (during wakefulness or sleep): periodic
limb movements in sleep (PLMS) occur in at least 85% of people
with RLS; however, PLMS also commonly occur in other disorders
and in the elderly. In children, PLMS are much less common than in
adults.
Associated features of RLS 1) Natural clinical course: the clinical course of the disorder varies
considerably, but certain patterns have been identified that may be
helpful to the experienced clinician. When the age of onset of RLS
symptoms is less than 50 years, the onset is often more insidious;
when the age of onset is greater than 50 years, the symptoms often
occur more abruptly and more severely. In some patients, RLS can
be intermittent and may spontaneously remit for many years.
2) Sleep disturbance: disturbed sleep is a common major morbidity for
RLS and deserves special consideration in planning treatment. This

7
morbidity is often the primary reason the patient seeks medical
attention.
3) Medical evaluation/physical examination: the physical examination
is generally normal and does not contribute to the diagnosis except
for those conditions that may be comorbid or secondary causes of
RLS. Iron status, in particular, should be evaluated because
decreased iron stores are a significant potential risk factor that can be
treated. The presence of peripheral neuropathy and radiculopathy
should also be determined because these conditions have a possible,
although uncertain, association and may require different treatment.
In summary RLS is a sensorimotor disorder. The sensory components
include discomfort in the legs with an urge to move that patients report
using different and sometimes bizarre descriptions: creepy-crawly, ants
crawling, jittery, pulling, worms moving, soda bubbling in the veins, electric
current, shock-like feelings, pain, the gotta moves, burning, jimmy legs,
heebie jeebies, tearing, throbbing, tight feeling, grabbing sensation, elvis
legs, itching bones, crazy legs, fidgets (Walters AS, 1996). The motor
component is characterized by the need to walk and involuntary periodic leg
movements during wakefulness (PLMW) and during sleep (PLMS).
In the diagnostic process particular attention must be made in order to
exclude other conditions that may resemble RLS. Indeed, an interview with
a trained physician is necessary for the correct diagnosis of RLS: if only
questionnaires with the RLS criteria are given to patients this results in
approximately 10–25 % false positives due to the so-called “RLS mimics”,
which include akathisia, nocturnal leg cramps, peripheral neuropathy,
lumbosacral radiculopathy, painful legs and moving toes, growing pains,
attention deficit hyperactivity disorder (ADHD) (Hening WA et al, 2009).
Useful diagnostic tool is the suggested immobilization test (SIT), that
evaluates periodic leg movements (PLM) and self-reported sensory
symptoms for people who are instructed to remain still for 1 h while sitting
on a bed with their legs outstretched (Michaud M et al, 2002).

8
Polysomnography allows accurate assessment of PLMS, scoring them only
if they occur in a series of four consecutive movements lasting 0.5-5 s, have
an amplitude of one quarter or more of the toe dorsiflexion during
calibration and are separated by intervals of 4-90 s. They occur during the
stages 1-2 of NREM sleep, diminish during stages 3-4 and nearly always
disappear during REM sleep. An index (number of PLMS per hours of
sleep) greater than 5 for the entire night is considered pathologic and is
supportive, although not specific, of the diagnosis of RLS (Zucconi M et al,
2006). The PLMW, both during the sleep period and the SIT, appear to be
more specific for RLS, but the data for this finding remain limited
(Montplaisir J, et al, 1998; Nicolas A et al, 1999).
With regard to the quantification of RLS symptoms, since it is primarily a
subjective disorder, a subjective scale represents the optimal instrument to
measure disease severity for clinical assessment, research, or therapeutic
trials. Therefore, in 2003 the IRLSSG proposed and validated a rating scale,
consists of ten questions, whose total score progresses from 0 to 40 with the
degree of disease severity (Walters AS et al, 2003).
Genetics A family history of RLS is present in more than 50% of affected individuals
(Zucconi M, Ferini-Strambi L, 2004). RLS is 3-5 times greater amongst
first degree relatives of subjects suffering from RLS than in subjects without
RLS (Allen RP et al, 2003) and pedigrees mostly suggest an autosomal-
dominant transmission with high penetrance. The possibility of anticipation
has been described (Trenkwalder C et al, 1996; Lazzarini A et al, 1999).
Variations in penetrance and anticipation suggest possible genetic
heterogeneity (Lazzarini A et al, 1999). RLS has also been reported to have
a high concordance for monozygotic (61%) and dyzygotic twins (45%)
(Desai AV et al, 2004). Clinically, familial forms cannot be differentiated
from sporadic or symptomatic forms (Winkelmann J et al, 2000) except for

9
an earlier age of onset and a more slowly progressive course in familial
cases (Allen RP and Earley CJ, 2000; Winkelmann J et al, 2002).
Linkage analysis actually have detected nine gene loci associated to familial
forms of RLS (RLS1-9), located on chromosomes 12q, 14q, 9q, 2q, 20p, 4q,
17p, 19p, 16p, all autosomal-dominant except the first one that is recessive
(Trenkwalder C et al, 2009; Levchenko A et al, 2009), but no candidate
gene has been identified. On the basis of knowledge of the pathophysiology
of RLS (see below) some candidate genes have been studied - i.e. those
coding for D1–D5 receptors, DAT, TH, Dopamine β hydroxylase, GTP
cyclohydrolase, GABA A receptor subunits (α1-6, β 1-3, χ1-3, p1-2), α-1
subunit of the glycine receptor (chromosome 5q31), MAO-A, MAO-B,
Neurotensin – without disclosing any mutation or clearly predisposing
polymorphism (Winkelmann J et al, 2007a; Dhawan V et al, 2006).
Recently, a genome-wide case-control study of single-nucleotide-
polymorphisms (SNPs) has showed association between RLS and three
genetic loci: one within MEIS1, one within BTBD9 and one between
MAP2K5 and LBXCOR1 (Winkelmann J et al, 2007b). Another genome-
wide association study of RLS and PLM reported association with one of
these genes, BTBD9 (Stefansson H et al, 2007). All these genes have been
implicated in development mechanisms, raising the possibility that RLS has
components of a developmental disorder. Interestingly BTBD9 also affects
ferritin level and iron storage (Mignot E, 2007).
Pathophysiology
The pathophysiology of RLS is poorly understood. A lot of observations
point towards an involvement of central nervous structures and networks,
dopaminergic system and iron metabolism.

10
Central nervous structures and networks RLS dysfunction appears to involve the central nervous system, but the
areas involved are somewhat uncertain. Functional MRI (fMRI)
demonstrated an activation of the thalamus (legs discomfort), cerebellum
(legs discomfort and PLM), red nuclei and brainstem (PLM) (Bucher SF et
al, 1997). A more recent fMRI study, using only a motor paradigm, found
activation in the thalamus, the putamen, the middle frontal gyrus and the
cingulated gyrus (Astrakas LG et al, 2008).
Electrophysiological studies suggest that the movements are involuntary and
are organized at the brainstem or spinal level (Trenkwalder C et la, 1996).
Patients with periodic leg movements of sleep, with or without associated
restless legs syndrome, may have abnormal blink reflexes (Briellmann RS et
al, 1996). H-reflexes with its modulation (Martinelli p and Coccagna G,
1976; Rijsman RM et al, 2005; Scaglione et al 2008) and flexor reflex
(Bara-Jimenez W et al, 2000) are impaired suggesting a brainstem or more
rostral dysfunction leading to enhanced spinal excitability. Cortical
prepotentials associated with the PLMS or PLMW have generally not been
found (Lugaresi et al, 1986; Trenkwalder et al, 1993). Recently a study
disclosed that in RLS patients the event-related beta and mu
(de)synchronization amplitudes and durations for voluntary movement were
greater during the symptomatic period (at 8:30 PM) than during the
asymptomatic (at 8:30 AM) period and in comparison with healthy controls,
suggesting the presence of cortical sensorimotor dysfunction (Tyvaert L et
al, 2009a). Cortical transcranial magnetic stimulation (TMS) studies in RLS
show that the pyramidal tract is intact, whereas the excitatory and inhibitory
system seems to be altered, but can be influenced and restored by treatment
with dopamine-agonists (Nardone R et al, 2006; Kutukcu Y et al, 2006;
Gorsler and Liepert, 2007; Rizzo V et al, 2009).
All these studies are consistent with a subcortical dysfunction that alters
function of the motor pathways.

11
Clinical observations in patients after an ischemic stroke suggest that lesions
of the subcortical brain areas such as the pyramidal tract, thalamus and the
basal ganglia-brainstem axis, which are involved in motor functions and
sleep-wake cycles, may lead to RLS symptoms (Lee SJ et al, 2009; Unrath
A et al, 2006). A study in patients with multiple sclerosis disclosed a higher
prevalence of RLS associated to greater cervical cord damage and
speculated about a possible brain-spinal disconnection (Manconi M et al,
2008).
Therefore, RLS appears as a complex movement disorder affecting several
levels of the neuraxis, even though the precise pathoanatomic location of
this dysfunction has not yet been determined (Barrière G et al, 2005).
However, there is evidence for impairment of sensorimotor processing at the
level of the cortex and the spinal cord, suggesting altered
subcortical/supraspinal control.
Structural and microstructural abnormalities in MR studies Conventional cranial MRI does not identify any structural abnormalities in
RLS patients. MR studies using advanced techniques reported contrasting
data. A voxel based morphometry (VBM) study detected a bilateral gray
matter increase in the pulvinar and the authors assumed that these changes
in thalamic structures may reflect a consequence of chronic increase in
afferent input of behaviourally relevant information (Etgen T et al, 2005).
Successive VBM studies did not confirm this result, but one disclosed
significant regional decreases of gray matter volume in the bihemispheric
primary somatosensory cortex, which additionally extended into left-sided
primary motor areas (Unrath A et al, 2007), another one slightly increased
gray matter density in the ventral hippocampus and in the middle
orbitofrontal gyrus (Hornyak M et al, 2007), and yet another one lack of
specific gray matter alterations (Celle S et al, 2009).
Only one diffusion tensor imaging (DTI) study of RLS is present in
literature (Unrath A et al, 2008). In the patient group, multiple subcortical

12
areas of significantly reduced fractional anisotropy (FA) (a quantitative
marker of white matter integrity) were observed bihemispherically in close
proximity to the primary and associate motor and somatosensory cortices, in
the right-hemispheric thalamus (posterior ventral lateral nucleus), in motor
projectional fibers and adjacent to the left anterior cingulum. The authors
suggested that these findings gave support to an altered subcortical network,
with the major component of altered cerebral sensorimotor pathways, within
a hodological concept of the RLS pathoanatomy (Unrath A et al, 2008).
Despite these conflicting data the investigation about structural
abnormalities in RLS remains an actual point of interest, also in light of the
discovery of a possible role of genes involved in development mechanisms
(MEIS1, BTBD9, MAP2K5 and LBXCOR1) (Winkelmann J et al, 2007b).
Dopaminergic system The dopaminergic system involvement is highly probable because treatment
with dopamine agonists shows efficacy as confirmed by controlled trials,
while dopamine antagonists worsen symptoms or may even elecit RLS
(Barrière G et al, 2005). Many studies reported an increased prevalence of
RLS in PD patients, although they are difficult to interpret because the
current diagnostic criteria for RLS have not been validated in PD patients
and “RLS mimics” could have been affect the results (Möller JC et al,
2010). PET and SPECT studies revealed some controversial results of the
pre- and postsynaptic dopaminergic neurotrasmission system. Almost all
have focused on the striatum, a brain region receiving dense dopaminergic
innervations, showing slight reduction binding or no difference of both
presynaptic ([123I]βCIT, [123I]IPT or [99mTc]TRODAT-1 in SPECT studies
and 18F-dopa in PET studies) and postsynaptic D2 radioligand ([123I]IBZM
in SPECT studies and 11C-raclopride in PET studies) in RLS patients when
compared with control subjects (Wetter TC et al, 2004; Hilker R et al,
2006). Taken together, these results suggest that at level of nigro-striatal
pathway the membrane dopamine transporter and postsynaptic D2-receptor

13
seem to be either unchanged or mildly reduced in patients with idiopathic
RLS. The most recent PET study investigated, besides striatal regions by 11C-raclopride, other extrastriatal dopaminergic regions by FLB 457 (a new
postsynaptic high-affinity D2 radioligand) and disclosed a higher binding
potential in patients than controls at level of limbic and associative part of
striatum, medial and posterior part of thalamus, anterior cingulate cortex
and insule, all part of the medial nociceptive system which is thought to
regulate the affective-motivational component of pain. The authors
sustained the hypothesis of hypoactive dopaminergic neurotrasmission
associated to receptor up-regulations (Cervenka S et al, 2006). An
involvement of the medial nociceptive system was supported also by a PET
with [11C]diprenorphine, a non-selective opioid receptor radioligand, which
found regional negative correlations between ligand binding and RLS
severity in areas serving the medial pain system (medial thalamus,
amygdala, caudate nucleus, anterior cingulate gyrus, insular cortex and
orbitofrontal cortex) (von Spiczak S et al, 2005).
In a recent pathological study, the substantia nigra and putamen were
obtained at autopsy from individuals with primary RLS and a neurologically
normal control group and a quantitative profile of the dopaminergic system
was obtained. RLS tissue, compared with controls, showed a significant
decrease in D2R in the putamen that correlated with severity of the RLS.
RLS also showed significant increases in tyrosine hydroxylase (TH) in the
substantia nigra, compared with the controls but not in the putamen, and
both with the decrease of D2R, interpreted as a down-regulation, led authors
to hypothesize an overly activated dopaminergic system as possible part of
the RLS pathology (Connor JR et al, 2009). The hypothesis of an increase in
dopamine activity and turnover is consistent with the recent CSF studies
showing increased 3-Ortho-methyldopa (3OMD) in RLS patients off
dopamine treatment that correlates well with increased HVA (Allen et al,
2008).
These contrasting data could be explained by the difference in the
methodologies and in selected patients (mild o severe RLS). However, even

14
if cerebral metabolism in RLS probably reflects a dysfunction of the central
dopaminergic system, it has still to be determined whether these alterations
affect mainly the nigrostriatal and/or other central dopaminergic systems
like the diencephalospinal or mesolimbic pathway and whether they are the
primary mechanisms or only secondary phenomena within the manifestation
of RLS symptoms.
In the last years great interest has developed around the involvement of
diencephalospinal pathway in RLS. Some authors forward the hypothesis
that RLS reflects a dysfunction of the little-studied dorso-posterior
hypothalamic dopaminergic A11 cell group (Clemens S et al, 2006). The
A11 cell group in the dorso-posterior hypothalamus and subparafascicular
thalamus is the largest, possible sole, source of spinal DA (Skagerberg G et
al, 1982 and 1985; Qu S et al, 2006). A11 spinal projections innervate all of
Rexed’s laminae and are most heavily concentrated in the superficial
sensory-related dorsal horn and the intermediolateral nucleus (IML). They
modulate sensory inputs and sympathetic drive, predominantly with
inhibitory action through D2 and especially D3 receptors (Clemens S et al,
2006). This theory was supported from some animal models which
disclosed that D3 receptor knockout (D3KO) mice are hyperactive and
manifest an increased wakefulness across the rest-activity cycle (Accili D et
al, 1996; Hue GE et al, 2003) and that locomotor activities were
significantly increased in A11-lesioned mice compared with controls (Ondo
WG et al, 2000; Qu S et al, 2007). A recent neuropathological study shows
no evidence of changes in the number and volume of TH (+) neurons,
neither atrophy nor hypertrophy nor gliosis in the A11 region in the
posterior hypothalamus of RLS patients compared with age-matched control
cases (Earley CJ et al, 2009). These results could support a functional
involvement rather than a degeneration of A11 region.

15
Iron metabolism The potential central role of iron metabolism involvement in RLS is
indicated primarily by those secondary forms of RLS in which iron
insufficiency is clear, but also from some limited pharmacological studies
which demonstrated that by using intravenous or oral iron, one could
markedly improve, if not resolve, RLS symptoms, even in those who
apparently had normal blood levels of iron (Nordlander NB, 1953; Earley
CJ et al, 2005; Wang J et al, 2009). Several studies showed a relation
between low ferritin concentrations and symptoms of the syndrome,
especially when ferritin was measured in the cerebrospinal fluid (CSF). This
link to the iron deficiency is particularly strong for early-onset RLS (Clardy
SL et al, 2006a). Studies on CSF showed decreased ferritin, elevated
transferrin and decreased pro-hepcidin (that interacts with the iron transport
protein ferroportin on the surface of cells) in patients with RLS (Clardy SL
et al, 2006b). Neuropathological studies found alterations of iron regulatory
proteins (decreased ferritin, divalent metal transporter 1, ferroportin,
transferrin receptor and increased hepcidin) in neuromelanin cells from
brains of patients (Connor JR et al, 2003 and 2004). Altered iron
metabolism was disclosed in lymphocytes from subjects with RLS (Earley
CJ et al, 2008). A recent pathological study showed that RLS substantia
nigra had more mitochondrial ferritin levels and less cytosolic H-ferritin
than control samples (Snyder AM et al, 2009). Reduced brain iron in RLS
patients is also suggested by the data of some MR studies that exploit the
effect of iron on T2, T2* and T2' (and associate parameters R2, R2* and
R2'), although with discrepant results. It has been well documented through
in vitro studies that paramagnetic iron will increase proportionally proton
transverse relaxation rates (R2=1/T2). Furthermore, ferritin and hemosiderin
are considered to be the only forms of nonheme iron present in sufficient
quantities to affect MR contrast in the human brain (Haacke EM et al,
2005). In two studies of the same group regional brain iron concentration
were assessed in RLS patients by R2' measurement, and the mean iron
content from the substantia nigra was significantly lower in the early-onset

16
RLS patients (< 45 years) and not in the late-onset (Allen RP et al, 2001;
Earley CJ et al, 2006). In a study performed in patients with late-onset RLS,
the T2 relaxation time was assessed separately for the two components of
the SN, and low iron content was found in the SN pars compacta (and not in
the pars reticolata) (Astrakas LG et al, 2008). Another group, without
differentiating between early-onset and late-onset, disclosed that mean T2
values of multiple regions were higher in RLS patients, though significantly
increased only in four regions (caudate head, thalamus medial, dorsal and
ventral); the mean T2 over all voxels was higher in patients, indicating a
multiregional (global) brain iron deficiency in RLS patients (Godau J et al,
2008). Also transcranial B-Mode sonography was used in RLS patients
which exhibited substantia nigra hypoechogenicity correlated inversely with
T2 values and interpreted as related to iron deficiency (Schmidauer C et al,
2005; Godau J et al, 2008).
These observations has led to a more general iron-dopamine model of RLS
and it has been suggested that dopaminergic dysfunction can be mediated by
low brain iron levels since iron is needed as a cofactor for tyrosine
hydroxylase (the rate limiting enzyme in the synthesis of dopamine),
because the D2 receptor is a protein containing iron, and because the
dopaminergic synaptic protein Thy-1 requires iron for its activity. Hence a
brain iron deficiency could lead to lowering dopamine production via
reduced tyrosine hydroxylase activity, down-regulation of dopamine type 2
receptors and destabilization of dopaminergic synapses (Allen RP, 2004;
Allen RP and Earley CJ, 2007).
In support of this hypothesis there are some animal models which reported
increase of wakefulness in the 4 hours preceding the resting phase of iron-
deficient mice (Dean T et al, 2006), increased locomotor activities in the
mice that were iron deprived, with a further significantly augmented activity
after combination of iron deprivation and A11 lesions (Qu S et al, 2007),
increased locomotor activities in the mice treated with iron-deficiency diet
(ID), which were reversed by the D2/D3 agonist ropinirole, and a

17
synergistic greater decrease of spinal cord D2 binding in mice underwent
both ID and 6-OHDA lesion of A11 region (Zhao H et al, 2007).
Finally BTBD9 gene recently associated to RLS and PLM, affects ferritin
level and iron storage (Winkelmann J et al, 2007b; Stefansson H et al, 2007;
Mignot E, 2007).

18
OBJECTIVES

19
This study was designed to evaluate RLS patients by multiple advanced MR
techniques in order to investigate three different aspects of the
pathophysiology of the disease:
1) To evaluate the presence of structural and/or microstructural
abnormalities in the brain of RLS patients using voxel-based
morphometry (VBM) and diffusion tensor imaging (DTI) analysis,
considering the contradictory data reported in previous studies
(Etgen T et al, 2005; Hornyak M et al, 2007; Celle S et al, 2009;
Unrath A et al, 2007 and 2008).
2) To investigate metabolic functions of the thalamus of RLS patients
using proton magnetic resonance spectroscopy (1H-MRS),
considering the possible involvement of this structure disclosed by
MRI (Bucher SF et al, 1997; Astrakas LG et al, 2008; Lee SJ et al,
2009; Unrath A et al, 2006) and PET studies (Cervenka S et al,
2006; von Spiczak S et al, 2005).
3) To evaluate brain iron content in RLS patients using phase imaging.
The primary hypothesis was that patients have low whole-brain iron
levels. Additionally certain regions previously suspected of low
iron concentrations were assessed separately (Allen RP et al, 2001;
Earley CJ et al, 2006; Astrakas LG et al, 2008; Godau J et al,
2008).
VBM VBM is an automated technique that assesses patterns of regional atrophy
on MRI between groups of subjects. Mainly and more accurately it
investigates voxel-wise changes in the grey matter volume/topography
rather than white matter. The procedure is relatively straightforward and
involves spatially normalizing high-resolution images from all the subjects
in the study into the same stereotactic space. This is followed by segmenting
the gray matter from the spatially normalized images and smoothing the
gray-matter segments. Voxel-wise parametric statistical tests which
compare the smoothed gray-matter images from the groups are performed.

20
Corrections for multiple comparisons are made using the theory of Gaussian
random fields (Ashburner J and Friston K, 2000). It is unbiased in that it
looks throughout the whole brain and does not require any a priori
assumptions concerning which structures to assess. This gives it a
significant advantage over more traditional region of interest (ROI) based
methods, which typically involve drawing around a structure of interest.
DTI Diffusion tensor imaging (DTI) is sensitive to water diffusion characteristics
(such as the principal diffusion direction and the diffusion anisotropy) and
has therefore been developed as a tool for investigating the local properties
and integrity of brain tissues, mainly at level of white matter tracts but also
at level of grey matter (Pierpaoli P et al, 1996). Post-processing of the
acquisitions allows the reconstruction of maps of the mean diffusivity (MD)
and of the white matter anisotropic properties, usually in terms of fractional
anisotropy (FA) (Mascalchi M et al, 2005). Neuronal and/or axonal loss is
typically characterised by increased MD and reduced FA, as modification of
brain tissue integrity reduces the barriers that restrict the movement of water
(Rizzo G et al, 2008; Agosta F et al, 2009). Maps of MD and FA may be
analysed using a ROIs approach to evaluate single structures, using a
histogram approach to evaluate greater portions of the brain or whole brain
and using voxel-wise analyses for an unbiased approach. We utilised all
three approaches. For the voxel-wise analyses we used tract-based spatial
statistics (TBSS), which aims to solve crucial issues of cross-subject data
alignment, allowing localized cross-subject statistical analysis (avoiding the
arbitrariness of the choice of spatial smoothing extent), using the ‘‘mean FA
skeleton’’ approach (Smith SM et al, 2006 and 2007).
1H-MRS Magnetic resonance spectroscopy (MRS) is a noninvasive method that
permits measurement of the concentration of specific biochemical
compounds in the brain and other organ systems in precisely defined regions

21
guided by MR imaging. With MR spectroscopy we can measure spectra of
many biologically interesting isotopes. In vivo biomedical applications are
mainly focused on proton (1H), phosphorus (31P) and carbon (13C) isotopes
(Hajek M et al, 2008). The most used in clinical practice is 1H MRS. At
long echo-time (TE) 1H MRS can detect N-acetyl-aspartate containing
compounds, choline containing compounds, creatine-phosphocreatine and
lactate. At short TE, lipids, tryglicerides, glutamate, glutamine, scyllo-
inositol, glucose, myo-inositol, are visible (Bonavita S et al, 1999). The
most relevant metabolites in neurological studies are probably N-acetyl-
aspartate (NAA), a neuronal marker (Kantarci K et al, 2008), and myo-
inositol (mI) a glial marker (Brand A et al, 1993). 1H MRS can be
performed with single-voxel, multivoxel, single slice and multislice
techniques. This technique can be useful in the study a number of central
nervous system disorders such as epilepsy, brain tumors, stroke, multiple
sclerosis, degenerative disorders (identification of microscopic pathology
not visible with MRI) and metabolic diseases (metabolic disturbances with
specific metabolic patterns) (Lodi R et al, 2009; Bonavita S et al, 1999).
Phase imaging This is a new neuroimaging technique (a part of susceptibility-weighted
imaging, SWI), which uses tissue magnetic susceptibility differences to
generate a unique contrast, different from that of spin density, T1, T2, and
T2* (Haacke EM et al, 2009). It measures the phase shifts in gradient-echo
images. It seems a very sensitive tool to quantify the iron content of the
brain (Ogg RJ et al, 1999). Furthermore, while R1 (1/T1) and R2 (1/T2) can
be reversible depending on the water content and other local structural
changes that can affect relaxation times (in these cases, the effect of iron
remains invisible), this is not true for R2’ (R2’=R2*-R2) or phase (Haacke
EM et al, 2005). Tissue containing (paramagnetic) iron exhibits a negative
phase in complex images compared to immediately adjacent tissue, which
will have an increased phase. Phase imaging allows a qualitative evaluation
based on the unique contrast resulting in the images and a quantitative

22
analysis based on the evaluation of local phase differences (measured in
radians).

23
METHODS

24
Setting, timing and subjects
A total of 25 patients (age 52±10, mean ± SD; 10 males and 15 females)
(Table 1) were recruited by Sleep Medicine Centre of the Department of
Neurological Science of Bologna University and they were studied by MR
in the MR Spectroscopy Unit of the Department of Internal Medicine,
Aging and Nephrology of Bologna University, from January 2007 to May
2009. The patients will satisfy the revised criteria of IRLSSG (Allen RP et
al, 2003). Secondary forms of RLS were excluded by exploring a detailed
history, by objective evaluation and using laboratory analyses such as
hemoglobin, iron, ferritin, tranferrin, creatinine, urea and liver enzymes. The
severity of RLS was assessed on the day of scan using the IRLSSG rating
scale (Walters AS et al, 2003).
We have studied also 22 healthy control subjects (age 49±16, mean ± SD;
14 males and 8 females).
All control subjects were interviewed by a Sleep Medicine expert in order to
exclude symptoms suggesting RLS and other neurological disorders. Both
patients and controls gave written informed consent. Both patients and
controls not always underwent the complete MR protocol because of time or
technical problems. So the studied samples differ among the different
protocols.
MR protocols
Subjects were studied in a 1.5 Tesla GE Signa Horizon LX system equipped
with a birdcage head radio-frequency coil for signal reception and an
EchoSpeed gradient system providing a maximum gradient strength of 22
mT/m and maximum slew rate of 120 mT/m/ms (Figure 1).
1) Structural and microstructural analysis

25
VBM
Data acquisition. A conventional T1-weighted (T1W) axial volumetric
image was acquired using the FSPGR sequence TI=600 ms; TE=5.1 ms;
TR=12.5 ms; 25.6 cm square FOV, 1 mm slice thickness; in-plane
resolution=256x256.
Data analysis. Structural data was analysed with FSL-VBM, a voxel-
based morphometry style analysis (Ashburner J and Friston K, 2000)
carried out with FSL tools (Smith SM et al, 2004) (Figure 2). First,
structural images were brain-extracted using BET (Smith SM et al,
2002). Next, tissue-type segmentation was carried out using FAST4
(Zhang Y et al, 2001). The resulting grey-matter partial volume images
were then aligned to Montreal Neurological Institute MNI152 standard
space using the affine registration tool FLIRT (Jenkinson M et al, 2002],
followed by nonlinear registration using FNIRT
(www.fmrib.ox.ac.uk/fsl), which uses a b-spline representation of the
registration warp field (Rueckert D et al, 1999). The resulting images
were averaged to create a study-specific template, to which the native
grey matter images were then non-linearly re-registered. The registered
partial volume images were then modulated (to correct for local
expansion or contraction) by dividing by the Jacobian of the warp field.
The modulated segmented images were then smoothed with an isotropic
Gaussian kernel with a sigma of 3 mm. Finally, voxelwise GLM was
applied using permutation-based non-parametric testing, correcting for
multiple comparisons across space, using the program Glm
(www.fmrib.ox.ac.uk/fsl), applying threshold-free cluster enhancement.
Sex and age were introduced as covariates. Thresholds for significance
level were set at P<0.01.
DTI: ROI/histogram analyses and TBSS
Acquisition. Axial DTI SE-EPI images were obtained (slice thickness = 5
mm, inter-slice gap = 0 mm) using a single-shot EPI sequence with α =
90º, TE=89.2 ms; TR=10 s; 32 cm2 FOV, in-plane resolution=192x192,

26
NEX=1, and phase encoding in right-left direction. Six directions-
encoding gradients were applied with gradient strengths corresponding to
b-values 900 s/mm2. In addition, images without diffusion weighting
were acquired, corresponding to b = 0 s/mm2 and exhibiting T2-contrast.
Data preprocessing. Distortions in the DTI-EPI images due to gradient-
induced eddy currents were corrected by slice-wise registration of the DT
images onto the T2-weighted EPI image using the image registration
software FLIRT (www.fmrib.ox.ac.uk/fsl). Due to the nature of the
distortions, the degrees of freedom were restricted to translation, scaling,
and shearing along the phase encoding direction (Haselgrove et al, 1996).
Mean diffusivity (MD) and fractional anisotropy (FA) were determined
pixel-wise using a least-squares fit using the program DTIFIT
(www.fmrib.ox.ac.uk/fsl). In order to avoid contamination of the MD
values for grey and white matter by the much higher values of cerebral
spinal fluid (CSF) during further evaluation, pixels containing CSF were
masked from the MD map. This was accomplished using the FAST
algorithm (www.fmrib.ox.ac.uk/fsl) for a two-class segmentation based
on the corresponding T2-weighted EPI images (Figure 3).
Manual ROI and histogram analyses. Regions of interest (ROIs) were
selected manually on T2-weighted EPI images. ROIs were defined to
include medulla, pons, left and right middle cerebellar peduncle (MCP),
superior cerebellar peduncle (SCP), dentate nucleus, cerebellar white
matter, thalamus, caudate, putamen, pallidus, pyramidal tract at the level
of the posterior limb of internal capsule (PLIC), frontal and parietal white
matter, optic radiation and corpus callosum (genu and splenium) (Figure
4-A). Cerebral cortical ROIs were not selected, because substantial
partial volume effects from subcortical white matter and CSF could not
be completely avoided. For a global evaluation of brain MD values,
including cortical areas, histograms of MD were generated for all pixels
in the sovratentorial and infratentorial compartment (Figure 4-B/C). As
previously described (Martinelli et al, 2007) infratentorial compartment
histograms of MD were also generated separately for areas corresponding

27
to brainstem, vermis, and cerebellar hemispheres determined by manual
segmentation (Figure 4-D). The asymmetry of the MD distribution was
assessed by finding the 50th percentile values (medians) along with the
mean (Rizzo et al, 2008) (Figure 4-E). Parametric tests were used as
Kolmogorov–Smirnov testing showed that means and median values
were normally distributed. The Student T test was used to evaluate
differences among two groups and Pearson test to evaluate correlations,
correcting for multiple comparisons. P values less than 0.05 were
accepted as statistically significant.
Tract-based analysis. Voxel-wise statistical analysis of the FA data was
carried out using TBSS (Tract-Based Spatial Statistics) (Smith SM et al,
2006), part of FSL (Smith SM et al, 2004). First, FA images were created
as described in the paragraph 'Data pre-processing'. All subjects' FA data
were then aligned into a common space using the nonlinear registration
tool FNIRT (www.fmrib.ox.ac.uk/fsl), which uses a b-spline
representation of the registration warp field (Rueckert D et al, 1999).
Next, the mean FA image was created and thinned to create a mean FA
skeleton which represents the centres of all tracts common to the group.
Each subject's aligned FA data was then projected onto this skeleton and
the resulting data fed into voxelwise cross-subject statistics, correcting
for multiple comparisons, using the program Glm
(www.fmrib.ox.ac.uk/fsl). Subjects' age and sex were considered
nuisance variables whose effect was removed from the final group
comparisons. Thresholds for significant level were set at P<0.01 (Figure
5).
Automatic segmentations
Automatic segmentation of the volumetric T1W image was performed
using FIRST (www.fmrib.ox.ac.uk/fsl) to bilaterally define seven
subcortical gray matter structures (thalamus, putamen, caudate, pallidus,
accumbens, hippocampus and amygdala) (Figure 6). In addition, frontal,
parietal, temporal and occipital lobes, brainstem and cerebellum were

28
defined using the MNI152 template. Within these regions gray matter
was defined using a three-class segmentation of the T1W images. All
structures were registered onto the DTI maps in two steps using FLIRT
(www.fmrib.ox.ac.uk/fsl). White matter partial volume on DTI images
was masked by registering the MNI FA template onto subjects’ own FA
map using non-linear registration. Deep gray structures were identified
by warping the Harvard-Oxford sub-cortical structure atlas (also defined
in MNI coordinate space). A mask excluding CSF was generated from a
three-class segmentation of the T2-weighted image volume. ROIs of all
deep gray and cortical structures was defined in the DTI space by fusing
registered FIRST, Harvard-Oxford, and CSF and WM exclusion masks
(Figure 7). For each, volumes and median MD values were calculated.
Cortical and subcortical volumes were separately corrected for subject
age and total brain volume, MD values for age only. Statistical analyses
were performed using SPSS 15.0 for Windows. Parametric tests were
used as Kolmogorov-Smirnov testing showed that the variables were
normally distributed. The Student T test was used to evaluate differences
among two groups. For correlations we used the Pearson test. The
Bonferroni correction was applied to correct for multiple comparisons.
Only P values less than 0.05 were accepted as statistically significant.
2) 1H-MRS
Data acquisition. Proton magnetic resonance spectroscopy (1H-MRS)
study was performed. Single voxel 1H-MRS spectra were acquired using
the PRESS sequence. The water signal was suppressed by the CHESS
(Chemical Shift Selective) sequence. A spectrum at short echo-time (TE
= 35ms; TR = 4 s; number of acquisitions = 128) was acquired in the
medial region of the thalamus (volume 4.0 to 5.0 cm3) (Figure 8).
Data analysis. Peak integrals for N-acetyl-aspartate (NAA), creatine-
phosphocreatine (Cr), choline-containing compounds (Cho), and myo-
inositol (mI) were calculated using the operator-independent fitting

29
program LCModel using standard basis sets (Provencher SW, 1993).
Peak integral values were expressed relative to Cr. The exclusion
criterion for metabolite evaluation was an LCModel estimated fitting
error greater than 20%, this being a reliable indicator of poor quality
spectra. Statistical analyses were performed using SPSS 15.0 for
Windows. Parametric tests were used as Kolmogorov–Smirnov testing
showed that the variables were normally distributed. The Student T test
was used to evaluate differences among two groups. For correlations we
used the Pearson test. For all analyses, only P values less than 0.05 were
accepted as statistically significant.
3) Phase imaging
Data acquisition. Anatomical imaging was performed by a T2-weighted
(T2W) FSE sequence in an axial oblique plane, using acquisition
parameters: α=90º; echo time (TE): 107 ms; repetition time (TR): 5080
ms; square FOV: 24 cm; acquisition matrix 320×256; reconstructed in-
plane resolution: 0.938 mm; slice thickness; 4 mm w/o gap. # slices
variable to cover whole head. NEX: 2. Phase-sensitized images were
acquired using a gradient echo sequence, and preserving both real and
imaginary channels. Slice locations matched those of the anatomical
scan, excluding slices above the central corpus callosum, and below the
dentate nucleus. Acquisition parameters: TE/TR: 40/60 ms; acquisition
matrix 512×256; reconstructed in-plane resolution: 0.938 mm; NEX 2;
bandwidth 15.6 kHz; maximum acquisition time 7’06”.
Data analysis. Following the published method (Ogg RJ et al, 1999) data
were high pass filtered by multiplication with a filter function in k-space,
using tools provided by FSL (FMRIB; U Oxford) and AFNI (NIMH,
NIH; Bethesda MD), and a phase map prepared using the filtered data.
T2W data were registered onto the gradient echo data using FLIRT (FSL)
(Figure 9). Whole brain regions of interest were selected automatically

30
by thresholding T2W data, and excluding pixels whose local filtered
phase dispersion exceeded a second threshold (indicating low
signal:noise) (Figure 10). Regions of interest were selected in two ways:
structures known to accumulate iron (dentate and red nucleus, substantia
nigra, basal ganglia) were manually segmented using both phase maps
and T2W images (Figure 11). For whole brain ROIs, the 10th, 50th and
90th percentile of the filtered phase histogram were calculated, while for
local ROIs, 25th and 50th percentiles only, as these contained mainly
negative phase. For each percentile score, patients and control groups
were compared using the Mann-Whitney U test, and correlation with
demographic and clinical parameters used the Spearman test. The
Bonferroni correction was applied to correct for multiple comparisons.
Statistical analyses will be performed using with SPSS 15.0 for
Windows, assuming a significant P-value <0.05.

31
RESULTS

32
Structural and microstructural analysis
Subjects 22 patients (age 50±9, mean±SD; 7 males and 15 females) and 22 healthy
controls (age 49±16, mean ± SD; 14 males and 8 females) were studied.
Mean values and standard deviations of age at onset, disease duration and
IRLSSG score in RLS patients were 41±12 years, 9±8 years and 22±7
respectively. 14 patients never took therapy and 8 patients receiving
dopaminergic therapy were free from drugs from at least 2 weeks before
scan. 8 patients had a family history of RLS (Table 2).
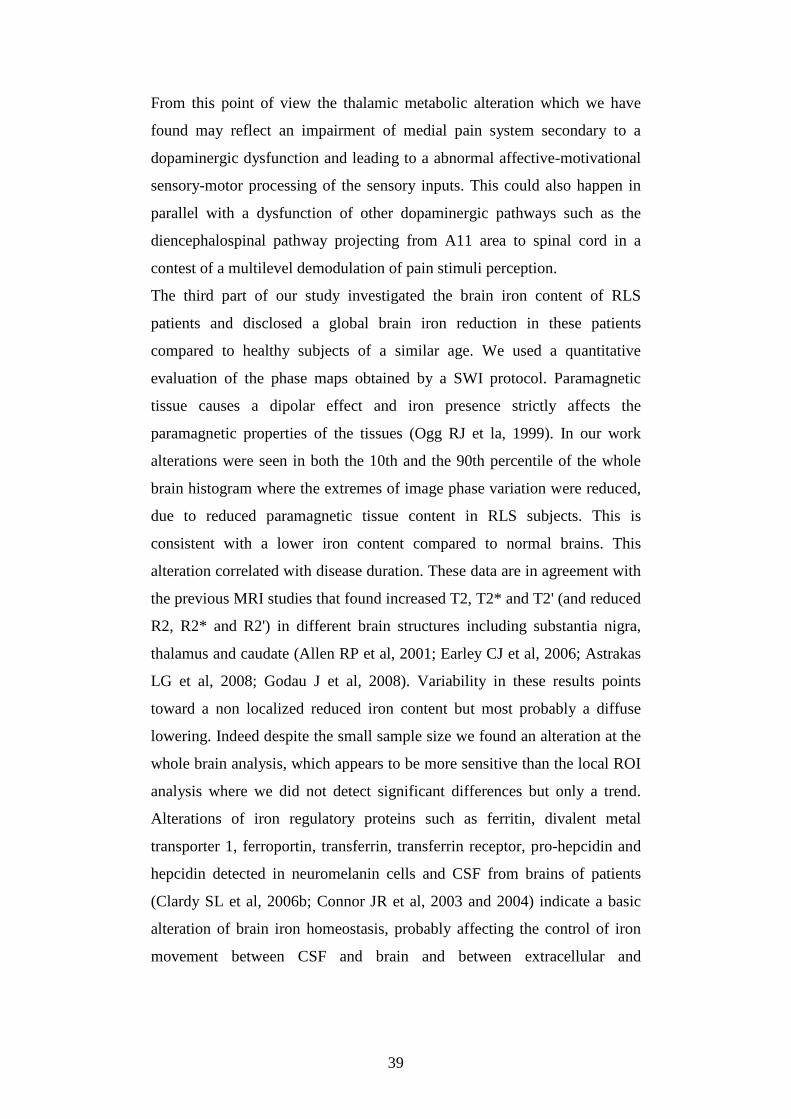
MR data VBM
No significant difference in volume or density was found in any brain
area. The lack of differences still remains when age and sex were
introduced as a cofactor (Figure 12).
DTI
For all ROIs selected MD and FA values in RLS patients were not
significantly different from controls (Table 3). Similarly, the histograms
of MD and FA in the whole sovratentorial and infratentorial
compartment and in the brainstem, vermis, and cerebellar hemispheres
singly were virtually identical for the two groups and no significant
differences were observed at level of median MD values (Table 3).
TBSS group comparison revealed no difference in MD and FA of any
brain area between two groups. The lack of differences still remains
when age and sex were introduced as a cofactor (Figure 13).
Automatic segmentation
No significant difference in volume or MD values was disclosed in any
segmented structures. (Table 4)

33
1H-MRS
Subjects 25 patients (age 52±10, mean±SD; 10 males and 15 females) and 18
healthy controls (age 51±16, mean ± SD; 11 males and 7 females) were
studied Mean values and standard deviations of age at onset, disease
duration and IRLSSG score in RLS patients were 43±13 years, 9±8 years
and 22±7 respectively. 16 patients never took therapy and 9 patients
receiving dopaminergic therapy were free from drugs from at least 2
weeks before scan. 9 patients had a family history of RLS (Table 5).
MR data The NAA/Cr and Cho/Cr ratios were significantly lower in the medial
thalamus of RLS patients compared with the healthy controls (Table 6,
Figures 14 and 15). We did not detect statistical differences in the other
ratios. The reduction of the NAA/Cr and Cho/Cr ratios in the thalamus of
the patients did not correlate with the clinical variables considered (age,
age at onset, disease duration, IRLSSG rating scale for symptoms
severity).
Phase imaging
Subjects 11 patients (age 54±11, mean±SD; 2 males and 9 females) and 11 healthy
controls (age 51±18, mean ± SD; 6 males and 5 females) were studied
Mean values and standard deviations of age at onset, disease duration and
IRLSSG score in RLS patients were 48±11 years, 6±3 years and 21±9

34
respectively. 8 patients never took therapy and 3 patients receiving
dopaminergic therapy were free from drugs from at least 2 weeks before
scan. 5 patients had a family history of RLS (Table 7).
MR data In the whole brain analysis, RLS patients showed lower phase dispersion,
characterized by 10th and 90th percentile radians values of significantly
smaller magnitude than in controls (respectively p=0.01 and p=0.02),
while the median was no different (Table 8 and Figure 16). In the
localized ROIs, differences were not significant although there was a
trend of more negative radians values, prevalently in red nucleus and
substantia nigra (Table 8). The 10th percentile of whole brain phase in
RLS patients correlated with disease duration (r=0.60, p=0.04) (Figure
17), but not with IRLSSG rating scale or other clinical/demographic
parameters.

35
DISCUSSION

36
In this study we have used advanced MR techniques to investigate various
aspects of RLS pathophysiology. Firstly, we used a multimodal approach to
evaluate the possible presence of structural and/or microstructural
abnormalities in terms of volume and/or DTI parameters alterations using
ROI/istogram analysis, VBM, TBSS and automatic segmentations of brain
structures. Neither volume or MD or FA pathological changes were found
in any brain structures of RLS patients. Regarding four previous VBM
studies (Etgen T et al, 2005; Unrath A et al, 2007; Hornyak M et al, 2007;
Celle S et al, 2009) our data are in accord only with the most recent one
which found a lack of specific grey matter alterations in RLS patients (Celle
S et al, 2009). Discrepancies with other studies might on the one hand be
explained by methodological differences, since the first study, detecting
increasing pulvinar grey matter, was performed by use of the classical VBM
technique (Etgen T et al, 2005). All other studies, including our, used the
optimised VBM protocol (Good CD et al, 2001). Differently from previous
studies, our study used the software FSL-VBM instead of SPM, although
the two software packages seem to give similar results (Battaglini M et al,
2009). For example Cell et al found results very similar to ours, using SPM.
Another important note regarding the first two VBM works is that in neither
study did the results survive a correction for multiple comparisons (Etgen T
et al, 2005; Unrath A et al, 2007).
Methodological differences are also present between our and a previous DTI
analysis (Unrath A et al, 2008), which disclosed an FA reduction in the
sensori-motor cortical regions not confirmed in our study. Indeed, Unrath et
al used standard registration algorithms that didn’t give a satisfactory
solution to the question of how to align FA images from multiple subjects
with an arbitrariness of the choice of spatial smoothing extent. We have
chosen to used TBSS, which resolves these issues by using the ‘‘mean FA
skeleton’’ approach (Smith SM et al, 2006 and 2007). Lack of any MD or
FA abnormalities was confirmed by the ROI and histogram analysis.
Furthermore for the first time in RLS patients we evaluated volume and DTI

37
parameters at level of cortical and subcortical areas using automatic
segmentation and again no pathological changes were present.
On the other hand, these technical aspects alone might not be sufficient to
explain the different results among different studies. The heterogeneity in
terms of size and clinical features of the studied samples could be a
considerable factor. The presence of medical treatment, such as
dopaminergic agents, is an important issue, because these are known to
affect the morphology of cerebral structures (Corson PW et al, 1999). In
some studies (Etgen T et al, 2005; Unrath A et al, 2007 and 2008) almost all
the patients were on treatment, but not in all cases (Hornyak M et al, 2007;
Celle S et al, 2009). In our sample most patients (n=16) never took therapy.
In the remaining 9 patients treated with dopaminergic drugs, treatment was
stopped for at least 2 weeks before scan. Other possible differences among
the studies would regard the severity of symptoms, the percentage of family
history, and the co-occurrence of other sleep disorders. Finally the possible
heterogeneity of RLS itself might be reflected in the different results.
Overall our VBM and DTI data argue against clear
structural/microstructural abnormalities in the brain of patients with
idiopathic RLS.
The second part of our study focused on thalamic involvement. Using 1H-
MRS we detected metabolic changes in the medial region of the thalamus.
This region is a part of the medial nociceptive system. This system projects
through medial and intralaminar nuclei of the thalamus to several cortical
and limbic regions: frontal and insular cortices and anterior cingulate gyrus.
It is thought to mediate affective-motivational aspects of pain such as
emotional reactions, arousal and attention to the stimulus, as well as the
drive to escape from the noxious stimuli (Treede RD et al, 1999; Price DD,
2000). An activation of these brain structures during pain perception has
been confirmed by PET and fMRI studies (Apkarian AV et al, 2005).
H2[15O] PET (San Pedro EC et al, 1998) and fMRI (Bucher SF et al, 1997;
Astrakas LG et al, 2008) found similar brain activation in RLS patients. A
PET study with [11C]diprenorphine, a non-selective opioid receptor

38
radioligand, disclosed regional negative correlations between ligand binding
and RLS severity in areas serving the medial pain system (medial thalamus,
amygdala, caudate nucleus, anterior cingulate gyrus, insular cortex and
orbitofrontal cortex) (von Spiczak S et al, 2005). Another PET study which
used the high-affinity D2-receptors radioligands [11C]FLB 457 reported a
higher thalamic binding potential in RLS patients than in controls, at the
level of the medial and posterior portions, other than at the level of limbic
and associative part of striatum, anterior cingulate cortex and insulae,
suggesting again an involvement of the medial pain system (Cervenka S et
al, 2006). Neurophysiological studies have shown an impairment of pain
and temperature perception in idiopathic RLS, with an absence of peripheral
nerve fibre damage suggesting a functional impairment of central
somatosensory processing (Stiasny-Kolster K et al, 2004; Schattschneider J
et al, 2004; Tyvaert L et al, 2009b). Interestingly one study has disclosed
increased ratings of pin-prick pain in untreated RLS patients indicating
static hyperalgesia that was more pronounced in the lower limb and reversed
by long-term dopaminergic treatment (Stiasny-Kolster K et al, 2004).
Our MR spectroscopic data confirm a thalamic involvement in RLS
patients, presumably not due to degenerative changes given that none were
detected by VBM and DTI studies (see above). This abnormality could be
an epiphenomenon in the pathophysiology of RLS, in terms of metabolic
dysfunction secondary to discomfort perception. But it is also possible that
the involvement of the medial portion of the thalamus could have a primary
role, because its function is modulated by dopaminergic afferents. Indeed,
an extensive mesothalamic and nigrothalamic system originates as
collaterals from A8-A9-A10 neurons (Freeman A et al, 2001). Thus, DA
axons directly innervate thalamic components of several parallel,
functionally unique, basal ganglia-thalamocortical loops as follows: motor
(ventrolateral; VL), ‘prefrontal’ (parvocellular ventroanterior; VApc), and
‘limbic’ (mediodorsal; MD) in non-human primates and humans (Rye DB,
2004).
39
From this point of view the thalamic metabolic alteration which we have
found may reflect an impairment of medial pain system secondary to a
dopaminergic dysfunction and leading to a abnormal affective-motivational
sensory-motor processing of the sensory inputs. This could also happen in
parallel with a dysfunction of other dopaminergic pathways such as the
diencephalospinal pathway projecting from A11 area to spinal cord in a
contest of a multilevel demodulation of pain stimuli perception.
The third part of our study investigated the brain iron content of RLS
patients and disclosed a global brain iron reduction in these patients
compared to healthy subjects of a similar age. We used a quantitative
evaluation of the phase maps obtained by a SWI protocol. Paramagnetic
tissue causes a dipolar effect and iron presence strictly affects the
paramagnetic properties of the tissues (Ogg RJ et la, 1999). In our work
alterations were seen in both the 10th and the 90th percentile of the whole
brain histogram where the extremes of image phase variation were reduced,
due to reduced paramagnetic tissue content in RLS subjects. This is
consistent with a lower iron content compared to normal brains. This
alteration correlated with disease duration. These data are in agreement with
the previous MRI studies that found increased T2, T2* and T2' (and reduced
R2, R2* and R2') in different brain structures including substantia nigra,
thalamus and caudate (Allen RP et al, 2001; Earley CJ et al, 2006; Astrakas
LG et al, 2008; Godau J et al, 2008). Variability in these results points
toward a non localized reduced iron content but most probably a diffuse
lowering. Indeed despite the small sample size we found an alteration at the
whole brain analysis, which appears to be more sensitive than the local ROI
analysis where we did not detect significant differences but only a trend.
Alterations of iron regulatory proteins such as ferritin, divalent metal
transporter 1, ferroportin, transferrin, transferrin receptor, pro-hepcidin and
hepcidin detected in neuromelanin cells and CSF from brains of patients
(Clardy SL et al, 2006b; Connor JR et al, 2003 and 2004) indicate a basic
alteration of brain iron homeostasis, probably affecting the control of iron
movement between CSF and brain and between extracellular and

40
intracellular compartments. Iron deficiency should impair the function of
some cerebral systems more than others, notably the dopaminergic system,
because of the strong connection between dopamine and iron (Allen RP,
2004; Allen RP and Earley CJ, 2007). Under this hypothesis, an
involvement of all the various dopaminergic pathways could be present at a
subclinical level, but only that of networks implicated in sensori-motor
integration and pain processing would be clearly evident at clinical level,
either because of a further major susceptibility to iron deficiency in neurons
in this network, or because of differences in the threshold of perceptibility
of the dysfunction (sensory dysfunction through pain system rather than
motor impairment through nigrostriatal system for example).
A methodological consideration coming from our study is that the histogram
analysis of the phase maps is a very sensitive tool to evaluate brain iron
content and is also far less operator dependent. This suggests that this
imaging protocol may also be useful in all types of neurological disease
characterized by a pathological increase of iron accumulation, primary
(neurodegeneration with brain iron accumulation) or secondary
(neurodegenerative diseases), as a biomarker of disease progression and for
assessment of pharmacological interventions with chelating drugs.
In summary, putting together the results of all the different MR protocols
adopted in this study, we can support a pathophysiological model of RLS
which is consistent with low brain iron content in the brains of these
patients. The iron deficiency may lead to a functional impairment, in the
absence of structural and/or microstructural abnormalities. Via
dopaminergic dysfunction, this functional impairment affects the central
mechanisms of sensori-motor integration and pain processing involving a
number of brain structures including the medial thalamus (part of medial
pain system).

41
TABLES AND FIGURES

42
Table 1. Patients recruited for MR studies. All patients performed the 1H-
MRS study. *=performed structural-microstructural study. #=performed
phase imaging study.
DA drugs = dopaminergic drugs; IRLSSGRS = International Restless Legs Syndrome
Study Group Rating Scale
Patients Age (y) Sex Age at
onset (y)
Disease
length (y) Therapy
Family
history
IRLSSGRS
score
1* 48 M 45 3 / No 22
2* 49 F 39 10 / No 21
3* 46 M 15 31 DA drugs Yes 26
4* 43 F 40 3 / No 24
5* 43 F 35 8 / No 26
6* 55 F 48 7 / No 23
7* 43 F 19 24 DA drugs No 25
8* 56 M 40 16 DA drugs Yes 21
9* 31 M 30 1 / Yes 22
10* 50 F 24 26 DA drugs No 26
11 66 M 59 7 DA drugs Yes 28
12* 50 M 49 1 / No 8
13* 58 M 56 2 DA drugs No 24
14* 67 M 57 10 / No 20
15*# 65 F 58 7 / Yes 24
16*# 50 F 40 10 DA drugs No 24
17# 58 M 54 4 / No 22
18# 69 F 66 3 / No 10
19*# 56 M 51 5 DA drugs No 30
20*# 48 F 38 10 / No 28
21*# 49 F 45 4 / Yes 9
22*# 45 F 40 5 / No 12
23*# 31 F 25 6 / Yes 11
24*# 62 F 50 12 DA drugs Yes 35
25*# 61 F 57 4 / Yes 21
Mean 52 43 9 9/16 9/16 22
SD 10 13 8 / / 7

43
Figure 1. 1.5 Tesla GE Signa Horizon LX system equipped with a birdcage
head radio-frequency coil for signal reception.
Figure 2. Schematic illustration of methodological steps of FSL-VBM
(from www.fmrib.ox.ac.uk/fsl). A: Original T1-weighted volumetric
images; B: Segmented grey matter partial volume; C: spatially smoothed
grey matter partial volume; D: Regions of significant group difference in
GM volume (colour) superimposed on template T1-weighted image.
A B C
D

44
Figure 3. Schematic illustration of preprocessing of DTI images for FA/MD
analysis. A: DTI image. B: T2W image. C: MD map. D: First eigenvector
map weighted by FA.
Figure 4. A: Example of manual segmentation of ROIs. B-D: manual
segmentation of whole left and right hemispheres (B), whole infratentorial
compartment (C) and of the areas corresponding to brainstem, vermis, and
cerebellar hemispheres separately for histogram analysis (D). E: example of
cerebral hemisphere histograms in a healthy control.

45
Figure 5. Schematic illustration of methodological steps of TBSS (from
www.fmrib.ox.ac.uk/fsl).
Figure 6. Example of three dimensional projection of automatically
generated subcortical structures (colour) onto T1-weighted volumetric
image (greyscale).

46
Figure 7. Data pipeline to create automatic ROIs.
Figure 8. Localization of medial thalamic VOI (volume of interest) for 1H-
MRS study (A) and example of spectrum (B) in a control subject. NAA =
N-acetyl-aspartate; Cr = creatine-phosphocreatine; Cho = choline-
containing compounds; mI = myo-inositol.

47
Figure 9. Schematic illustration of preprocessing of phase images. A-B: real
and imaginary images; C-D: Low pass filtered images; E: phase map; F-H:
details of iron-rich structures (F: basal ganglia, G: substantia nigra and red
necluei, H: dentate nuclei).
Figure 10. Whole brain ROI (A) and derived phase histogram from a
healthy control (B).
A B C D
E F G
H

48
Figure 11. Manual segmentation of ROIs at level of iron-rich structures (A:
basal ganglia, B: substantia nigra and red necluei, C: dentate nuclei).
Table 2. Clinical data of the RLS patients and controls of the
structural/microstructural study.
Subjects
(N)
Age
(years)
Sex
(M/F)
Age at
onset
(years)
Disease
duration
(years)
IRLSSG
score
Therapy
(DA
drugs)
(N)
Positive
family
history
(N)
RLS
patients
(22)
50±9 7/15 41±12 9±8 22±7 8 (36%) 8 (36%)
Healthy
controls
(22)
49±16 14/8 / / / / /
M, male; F, female; DA drugs = Dopaminergic drugs; IRLSSGRS = International Restless
Legs Syndrome Study Group Rating Scale. All data are given as mean ± SD.
49
Figure 12. VBM analysis disclosed no differences between two groups.
Thresholds for significance level were set at P<0.01 after correction for
multiple comparisons across space, and applying threshold-free cluster
enhancement.

50
Table 3. MD and FA values for control and RLS groups by ROI and
histogram analysis of DTI images.
*Student T test (a P-value of <0.05 after correction for multiple comparisons was
considered to be significant). MD= Mean diffusivity; FA= Fractional anisotropy. # = Mean
of the left and right values. ## = Mean of the genu and splenium. All data are given as mean
± SD.
ROIs
MD (x10-3 mm2/s) FA
P* Controls RLS patients Controls RLS patients
Mean values Medulla 0.84±0.07 0.86±0.08 0.46±0.12 0.44±0.10 n.s. Dentate nucleus# 0.69±0.06 0.74±0.06 0.34±0.07 0.31±0.07 n.s. Pons 0.87±0.06 0.91±0.05 0.43±0.07 0.47±0.08 n.s. Middle cerebellar peduncle# 0.74±0.06 0.78±0.05 0.60±0.04 0.57±0.07 n.s. Superior cerebellar peduncle# 0.69±0.03 0.69±0.05 0.48±0.10 0.43±0.10 n.s. Cerebellar white matter# 0.81±0.04 0.77±0.06 0.67±0.07 0.69±0.06 n.s. Posterior limb of internal capsule# 0.69±0.03 0.71±0.03 0.68±0.04 0.52±0.07 n.s. Thalamus# 0.78±0.02 0.78±0.05 0.32±0.02 0.70±0.04 n.s. Putamen# 0.75±0.02 0.75±0.02 0.24±0.03 0.33±0.03 n.s. Globus pallidus# 0.73±0.03 0.75±0.04 0.38±0.04 0.23±0.03 n.s. Caudate# 0.79±0.03 0.80±0.03 0.24±0.03 0.38±0.04 n.s. Parietal white matter# 0.85±0.07 0.84±0.06 0.39±0.07 0.22±0.02 n.s. Frontal white matter# 0.78±0-04 0.76±0.03 0.29±0.04 0.41±0.05 n.s. Corpus callosum## 0.82±0-05 0.83±0.04 0.76±0.03 0.29±0.04 n.s. Optic radiation# 0.83±0.04 0.83±0.03 0.55±0.04 0.76±0.05 n.s.
Median values Sovratentorial compartment 0.89±0.05 0.86±0.03 0.23±0.02 0.24±0.02 n.s. Infratentorial compartment 0.87±0.05 0.87±0.05 0.29±0.04 0.31±0.04 n.s. Brainstem 0.90±0.05 0.87±0.05 0.44±0.04 0.45±0.02 n.s. Vermis 0.98±0.11 0.96±0.07 0.23±0.03 0.24±0.04 n.s. Cerebellar hemispheres 0.81±0.03 0.83±0.05 0.29±0.05 0.30±0.05 n.s.

51
Figure 13. TBSS analysis of DTI images disclosed no differences between
two groups. Thresholds for significance level were set at P<0.01 after
correction for multiple comparisons across space, and applying threshold-
free cluster enhancement.

52
Table 4. MD values and volumes for control and RLS groups selected by
automatic ROI segmentation.
Volume (mm3)
Controls RLS patients P*
Mean ±SD Mean ±SD Occipital lobe# 101259 12651 98645 9738 n.s.
Parietal lobe# 149318 15213 148619 14795 n.s. Temporal lobe# 141164 11859 140741 15285 n.s.
Frontal lobe# 239190 26608 239435 23835 n.s. Caudate# 7199 708 6712 819 n.s. Pallidus# 3572 447 3450 391 n.s. Putamen# 9680 1315 9441 926 n.s.
Thalamus# 15572 1829 14862 1333 n.s. Accumbens# 1033 185 1101 156 n.s.
Hippocampus# 7822 1077 7633 518 n.s. Amygdala# 2775 389 2630 474 n.s. Brainstem 23566 2804 21650 9455 n.s.
Cerebellum 110160 11203 104524 10450 n.s. MD (x10-3 mm2/s)
Controls RLS patients P*
Mean ±SD Mean ±SD Occipital lobe# 0,84 0,04 0,81 0,03 n.s.
Parietal lobe# 0,79 0,04 0,77 0,03 n.s. Temporal lobe# 0,85 0,03 0,83 0,02 n.s.
Frontal lobe# 0,80 0,04 0,79 0,02 n.s. Caudate# 0,77 0,02 0,80 0,02 n.s. Pallidus# 0,77 0,06 0,76 0,02 n.s. Putamen# 0,75 0,02 0,74 0,02 n.s.
Thalamus# 0,79 0,05 0,78 0,04 n.s. Accumbens# 0,80 0,05 0,80 0,03 n.s.
Hippocampus# 0,92 0,04 0,91 0,04 n.s. Amygdala# 0,86 0,05 0,87 0,04 n.s. Brainstem 0,83 0,03 0,85 0,05 n.s.
Cerebellum 0,79 0,03 0,80 0,04 n.s. *Student T test (a P-value of <0.05 after correction for multiple comparisons was
considered to be significant). MD= mean diffusivity. # = Mean of the left and right values.

53
Table 5. Clinical data of the RLS patients and controls of the 1H-MRS
study.
Subjects
(N)
Age
(years)
Sex
(M/F)
Age at
onset
(years)
Disease
duration
(years)
IRLSSG
score
Therapy
(DA
drugs)
(N)
Positive
family
history
(N)
RLS
patients
(25)
52±10 10/15 43±13 9±8 22±7 9 (36%) 9 (36%)
Healthy
controls
(18)
51±16 11/7 / / / / /
M, male; F, female; DA drugs = dopaminergic drugs; IRLSSGRS = International Restless
Legs Syndrome Study Group Rating Scale. All data are given as mean ± SD.
Table 6. 1H-MRS results in RLS patients and healthy controls.
Ratios Controls RLS patients
P* Mean ±SD Mean ±SD NAA/Cr 1.39 0.11 1.24 0.16 <0.01 Cho/Cr 0.31 0.04 0.29 0.03 <0.05 mI/Cr 0.83 0.17 0.78 0.13 n.s. *Student T test (a P-value of <0.05 was considered to be significant). NAA = N-acetyl-
aspartate; Cr = creatine-phosphocreatine; Cho = choline-containing compounds; mI = myo-
inositol.

54
Figure 14. Examples of medial thalami spectra in one RLS patient and one
control. NAA = N-acetyl-aspartate; Cr = creatine-phosphocreatine; Cho =
choline-containing compounds; mI = myo-inositol.
Figure 15. Box-plots of 1H-MRS data of RLS patients and controls (A:
NAA/Cr; B: Cho/Cr).
**=P<0.01; *=P<0.05
** *

55
Table 7. Clinical data of the RLS patients and controls of the phase imaging
study.
Subjects
(N)
Age
(years)
Sex
(M/F)
Age at
onset
(years)
Disease
duration
(years)
IRLSSG
score
Therapy
(DA
drugs)
(N)
Positive
family
history
(N)
RLS
patients
(11)
54±11 2/9 48±11 6±3 21±9 3 (27%) 5 (46%)
Healthy
controls
(11)
51±18 6/5 / / / / /
M, male; F, female; DA drugs = dopaminergic drugs; IRLSSGRS = International Restless
Legs Syndrome Study Group Rating Scale. All data are given as mean ± SD.
Table 8. Phase image analysis of RLS patients and controls.
Phase (radians) Controls RLS patients
P* Mean ±SD Mean ±SD Dentate nucleus 25th# -0,172 0,033 -0,165 0,024 n.s. Dentate nucleus 50th# -0,060 0,027 -0,062 0,022 n.s. Red nucleus 25th# -0,265 0,055 -0,234 0,056 n.s. Red nucleus 50th# -0,141 0,039 -0,132 0,043 n.s. Substantia nigra 25th# -0,287 0,046 -0,243 0,077 n.s. Substantia nigra 50th# -0,138 0,042 -0,119 0,072 n.s. Basal ganglia 25th# -0,205 0,026 -0,203 0,028 n.s. Basal ganglia 50th# -0,075 0,015 -0,081 0,016 n.s.
Histogram of whole brain 10th percentile -0,220 0,007 -0,208 0,010 0.01 50th percentile 0,000 0,003 0,002 0,001 n.s. 90th percentile 0,214 0,009 0,200 0,009 0.02 *Mann–Whitney U test (a P value of < 0.05 after correction for multiple comparisons was
considered to be significant). # = Mean of the left and right values.

56
Figure 16. Box-plots of 10th, 50th and 90th values from histograms of phase
in RLS patients and controls.
**=P<0.05
Figure 17. Correlation between 10th values from histograms of phase in
RLS patients and disease duration (Spearman rank test).

57
REFERENCES

58
• Accili D, Fishburn CS, Drago J, et al. A targeted mutation of the D3
dopamine receptor gene is associated with hyperactivity in mice.
Proc Natl Acad Sci USA 1996;93:1945–1949.
• Agosta F, Rocca MA, Valsasina P, Sala S, Caputo D, Perini M, Salvi
F, Prelle A, Filippi M. A longitudinal diffusion tensor MRI study of
the cervical cord and brain in amyotrophic lateral sclerosis patients. J
Neurol Neurosurg Psychiatry. 2009;80:53-5.
• Allen RP, Earley CJ. Defining the phenotype of the restless legs
syndrome (RLS) using age-of-symptom-onset. Sleep Med
2000;1:11-19.
• Allen RP, Barker PB, Wehrl F, Song HK, Earley CJ. MRI
measurement of brain iron in patients with restless legs syndrome.
Neurology. 2001;56:263-5.
• Allen RP, Picchietti D, Hening WA, Trenkwalder C, Walters AS,
Montplaisi J. Restless legs syndrome: diagnostic criteria, special
considerations, and epidemiology. A report from the restless legs
syndrome diagnosis and epidemiology workshop at the National
Institutes of Health. Sleep Med 2003;4:101–19.
• Allen RP. Dopamine and iron in the pathophysiology of restless legs
syndrome (RLS). Sleep Med. 2004;5:385-91.
• Allen RP, Earley CJ. The role of iron in restless legs syndrome. Mov
Disord. 2007;22 Suppl 18:S440-8.
• Allen RP, Connor JR, Hyland K, Earley CJ. Abnormally increased
CSF 3-Ortho-methyldopa (3-OMD) in untreated restless legs
syndrome (RLS) patients indicates more severe disease and possibly
abnormally increased dopamine synthesis. Sleep Med 2008;10:123–
8.
• Apkarian AV, Bushnell MC, Treede RD, Zubieta JK. Human brain
mechanisms of pain perception and regulation in health and disease.
Eur J Pain. 2005;9:463-84.

59
• Ashburner J, Friston K. Voxel-based morphometry - The methods.
NeuroImage 2000. 11,805-821.
• Astrakas LG, Konitsiotis S, Margariti P, Tsouli S, Tzarouhi L,
Argyropoulou MI. T2 relaxometry and fMRI of the brain in late-
onset restless legs syndrome. Neurology. 2008;71:911-6.
• Bara-Jimenez W, Aksu M, Graham B, Sato S, Hallett M. Periodic
limb movements in sleep: state-dependent excitability of the spinal
flexor reflex. Neurology 2000; 54:1609-16.
• Barrière G, Cazalets JR, Bioulac B, Tison F, Ghorayeb I. The
restless legs syndrome. Prog Neurobiol. 2005;77:139-65.
• Bassetti CL, Mauerhofer D, Gugger M, Mathis J, Hess CW. Restless
legs syndrome: a clinical study of 55 patients. Eur Neurol.
2001;45:67-74.
• Battaglini M, Giorgio A, Stromillo ML, Bartolozzi ML, Guidi L,
Federico A, De Stefano N. Voxel-wise assessment of progression of
regional brain atrophy in relapsing-remitting multiple sclerosis. J
Neurol Sci. 2009;282:55-60.
• Bonavita S, Di Salle F, Tedeschi G. Proton MRS in neurological
disorders. Eur J Radiol. 1999;30:125-31.
• Brand A, Richter-Landsberg C, Leibfritz D. Multinuclear NMR
studies on the energy metabolism of glial and neuronal cells. Dev
Neurosci 1993;15:289-98.
• Briellmann RS, Rosler KM, Hess CW. Blink reflex excitability is
abnormal in patients with periodic leg movements in sleep. Mov
Disord 1996;11:710 -14.
• Bucher SF, Seelos KC, Oertel WH, Reiser M, Trenkwalder C.
Cerebral generators involved in the pathogenesis of the restless legs
syndrome. Ann Neurol 1997;41:639–45.
• Celle S, Roche F, Peyron R, Faillenot I, Laurent B, Pichot V,
Barthélémy JC, Sforza E. Lack of specific gray matter alterations in

60
restless legs syndrome in elderly subjects. J Neurol. 2009 Sep 22.
[Epub ahead of print]
• Cervenka S, Pålhagen SE, Comley RA, Panagiotidis G, Cselényi Z,
Matthews JC, Lai RY, Halldin C, Farde L. Support for dopaminergic
hypoactivity in restless legs syndrome: a PET study on D2-receptor
binding. Brain. 2006;129:2017-28.
• Clardy SL, Earley CJ, Allen RP, Beard JL, Connor JR. Ferritin
subunits in CSF are decreased in restless legs syndrome. J Lab Clin
Med 2006a;147:67 –73.
• Clardy SL, Wang X, Boyer PJ, Earley CJ, Allen RP, Connor JR. Is
ferroportin-hepcidin signaling altered in restless legs syndrome? J
Neurol Sci. 2006b;247:173-9.
• Clemens S, Rye D, Hochman S. Restless legs syndrome: revisiting
the dopamine hypothesis from the spinal cord perspective.
Neurology. 2006;67:125-30.
• Connor JR, Boyer PJ, Menzies SL, Dellinger B, Allen RP, Ondo
WG, Earley CJ. Neuropathological examination suggests impaired
brain iron acquisition in restless legs syndrome. Neurology.
2003;61:304-9.
• Connor JR, Wang XS, Patton SM, Menzies SL, Troncoso JC, Earley
CJ, Allen RP. Decreased transferrin receptor expression by
neuromelanin cells in restless legs syndrome. Neurology.
2004;62:1563-7.
• Connor JR, Wang XS, Allen RP, Beard JL, Wiesinger JA, Felt BT,
Earley CJ. Altered dopaminergic profile in the putamen and
substantia nigra in restless leg syndrome. Brain. 2009;132:2403-12.
• Corson PW, Nopoulos P, Miller DD, Arndt S, Andreasen NC.
Change in basal ganglia volume over 2 years in patients with
schizophrenia: typical versus atypical neuroleptics. Am J Psychiatry
1999;156:1200-4.

61
• Dean T Jr, Allen RP, O'Donnell CP, Earley CJ. The effects of dietary
iron deprivation on murine circadian sleep architecture. Sleep Med.
2006;7:634-40.
• Desai AV, Cherkas LF, Spector TD, Williams AJ. Genetic
influences in self-reported symptoms of obstructive sleep apnoea
and restless legs: a twin study. Twin Res 2004; 7: 589–95.
• Dhawan V, Ali M, Chaudhuri KR. Genetic aspects of restless legs
syndrome. Postgrad Med J. 2006;82:626-9.
• Earley CJ, Heckler D, Allen RP. Repeated IV doses of iron provides
effective supplemental treatment of restless legs syndrome. Sleep
Med. 2005;6:301-5.
• Earley CJ, B Barker P, Horska A, Allen RP. MRI-determined
regional brain iron concentrations in early- and late-onset restless
legs syndrome. Sleep Med. 2006;7:458-61.
• Earley CJ, Ponnuru P, Wang X, Patton SM, Conner JR, Beard JL,
Taub DD, Allen RP. Altered iron metabolism in lymphocytes from
subjects with restless legs syndrome. Sleep. 2008;31:847-52.
• Earley CJ, Allen RP, Connor JR, Ferrucci L, Troncoso J. The
dopaminergic neurons of the A11 system in RLS autopsy brains
appear normal. Sleep Med. 2009;10:1155-7.
• Ekbom KA. Restless legs. Acta Med Scand Suppl 1945;158:5-123.
• Etgen T, Draganski B, Ilg C, Schroder M, Geisler P, Hajak G,
Eisensehr I, Sander D, May A. Bilateral thalamic gray matter
changes in patients with restless legs syndrome. Neuroimage.
2005;24:1242-7.
• Freeman A, Ciliax B, Bakay R, Daley J, Miller RD, Keating G,
Levey A, Rye D. Nigrostriatal collaterals to thalamus degenerate in
parkinsonian animal models. Ann Neurol 2001;50:321-9.
• Godau J, Klose U, Di Santo A, Schweitzer K, Berg D. Multiregional
brain iron deficiency in restless legs syndrome. Mov Disord.
2008;23:1184-7.

62
• Good CD, Johnsrude IS, Ashburner J, Henson RN, Friston KJ,
Frackowiak RS. A voxel-based morphometric study of ageing in 465
normal adult human brains. Neuroimage 2001;14:21-36
• Gosler A, Liepert J. Influence of Carbergoline on motor excitability
in patients with restless legs syndrome. J Clin Neurophysiol
2007;24:456–60.
• Haacke EM, Cheng NY, House MJ, Liu Q, Neelavalli J, Ogg RJ,
Khan A, Ayaz M, Kirsch W, Obenaus A. Imaging iron stores in the
brain using magnetic resonance imaging. Magn Reson Imaging.
2005;23:1-25.
• Haacke EM, Mittal S, Wu Z, Neelavalli J, Cheng YC. Susceptibility-
weighted imaging: technical aspects and clinical applications, part 1.
AJNR Am J Neuroradiol. 2009;30:19-30.
• Hajek M, Dezortova M. Introduction to clinical in vivo MR
spectroscopy. Eur J Radiol. 2008;67:185-93.
• Haselgrove JC, Moore JR. Correction for distortion of echo-planar
images used to calculate the apparent diffusion coefficient. Magn
Reson Med 1996;36:960-964.
• Hening WA, Allen RP, Washburn M, Lesage SR, Earley CJ. The
four diagnostic criteria for Restless Legs Syndrome are unable to
exclude confounding conditions ("mimics"). Sleep Med.
2009;10:976-81.
• Hilker R, Burghaus L, Razai N, Jacobs AH, Szelies B, Heiss WD.
Functional brain imaging in combined motor and sleep disorders. J
Neurol Sci. 2006;248:223-6.
• Hornyak M, Ahrendts JC, Spiegelhalder K, Riemann D, Voderholzer
U, Feige B, van Elst LT. Voxel-based morphometry in unmedicated
patients with restless legs syndrome. Sleep Med. 2007;9:22-6.

63
• Hue GE, Decker MJ, Solomon IG, Rye DB. Increased wakefulness
and hyper-responsivity to novel environments in mice lacking
functional dopamine D3 receptors. Soc Neurosci 2003;616:16.
• Jenkinson M, Bannister P, Brady M, Smith S. Improved optimization
for the robust and accurate linear registration and motion correction
of brain images. Neuroimage. 2002;17:825-41.
• Kantarci K, Knopman DS, Dickson DW, Parisi JE, Whitwell JL,
Weigand SD et al. Alzheimer disease: postmortem neuropathologic
correlates of antemortem 1H MR spectroscopy metabolite
measurements. Radiology 2008;248:210-20.
• Kutukcu Y, Dogruer E, Yetkin S, Ozgen F, Vural O, Aydin H.
Evaluation of periodic leg movements and associated transcranial
magnetic stimulation parameters in restless legs syndrome. Muscle
Nerve 2006;33:133–7.
• Lazzarini A, Walters AS, Hickey K et al. Studies of penetrance and
anticipation in five autosomal-dominant restless legs syndrome
pedigrees. Mov Disord 1999; 14: 111–6.
• Lee SJ, Kim JS, Song IU, An JY, Kim YI, Lee KS. Poststroke
restless legs syndrome and lesion location: anatomical
considerations. Mov Disord. 2009;24:77-84.
• Levchenko A, Montplaisir JY, Asselin G et al. Autosomal-Dominant
Locus for Restless Legs Syndrome in French-Canadians on
Chromosome 16p12.1. Mov Disord 2009; 24(1):40-50.
• Lodi R, Parchi P, Tonon C, Manners D, Capellari S, Strammiello R,
Rinaldi R, Testa C, Malucelli E, Mostacci B, Rizzo G, Pierangeli G,
Cortelli P, Montagna P, Barbiroli B. Magnetic resonance diagnostic
markers in clinically sporadic prion disease: a combined brain
magnetic resonance imaging and spectroscopy study. Brain.
2009;132:2669-79.

64
• Lugaresi E, Coccagna G, Tassinari CA, Ambrosetto C. Polygraphic
data on motor phenomena in the restless legs syndrome. Riv Neurol.
1965 Nov-Dec;35(6):550-61.
• Martinelli P, Rizzo G, Manners D, Tonon C, Pizza F, Testa C,
Scaglione C, Barbiroli B, Lodi R. Diffusion-weighted imaging study
of patients with essential tremor. Mov Disord. 2007;22:1182-5.
• Manconi M, Rocca MA, Ferini-Strambi L, Tortorella P, Agosta F,
Comi G, Filippi M. Restless legs syndrome is a common finding in
multiple sclerosis and correlates with cervical cord damage. Mult
Scler. 2008;14:86-93.
• Martinelli P and Coccagna G. Rilievi neurofisiologici sulla sindrome
delle gambe senza riposo. Riv Neurol (Roma) 1976; 46:552-560.
• Mascalchi M, Filippi M, Floris R, Fonda C, Gasparotti R, Villari N.
Diffusion-weighted MR of the brain: methodology and clinical
application. Radiol Med. 2005;109:155-97.
• Michaud M, Lavigne G, Desautels A, et al. Effects of immobility on
sensory and motor symptoms of restless legs syndrome. Mov Disord
2002;17:112–5.
• Mignot E. A step forward for restless legs syndrome. Nat Genet.
2007;39:938-9.
• Montplaisir J, Boucher S, Nicolas A, et al. Immobilization tests and
periodic leg movements in sleep for the diagnosis of restless leg
syndrome. Mov Disord 1998;13:324–9.
• Möller JC, Unger M, Stiasny-Kolster K, Oertel WH. Restless Legs
Syndrome (RLS) and Parkinson's disease (PD)-related disorders or
different entities? J Neurol Sci. 2010;289:135-7.
• Nardone R, Ausserer H, Bratti A, et al. Cabergoline reverses cortical
hyperexcitability in patients with restless legs syndrome. Acta
Neurol Scand 2006;114:244–9.
• Nicolas A, Michaud M, Lavigne G, Montplaisir J. The influence of
sex, age and sleep/wake state on characteristics of periodic leg

65
movements in restless legs syndrome patients. Clin Neurophysiol
1999;110:1168–74.
• Nordlander NB. The therapy in restless legs. Acta Med Scand
1953;143:453–7.
• Ogg RJ, Langston JW, Haacke EM, Steen RG, Taylor JS. The
correlation between phase shifts in gradient-echo MR images and
regional brain iron concentration. Magn Reson Imaging.
1999;17:1141-8.
• Ondo WG, He Y, Rajasekaran S, Le WD. Clinical correlates of 6-
hydroxydopamine injections into A11 dopaminergic neurons in rats:
a possible model for restless legs syndrome. Mov Disord.
2000;15:154-8.
• Oppenheim H. Lehrbuch der Nervenkrankheiten. 7th ed. Berlin,
Germany: S Karger, 1923:1744.
• Pierpaoli C, Jezzard P, Basser PJ, Barnett A, Di Chiro G. Diffusion
tensor MR imaging of the human brain. Radiology 1996;201:637-
648
• Price DD. Psychological and neural mechanisms of the affective
dimension of pain. Science 2000; 288:1769-72.
• Provencher SW. Estimation of metabolite concentrations from
localized in vivo proton NMR spectra. Magn Reson Med 1993;30:
672-9.
• Qu S, Ondo WG, Zhang X, Xie WJ, Pan TH, Le WD. Projections of
diencephalic dopamine neurons into the spinal cord in mice. Exp
Brain Res 2006;168:152–156.
• Qu S, Le W, Zhang X, Xie W, Zhang A, Ondo WG. Locomotion is
increased in A11-lesioned mice with iron deprivation: a possible
animal model for restless legs syndrome. J Neuropathol Exp Neurol.
2007;66:383-8.
• Rye DB. Parkinson's disease and RLS: the dopaminergic bridge.
Sleep Med. 2004;5:317-28.

66
• Rijsman RM, Stam CJ, Weerd AW. Abnormal H-reflexes in periodic
limb movement disorder; impact on understanding the
pathophysiology of the disorder. Clin Neurophysiol 2005;116:204-
10.
• Rizzo G, Martinelli P, Manners D, Scaglione C, Tonon C, Cortelli P,
Malucelli E, Capellari S, Testa C, Parchi P, Montagna P, Barbiroli
B, Lodi R. Diffusion-weighted brain imaging study of patients with
clinical diagnosis of corticobasal degeneration, progressive
supranuclear palsy and Parkinson's disease. Brain. 2008;131:2690-
700.
• Rizzo V, Aricò I, Mastroeni C, Morgante F, Giovanna L, Girlanda P,
Silvestri R, Quartarone A. Dopamine agonists restore cortical
plasticity in patients with idiopathic restless legs syndrome. Mov
Disord. 2009;24:710-5.
• Rueckert D, Sonoda LI, Hayes C, Hill DL, Leach MO, Hawkes DJ.
Nonrigid registration using free-form deformations: application to
breast MR images. IEEE Trans Med Imaging. 1999;18:712-21.
• San Pedro EC, Mountz JM, Mountz JD, Liu HG, Katholi CR,
Deutsch G. Familial painful restless legs syndrome correlates with
pain dependent variation of blood flow to the caudate, thalamus, and
anterior cingulated gyrus. J Rheumatol 1998;25:2270-5.
• Schattschneider J, Bode A, Wasner G, Binder A, Deuschl G, Baron
R. Idiopathic restless legs syndrome: abnormalities in central
somatosensory processing. J Neurol. 2004;251:977-82.
• Schmidauer C, Sojer M, Seppi K, Stockner H, Högl B, Biedermann
B, Brandauer E, Peralta CM, Wenning GK, Poewe W. Transcranial
ultrasound shows nigral hypoechogenicity in restless legs syndrome.
Ann Neurol. 2005;58:630-4.
• Skagerberg G, Bjorklund A, Lindvall O, Schmidt RH. Origin and
termination of the diencephalo-spinal dopamine system in the rat.
Brain Res Bull 1982;9:237–244.

67
• Skagerberg G, Lindvall O. Organization of diencephalic dopamine
neurons projecting to the spinal cord in the rat. Brain Res
1985;342:340-351.
• Smith SM. Fast robust automated brain extraction. Hum Brain
Mapp. 2002;17:143-55.
• Smith SM, Jenkinson M, Woolrich MW, Beckmann CF, Behrens
TE, Johansen-Berg H, Bannister PR, De Luca M, Drobnjak I,
Flitney DE, Niazy RK, Saunders J, Vickers J, Zhang Y, De Stefano
N, Brady JM, Matthews PM. Advances in functional and structural
MR image analysis and implementation as FSL. Neuroimage.
2004;23 Suppl 1:S208-19.
• Smith SM, Jenkinson M, Johansen-Berg H, Rueckert D, Nichols TE,
Mackay CE, Watkins KE, Ciccarelli O, Cader MZ, Matthews PM,
Behrens TE. Tract-based spatial statistics: voxelwise analysis of
multi-subject diffusion data. Neuroimage. 2006;31:1487-505.
• Smith SM, Johansen-Berg H, Jenkinson M, Rueckert D, Nichols TE,
Miller KL, Robson MD, Jones DK, Klein JC, Bartsch AJ, Behrens
TE. Acquisition and voxelwise analysis of multi-subject diffusion
data with tract-based spatial statistics. Nat Protoc. 2007;2:499-503.
• Snyder AM, Wang X, Patton SM, Arosio P, Levi S, Earley CJ, Allen
RP, Connor JR. Mitochondrial ferritin in the substantia nigra in
restless legs syndrome. J Neuropathol Exp Neurol. 2009;68:1193-9.
• Stefansson H, Rye DB, Hicks A, Petursson H, Ingason A,
Thorgeirsson TE, Palsson S, Sigmundsson T, Sigurdsson AP,
Eiriksdottir I, Soebech E, Bliwise D, Beck JM, Rosen A, Waddy S,
Trotti LM, Iranzo A, Thambisetty M, Hardarson GA, Kristjansson
K, Gudmundsson LJ, Thorsteinsdottir U, Kong A, Gulcher JR,
Gudbjartsson D, Stefansson K. A genetic risk factor for periodic
limb movements in sleep. N Engl J Med. 2007;357:639-47.

68
• Stiasny-Kolster K, Magerl W, Oertel WH, Moller JC, Treede RD.
Static mechanical hyperalgesia without dynamic tactile allodynia in
patients with restless legs syndrome. Brain 2004;127:773-82.
• Symonds CP. Nocturnal myoclonus. J Neurol Neurosurg Psychiatry
1953;16:166-71.
• Treede RD, Kenshalo DR, Gracely RH, Jones AK. The cortical
representation of pain. Pain 1999;79:105-11.
• Trenkwalder C, Bucher SF, Oertel WH, et al. Bereitschaftspotential
in idiopathic and symptomatic restless legs syndrome.
Electroencephalogr Clin Neurophysiol 1993;89:95-103.
• Trenkwalder C, Bucher SF, Oertel WH. Electrophysiological pattern
of involuntary limb movements in the restless legs syndrome.
Muscle Nerve 1996;19:155-62.
• Trenkwalder C, Högl B and Winkelmann J. Recent advances in the
diagnosis, genetics and treatment of restless legs syndrome. J Neurol
2009; 256(4):539-553.
• Trenkwalder C, Paulus W, Walters AS. The restless legs syndrome.
Lancet Neurol. 2005;4:465-75.
• Trenkwalder C, Seidel VC, Gasser T, Oertel WH. Clinical symptoms
and possible anticipation in a large kindred of familial restless legs
syndrome. Mov Disord 1996; 11: 389–94.
• Tyvaert L, Houdayer E, Devanne H, Bourriez JL, Derambure P,
Monaca C. Cortical involvement in the sensory and motor symptoms
of primary restless legs syndrome. Sleep Med. 2009a;10:1090-6.
• Tyvaert L, Laureau E, Hurtevent JP, Hurtevent JF, Derambure P,
Monaca C. A-delta and C-fibres function in primary restless legs
syndrome. Neurophysiol Clin. 2009b;39:267-74.
• Unrath A, Kassubek J. Symptomatic restless leg syndrome after
lacunar stroke: a lesion study. Mov Disord. 2006;21:2027-8.

69
• Unrath A, Juengling FD, Schork M, Kassubek J. Cortical grey matter
alterations in idiopathic restless legs syndrome: An optimized voxel-
based morphometry study. Mov Disord. 2007;22:1751-6.
• Unrath A, Müller HP, Ludolph AC, Riecker A, Kassubek J. Cerebral
white matter alterations in idiopathic restless legs syndrome, as
measured by diffusion tensor imaging. Mov Disord. 2008;23:1250-5.
• von Spiczak S, Whone AL, Hammers A, Asselin MC, Turkheimer F,
Tings T, Happe S, Paulus W, Trenkwalder C, Brooks DJ. The role of
opioids in restless legs syndrome: an [11C]diprenorphine PET study.
Brain. 2005;128:906-17.
• Walters AS, Hickey K, Maltzman J, et al. A questionnaire study of
138 patients with restless legs syndrome: the ‘Night-Walkers’
survey. Neurology 1996;46:92–5.
• Walters AS, LeBrocq C, Dhar A, Hening W, Rosen R, Allen RP,
Trenkwalder C; International Restless Legs Syndrome Study Group.
Validation of the International Restless Legs Syndrome Study group
rating scale for restless legs syndrome. Sleep Med 2003.4,121– 132.
• Walters AS. Toward a better definition of the restless legs syndrome.
The International Restless Legs Syndrome Study Group. Mov
Disord. 1995;10:634-42.
• Wang J, O'Reilly B, Venkataraman R, Mysliwiec V, Mysliwiec A.
Efficacy of oral iron in patients with restless legs syndrome and a
low-normal ferritin: A randomized, double-blind, placebo-controlled
study. Sleep Med. 2009;10:973-5.
• Willis T. The London practice of physick. 1st ed. London: Thomas
Bassett and William Crooke, 1685:404.
• Wetter TC, Eisensehr I, Trenkwalder C. Functional neuroimaging
studies in restless legs syndrome. Sleep Med. 2004;5:401-6.
• Winkelmann J, Wetter TC, Collado-Seidel V, Gasser T, Dichgans
M, Yassouridis A, Trenkwalder C. Clinical characteristics and

70
frequency of the hereditary restless legs syndrome in a population of
300 patients. Sleep 2000; 23: 597–602.
• Winkelmann J, Muller-Myhsok B, Wittchen HU, Hock B, Prager M,
Pfister H, Strohle A, Eisensehr I, Dichgans M, Gasser T,
Trenkwalder C. Complex segregation analysis of restless legs
syndrome provides evidence for an autosomal dominant mode of
inheritance in early age at onset families. Ann Neurol 2002;52:297–
302.
• Winkelmann J, Polo O, Provini F, Nevsimalova S, Kemlink D,
Sonka K, Högl B, Poewe W, Stiasny-Kolster K, Oertel W, de Weerd
A, Strambi LF, Zucconi M, Pramstaller PP, Arnulf I, Trenkwalder C,
Klein C, Hadjigeorgiou GM, Happe S, Rye D, Montagna P.
Genetics of restless legs syndrome (RLS): State-of-the-art and future
directions. Mov Disord. 2007a;22 S18:S449-58.
• Winkelmann J, Schormair B, Lichtner P, Ripke S, Xiong L,
Jalilzadeh S, Fulda S, Pütz B, Eckstein G, Hauk S, Trenkwalder C,
Zimprich A, Stiasny-Kolster K, Oertel W, Bachmann CG, Paulus W,
Peglau I, Eisensehr I, Montplaisir J, Turecki G, Rouleau G, Gieger
C, Illig T, Wichmann HE, Holsboer F, Müller-Myhsok B, Meitinger
T. Genome-wide association study of restless legs syndrome
identifies common variants in three genomic regions. Nat Genet
2007b; 39:1000-1006.
• Wittmaack T. Pathologie und therapie der sensibilitat-neurosen.
Leipzig: E. Schafer, 1861:459.
• Zhang Y, Brady M, Smith S. Segmentation of brain MR images
through a hidden Markov random field model and the expectation-
maximization algorithm. IEEE Trans Med Imaging. 2001;20:45-57.
• Zhao H, Zhu W, Pan T, Xie W, Zhang A, Ondo WG, Le W. Spinal
cord dopamine receptor expression and function in mice with 6-
OHDA lesion of the A11 nucleus and dietary iron deprivation. J
Neurosci Res. 2007;85:1065-76.

71
• Zucconi M, Ferini-Strambi L. Epidemiology and clinical findings of
restless legs syndrome. Sleep Med. 2004 May;5:293-9.
• Zucconi M, Ferri R, Allen R, Baier PC, Bruni O, Chokroverty S,
Ferini-Strambi L, Fulda S, Garcia-Borreguero D, Hening WA,
Hirshkowitz M, Högl B, Hornyak M, King M, Montagna P, Parrino
L, Plazzi G, Terzano MG; International Restless Legs Syndrome
Study Group (IRLSSG). The official World Association of Sleep
Medicine (WASM) standards for recording and scoring periodic leg
movements in sleep (PLMS) and wakefulness (PLMW) developed in
collaboration with a task force from the International Restless Legs
Syndrome Study Group (IRLSSG). Sleep Med. 2006;7:175-83.

72
Thanks to:
Prof. Pasquale Montagna, Prof. Raffaele Lodi, Dott. David Manners, Prof.
Paolo Martinelli, Prof. Bruno Barbiroli, Dott. Roberto Vetrugno, Prof.ssa
Caterina Tonon, Dott.ssa Sara Marconi, Dott.ssa Claudia Testa, Dott. Fabio
Pizza, Dott. Emil Malucelli, Dott. Giuseppe Plazzi, Dott.ssa Federica
Provini, Dott.ssa Cesa Scaglione, Dott.ssa Giovanna Calandra-Bonaura,
Dott. Pietro Guaraldi, Dott.ssa Ilaria Naldi, Dott.ssa Francesca Poli.