Medicare & Medicaid EHR Incentive Programs
28
http://www.cms.gov/EHRIncentivePrograms/ Medicare & Medicaid EHR Incentive Programs HIT Policy Committee June 6, 2012
-
Upload
candice-black -
Category
Documents
-
view
19 -
download
0
description
Medicare & Medicaid EHR Incentive Programs. HIT Policy Committee June 6, 2012. Registration and Payment Data. Active registrations – 2012. Active Registrations – April 2012. Active registrations - 2012. Active Registrations – 2012. Medicare incentive payments. - PowerPoint PPT Presentation
Transcript of Medicare & Medicaid EHR Incentive Programs

http://www.cms.gov/EHRIncentivePrograms/
Medicare & Medicaid EHR Incentive Programs
HIT Policy CommitteeJune 6, 2012

http://www.cms.gov/EHRIncentivePrograms/
Registration and Payment Data
2

http://www.cms.gov/EHRIncentivePrograms/
Active registrations – 2012
Active Registrations – April 2012
3

http://www.cms.gov/EHRIncentivePrograms/
Active registrations - 2012
Active Registrations – 2012
4

http://www.cms.gov/EHRIncentivePrograms/
Medicare incentive payments
5
Medicare Incentive Payments – April 2012 Meaningful Use (MU)

http://www.cms.gov/EHRIncentivePrograms/
Medicare incentive payments
6
Medicare Incentive Payments – April 2012 Meaningful Use
For final CMS reports, please visit: http://www.cms.gov/EHRIncentivePrograms/56_DataAndReports.asp

http://www.cms.gov/EHRIncentivePrograms/
Medicare incentive payments
7
Medicare Incentive Payments – April 2012 Meaningful Use
http://www.cms.gov/EHRIncentivePrograms/
Medicaid incentive payments April 2012
8
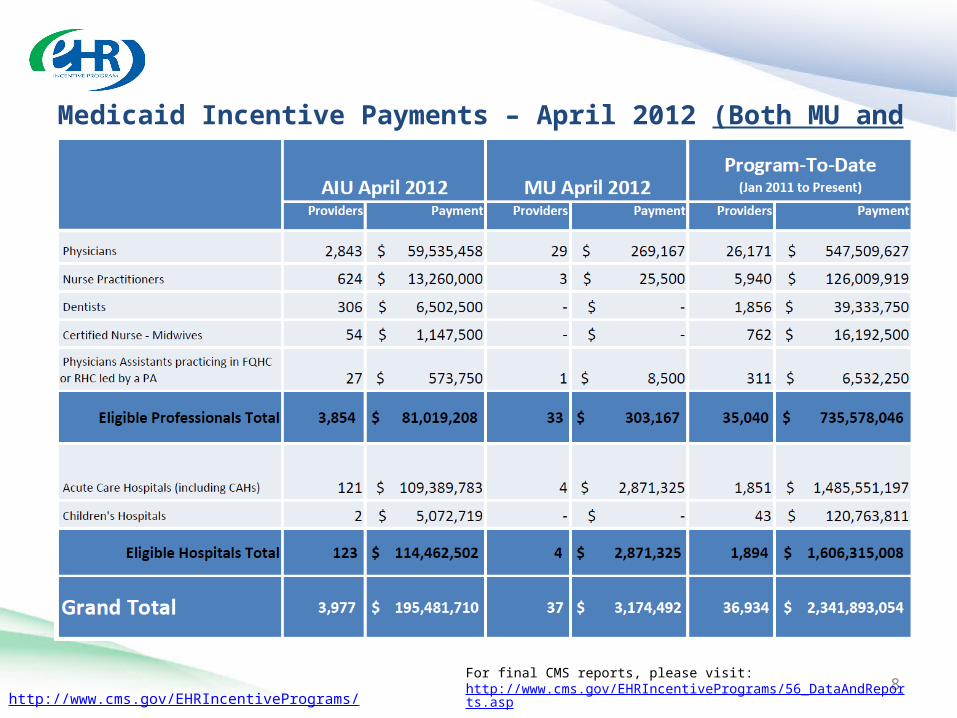
Medicaid Incentive Payments – April 2012 (Both MU and AIU)
For final CMS reports, please visit: http://www.cms.gov/EHRIncentivePrograms/56_DataAndReports.asp

http://www.cms.gov/EHRIncentivePrograms/
Medicaid incentive payments 2012
9
Medicaid Incentive Payments – 2012

http://www.cms.gov/EHRIncentivePrograms/
EHR incentive programs – April 2012 totals
10
EHR Incentive Programs – April 2012 Totals

http://www.cms.gov/EHRIncentivePrograms/
April – by the numbers
April – By the Numbers
• 45% of all eligible hospitals have received an EHR incentive payment for either MU or AIU • 45% have made a financial commitment to put an EHR in
place
• Approximately 1 out of every 7 Medicare EPs are meaningful users of EHRs
• Approximately 1 out of every 5 Medicare and Medicaid EPs have made a financial commitment to an EHR
• 57% of Medicare EPs receiving incentives are specialists (non primary care)
11

http://www.cms.gov/EHRIncentivePrograms/
Medicare & medicaid payments for may 2012
12
Medicare & Medicaid Payments for May 2012DRAFT ESTIMATES ONLY
Providers Paid May-12 LTD
Medicare EPs – [ESTIMATED] 900 58,500
MAO EPs [ESTIMATED] 11,000 11,000Medicaid EPs [ESTIMATED] 4,300 38,700
Medicaid/Medicare Hospitals** [ESTIMATED] 200 2,450
Total Number of Providers Paid 16,400 110,650

http://www.cms.gov/EHRIncentivePrograms/
Draft estimates
13
Medicare & Medicaid Payments for May 2012DRAFT ESTIMATES ONLY
Payments May-12 LTD
Medicare EPs [ESTIMATED] $16,000,000 $969,000,000
MAO EPs [ESTIMATED] $180,000,000 $180,000,000Medicaid EPs [ESTIMATED] $88,000,000 $823,000,000Medicaid/Medicare Hospitals(Medicare Pymt) [ESTIMATED] $150,000,000 $1,884,000,000Medicaid/Medicare Hospitals (Medicaid Pymt) [ESTIMATED] $117,000,000 $1,722,000,000
Total $551,000,000 $5,578,000,000

http://www.cms.gov/EHRIncentivePrograms/
EHR Incentive Programs Attestation Data
14

http://www.cms.gov/EHRIncentivePrograms/
Providers Included
At the time of the analysis:• 68,894 EPs had attested
• 68,617 Successfully• 277 Unsuccessfully (167 EPs have resubmitted
successfully)
• 1,292 Hospitals had attested• All successfully• All Medicare
15

http://www.cms.gov/EHRIncentivePrograms/
Highlights• Very little Medicaid MU data• On average all thresholds were greatly
exceeded, but every threshold had some providers on the borderline
• Little difference between EP and hospitals• Little difference among specialties in
performance, but differences in exclusions and deferrals
• Data will be available on the CMS EHR Incentive Programs website, under the “Data and Reports” tab
16

http://www.cms.gov/EHRIncentivePrograms/
Most Popular Menu Objs
17
EPs
• Immunization registry Drug formulary
• Incorporate clinical lab test results
Eligible Hospitals
• Advance directives• Drug formulary
• Incorporate clinical lab test results

http://www.cms.gov/EHRIncentivePrograms/
Least Popular Menu Objs
18
EPs
• Transitions of care• Patient reminders
Eligible Hospitals
• Transitions of care• Syndromic surveillance

http://www.cms.gov/EHRIncentivePrograms/
EP Quality, Safety, Efficiency, and Reduce Health Disparities
19
Objective Performance Exclusion DeferralProblem List 96% N/A N/AMedication List 97% N/A N/AMedication Allergy List 96% N/A N/ADemographics 91% N/A N/AVital Signs 90% 8% N/ASmoking Status 90% 0.5% N/A

http://www.cms.gov/EHRIncentivePrograms/
EP Quality, Safety, Efficiency, and Reduce Health Disparities
20
Objective Performance Exclusion DeferralCPOE 84% 18% N/AElectronic prescribing 80% 22% N/AIncorporate lab results 91% 4% 37%Drug-formulary checks N/A 14% 15%Patient lists N/A N/A 24%Send reminders to patients 61% 0.5% 78%

http://www.cms.gov/EHRIncentivePrograms/
EP Engage Patients and Their Families
21
Objective Performance Exclusion DeferralE – Copy of Health Information 96% 69% N/AOffice visit summaries 79% 2% N/APatient Education Resources 49% N/A 50%Timely electronic access 71% 2% 67%

http://www.cms.gov/EHRIncentivePrograms/
EP Improve Care Coordination
22
Objective Performance Exclusion DeferralMedication reconciliation 90% 3% 55%Summary of care at transitions 89% 3% 84%

http://www.cms.gov/EHRIncentivePrograms/
EP Improve Population and Public Health
23
Objective Performance* Exclusion Deferral
Immunizations 37% 42% 21%Syndromic Surveillance 6% 26% 68%
*Performance is percentage of attesting providers who conducted test

http://www.cms.gov/EHRIncentivePrograms/
EH Quality, Safety, Efficiency, and Reduce Health Disparities
24
Objective Performance Exclusion DeferralProblem List 95% N/A N/AMedication List 97% N/A N/AMedication Allergy List 98% N/A N/ADemographics 96% N/A N/AVital Signs 93% N/A N/ASmoking Status 93% 0.5% N/A

http://www.cms.gov/EHRIncentivePrograms/
EH Quality, Safety, Efficiency, and Reduce Health Disparities
25
Objective Performance Exclusion DeferralCPOE 85% N/A N/AAdvance directives 95% 0.2% 11%Incorporate lab results 95% N/A 16%Drug-formulary checks N/A N/A 14%Patient lists N/A N/A 38%

http://www.cms.gov/EHRIncentivePrograms/
EH Engage Patients and Their Families
26
Objective Performance Exclusion DeferralE – copy of health information 95% 66% N/AE – copy of discharge Instructions 95% 61% N/A
Patient education resources 71% N/A 62%

http://www.cms.gov/EHRIncentivePrograms/
EH Improve Care Coordination
27
Objective Performance Deferral
Medication reconciliation 83% 74%Summary of care at transitions 82% 93%

http://www.cms.gov/EHRIncentivePrograms/
EH Improve Population and Public Health
Objective Performance* Exclusion Deferral
Immunizations 47% 15% 38%Reportable Lab Results 18% 6% 76%Syndromic Surveillance 18% 4% 78%
28
*Performance is percentage of attesting providers who conducted test