Medicare & Medicaid EHR Incentive Programs
29
http://www.cms.gov/EHRIncentivePrograms/ Medicare & Medicaid EHR Incentive Programs HIT Policy Committee August 2012
-
Upload
lysander-theron -
Category
Documents
-
view
20 -
download
0
description
Medicare & Medicaid EHR Incentive Programs. HIT Policy Committee August 2012. Registration and Payment Data. Active Registrations – July 2012. Active Registrations – 2012. Medicare Incentive Payments – July 2012 Meaningful Use (MU). - PowerPoint PPT Presentation
Transcript of Medicare & Medicaid EHR Incentive Programs

http://www.cms.gov/EHRIncentivePrograms/
Medicare & Medicaid EHR Incentive Programs
HIT Policy CommitteeAugust 2012

http://www.cms.gov/EHRIncentivePrograms/
Registration and Payment Data
2

http://www.cms.gov/EHRIncentivePrograms/
Active Registrations – July 2012

http://www.cms.gov/EHRIncentivePrograms/
Active Registrations – 2012

http://www.cms.gov/EHRIncentivePrograms/5
Medicare Incentive Payments – July 2012 Meaningful Use (MU)

http://www.cms.gov/EHRIncentivePrograms/6
Medicare Incentive Payments – July 2012 Meaningful Use
For final CMS reports, please visit: http://www.cms.gov/EHRIncentivePrograms/56_DataAndReports.asp

http://www.cms.gov/EHRIncentivePrograms/7
Medicare Incentive Payments – July 2012 Meaningful Use

http://www.cms.gov/EHRIncentivePrograms/8
Medicaid Incentive Payments – July 2012 (Both MU and AIU)
For final CMS reports, please visit: http://www.cms.gov/EHRIncentivePrograms/56_DataAndReports.asp

http://www.cms.gov/EHRIncentivePrograms/9
Medicaid Incentive Payments – 2012
http://www.cms.gov/EHRIncentivePrograms/10
EHR Incentive Programs – July 2012 Totals
http://www.cms.gov/EHRIncentivePrograms/
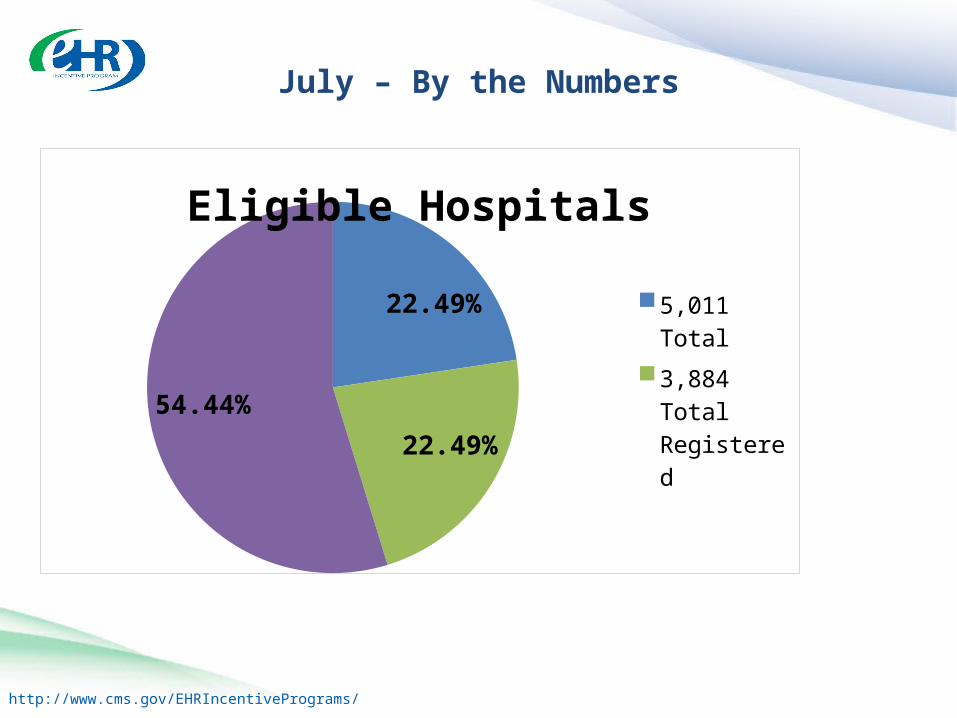
July – By the Numbers
22.49%
22.49%
54.44%
Eligible Hospitals
5,011 Total
3,884 Total Registered
2,728 Paid

http://www.cms.gov/EHRIncentivePrograms/
July – By the Numbers
48.77%
34.61%
16.62%
Registered Eligible Professionals
521,600 Total EPsRegistered Medicare EPs (180,513)Registered Medicaid EPs (86,708)

http://www.cms.gov/EHRIncentivePrograms/
July– By the Numbers
77.42%
12.82%
9.76%
Paid Eligible Professionals
521,600 Total EPsMedicare EPs (66,883)Medicaid EPs (50,887)

http://www.cms.gov/EHRIncentivePrograms/
July – By the Numbers
• 55% of all eligible hospitals have received an EHR incentive payment for either MU or AIU • 55% have made a financial commitment to put an EHR in
place
• Approximately 18% or nearly 1 out of every 5 Medicare EPs are meaningful users of EHRs
• Approximately 1 out of every 4 Medicare and Medicaid EPs have made a financial commitment to an EHR
• 58% of Medicare EPs receiving incentives are specialists (non primary care)

http://www.cms.gov/EHRIncentivePrograms/15
Medicare & Medicaid Payments for August 2012DRAFT ESTIMATES ONLY
Providers Paid August-12 LTD
Medicare EPs – [ESTIMATED] 7,200 74,000
Medicaid EPs (AIU + MU) [ESTIMATED] 3,800 55,000Medicaid/Medicare Hospitals** [ESTIMATED] 250 3,700
Total Number of Providers Paid 11,250 143,800*

http://www.cms.gov/EHRIncentivePrograms/16
Medicare & Medicaid Payments for August 2012DRAFT ESTIMATES ONLY
Payments May-12 LTD
Medicare EPs [ESTIMATED] $130,000,000 $1,263,000,000Medicaid EPs [ESTIMATED] $76,000,000 $1,135,000,000Medicaid/Medicare Hospitals(Medicare Pymt) [ESTIMATED] $195,000,000 $2,332,000,000Medicaid/Medicare Hospitals (Medicaid Pymt) [ESTIMATED] $101,000,000 $2,176,000,000
Total $497,000,000 $6,906,000,000

http://www.cms.gov/EHRIncentivePrograms/
EHR Incentive Programs Attestation Data
17
http://www.cms.gov/EHRIncentivePrograms/
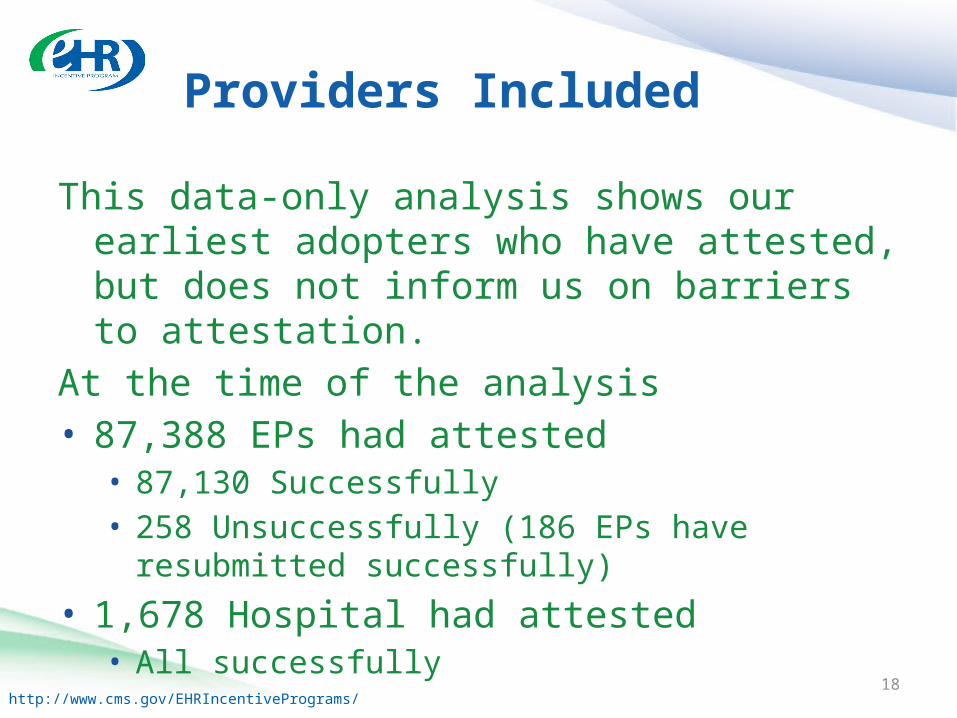
Providers Included
This data-only analysis shows our earliest adopters who have attested, but does not inform us on barriers to attestation.
At the time of the analysis• 87,388 EPs had attested
• 87,130 Successfully• 258 Unsuccessfully (186 EPs have resubmitted
successfully)
• 1,678 Hospital had attested• All successfully
18

http://www.cms.gov/EHRIncentivePrograms/
Highlights• On average all thresholds were greatly exceeded, but
every threshold had some providers on the borderline• Drug formulary, immunization registries and patient list
are the most popular menu objectives for EPs• Advance Directives, Drug Formulary, and Clinical Lab Test
Results for hospitals
• Transition of care summary and patient reminders were the least popular menu objectives for EPs• Transition of Care and Reportable Lab Results for hospitals
• Little difference between EP and hospitals• Little difference among specialties in performance, but
differences in exclusions and deferrals
19
http://www.cms.gov/EHRIncentivePrograms/
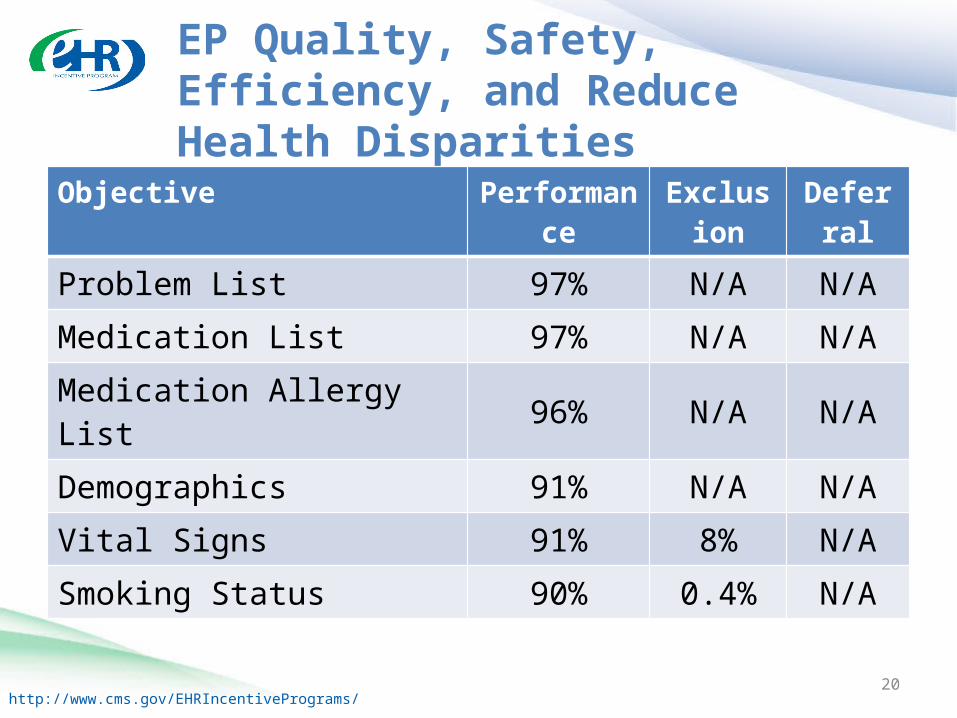
EP Quality, Safety, Efficiency, and Reduce Health Disparities
20
Objective Performance Exclusion DeferralProblem List 97% N/A N/AMedication List 97% N/A N/AMedication Allergy List 96% N/A N/ADemographics 91% N/A N/AVital Signs 91% 8% N/ASmoking Status 90% 0.4% N/A

http://www.cms.gov/EHRIncentivePrograms/
EP Quality, Safety, Efficiency, and Reduce Health Disparities
21
Objective Performance Exclusion DeferralCPOE 83% 17% N/AElectronic prescribing 80% 21% N/AIncorporate lab results 92% 4% 36%Drug-formulary checks N/A 14% 15%Patient lists N/A N/A 25%Send reminders to patients 61% 0.5% 80%
http://www.cms.gov/EHRIncentivePrograms/
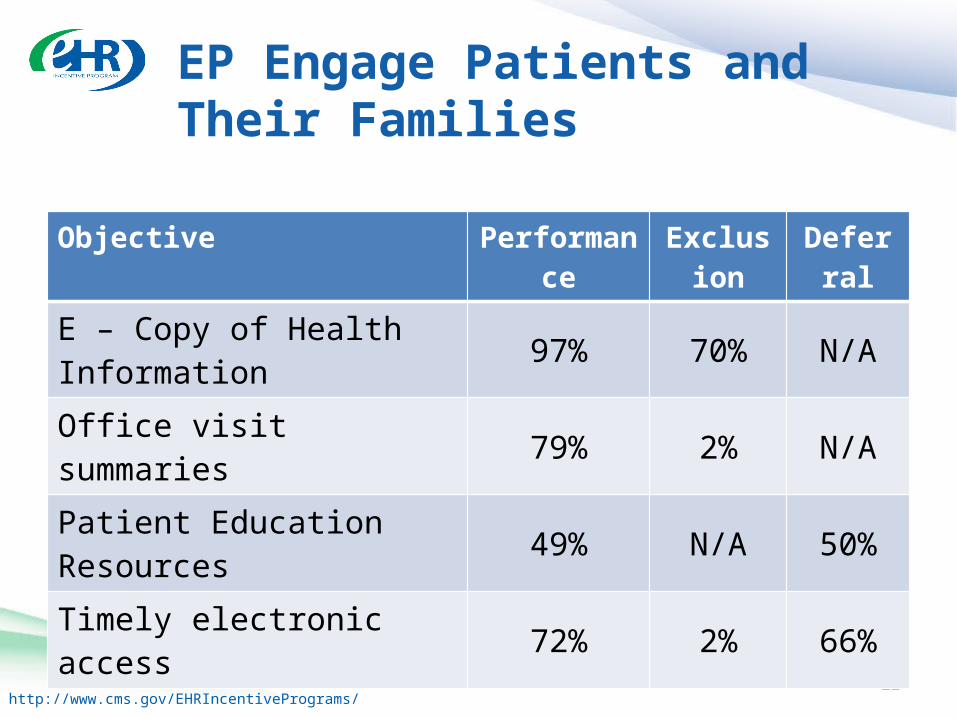
EP Engage Patients and Their Families
22
Objective Performance Exclusion DeferralE – Copy of Health Information 97% 70% N/AOffice visit summaries 79% 2% N/APatient Education Resources 49% N/A 50%Timely electronic access 72% 2% 66%

http://www.cms.gov/EHRIncentivePrograms/
EP Improve Care Coordination
23
Objective Performance Exclusion DeferralMedication reconciliation 90% 3% 55%Summary of care at transitions 89% 3% 84%

http://www.cms.gov/EHRIncentivePrograms/
EP Improve Population and Public Health
24
Objective Performance* Exclusion Deferral
Immunizations 36% 43% 21%Syndromic Surveillance 6% 26% 68%
*Performance is percentage of attesting providers who conducted test

http://www.cms.gov/EHRIncentivePrograms/
EH Quality, Safety, Efficiency, and Reduce Health Disparities
25
Objective Performance Exclusion DeferralProblem List 95% N/A N/AMedication List 98% N/A N/AMedication Allergy List 98% N/A N/ADemographics 96% N/A N/AVital Signs 92% N/A N/ASmoking Status 93% 0.4% N/A

http://www.cms.gov/EHRIncentivePrograms/
EH Quality, Safety, Efficiency, and Reduce Health Disparities
26
Objective Performance Exclusion DeferralCPOE 85% N/A N/AAdvance directives 95% 0.1% 10%Incorporate lab results 95% N/A 18%Drug-formulary checks N/A N/A 15%Patient lists N/A N/A 39%

http://www.cms.gov/EHRIncentivePrograms/
EH Engage Patients and Their Families
27
Objective Performance Exclusion DeferralE – copy of health information 96% 67% N/AE – copy of discharge Instructions 95% 63% N/A
Patient education resources 70% N/A 60%

http://www.cms.gov/EHRIncentivePrograms/
EH Improve Care Coordination
28
Objective Performance Deferral
Medication reconciliation 83% 74%Summary of care at transitions 83% 92%

http://www.cms.gov/EHRIncentivePrograms/
EH Improve Population and Public Health
Objective Performance* Exclusion Deferral
Immunizations 49% 14% 37%Reportable Lab Results 17% 6% 78%Syndromic Surveillance 20% 4% 77%
29
*Performance is percentage of attesting providers who conducted test