Medicare Advantage Plan Star Ratings and Bonus Payments · PDF fileMedicare Advantage Plan...
17
Data Brief Medicare Advantage Plan Star Ratings and Bonus Payments in 2012 November 2011
Transcript of Medicare Advantage Plan Star Ratings and Bonus Payments · PDF fileMedicare Advantage Plan...

Data Brief Medicare Advantage Plan Star Ratings and Bonus Payments in 2012 November 2011
Medicare advantage Plan Star ratingS and BonuS PayMentS in 2012 1
EXHIBIT 1
Distribution of Medicare Advantage Contracts and Enrollees by Quality Ratings, 2011
NOTE: The analysis of the distribution of contracts by quality ratings is not weighted by enrollment. Includes HMOs, local PPOs, regional PPOs, and PFFS plans.SOURCE: Kaiser Family Foundation, “Reaching for the Stars: Quality Ratings of Medicare Advantage Plans, 2011,” February 2011.
Total Number of Contracts = 550
Distribution of Medicare Advantage enrollees by quality ratings:
Distribution of Medicare Advantage contracts by quality ratings:
4 or more stars
6%7%
1%
18%
<1%9%
31%
15%
10%
1%
27%
<1%8%
32%
Total Enrollment = 10.9 million
7%28%
Medicare Advantage Plan Star Ratings and Bonus Payments in 2012 Prepared by Gretchen Jacobson, Tricia Neuman, Anthony Damico, and Jennifer Huang*
NOVEMBER 2011 INTRODUCTION
For several years, the Centers for Medicare and Medicaid Services (CMS) has posted quality ratings of Medicare Advantage plans to provide Medicare beneficiaries with additional information about plans offered in their area. All Medicare Advantage plans are rated on a 1 to 5 star scale, with 1 star representing poor performance, 3 stars representing average performance, and 5 stars representing excellent performance. The quality scores for Medicare Advantage plans in 2011 are based on 53 performance measures that are derived from plan and beneficiary information collected in three surveys – HEDIS®, CAHPS®, and HOS – and administrative data. For example, the performance measures include whether the plans’ enrollees received the appropriate screening tests, the number of complaints CMS received about the plan, and how enrollees rated the communication skills of the plans’ physicians. CMS assigns quality ratings at the contract level, rather than for each individual plan. This means that every Medicare Advantage plan covered under the same contract receives the same quality rating (and most contracts cover multiple plans).
In 2012, Medicare Advantage plans will begin to receive bonus payments based on quality ratings. These payments were initially established in the 2010 health reform law that provides for bonus payments to plans that receive 4 or more stars and to unrated plans beginning in 2012.1 In addition to the bonus payments established by the health reform law, CMS will also be launching a 3-year demonstration to begin in 2012 that increases the size of bonuses for these plans, and also provides bonuses to plans rated as average (receiving 3 or 3.5 stars), using the same 1 to 5 star scale. The demonstration, according to CMS, aims to encourage “plans to improve performance at various star rating levels” and to test “whether providing scaled bonuses will lead to more rapid and larger year-to-year quality improvements in Medicare Advantage program quality scores,” compared to the bonus structure under the health reform law.2 Proponents say the demonstration will encourage plans at various star ratings to improve or maintain their quality ratings, while others question the appropriateness of providing bonuses to plans with average ratings, and the costs associated with the demonstration.3
More than one-quarter (26%) of all Medicare Advantage enrollees are covered by contracts that were rated as above average or excellent, with 4 or more stars (Exhibit 1).4 Most Medicare Advantage enrollees (59%) are in plans rated as average (3 or 3.5 stars), and 9 percent of enrollees are in contracts that received fewer than 3 stars. Seven percent of enrollees are in contracts that were not rated by CMS.
To understand how the quality scores are now interacting with plan payments, this paper estimates total Medicare spending on quality bonus payments for Medicare Advantage plans in 2012, showing variations by company, tax status, state and county. This paper seeks to show how the bonus payments will be distributed across plans. Calculations are based on CMS’s ratings of plans in 2011, which will determine the 2012 bonus payments; plan offerings and enrollment in March 2011; plan-specific risk scores for 2009 (i.e., the health status of plans’ enrollees relative to other Medicare beneficiaries); rebate shares for each quality rating as specified by the health reform law; and CMS data on the 2012 benchmarks, double-bonus counties, and the length of the phase-in period for the new benchmarks. These estimates are based on 2011 enrollment and plan offerings; actual bonuses may differ if the plan offerings or enrollment change in 2012. The analysis does not attempt to assess the validity of the quality ratings, but rather the distribution and impact of the bonus payments. Additional information on the methodology is included in the Appendix.

Medicare advantage Plan Star ratingS and BonuS PayMentS in 2012 2
KEY FINDINGS
Most Medicare Advantage contracts (91%) will receive a bonus payment in 2012 because they received 3 or more stars, or were not rated; the remaining 9 percent of contracts will not receive bonus payments because they received 2 or 2.5 stars.
Plans are projected to receive $3.1 billion in bonus payments in 2012, 4 percent of which was established under the health reform law of 2010.
About one-third of the total bonus payments ($1.1 billion) are projected to go to plans rated as above average or better (4 or more stars), and two-thirds ($2.0 billion) are projected to go to plans rated as average (3 or 3.5 stars) and plans that were not rated.
The additional bonuses provided under the demonstration in 2012 are expected to amount to about half of the reduction in Medicare Advantage plan payments ($6 billion) included in the health reform law for 2012.5
On average, not-for-profit plans are projected to receive about $93 more per enrollee than for-profit plans in 2012, due to their higher average quality ratings.
Nationwide, Medicare Advantage plans are projected to receive $281 in bonuses per enrollee for 2012, on average, including territories, with considerable variation across counties and companies, based on a number of factors.
BACKGROUND
Star Ratings. CMS rates Medicare Advantage plans on a scale of one to five stars, with five stars representing the highest quality. The CMS defines the star ratings in the following manner:
5 Stars Excellent performance 4 Stars Above average performance 3 Stars Average performance 2 Stars Below average performance 1 Star Poor performance
All Health Maintenance Organizations (HMOs), Point of Service (POS) plans, local Preferred Provider Organizations (PPOs), regional PPOs, and Private Fee-for-Service (PFFS) plans are eligible for bonus payments, and are rated by CMS unless they are too new or have too few enrollees. The star ratings are derived from four sources of data: 1) CMS administrative data on plan quality and member satisfaction; 2) the Consumer Assessment of Healthcare Providers and Systems (CAHPS®); 3) the Healthcare Effectiveness Data and Information Set (HEDIS®); and 4) the Health Outcomes Survey (HOS).6 CMS groups the individual quality measures for the 2011 stars into the following nine domains:
Domain Number of measures
Staying healthy: screenings, tests, and vaccines 13
Managing chronic (long term) conditions 10
Drug plan customer service 7
Ratings of health plan responsiveness and care 6
Health plan member complaints, appeals 4
Drug pricing and patient safety 4
Health plan telephone customer service 3 Drug plan member complaints, members who choose to leave, and Medicare audit findings 3
Member experience with drug plan 3

Medicare advantage Plan Star ratingS and BonuS PayMentS in 2012 3
EXHIBIT 2
Counties in which Medicare Advantage Plans Qualify for Double Quality Bonuses, 2012
Not eligible for double bonuses
Double bonus county
SOURCE: Kaiser Family Foundation analysis of the 2011 Medicare Health Plan Quality and Performance Ratings.
Each contract is assigned a number of stars for each of the individual quality measures. The stars for the individual measures are then averaged to obtain an overall summary score for the contract. The individual quality measures are adjusted for patient characteristics, when possible.
Health Reform Law. The health reform law of 2010 required the ratings for Medicare Advantage plans to be used to award quality-based bonus payments, beginning in 2012, to Medicare Advantage plans that either received 4 or more stars, or were not rated by CMS either because they were too new or had too few enrollees. The law required bonus payments to be calculated as a share of the Medicare Advantage benchmarks – the maximum amount Medicare will pay the plan to provide Part A and B benefits in the county – which vary by county. Thus, the size of the bonuses varies by county.7 The plans receiving bonus payments are required to use the additional dollars to provide “extra benefits” (such as eyeglasses or transportation to and from the doctor) for the plans’ enrollees. Thus, in theory, the plans with higher quality ratings should be able to provide a more attractive set of benefits than their competitors, which may lead to higher enrollment in plans with higher quality ratings. Although some suggest that all plans with the same quality ratings should receive the same bonus payments, the current approach ties bonus payments to local benchmarks, which recognizes that the cost of providing extra benefits may vary with the costs of fee-for-service Medicare.
Additionally, the health reform law required bonuses to be doubled for plans that are offered in counties with all the following characteristics: 1) lower than average Medicare fee-for-service costs, 2) a Medicare Advantage penetration rate of 25 percent or more as of December 2009, and 3) a designated urban floor benchmark in 2004. In 2012, Medicare Advantage plans in 210 counties will qualify for double bonus payments (Exhibit 2).
Demonstration. Using their authority to conduct demonstrations, CMS launched a demonstration to test whether providing additional quality-based payments to the Medicare Advantage plans for 2012 to 2014 will lead to more rapid and larger year-to-year quality improvements in plans’ quality scores. The bonus payment policies under the health reform law and the demonstration differ in several ways (Table A1). First, the demonstration expands the number of plans eligible for bonuses by also providing bonuses to plans rated as average performers (3 or 3.5 stars). Second, the demonstration increases the size of the bonuses for all eligible plans (for example, from 1.5% to 4% of benchmarks for 4 star plans). Third, the demonstration applies the bonus payment to the blended benchmark, whereas the health reform law would have applied the bonus payment to only the new (lower) benchmark. In most counties, this difference in application of the benchmark increases the bonuses by six-fold in 2012. The rules for “double bonus counties” as established under the health reform law are maintained under the demonstration. For example, a 3-star plan in a double bonus county will have 6 percent added to their benchmark, whereas a 3-star plan in a neighboring county that does not qualify for double bonuses will have 3 percent added to their benchmark under the demonstration in 2012.

Medicare advantage Plan Star ratingS and BonuS PayMentS in 2012 4
EXHIBIT 3
No Bonus With Health Reform Lawand CMS Demonstration
Illustration of Additional Bonus Payments for 5-star plan, in 2012
Plan Bid ($)
Original Benchmark ($)
New Benchmark, Bonus-Adjusted ($)Original Benchmark +5%
Plan Bid ($)
Rebate = 73% of difference between
the Benchmark and Plan Bid
Bonus Payment73%
73%rebateRebate
SOURCE: Kaiser Family Foundation analysis of the 2011 Medicare Health Plan Quality and Performance Ratings.
EXHIBIT 4
No Bonus With Health Reform Lawand CMS Demonstration
Illustration of Additional Bonus Payments for 3-star plan, in 2012
Plan Bid ($)
Original Benchmark ($)
New Benchmark, Bonus-Adjusted ($)Original Benchmark +3%
Plan Bid ($)
Rebate = 67% of difference between
the Benchmark and Plan Bid
67%67%rebateRebate
Bonus Payment
SOURCE: Kaiser Family Foundation analysis of the 2011 Medicare Health Plan Quality and Performance Ratings.
How Bonus Payments are Calculated: An Illustrative Example
To illustrate how the bonus payments are calculated, take the example of a 5 star plan in County X. First, the plan submits to CMS its bid – the plan’s cost for providing Medicare Part A and B benefits in County X.8 Most plans submit bids that are lower than the county benchmark – the maximum amount Medicare will pay the plan to provide Part A and B benefits in the county. Few plans submit bids that are above the county benchmark. If the bid is below the county benchmark, then the plan receives a share of the difference between the bid and the benchmark. The amount the plan receives is called the rebate, which must be used to provide extra benefits to enrollees, and varies by the plan’s star rating. The rebate for 5 star plans will be 73 percent of the difference between the plan bid and the benchmark in 2012. Five-star plans will have 5 percent added to their benchmark in County X in 2012 (Exhibit 3). The plan then receives 73 percent of the difference between the plan bid and the new, bonus-adjusted benchmark. The additional amount the plan receives in rebates, as a result of the health reform law and the demonstration, is the bonus payment. For a 3-star plan, 3 percent added to their benchmark in County X in 2012 – a smaller increase than for higher rated plans (Exhibit 4). The rebate for a 3-star plan will be 67 percent of the difference between the plan bid and the new, bonus-adjusted benchmark in 2012. The additional amount the plan receives in rebates, as a result of the health reform law and the demonstration, is the bonus payment. As a result, 3-star plans receive smaller bonus payments per enrollee than higher rated plans in the same county.

Medicare advantage Plan Star ratingS and BonuS PayMentS in 2012 5
EXHIBIT 5
3 Star Plans
28%
3.5 Star Plans
33%
4 Star Plans
12%
4.5 Star Plans
19%
5 Star Plans
2%
Missing ratings
5%
Projected Bonus Payments to Medicare Advantage Plans, by Plan Rating
Total Bonus Payments, 2012 = $3.1 Billion
NOTE: Analysis includes U.S. territories.SOURCE: Kaiser Family Foundation analysis of the 2011 Medicare Health Plan Quality and Performance Ratings.
Additional Amount Authorized by Demonstration
96%
Authorized by Health Reform Law
4%
Bonus Payments Authorized by CMS Demonstration, 2012 = $2.9 Billion
FINDINGS Medicare Advantage Plans are Projected to Receive $3.1 Billion in Bonuses in 2012
In 2012, Medicare Advantage plans are projected to receive approximately $3.1 billion in bonus payments. Of this amount, about 4 percent was authorized under the health reform law of 2010, with the majority of these bonus payments (96%) attributable to the CMS demonstration. The expanded bonus payments in 2012 increase overall payments to plans, and are expected to account for about half ($2.9 billion) of the reductions in Medicare Advantage payments ($6 billion in 2012) enacted as part of the health reform law.9 To put the bonus payments into context, the Congressional Budget Office (CBO) projects that Medicare Advantage plans will receive about $115 billion in federal payments in 2012. Thus, the expanded bonus payments will be about 3 percent of total payments to plans.
The bonus payments authorized by the health reform law will increase over time, and will account for a somewhat larger share of total bonus payments in 2013 and 2014. The demonstration expires after 2014, so that any bonus payments provided in 2015 and beyond will derive exclusively from the provisions in the health reform law. About One-Third of Bonus Payments Are Projected to be Provided to Plans Receiving 4 or More Stars
In total, 91 percent of all Medicare Advantage contracts will receive a bonus payment in 2012, because they receive 3 or more stars or were unrated. Nine percent of all contracts will not receive a bonus payment because they received 2 or 2.5 stars; no contract received fewer than 2 stars.
About one-third of the bonus payments will be provided to the 74 contracts with plans rated as above average (4 or 4.5 stars), or excellent (5 stars). Approximately 2 percent will be provided to the 3 contracts that received 5 stars (Exhibit 5).
About two-thirds of total bonus payments will be provided to 271 contracts rated as average (3 or 3.5 stars).
The remaining 6 percent will be provided to 154 contracts that were not rated in 2011, because they were either too new, or had too few enrollees.
The distribution of bonus payments by quality rating roughly corresponds with the distribution of enrollment by plans’ quality ratings. As shown earlier, about 1 percent of Medicare Advantage enrollees were in plans rated as excellent (5 stars); 25 percent of enrollees were in plans rated as above average (4 or 4.5 stars); 59 percent of enrollees were in plans rated as average (3 or 3.5 stars); and 7 percent of enrollees were in plans that were not rated. In addition, 9 percent of enrollees were in plans rated as below average (2 or 2.5 stars).
Medicare advantage Plan Star ratingS and BonuS PayMentS in 2012 6
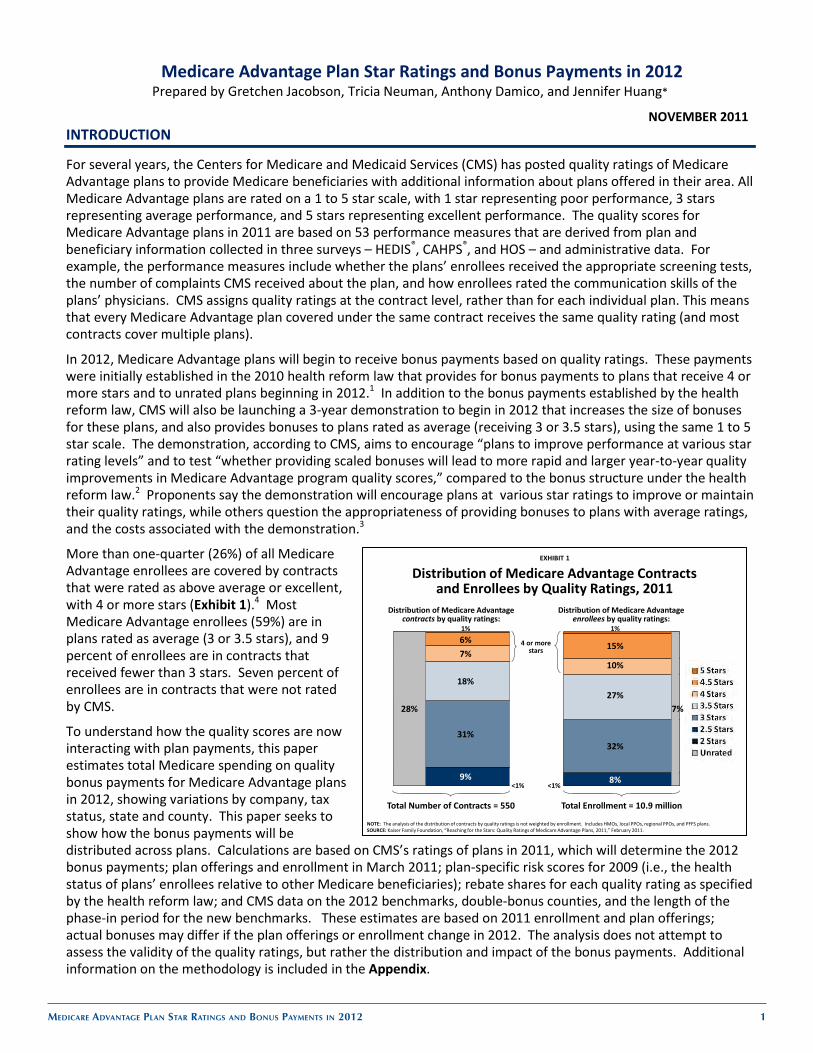
EXHIBIT 6
2.7% 2.9% 3.0%
2.2%
1.4%
Total HMOs Local PPOs PFFS Plans Regional PPOs
Projected Bonuses as a Share of Medicare Advantage Benchmarks, 2012
NOTE: HMO is health maintenance organization; PPO is preferred provider organization; PFFS is private fee for service plans. Analysis includes U.S. territories.SOURCE: Kaiser Family Foundation analysis of the 2011 Medicare Health Plan Quality and Performance Ratings.
Total Bonuses $3,078 million $2,401 million $442 million $107 million $128 million
EXHIBIT 7
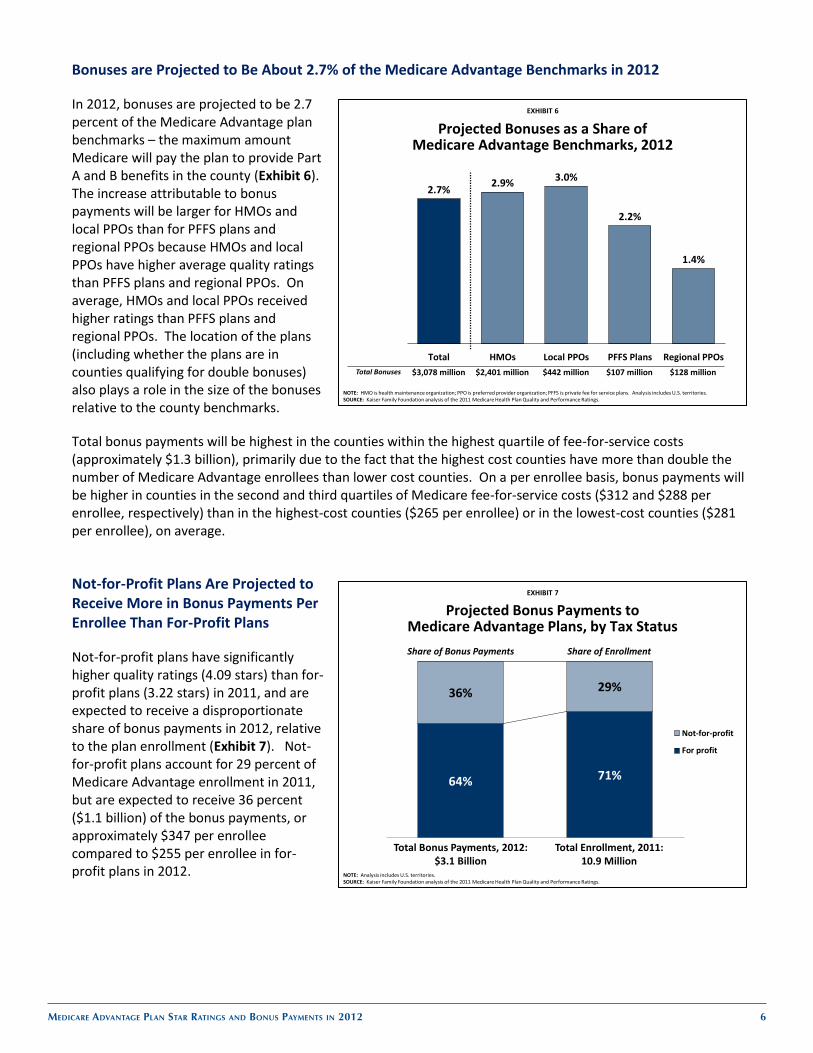
64% 71%
36% 29%
Not-for-profit
For profit
Projected Bonus Payments to Medicare Advantage Plans, by Tax Status
Total Bonus Payments, 2012: $3.1 Billion
NOTE: Analysis includes U.S. territories.SOURCE: Kaiser Family Foundation analysis of the 2011 Medicare Health Plan Quality and Performance Ratings.
Share of Bonus Payments Share of Enrollment
Total Enrollment, 2011: 10.9 Million
Bonuses are Projected to Be About 2.7% of the Medicare Advantage Benchmarks in 2012
In 2012, bonuses are projected to be 2.7 percent of the Medicare Advantage plan benchmarks – the maximum amount Medicare will pay the plan to provide Part A and B benefits in the county (Exhibit 6). The increase attributable to bonus payments will be larger for HMOs and local PPOs than for PFFS plans and regional PPOs because HMOs and local PPOs have higher average quality ratings than PFFS plans and regional PPOs. On average, HMOs and local PPOs received higher ratings than PFFS plans and regional PPOs. The location of the plans (including whether the plans are in counties qualifying for double bonuses) also plays a role in the size of the bonuses relative to the county benchmarks.
Total bonus payments will be highest in the counties within the highest quartile of fee-for-service costs (approximately $1.3 billion), primarily due to the fact that the highest cost counties have more than double the number of Medicare Advantage enrollees than lower cost counties. On a per enrollee basis, bonus payments will be higher in counties in the second and third quartiles of Medicare fee-for-service costs ($312 and $288 per enrollee, respectively) than in the highest-cost counties ($265 per enrollee) or in the lowest-cost counties ($281 per enrollee), on average.
Not-for-Profit Plans Are Projected to Receive More in Bonus Payments Per Enrollee Than For-Profit Plans
Not-for-profit plans have significantly higher quality ratings (4.09 stars) than for-profit plans (3.22 stars) in 2011, and are expected to receive a disproportionate share of bonus payments in 2012, relative to the plan enrollment (Exhibit 7). Not-for-profit plans account for 29 percent of Medicare Advantage enrollment in 2011, but are expected to receive 36 percent ($1.1 billion) of the bonus payments, or approximately $347 per enrollee compared to $255 per enrollee in for-profit plans in 2012.

Medicare advantage Plan Star ratingS and BonuS PayMentS in 2012 7
EXHIBIT 8
$151-$200(13 states, DC)
$201-$300(15 states)
$301-$400(11 states)
$401 or more(2 states)
$100-$150(8 states)
Average Projected Bonus per Enrollee in Medicare Advantage Plans, 2012
Average Projected Bonus per Enrollee = $281
NOTE: Analysis excludes U.S. territories. Plans in Alaska in 2011 could not be matched to risk scores in 2009.SOURCE: Kaiser Family Foundation analysis of the 2011 Medicare Health Plan Quality and Performance Ratings.
DC
306$
N/A
242$ 128$
333$ 423$
211$
193$
295$
170$
375$
262$
182$ 185$
164$
270$ 143$
274$
189$
236$
286$ 286$
104$
354$
149$
179$ 121$
171$
188$
377$
317$
250$
141$
309$
193$
400$
313$ 407$
172$
146$
278$
250$
297$
165$
149$
327$
233$
157$
195$
302$ 255$
EXHIBIT 9
$0
$50
$100
$150
$200
$250
$300
$350
$400
$450
2 2.5 3 3.5 4 4.5 5
Average Projected Bonuses per Enrollee by States’ Average Quality Rating, 2012
Average Bonus per Enrollee in Medicare Advantage Plans
States’ Average Quality RatingNOTE: Analysis excludes U.S. territories.SOURCE: Kaiser Family Foundation analysis of the 2011 Medicare Health Plan Quality and Performance Ratings.
WY
WIWA
VTVA
UT
TX
TN
SD
RI
PA
OR
OK
OH NY
NM
DEDC NJNH
ND
NC
MT
MO
MN
MI
ME
MD
MALAKS
INIL
ID
IA
HI
GA
FL
CT
CO
CA
AR
AZ
AL
SC
NVKY
WV
MS
NE
Bonuses per Enrollee Vary Greatly Across States and Counties in 2012 On average, plans are projected to receive quality bonus payments averaging about $281 per enrollee in 2012, but bonus payments vary across the states and counties within states. Bonus payments are determined as a percentage of each county’s benchmark, which vary from one county to the next and are tied to the cost of fee-for-service Medicare in the county. For example, plans in Jefferson County, Alabama have the same average quality ratings as plans in Jefferson County, Ohio (3.22 stars), but plans in Jefferson County, Alabama will receive more than $250 more per enrollee because it is a double bonus county (as previously defined) and has higher benchmarks than Jefferson County, Ohio. Similarly, plans in Miami-Dade County have similar average quality ratings to plans in neighboring Broward County (3.41 and 3.33, respectively), but plans in Miami-Dade County are projected to receive $454 per enrollee while plans in Broward County are projected to receive $326 per enrollee because Miami-Dade County has higher benchmarks.
Since quality ratings vary across plans, and bonus payments vary by county, based on benchmarks and double bonus status, the bonus payments per enrollee are expected to vary widely across states (Exhibit 8). Plans in two states (CO and RI) are expected to receive more than $400 per enrollee, on average, while plans in eight states (AR, KY, MS, MT, ND, NV, SD and VA) are expected to receive less than $150 per enrollee, on average. (The plans in Alaska in 2011 could not be matched to risk scores in 2009.) As noted earlier, although some suggest that all plans with the same quality ratings should receive the same bonus payments, the current approach ties bonus payments to local benchmarks, which recognizes that the cost of providing extra benefits may vary with the costs of fee-for-service Medicare.
In general, the average bonus payments per enrollee are higher in states with higher average quality ratings, but there are some notable outliers and the relationship between bonuses and quality ratings is not perfectly linear (Exhibit 9). For example, average quality ratings are higher for Medicare Advantage plans in Maine (4.1 stars, on average) than Utah (3.1 stars, on average) but plans in Utah are projected to receive more than $100 more than plans in Maine per enrollee in 2012. This difference is because several large counties in Utah qualify as double bonus counties whereas no counties in Maine do, and because benchmarks tend to be slightly higher in Utah than in Maine. As another example, plans in both Massachusetts and Colorado received about 4.3 stars, on average; however, plans in Colorado will receive more than $130 more per enrollee in bonus payments than plans in Massachusetts because Colorado has some counties that qualify for double bonuses.

Medicare advantage Plan Star ratingS and BonuS PayMentS in 2012 8
EXHIBIT 10
United Healthcare
18%
BCBS Affiliates13%
Humana 12%
Wellpoint5%
HealthSpring3%
Aetna3%
Health Net2%
Coventry 2%
Others30%
Distribution of Projected Bonus Payments to Medicare Advantage Plans by Company or Affiliate, 2012
Kaiser Permanente
12%
Total Bonus Payments, 2012 = $3.1 BillionNOTE: BCBS is Blue Cross Blue Shield Affiliates; Wellpoint BCBS-‐affiliated plans are included in Wellpoint and not included in BCBS. Analysis includes U.S. territories.SOURCE: Kaiser Family Foundation analysis of the 2011 Medicare Health Plan Quality and Performance Ratings.
The Four Largest Companies and Affiliates are Projected to Receive More than Half of the Bonuses
United Healthcare, Blue Cross Blue Shield (BCBS) affiliates, Kaiser Permanente, and Humana are projected to receive more than half (55%) of the aggregate bonus payments in 2012, in part due to the large number of Medicare beneficiaries projected to be enrolled in plans operated by these companies (Exhibit 10). These four companies or affiliates account for 55 percent of Medicare Advantage enrollment in 2011.10
Kaiser Permanente is projected to account for a comparatively large share of total bonus payments, relative to enrollment, because it received higher average quality ratings (4.53 stars) than plans offered by other large Medicare Advantage sponsors. Kaiser Permanente plans, with 9 percent of all Medicare Advantage enrollees, are projected to receive 12 percent of all bonus payments. In contrast, Humana plans, with 15 percent of all Medicare Advantage enrollees, are projected to receive 12 percent of all bonus payments because Humana’s plans received lower quality ratings (3.08 stars) than other large companies, on average.
For all companies and affiliates, bonus payments if limited to those established under the health reform law would have been significantly smaller than the projected bonuses expected to be distributed under the CMS demonstration in 2012 (Exhibit 11). For example, United Healthcare would have received about $6 million in bonuses under the health reform law, but instead is expected to receive more than $540 million in bonuses under the CMS demonstration in 2012. As noted earlier, the analysis of bonus payments by company, as with other analyses in this paper, is based on 2011 enrollment and plan offerings; thus, actual bonuses received in 2012 may be higher or lower based on actual enrollment in 2012.
EXHIBIT 11
$6 $27 $30 $13 $2
$547
$388 $380 $366
$143
Health Reform Law CMS Demonstration
Projected Bonus Payments to Medicare Advantage Plans Under the Health Reform Law and the CMS Demonstration, 2012
NOTE: BCBS is Blue Cross Blue Shield Affiliates; Wellpoint BCBS-‐affiliated plans are included in Wellpoint and not included in BCBS. Analysis includes U.S. territories.SOURCE: Kaiser Family Foundation analysis of the 2011 Medicare Health Plan Quality and Performance Ratings.
Total Bonus per Company (in millions)
United Healthcare BCBS Affiliates HumanaKaiser Permanente Wellpoint

Medicare advantage Plan Star ratingS and BonuS PayMentS in 2012 9
EXHIBIT 12
$0
$50
$100
$150
$200
$250
$300
$350
$400
$450
2 2.5 3 3.5 4 4.5 5
Average Projected Bonus per Medicare Advantage Enrollee, by Companies’ Average Quality Ratings, 2012
Average Bonus per Medicare Advantage Enrollee
Companies’ Average Quality Rating
HumanaWellpoint United
Healthcare
HealthSpring
AetnaHealth Net Coventry
Kaiser Permanente
BCBS AffiliatesEmblemHealth
NOTE: BCBS is Blue Cross Blue Shield Affiliates; Wellpoint BCBS-affiliated plans are included in Wellpoint and not included in BCBS affliates. Analysis includes U.S. territories.SOURCE: Kaiser Family Foundation analysis of the 2011 Medicare Health Plan Quality and Performance Ratings.
EXHIBIT 13
$0
$100
$200
$300
$400
$500
$600
2 2.5 3 3.5 4 4.5 5
Total Projected Bonus by Medicare Advantage Companies’ Average Quality Ratings, 2012
Total Bonus per Company (in millions)
Companies’ Average Quality Rating
Humana
Wellpoint
United Healthcare
HealthSpringAetna
Health Net Coventry
Kaiser Permanente
BCBS Affiliates
EmblemHealth
NOTE: BCBS is Blue Cross Blue Shield Affiliates; Wellpoint BCBS-affiliated plans are included in Wellpoint and not included in BCBS. Analysis includes U.S. territories.SOURCE: Kaiser Family Foundation analysis of the 2011 Medicare Health Plan Quality and Performance Ratings.
Both Plan Location and Quality Ratings Play Significant Roles in the Size of the Quality Bonuses
In general, average bonus payments per Medicare Advantage enrollee increase with the companies’ average quality ratings (Exhibit 12). Among the largest companies and affiliates, Kaiser Permanente plans have the highest average ratings (4.53 stars) and are projected to receive more than $400 in average per enrollee bonuses in 2012. In contrast, Medicare Advantage plans offered by Humana have lower average quality ratings (3.08 stars) and are projected to receive more than $200 per enrollee, on average, in 2012.
However, the location of the plans also plays a large role in the size of the bonus payments. For example, Humana and Wellpoint both have average quality ratings of 3.08 stars, but Wellpoint is projected to receive about $100 more per enrollee in 2012 because Wellpoint’s plans tend to be located in counties with higher benchmarks than the plans offered by Humana. As stated earlier, the current approach of tying bonus payments to the benchmarks recognizes that the cost of providing extra benefits may vary with the costs of fee-for-service Medicare.
For the largest companies and affiliates, the total projected bonuses are driven primarily by the number of plan enrollees rather than the quality ratings (Exhibit 13). For example, Kaiser Permanente and Humana are projected to receive approximately the same amount in total bonuses in 2012, even though average Medicare Advantage plan ratings are higher for Kaiser Permanente (4.53 stars) than Humana’s plan (3.08 stars), because Humana has about 730,000 more enrollees than Kaiser Permanente in 2011.

Medicare advantage Plan Star ratingS and BonuS PayMentS in 2012 10
DISCUSSION
In 2012, virtually all Medicare Advantage plans will receive bonus payments based on their 2011 quality ratings, including plans receiving average quality ratings (3 stars). These bonus payments may create more incentives for plans to focus on quality improvements and ultimately encourage beneficiaries to shift to highly-rated plans. The bonus payments will amount to about half of the savings associated with Medicare Advantage payment reductions in the health reform law for 2012. The bonus payments essentially redistribute some of these savings to Medicare Advantage plans that qualify for quality-based bonus payments. While the original purpose of the quality ratings was to provide more information to Medicare beneficiaries about the quality of Medicare Advantage plans, one recent study suggests that very few seniors are aware of their plan’s quality ratings, and, among those who were aware of the rating system, only about one-third used the ratings to choose their plan.11 However, large Medicare Advantage firms have indicated that they are paying more attention to the ratings because they are tied directly to bonus payments.12 The bonus payments ultimately may affect market share if beneficiaries begin to shift to plans with higher ratings. Additionally, plans receiving 5 stars in 2012 will be able to enroll and market to Medicare beneficiaries throughout 2012. As policymakers continue to focus on strategies to encourage high-performing plans and providers, it will be important to monitor whether quality ratings and bonus payments are associated with better care and improved health outcomes for Medicare Advantage enrollees. *The authors gratefully acknowledge Brian Biles of George Washington University for sharing the plans’ 2009 risk scores with us. REFERENCES 1 Hereinafter, the health reform law refers to the Patient Protection and Affordable Care Act of 2010 (P.L. 111-148; PPACA) as amended by the Health Care and Education Reconciliation Act of 2010 (P.L. 111-152). 2 See Centers for Medicare and Medicaid Services, “Proposed Changes to the Medicare Advantage and the Medicare Prescription Drug Benefit Programs for Contract Year 2012 and Demonstration on Quality Bonus Payments,” November 7, 2010. 3 Letter from Glenn Hackbarth, Chairman of the Medicare Payment Advisory Commission, to Donald Berwick, Administrator of the Centers for Medicare and Medicaid Services, January 6, 2011; available at [http://www.medpac.gov/documents/01062011_MA_COMMENT.pdf]. 4 See Jacobson G, Damico A, Huang J, and Neuman T, “Reaching for the Stars: Quality Ratings of Medicare Advantage Plans, 2011,” Washington DC: Kaiser Family Foundation, February 2011. Also see Jacobson G, Damico A, Neuman T, and Huang J, “Quality Ratings of Medicare Advantage Plans: Key Changes in the Health Reform Law and 2010 Enrollment Data,” Washington DC: Kaiser Family Foundation, September 2010. See also Jacobson G, Damico A, Neuman T, and Huang J, “What’s in the Stars? Quality Ratings of Medicare Advantage Plans, 2010,” Washington DC: Kaiser Family Foundation, December 2009. 5 Congressional Budget Office (CBO) cost estimate of H.R. 4872, Reconciliation Act of 2010, March 20, 2010. 6 The individual measures are adjusted for patient characteristics, to make the survey results more representative of all beneficiaries enrolled in Medicare Advantage. The CAHPS responses to all questions, except those regarding flu and pneumonia shots, are adjusted for patients’ age, education, mental and physical health status, eligibility for Medicaid, eligibility for Medicare Part D low-income subsidies, state of residence, and whether the survey was completed by a proxy. 7 The health reform law of 2010 reduced the Medicare Advantage benchmarks, with the new benchmarks phased-in over six years for most counties. For more information on the length of the phase-in period for benchmarks, see Kaiser Family Foundation, “Reaching for the Stars: Quality Ratings of Medicare Advantage Plans, 2011,” February 2011. 8 For more information, see Kaiser Family Foundation, “Medicare Advantage Fact Sheet,” November 2011. 9 Congressional Budget Office (CBO) cost estimate of H.R. 4872, Reconciliation Act of 2010, March 20, 2010. 10 Gold M, Jacobson G, Damico A, and Neuman T, “Medicare Advantage Enrollment Market Update,” September 2011. 11 Harris Interactive, “Medicare Star Quality Rating System Study: Key Findings,” October 2011; available at [http://xnet.kp.org/newscenter/pressreleases/nat/2011/downloads/101011medicarerankingsHarrisSurveyInfo.pdf]. 12 Gold M, Jacobson G, and Neuman T, “Firm Perspectives on the Medicare Advantage Market,” September 2011.

Medicare advantage Plan Star ratingS and BonuS PayMentS in 2012 11
APPENDIX: Data Sources and Methods
The projections are based on plan offerings and enrollment in March 2011; Medicare Advantage quality ratings for 2011; plan-specific risk scores for 2009; rebate shares for each quality rating for 2012; and CMS data on the 2012 benchmarks, the double-bonus counties, and the length of the phase-in period for the new benchmarks. We applied the plan-specific average risk scores for 2009 to the plans’ enrollees in 2011 (making the assumption that beneficiaries enrolled in Medicare Advantage are as healthy in 2011 as they were in 2009).
To estimate the bonus payments to be provided by the demonstration in 2012, we calculated the difference between the county-specific risk-adjusted benchmarks for 5, 4.5, 4, 3.5 and 3 star plans and the risk-adjusted benchmarks for the 2.5 star plans, to calculate the maximum bonus payments under the demonstration for each plan offered in each county. The unrated plans received the same maximum bonus as a 3 star plan in the same county. We adjusted the maximum bonus payments for each plan by the star-specific rebate shares, as specified in the health reform law of 2010. We assumed plans continued to bid to provide Medicare-covered services as they did before the bonus payments took effect, without making additional adjustments for the small share of plans that previously bid above the benchmark. These assumptions could produce conservative estimates of spending under the demonstration.
For the 17 percent of Medicare Advantage enrollees in 2011 who are in plans that are missing average risk scores for 2009 (because, for example, the plan was not available in 2009), we assumed that these enrollees had the same risk score as the average risk score of other plans of the same type in the same county, differentiating between employer and non-employer group plans. Five percent of Medicare Advantage enrollees in 2011 are not included in the analysis because their plan did not have a risk score for 2009 and there was not a comparable plan of the same plan type in the same county in 2009. The analysis assumes no change in enrollment or plan offerings between 2011 and 2012.

Medicare advantage Plan Star ratingS and BonuS PayMentS in 2012 12
Table A1. Bonus Policy under the Health Reform Law of 2010 and the CMS Demonstration
Quality rating Under health reform law of 2010 Under demonstration
Bonus Bonus 5 star plans 1.5% 5% 4 and 4.5 star plans 1.5% 4% 3.5 star plans None 3.5% 3 star plans None 3% 2 and 2.5 star plans None None 1 star plans None None Unrated: Plans that are too new 1.5% 3% Unrated: Plans with too few enrollees 1.5% 3% Bonus applied to: New benchmark only Blended benchmark Double bonuses for plans in some counties Yes Yes
SOURCE: Kaiser Family Foundation analysis of the health reform law of 2010 and the CMS demonstration.

Medicare advantage Plan Star ratingS and BonuS PayMentS in 2012 13
Table A2. Total Bonus Payments, Average Bonuses per Enrollee, and the Overall Quality Rating, by State
NOTE: All averages weighted by March 2011 enrollment. Plans in Alaska in 2011 could not be matched to risk scores in 2009. SOURCE: Kaiser Family Foundation analysis of the 2011 Medicare Health Plan Quality and Performance Ratings.
Alabama 3.06 $ 52,827,988 $ 278,563 $ 306.02 $ 1.61 AlaskaArizona 3.14 $ 81,817,615 $ 2,031,167 $ 241.71 $ 6.00 Arkansas 2.73 $ 9,251,152 $ 1,297,156 $ 128.33 $ 17.99 California 3.87 $ 571,109,582 $ 24,490,765 $ 332.77 $ 14.27 Colorado 4.32 $ 76,162,539 $ 5,982,453 $ 423.21 $ 33.24 Connecticut 3.42 $ 21,591,220 $ 95,370 $ 210.51 $ 0.93 Delaware 2.97 $ 725,624 $ 52,754 $ 192.73 $ 14.01 District of Columbia 2.88 $ 444,973 $ 4,265 $ 194.74 $ 1.87 Florida 3.24 $ 314,089,582 $ 7,242,169 $ 295.03 $ 6.80 Georgia 2.99 $ 34,072,542 $ 1,055,151 $ 170.26 $ 5.27 Hawaii 3.81 $ 25,648,727 $ 2,191,759 $ 374.65 $ 32.01 Idaho 3.33 $ 16,145,244 $ 868,349 $ 261.61 $ 14.07 Illinois 3.19 $ 27,594,233 $ 1,324,570 $ 181.75 $ 8.72 Indiana 3.14 $ 29,392,211 $ 984,780 $ 184.81 $ 6.19 Iowa 3.31 $ 8,982,546 $ 287,203 $ 164.27 $ 5.25 Kansas 3.21 $ 12,018,113 $ 301,734 $ 270.26 $ 6.79 Kentucky 2.87 $ 13,356,263 $ 371,907 $ 142.90 $ 3.98 Louisiana 3.40 $ 43,848,087 $ 40,118 $ 274.46 $ 0.25 Maine 4.06 $ 4,623,417 $ 457,961 $ 188.64 $ 18.69 Maryland 3.01 $ 8,461,733 $ 125,592 $ 235.70 $ 3.50 Massachusetts 4.33 $ 52,954,053 $ 3,633,021 $ 285.74 $ 19.60 Michigan 3.73 $ 62,021,262 $ 7,175,683 $ 254.94 $ 29.50 Minnesota 4.23 $ 39,593,709 $ 4,705,953 $ 285.94 $ 33.99 Mississippi 2.73 $ 4,453,419 $ 198,236 $ 104.49 $ 4.65 Missouri 3.48 $ 74,037,730 $ 3,956,591 $ 354.43 $ 18.94 Montana 3.40 $ 3,550,716 $ 397,292 $ 149.18 $ 16.69 Nebraska 3.20 $ 4,884,374 $ 160,439 $ 179.32 $ 5.89 Nevada 2.76 $ 13,137,359 $ 462,818 $ 121.43 $ 4.28 New Hampshire 3.01 $ 1,854,404 $ 24,937 $ 170.61 $ 2.29 New Jersey 3.00 $ 31,670,402 $ 118,003 $ 188.07 $ 0.70 New Mexico 3.56 $ 30,335,533 $ 892,326 $ 377.14 $ 11.09 New York 3.58 $ 288,842,437 $ 11,938,841 $ 316.98 $ 13.10 North Carolina 3.39 $ 62,626,221 $ 3,288,643 $ 250.16 $ 13.14 North Dakota 3.06 $ 457,874 $ 67,247 $ 141.19 $ 20.74 Ohio 3.11 $ 157,036,604 $ 4,559,340 $ 308.86 $ 8.97 Oklahoma 3.17 $ 16,708,596 $ 275,199 $ 192.62 $ 3.17 Oregon 3.82 $ 101,250,812 $ 6,011,910 $ 400.41 $ 23.78 Pennsylvania 3.68 $ 268,682,846 $ 14,008,998 $ 312.72 $ 16.30 Rhode Island 3.54 $ 25,733,533 $ 1,305,500 $ 407.43 $ 20.67 South Carolina 2.87 $ 20,286,792 $ 914,053 $ 172.41 $ 7.77 South Dakota 3.21 $ 737,835 $ 69,761 $ 145.82 $ 13.79 Tennessee 3.44 $ 69,698,247 $ 2,599,185 $ 278.31 $ 10.38 Texas 3.20 $ 141,117,508 $ 1,283,210 $ 249.53 $ 2.27 Utah 3.12 $ 25,461,104 $ 457,021 $ 297.49 $ 5.34 Vermont 3.09 $ 807,990 $ 7,601 $ 165.40 $ 1.56 Virginia 3.00 $ 19,523,353 $ 1,120,312 $ 148.55 $ 8.52 Washington 3.84 $ 79,294,562 $ 4,872,273 $ 326.60 $ 20.07 West Virginia 3.36 $ 8,739,715 $ 519,994 $ 232.53 $ 13.84 Wisconsin 3.97 $ 67,685,414 $ 4,801,166 $ 301.83 $ 21.41 Wyoming 3.02 $ 402,329 $ 52,129 $ 156.91 $ 20.33
US TOTAL (50 states, DC) 3.49 $ 3,025,750,121 $ 129,361,466 $ 286.88 $ 12.27 Puerto Rico 2.89 $ 52,636,952 $ - $ 132.80 $ -
US TOTAL, with territories 3.47 $ 3,078,387,073 $ 129,361,466 $ 281.30 $ 11.82
Bonus Payments Average Bonus per Medicare Advantage Enrollee
StateOverall Star
Rating Total, including 2010
Health Reform Law and CMS demonstration
Authorized under 2010 Health Reform Law
Total, including 2010 Health Reform Law and
CMS demonstration
Authorized under 2010 Health Reform Law

Medicare advantage Plan Star ratingS and BonuS PayMentS in 2012 14
Table A3. Total Bonus Payments, Average Bonuses per Enrollee, and the Overall Quality Rating, by Company
NOTE: NA denotes when company has no plans that received ratings. All averages weighted by March 2011 enrollment. The analysis of bonus payments by company, as with other analyses in this paper, is based on 2011 enrollment and plan offerings; thus, actual bonuses received in 2012 may be higher or lower based on actual enrollment in 2012. SOURCE: Kaiser Family Foundation analysis of the 2011 Medicare Health Plan Quality and Performance Ratings.
Community Care, Inc. NA $ 294,419 $ 36,458 $ 829.35 $ 102.70 Fidelis SecureCare NA $ 704,991 $ 107,516 $ 622.23 $ 94.89 AIDS Healthcare Foundation NA $ 699,179 $ 120,314 $ 599.64 $ 103.19 Catholic Health Care System, Inc. NA $ 496,705 $ 43,777 $ 592.73 $ 52.24 Community Health Partnership, Inc. 4.00 $ 851,996 $ 150,371 $ 584.76 $ 103.21 Partnership Healthplan Of California 3.50 $ 3,496,806 $ - $ 569.79 $ - Trillium Community Health Plan 3.50 $ 1,684,872 $ - $ 556.98 $ - Commonwealth Care Alliance, Inc. 4.00 $ 1,462,253 $ 103,623 $ 520.56 $ 36.89 Golden Empire Managed Care 3.50 $ 3,587,684 $ - $ 513.70 $ - Trinity Health 4.00 $ 15,151,756 $ 1,481,157 $ 510.50 $ 49.90 Summa Health System 4.00 $ 11,364,377 $ 1,097,852 $ 507.04 $ 48.98 Bethco Corporation NA $ 103,586 $ 9,678 $ 490.93 $ 45.87 Itasca County Health & Human Services NA $ 226,980 $ 56,745 $ 488.13 $ 122.03 Providence Health & Services 4.00 $ 19,001,198 $ 1,453,092 $ 485.65 $ 37.14 Independent Health Association, Inc. 4.50 $ 31,176,818 $ 2,791,654 $ 485.11 $ 43.44 Guildnet, Inc. NA $ 150,107 $ 12,509 $ 482.66 $ 40.22 Care Wisconsin First, Inc. NA $ 466,644 $ 63,321 $ 481.57 $ 65.35 Essence Group Holdings Corporation 4.09 $ 18,911,961 $ 1,643,627 $ 473.50 $ 41.15 Capital District Physicians' Health Plan, Inc.
4.50 $ 12,544,049 $ 846,965 $ 470.71 $ 31.78
Medica Health Plans 3.99 $ 4,609,161 $ 576,677 $ 457.89 $ 57.29 MVP Health Care, Inc. 4.23 $ 39,695,624 $ 3,461,900 $ 449.83 $ 39.23 HealthPartners, Inc. 4.50 $ 1,294,066 $ 131,156 $ 443.93 $ 44.99 Ardent Health Services. 3.50 $ 12,840,579 $ - $ 439.52 $ - UAB Health System 3.50 $ 15,642,516 $ - $ 438.35 $ - Denver Health Hospital Authority 3.00 $ 1,288,709 $ - $ 432.45 $ - PrimeWest Health System 4.00 $ 1,018,678 $ 203,817 $ 429.82 $ 86.00 Independent Care Health Plan Inc. 3.00 $ 1,786,178 $ - $ 429.47 $ - McKinley Life Insurance Company 4.00 $ 9,005,508 $ 956,188 $ 428.75 $ 45.52 Presbyterian Healthcare Services 3.86 $ 13,105,698 $ 660,891 $ 423.43 $ 21.35 Marion Polk Community Health Plan, LLC
3.00 $ 2,281,730 $ 71,042 $ 419.59 $ 13.06
Centene Corporation NA $ 1,294,521 $ 217,912 $ 419.21 $ 70.57 Renown Health 3.50 $ 3,096,067 $ 11,642 $ 413.91 $ 1.56 Public Health Trust of Miami-Dade County
NA $ 1,001,598 $ 250,399 $ 411.67 $ 102.92
CareSource NA $ 488,173 $ 63,112 $ 410.57 $ 53.08 CareOregon, Inc. 3.00 $ 2,845,659 $ - $ 408.04 $ - Senior Whole Health, LLC 3.50 $ 2,948,820 $ 28,007 $ 404.00 $ 3.84 Kaiser Foundation Health Plan, Inc. 4.53 $ 379,973,894 $ 30,054,862 $ 402.44 $ 31.83 Group Health Cooperative 4.50 $ 26,996,544 $ 2,571,340 $ 400.98 $ 38.19 Gateway Health Plan 3.50 $ 10,593,125 $ - $ 393.91 $ - South Country Health Alliance 4.00 $ 921,510 $ 187,782 $ 384.92 $ 78.44 Geisinger Health System 4.50 $ 18,941,107 $ 2,247,076 $ 377.50 $ 44.78 Chinese Hospital Association 3.00 $ 3,011,618 $ - $ 374.39 $ - AvMed, Inc. 3.50 $ 10,255,996 $ - $ 372.86 $ - AlohaCare 3.50 $ 762,371 $ - $ 362.69 $ - HealthSun Health Plans, Inc 3.00 $ 1,855,189 $ - $ 361.78 $ - Affinity Health System 4.50 $ 15,222,096 $ 1,313,589 $ 361.19 $ 31.17 Spectrum Health System 4.00 $ 17,954,288 $ 2,554,127 $ 348.93 $ 49.64 Affinity Health Plan 3.50 $ 968,273 $ - $ 338.08 $ - Medica HealthCare Plans, Inc. 3.00 $ 10,960,575 $ - $ 330.26 $ - Puget Sound Health Partners, Inc. 3.50 $ 3,661,396 $ - $ 329.41 $ -
Average Bonus per Medicare Advantage EnrolleeOverall Star
RatingCompany name Total, including 2010
Health Reform Law and CMS demonstration
Bonus Payments
Authorized under 2010 Health Reform Law
Total, including 2010 Health Reform Law and
CMS demonstration
Authorized under 2010 Health Reform Law

Medicare advantage Plan Star ratingS and BonuS PayMentS in 2012 15
Table A3. Total Bonus Payments, Average Bonuses per Enrollee, and the Overall Quality Rating, by Company (continued)
NOTE: NA denotes when company has no plans that received ratings. Wellpoint BCBS-affiliated plans are included in Wellpoint and not included in BCBS. All averages weighted by March 2011 enrollment. The analysis of bonus payments by company, as with other analyses in this paper, is based on 2011 enrollment and plan offerings; thus, actual bonuses received in 2012 may be higher or lower based on actual enrollment in 2012. SOURCE: Kaiser Family Foundation analysis of the 2011 Medicare Health Plan Quality and Performance Ratings.
Colorado Access 3.00 $ 999,940 $ - $ 328.71 $ - Metropolitan Health Plan NA $ 301,042 $ 39,116 $ 325.80 $ 42.33 Educators Mutual Insurance Association NA $ 327,569 $ 41,441 $ 324.65 $ 41.07 New Orleans Reg Physician Hosp 3.50 $ 15,103,036 $ - $ 323.78 $ - CIGNA 4.00 $ 11,662,797 $ 1,098,190 $ 323.04 $ 30.42 Universal Care, Inc 3.00 $ 562,494 $ - $ 316.90 $ - HealthSpring, Inc. 3.34 $ 103,608,152 $ 5,874,744 $ 316.58 $ 17.95 SCAN Health Plan, Inc. 3.50 $ 40,443,423 $ 10,244 $ 315.22 $ 0.08 Marshfield Clinic. 5.00 $ 10,179,270 $ 1,524,782 $ 314.25 $ 47.07 InterValley Health Plan 4.00 $ 5,139,661 $ 374,380 $ 313.34 $ 22.82 Coventry Health Care Inc. 3.53 $ 66,945,445 $ 2,452,651 $ 311.98 $ 11.43 Health Net, Inc. 3.37 $ 69,863,049 $ 18,800 $ 310.75 $ 0.08 The New York State Catholic Health Plan, Inc.
3.50 $ 2,585,799 $ - $ 309.31 $ -
Covenant Health System - Hendrick Health System
3.50 $ 884,708 $ - $ 306.55 $ -
KS Plan Administrators, LLC 4.50 $ 5,569,934 $ 348,121 $ 306.50 $ 19.16 WelMed Medical Management, Inc. 3.41 $ 10,463,947 $ - $ 303.95 $ - Aetna Inc. 3.32 $ 88,126,746 $ 225,369 $ 301.30 $ 0.77 TAHMO, Inc. 4.50 $ 26,102,027 $ 1,814,971 $ 296.75 $ 20.63 Preferred Care Partners Holding Corp 3.00 $ 12,116,523 $ - $ 293.40 $ - Clear One Health Plans, Inc. 3.50 $ 3,071,004 $ 17,508 $ 293.34 $ 1.67 Fallon Community Health Plan 4.50 $ 8,862,841 $ 809,986 $ 291.86 $ 26.67 BCBS 3.67 $ 388,270,704 $ 26,589,935 $ 289.84 $ 19.85 Lutheran Medical Center NA $ 590,618 $ 49,750 $ 287.69 $ 24.23 Health Plan of the Upper Ohio Valley 3.50 $ 4,107,145 $ 7,099 $ 287.51 $ 0.50 EmblemHealth, Inc. 3.44 $ 47,785,842 $ - $ 286.54 $ - Honored Citizens Choice Health Plan 3.50 $ 3,585,440 $ - $ 283.41 $ - Health First 4.50 $ 6,541,532 $ 1,215,935 $ 283.09 $ 52.62 CalOptima 3.50 $ 3,250,687 $ - $ 282.57 $ - Cuatro LLC. NA $ 81,000 $ 6,750 $ 282.23 $ 23.52 Vantage Health Plan, Inc. 3.50 $ 1,794,298 $ - $ 279.44 $ - Promedica Health System 3.50 $ 3,969,239 $ - $ 278.58 $ - MetroPlus Health Plan, Inc. 3.00 $ 1,300,066 $ - $ 277.38 $ - Health Alliance Plan (HAP) 4.41 $ 11,602,653 $ 1,571,966 $ 275.79 $ 37.36 Molina Healthcare, Inc., 2.88 $ 6,834,514 $ 195,171 $ 266.32 $ 7.61 UA Healthcare, Inc. 3.00 $ 572,598 $ - $ 266.08 $ - Healthfirst, Inc. 3.00 $ 24,412,137 $ - $ 265.01 $ - Health Plan of San Mateo 3.00 $ 2,115,388 $ - $ 264.13 $ - UnitedHealth Group, Inc. 3.17 $ 547,130,663 $ 6,239,326 $ 262.14 $ 2.99 L.A. Care Health Plan NA $ 398,451 $ 49,806 $ 260.43 $ 32.55 Health Alliance Medical Plans 4.50 $ 2,744,832 $ 510,565 $ 259.17 $ 48.21 Clarian Health Partners, Inc. 4.50 $ 1,967,803 $ 216,444 $ 257.03 $ 28.27 Banner Health 3.50 $ 5,372,683 $ - $ 256.82 $ - IASIS Healthcare 3.00 $ 1,085,525 $ - $ 256.32 $ - UCare Minnesota 4.41 $ 24,692,977 $ 2,774,643 $ 255.93 $ 28.76 Arta Medicare Health Plan, Inc. NA $ 99,842 $ 11,050 $ 252.76 $ 27.97 University of Pittsburgh Medical Center 3.52 $ 24,626,221 $ 153,089 $ 251.83 $ 1.57 Contra Costa Health Services NA $ 39,721 $ 3,310 $ 251.40 $ 20.95 Neighborhood Health Providers, Inc. 4.00 $ 676,646 $ 64,526 $ 251.26 $ 23.96 XLHealth Corporation 2.90 $ 23,574,971 $ 47,857 $ 250.70 $ 0.51 WellCare Health Plans, Inc. 2.99 $ 29,308,216 $ 39,148 $ 249.78 $ 0.33
Company nameOverall Star
Rating
Bonus Payments Average Bonus per Medicare Advantage Enrollee
Total, including 2010 Health Reform Law and
CMS demonstration
Authorized under 2010 Health Reform Law
Total, including 2010 Health Reform Law and
CMS demonstration
Authorized under 2010 Health Reform Law

ThehenryJ.KaiserFamilyFoundaTion
Headquarters: 2400 Sand Hill Road Menlo Park, CA 94025 650.854.9400 Fax: 650.854.4800 Website: www.kff.orgWashington Offices and Barbara Jordan Conference Center: 1330 G Street, NW Washington, DC 20005 202.347.5270 Fax: 202.347.5274
The Kaiser Family Foundation, a leader in health policy analysis, health journalism and communication, is dedicated to filling the need for trusted, independent information on the major health issues facing our nation and its people. The Foundation is a non-profit private operating foundation, based in Menlo Park, California.
Thispublication(#8257)isavailableontheKaiserFamilyFoundation’swebsiteatwww.kff.org.
Table A3. Total Bonus Payments, Average Bonuses per Enrollee, and the Overall Quality Rating, by Company (continued)
NOTE: NA denotes when company has no plans that received ratings. All averages weighted by March 2011 enrollment. The analysis of bonus payments by company, as with other analyses in this paper, is based on 2011 enrollment and plan offerings; thus, actual bonuses received in 2012 may be higher or lower based on actual enrollment in 2012. SOURCE: Kaiser Family Foundation analysis of the 2011 Medicare Health Plan Quality and Performance Ratings.
Universal American Corp. 3.29 $ 40,403,202 $ 2,149,200 $ 248.94 $ 13.24 Wellpoint, Inc. 3.08 $ 142,555,525 $ 1,510,119 $ 248.82 $ 2.64 Alameda Alliance for Health 3.00 $ 845,621 $ - $ 247.76 $ - Golden State Medicare Health Plan NA $ 147,636 $ 18,454 $ 246.47 $ 30.81 Inland Empire Health Plan 3.50 $ 1,109,367 $ - $ 241.11 $ - Touchstone Health Partnership, Inc 3.00 $ 3,812,264 $ 1,800 $ 235.37 $ 0.11 Health Services Group, Inc. 3.50 $ 1,370,801 $ - $ 234.37 $ - Midwest Health Plan, Inc. NA $ 87,547 $ 20,952 $ 231.60 $ 55.43 Care1st Health Plan 3.00 $ 3,595,040 $ - $ 229.88 $ - America's 1st Choice Holdings of Florida, LLC
3.00 $ 13,142,696 $ - $ 228.16 $ -
Gundersen Lutheran Health System Inc. 4.50 $ 2,848,625 $ 305,681 $ 227.36 $ 24.40 Physicians United Plan, Inc. 3.00 $ 3,423,359 $ - $ 225.64 $ - HealthPlus of Michigan 3.50 $ 3,316,904 $ 10,866 $ 224.31 $ 0.73 MD Care, Inc. 3.00 $ 3,240,917 $ - $ 224.15 $ - Advantage Health Solutions 3.50 $ 1,377,234 $ 38,212 $ 223.72 $ 6.21 Mid Rogue Community Health Plan 3.50 $ 875,707 $ - $ 223.05 $ - Community Health Group NA $ 200,876 $ 25,109 $ 221.96 $ 27.75 Humana Inc. 3.08 $ 366,461,340 $ 12,614,534 $ 219.46 $ 7.55 Elderplan, Inc. NA $ 3,110,414 $ 259,201 $ 217.09 $ 18.09 CommunityCare Managed Healthcare Plans of OK, Inc.
3.50 $ 5,913,817 $ - $ 214.72 $ -
Easy Choice Health Plan Inc. 3.00 $ 2,432,454 $ - $ 214.54 $ - Samaritan Health Services 3.50 $ 1,117,964 $ - $ 211.74 $ - Vanguard Health Systems 3.00 $ 558,248 $ - $ 209.87 $ - North Texas Specialty Physicians NA $ 613,383 $ 51,115 $ 208.00 $ 17.33 Dr. Kiran C. Patel 3.50 $ 2,736,512 $ 210,614 $ 205.40 $ 15.81 AMERIGROUP Corporation 2.79 $ 3,710,412 $ 140,730 $ 203.44 $ 7.72 Aveta, LLC. 3.00 $ 28,599,172 $ - $ 196.60 $ - Sentara Healthcare 3.50 $ 2,632,203 $ - $ 194.72 $ - ATRIO Health Plans 3.50 $ 1,166,765 $ 156,939 $ 193.30 $ 26.00 Carilion Services, Inc. NA $ 64,505 $ 6,551 $ 186.97 $ 18.99 Martin's Point Health Care, Inc. 4.50 $ 1,734,178 $ 278,105 $ 163.83 $ 26.27 Medical Card System, Inc. 3.00 $ 18,314,586 $ - $ 156.46 $ - Baystate Health, Inc. NA $ 764,931 $ 89,612 $ 153.60 $ 17.99 New West Health Services 3.50 $ 1,323,094 $ - $ 150.08 $ - Mapfre Praico Corporation 3.00 $ 1,278,092 $ - $ 142.49 $ - Arcadian Management Services Inc. 2.84 $ 9,212,080 $ 71,360 $ 137.74 $ 1.07 First Medical Health Plan, Inc. 3.00 $ 1,785,657 $ - $ 112.97 $ - Munich American Holding Corporation 2.61 $ 6,628,602 $ 730,289 $ 94.33 $ 10.39 Universal Health Care Inc. 2.50 $ 5,725,874 $ 695,170 $ 62.43 $ 7.58 Central Health Plan of California 2.50 $ - $ - $ - $ - Community Health Plan of Washington 2.50 $ - $ - $ - $ - FamilyCare Incorporated 2.50 $ - $ - $ - $ - HF Management Services, LLC 2.50 $ - $ - $ - $ - Liberty Health Advantage, Inc. 2.50 $ - $ - $ - $ - QHP Group, Inc. 2.50 $ - $ - $ - $ - University Health Care, Inc. 2.50 $ - $ - $ - $ - Visiting Nurse Service of New York 2.50 $ - $ - $ - $ -
Company nameOverall Star
Rating
Bonus Payments Average Bonus per Medicare Advantage Enrollee
Total, including 2010 Health Reform Law and
CMS demonstration
Authorized under 2010 Health Reform Law
Total, including 2010 Health Reform Law and
CMS demonstration
Authorized under 2010 Health Reform Law