
Medical Surveillance Monthly Report Volume 25 Number 3 ...
28
MEDICAL SURVEILLANCE MONTHLY REPORT MSMR A publication of the Armed Forces Health Surveillance Branch MARCH 2018 Volume 25 Number 3 PAGE 2 Mental health disorders and mental health problems, active component, U.S. Armed Forces, 2007–2016 Shauna Stahlman, PhD, MPH; Alexis A. Oetting, MPH PAGE 12 Incidence rates of diagnoses of cardiovascular diseases and associated risk factors, active component, U.S. Armed Forces, 2007–2016 Francis L. O'Donnell, MD, MPH; Shauna Stahlman, PhD, MPH; Alexis Oetting, MPH PAGE 19 Herpes zoster, active component, U.S. Armed Forces, 2000–2016 Valerie F. Williams, MA, MS; Shauna Stahlman, PhD, MPH; Saixia Ying, PhD
Transcript of Medical Surveillance Monthly Report Volume 25 Number 3 ...

M E D I C A L S U R V E I L L A N C E M O N T H L Y R E P O R T
MSMR
A publication of the Armed Forces Health Surveillance Branch
MARCH 2018
Volume 25Number 3
P A G E 2 Mental health disorders and mental health problems, active component, U.S. Armed Forces, 2007–2016Shauna Stahlman, PhD, MPH; Alexis A. Oetting, MPH
P A G E 1 2 Incidence rates of diagnoses of cardiovascular diseases and associated risk factors, active component, U.S. Armed Forces, 2007–2016Francis L. O'Donnell, MD, MPH; Shauna Stahlman, PhD, MPH; Alexis Oetting, MPH
P A G E 1 9 Herpes zoster, active component, U.S. Armed Forces, 2000–2016Valerie F. Williams, MA, MS; Shauna Stahlman, PhD, MPH; Saixia Ying, PhD
MSMR Vol. 25 No. 3 March 2018 Page 2
Mental health disorders have historically accounted for significant morbid-ity, healthcare utilization, disability, and attrition from military service. From 2007 through 2016, a total of 853,060 active component service members were diagnosed with at least one mental health disorder and 115,378 were diagnosed with mental health problems related to family/support group problems, maltreatment, lifestyle problems, or substance abuse counseling. Annual rates of incident diagnoses of at least one mental health disorder decreased by approximately 6.2% during the period. Most of the incident mental health disorder diagnoses were attributable to adjustment disorders, depressive disorders, and anxiety disorders. Similar to the findings of a pre-vious MSMR report, rates of incident mental health disorders were gener-ally higher among females and Army members, and declined with increasing age. The number of individuals affected by any mental health diagnosis dur-ing deployment to a U.S. Central Command area of responsibility decreased from 10,951 in 2008 to 3,239 in 2016. Ongoing efforts to assist and treat ser-vice members should continue to promote help-seeking behavior to improve psychological and emotional well-being of service members and reduce the burden of mental health disorders.
In 2016, mental health disorders accounted for the largest total number of hospital bed days and the third high-
est total number of medical encounters for members of the active component of the U.S. Armed Forces.1 A prior MSMR docu-mented the increasing incidence of PTSD, anxiety disorders, depressive disorders, adjustment disorders, and other mental health disorders from 2003 through 2011.2
Between 2000 and 2011, the highest inci-dence rates of mental health disorders diag-nosed among active component service members were for adjustment disorders, “other” mental health disorders, depressive disorders, alcohol abuse or dependence,
and anxiety disorders, respectively.2 In general, crude incidence rates of mental health disorders were highest among ser-vice members in the Army, females, and in younger age groups.2
Psychosocial and behavioral health problems related to difficult life circum-stances (e.g., marital, family, other inter-personal relationships) are also important to consider for comprehensive surveillance of service members’ mental health; these are often documented using V-codes in ICD-9 and Z-codes in ICD-10. For exam-ple, one study found that service members who received mental health care (docu-mented with V-coded diagnoses) were at
greater risk of attrition from military ser-vice than those treated for only physical health conditions but at less risk of attri-tion than those who received mental health disorder–specific diagnoses.3 In addition, Skopp et al. reported that service members with V-coded diagnoses indicating partner or family problems were at increased risk of suicide.4
This report summarizes the numbers, natures, and rates of incident mental health disorder diagnoses among active compo-nent U.S. service members over a 10-year surveillance period. It also summarizes the numbers, natures, and rates of incident “mental health problems” (documented with mental health–related V- or Z-codes in ICD-9 or ICD-10, respectively) among active component service members during the same period.
M E T H O D S
The surveillance period was 1 January 2007 through 31 December 2016. The sur-veillance population included all individ-uals who served in the active component of the Army, Navy, Air Force, or Marine Corps at any time during the surveillance period. All data used to determine inci-dent mental health disorder–specific diag-noses and mental health problems were derived from records routinely maintained in the Defense Medical Surveillance Sys-tem (DMSS). These records document both ambulatory encounters and hospi-talizations of active component members of the U.S. Armed Forces in fixed military and civilian (if reimbursed through the Military Health System) treatment facili-ties. Cases of each mental health disorder
Mental Health Disorders and Mental Health Problems, Active Component, U.S. Armed Forces, 2007–2016Shauna Stahlman, PhD, MPH; Alexis A. Oetting, MPH
March 2018 Vol. 25 No. 3 MSMR Page 3
that occurred during periods of deploy-ment to a U.S. Central Command (CENT-COM) area of responsibility (AOR) were evaluated separately. These diagnoses were derived from records of medical encoun-ters of deployed service members that were documented in the Theater Medical Data Store (TMDS).
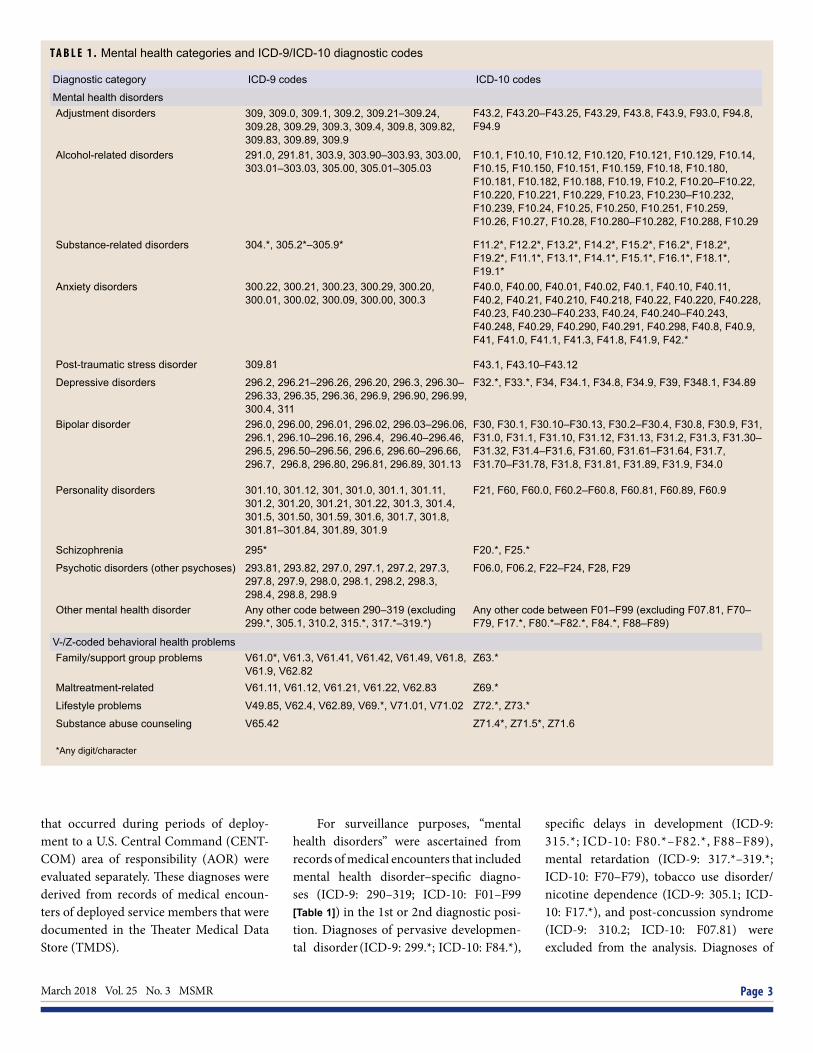
For surveillance purposes, “mental health disorders” were ascertained from records of medical encounters that included mental health disorder–specific diagno-ses (ICD-9: 290–319; ICD-10: F01–F99 [Table 1]) in the 1st or 2nd diagnostic posi-tion. Diagnoses of pervasive developmen-tal disorder (ICD-9: 299.*; ICD-10: F84.*),
specific delays in development (ICD-9: 315.*; ICD-10: F80.*–F82.*, F88–F89), mental retardation (ICD-9: 317.*–319.*; ICD-10: F70–F79), tobacco use disorder/nicotine dependence (ICD-9: 305.1; ICD-10: F17.*), and post-concussion syndrome (ICD-9: 310.2; ICD-10: F07.81) were excluded from the analysis. Diagnoses of
T A B L E 1 . Mental health categories and ICD-9/ICD-10 diagnostic codes
Diagnostic category ICD-9 codes ICD-10 codes
Mental health disordersAdjustment disorders 309, 309.0, 309.1, 309.2, 309.21–309.24,
309.28, 309.29, 309.3, 309.4, 309.8, 309.82, 309.83, 309.89, 309.9
F43.2, F43.20–F43.25, F43.29, F43.8, F43.9, F93.0, F94.8, F94.9
Alcohol-related disorders 291.0, 291.81, 303.9, 303.90–303.93, 303.00, 303.01–303.03, 305.00, 305.01–305.03
F10.1, F10.10, F10.12, F10.120, F10.121, F10.129, F10.14, F10.15, F10.150, F10.151, F10.159, F10.18, F10.180, F10.181, F10.182, F10.188, F10.19, F10.2, F10.20–F10.22, F10.220, F10.221, F10.229, F10.23, F10.230–F10.232, F10.239, F10.24, F10.25, F10.250, F10.251, F10.259, F10.26, F10.27, F10.28, F10.280–F10.282, F10.288, F10.29
Substance-related disorders 304.*, 305.2*–305.9* F11.2*, F12.2*, F13.2*, F14.2*, F15.2*, F16.2*, F18.2*, F19.2*, F11.1*, F13.1*, F14.1*, F15.1*, F16.1*, F18.1*, F19.1*
Anxiety disorders 300.22, 300.21, 300.23, 300.29, 300.20, 300.01, 300.02, 300.09, 300.00, 300.3
F40.0, F40.00, F40.01, F40.02, F40.1, F40.10, F40.11, F40.2, F40.21, F40.210, F40.218, F40.22, F40.220, F40.228, F40.23, F40.230–F40.233, F40.24, F40.240–F40.243, F40.248, F40.29, F40.290, F40.291, F40.298, F40.8, F40.9, F41, F41.0, F41.1, F41.3, F41.8, F41.9, F42.*
Post-traumatic stress disorder 309.81 F43.1, F43.10–F43.12
Depressive disorders 296.2, 296.21–296.26, 296.20, 296.3, 296.30–296.33, 296.35, 296.36, 296.9, 296.90, 296.99, 300.4, 311
F32.*, F33.*, F34, F34.1, F34.8, F34.9, F39, F348.1, F34.89
Bipolar disorder 296.0, 296.00, 296.01, 296.02, 296.03–296.06, 296.1, 296.10–296.16, 296.4, 296.40–296.46, 296.5, 296.50–296.56, 296.6, 296.60–296.66, 296.7, 296.8, 296.80, 296.81, 296.89, 301.13
F30, F30.1, F30.10–F30.13, F30.2–F30.4, F30.8, F30.9, F31, F31.0, F31.1, F31.10, F31.12, F31.13, F31.2, F31.3, F31.30–F31.32, F31.4–F31.6, F31.60, F31.61–F31.64, F31.7, F31.70–F31.78, F31.8, F31.81, F31.89, F31.9, F34.0
Personality disorders 301.10, 301.12, 301, 301.0, 301.1, 301.11, 301.2, 301.20, 301.21, 301.22, 301.3, 301.4, 301.5, 301.50, 301.59, 301.6, 301.7, 301.8, 301.81–301.84, 301.89, 301.9
F21, F60, F60.0, F60.2–F60.8, F60.81, F60.89, F60.9
Schizophrenia 295* F20.*, F25.*
Psychotic disorders (other psychoses) 293.81, 293.82, 297.0, 297.1, 297.2, 297.3, 297.8, 297.9, 298.0, 298.1, 298.2, 298.3, 298.4, 298.8, 298.9
F06.0, F06.2, F22–F24, F28, F29
Other mental health disorder Any other code between 290–319 (excluding 299.*, 305.1, 310.2, 315.*, 317.*–319.*)
Any other code between F01–F99 (excluding F07.81, F70–F79, F17.*, F80.*–F82.*, F84.*, F88–F89)
V-/Z-coded behavioral health problemsFamily/support group problems V61.0*, V61.3, V61.41, V61.42, V61.49, V61.8,
V61.9, V62.82Z63.*
Maltreatment-related V61.11, V61.12, V61.21, V61.22, V62.83 Z69.*
Lifestyle problems V49.85, V62.4, V62.89, V69.*, V71.01, V71.02 Z72.*, Z73.*
Substance abuse counseling V65.42 Z71.4*, Z71.5*, Z71.6
*Any digit/character

MSMR Vol. 25 No. 3 March 2018 Page 4
“mental health problems” were ascertained from records of healthcare encounters that included V- or Z-coded diagnoses indica-tive of psychosocial or behavioral health issues in the 1st or 2nd diagnostic posi-tion (Table 1). “Family/support group prob-lems” included family disruption, health problems within the family, bereavement, and other family problems; “maltreatment” included counseling and other encoun-ters for victims or perpetrators of abuse; “lifestyle problems” included social mal-adjustment, lack of exercise, high-risk sex-ual behavior, sleep deprivation, and other psychological or physical stress; and “sub-stance abuse counseling” included counsel-ing encounters for substance use and abuse.
Each incident diagnosis of a mental health disorder or a mental health prob-lem was defined by a hospitalization with an indicator diagnosis in the 1st or 2nd diagnostic position; two outpatient visits within 180 days documented with indica-tor diagnoses (from the same mental health disorder or mental health problem–spe-cific category) in the 1st or 2nd diagnostic positions; or a single outpatient visit in a psychiatric or mental healthcare specialty setting (defined by Medical Expense and Performance Reporting System [MEPRS] code beginning with “BF”) with an indica-tor diagnosis in the 1st or 2nd diagnostic position. The case definition for schizo-phrenia required either a single hospital-ization with a diagnosis of schizophrenia in the 1st or 2nd diagnostic position or four outpatient encounters with a diagno-sis of schizophrenia in the 1st or 2nd diag-nostic position. Schizophrenia cases who remained in the military for more than 2 years after becoming incident cases were excluded as these cases were assumed to have been misdiagnosed.
Service members who were diagnosed with one or more mental health disorders prior to the surveillance period (i.e., prev-alent cases) were not considered at risk of incident diagnoses of the same conditions during the period. Service members who were diagnosed with more than one men-tal health disorder during the surveillance period were considered incident cases in each category in which they fulfilled the case-defining criteria. Service members could be incident cases only once in each
mental health disorder–specific category. Only service members with no incident mental health disorder–specific diagnoses (ICD-9: 290–319; ICD-10: F01–F99) dur-ing the surveillance period were eligible for inclusion as cases of incident mental health problems (selected V- or Z-codes).
R E S U L T S
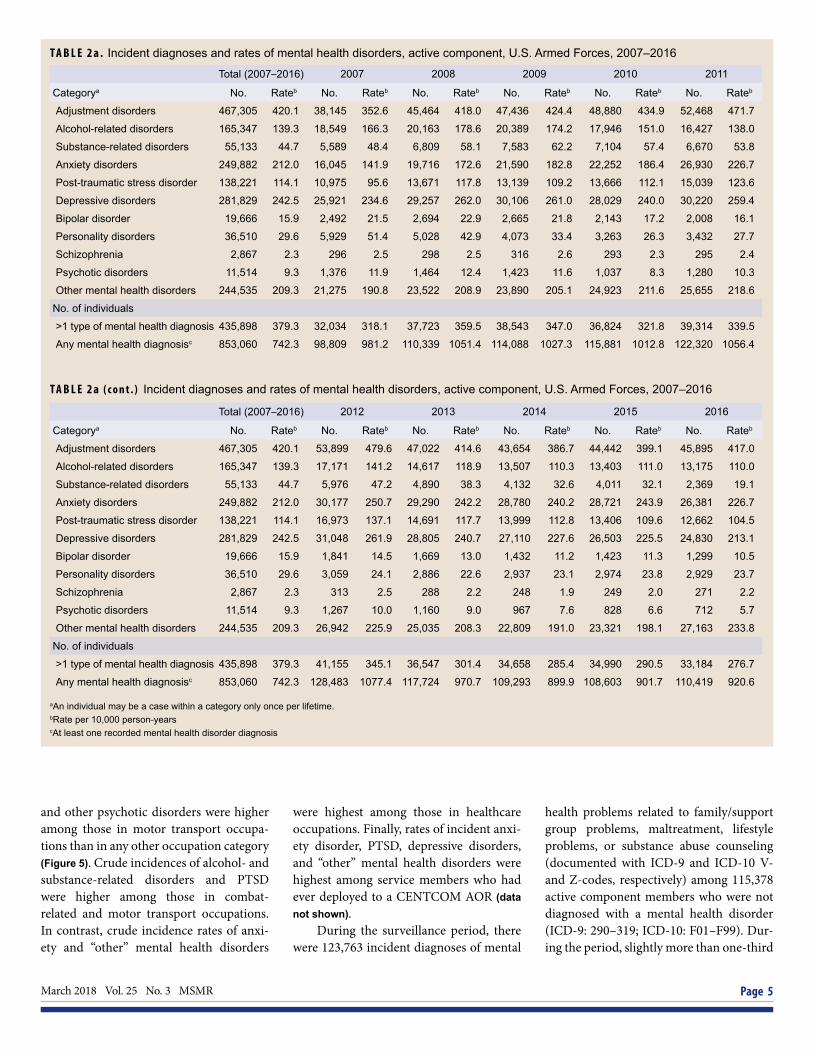
During the 10-year surveillance period, 853,060 active component service members were diagnosed with at least one mental health disorder; of these individu-als, 435,898 (51.1%) were diagnosed with mental health disorders in more than one diagnostic category. Overall, there were 1,672,809 incident diagnoses of mental health disorders in all diagnostic catego-ries (Table 2a). Annual numbers and rates of incident diagnoses of at least one men-tal health disorder decreased by 6.2% dur-ing the period, from 981.2 cases per 10,000 person-years (p-yrs) in 2007 to 920.6 cases per 10,000 p-yrs in 2016.
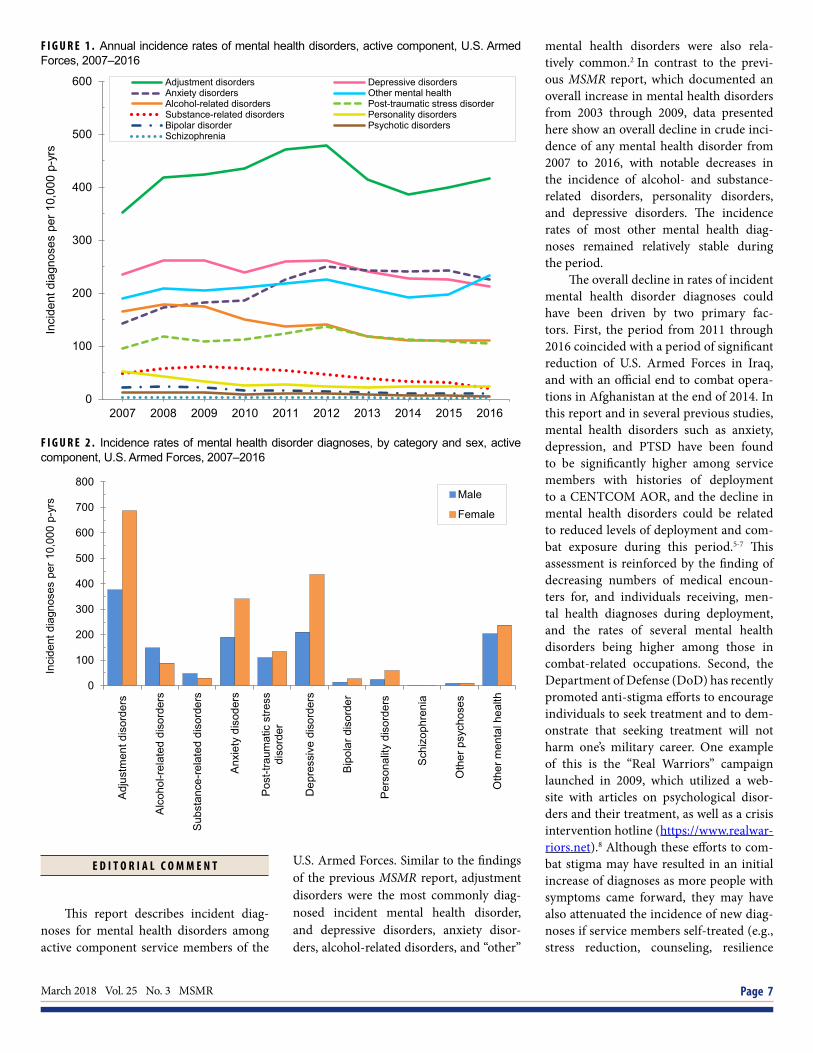
Over the entire period, 92.4% of all incident mental health disorder diagno-ses were attributable to adjustment dis-orders (n=467,305; 27.9%), depressive disorders (n=281,829; 16.8%), anxiety dis-orders (n=249,882; 14.9%), “other” men-tal health disorders (n=244,535; 14.6%); alcohol-related disorders (165,347; 9.9%), and PTSD (138,221; 8.3%). In compari-son, relatively few incident diagnoses were attributable to substance-related disorders (n=55,133; 3.3%), personality disorders (36,510; 2.2%), bipolar disorder (19,666; 1.2%), psychotic disorders (11,514; 0.7%), and schizophrenia (2,867; 0.2%) (Table 2a).
It was common for individuals who were diagnosed with alcohol- or substance-related disorders to also be diagnosed with other mental health disorders during the period. Among individuals who were diag-nosed with alcohol-related disorders, 40.6% were also diagnosed with incident adjust-ment disorder and 31.9% with depressive disorder. Among those diagnosed with substance-related disorders, 54.8% were diagnosed with alcohol-related disorders and 46.6% were diagnosed with adjustment disorders (data not shown).
Crude annual rates of incident diagno-ses of alcohol-related disorders, substance-related disorders, and depressive disorders declined during the surveillance period. In contrast, crude annual incidence rates of diagnoses of anxiety disorders increased, and all other mental health diagnoses were relatively stable during the period (Figure 1).
In all categories of mental health dis-orders, the proportions of incident diagno-ses that affected military members in their first 6 months of service generally declined from 2007 through 2011 and remained sta-ble from 2011 through 2016; however, the proportions of other psychotic disorders and schizophrenia diagnosed within the first 6 months of service increased slightly during 2015–2016. The mental health dis-orders that were relatively most frequently diagnosed in the first 6 months of service were personality disorders (11.3%), psy-chotic disorders (10.5%), and adjustment disorders (10.0%) (data not shown).
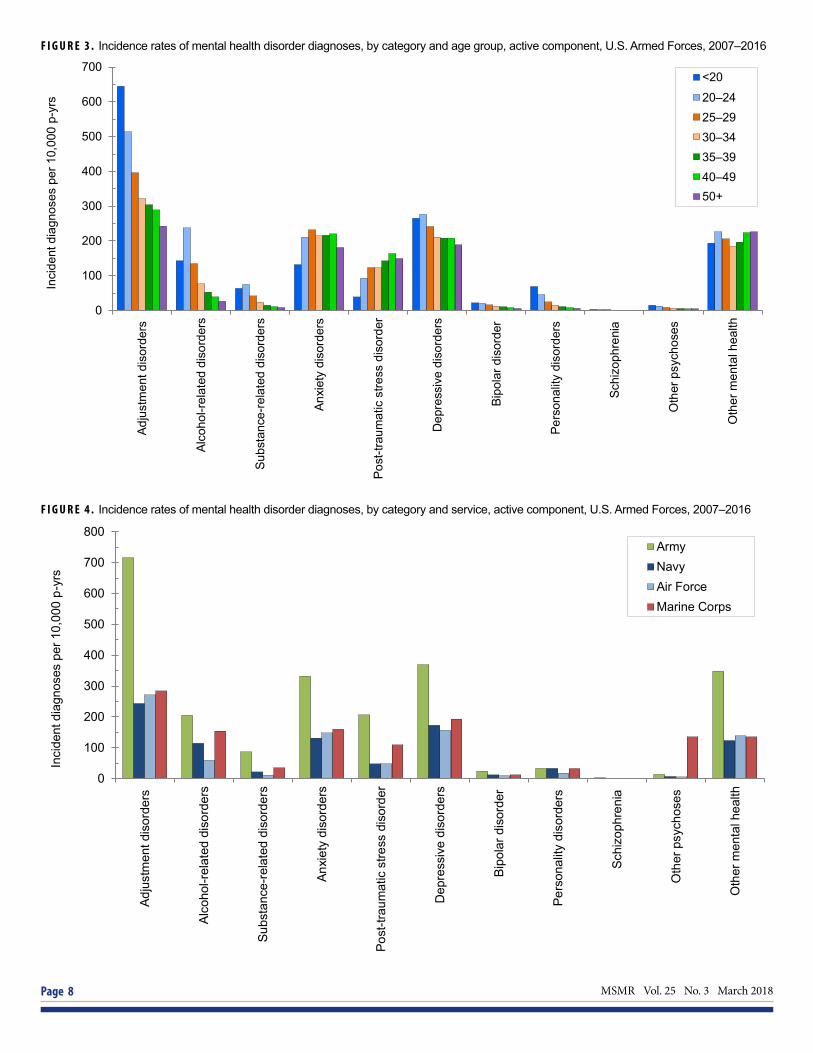
In general, rates of incident men-tal health disorder diagnoses were higher among females than males, except for schizophrenia, for which rates were similar between the two sexes (Figure 2). In addi-tion, rates of both alcohol- and substance-related disorders were higher among men. Rates of most mental health disorder diag-noses declined with increasing age (Figure 3). In particular, crude incidence rates of adjustment, bipolar, personality, and psy-chotic disorders were higher among the youngest (less than 20 years old), compared to any older age group of service members. Rates of alcohol- and substance-related dis-orders, depressive disorders, schizophre-nia, and “other” mental health disorders were highest among service members aged 20–24 years, and the rate of anxiety disor-ders was highest among those aged 25–29 years (Figure 3). In contrast, the rate of PTSD was highest among service members in their 40s.
Overall incidence rates of mental health disorders were higher in the Army than in any of the other services (Figure 4). The Army also had the highest crude inci-dence rates for each category of mental health disorders except other psychoses. Crude incidence rates for adjustment dis-orders, depressive disorders, personality disorders, bipolar disorder, schizophrenia,
March 2018 Vol. 25 No. 3 MSMR Page 5
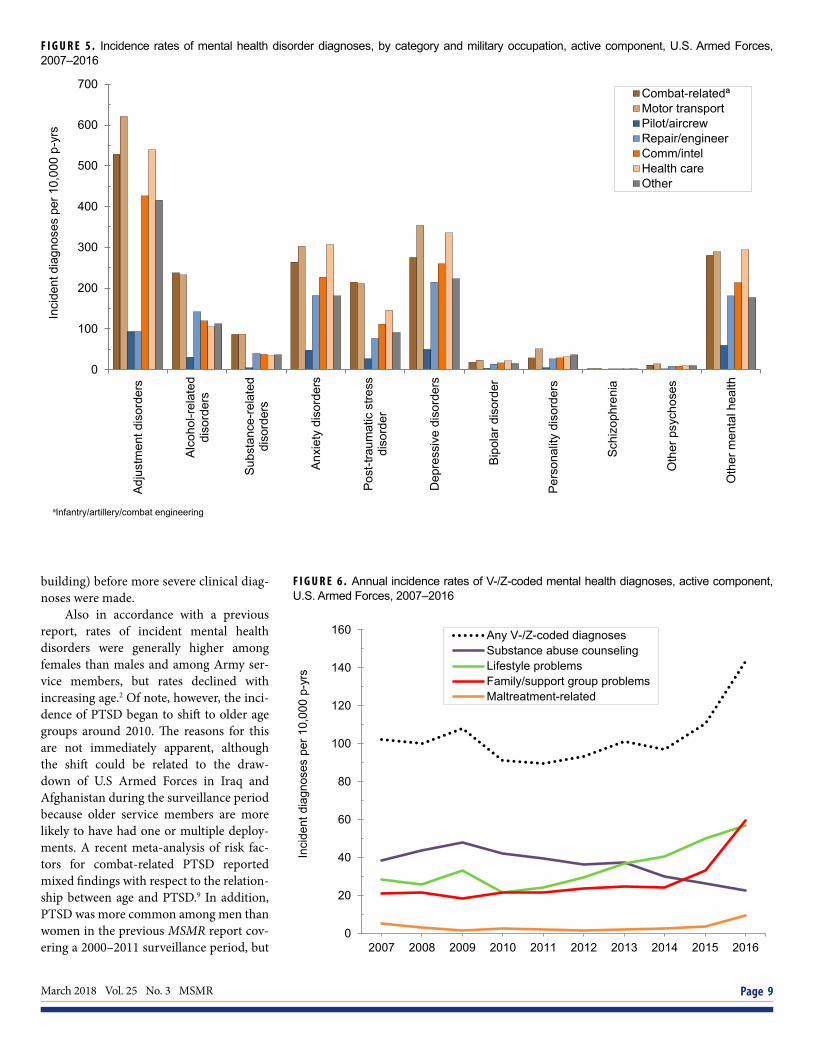
and other psychotic disorders were higher among those in motor transport occupa-tions than in any other occupation category (Figure 5). Crude incidences of alcohol- and substance-related disorders and PTSD were higher among those in combat-related and motor transport occupations. In contrast, crude incidence rates of anxi-ety and “other” mental health disorders
were highest among those in healthcare occupations. Finally, rates of incident anxi-ety disorder, PTSD, depressive disorders, and “other” mental health disorders were highest among service members who had ever deployed to a CENTCOM AOR (data not shown).
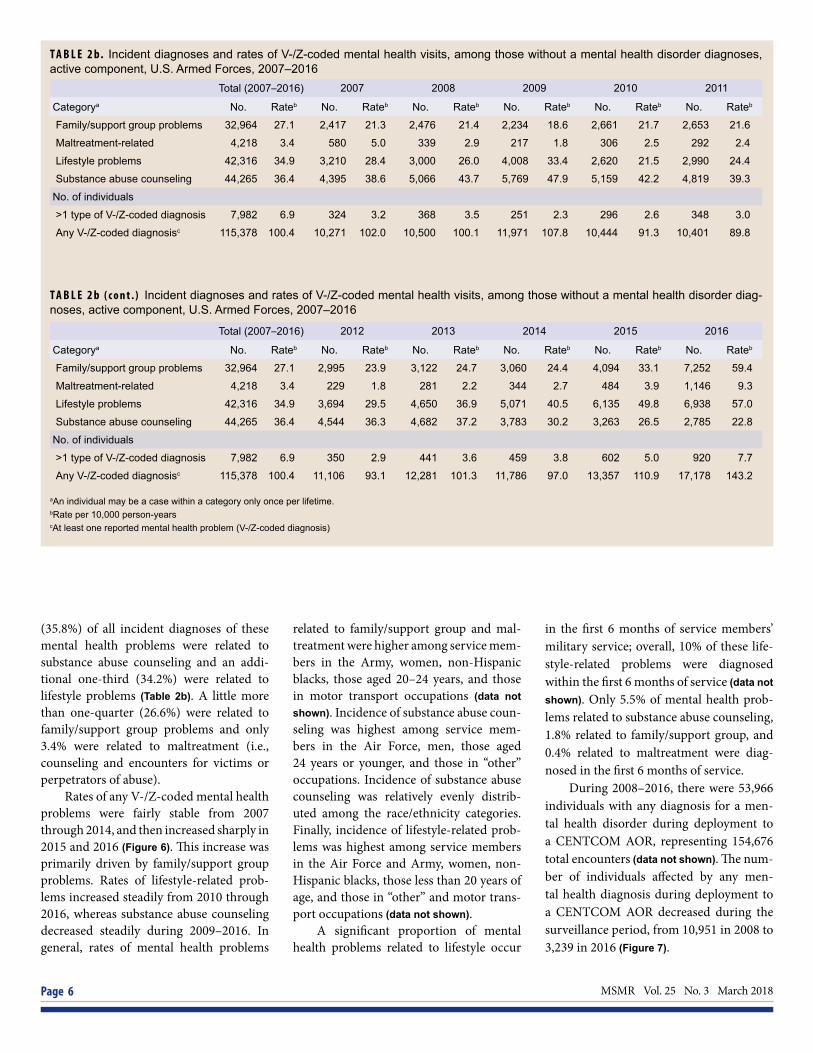
During the surveillance period, there were 123,763 incident diagnoses of mental
health problems related to family/support group problems, maltreatment, lifestyle problems, or substance abuse counseling (documented with ICD-9 and ICD-10 V- and Z-codes, respectively) among 115,378 active component members who were not diagnosed with a mental health disorder (ICD-9: 290–319; ICD-10: F01–F99). Dur-ing the period, slightly more than one-third
T A B L E 2 a . Incident diagnoses and rates of mental health disorders, active component, U.S. Armed Forces, 2007–2016
T A B L E 2 a ( c o n t . ) Incident diagnoses and rates of mental health disorders, active component, U.S. Armed Forces, 2007–2016
Total (2007–2016) 2007 2008 2009 2010 2011
Categorya No. Rateb No. Rateb No. Rateb No. Rateb No. Rateb No. Rateb
Adjustment disorders 467,305 420.1 38,145 352.6 45,464 418.0 47,436 424.4 48,880 434.9 52,468 471.7
Alcohol-related disorders 165,347 139.3 18,549 166.3 20,163 178.6 20,389 174.2 17,946 151.0 16,427 138.0
Substance-related disorders 55,133 44.7 5,589 48.4 6,809 58.1 7,583 62.2 7,104 57.4 6,670 53.8
Anxiety disorders 249,882 212.0 16,045 141.9 19,716 172.6 21,590 182.8 22,252 186.4 26,930 226.7
Post-traumatic stress disorder 138,221 114.1 10,975 95.6 13,671 117.8 13,139 109.2 13,666 112.1 15,039 123.6
Depressive disorders 281,829 242.5 25,921 234.6 29,257 262.0 30,106 261.0 28,029 240.0 30,220 259.4
Bipolar disorder 19,666 15.9 2,492 21.5 2,694 22.9 2,665 21.8 2,143 17.2 2,008 16.1
Personality disorders 36,510 29.6 5,929 51.4 5,028 42.9 4,073 33.4 3,263 26.3 3,432 27.7
Schizophrenia 2,867 2.3 296 2.5 298 2.5 316 2.6 293 2.3 295 2.4
Psychotic disorders 11,514 9.3 1,376 11.9 1,464 12.4 1,423 11.6 1,037 8.3 1,280 10.3
Other mental health disorders 244,535 209.3 21,275 190.8 23,522 208.9 23,890 205.1 24,923 211.6 25,655 218.6
No. of individuals
>1 type of mental health diagnosis 435,898 379.3 32,034 318.1 37,723 359.5 38,543 347.0 36,824 321.8 39,314 339.5
Any mental health diagnosisc 853,060 742.3 98,809 981.2 110,339 1051.4 114,088 1027.3 115,881 1012.8 122,320 1056.4
Total (2007–2016) 2012 2013 2014 2015 2016
Categorya No. Rateb No. Rateb No. Rateb No. Rateb No. Rateb No. Rateb
Adjustment disorders 467,305 420.1 53,899 479.6 47,022 414.6 43,654 386.7 44,442 399.1 45,895 417.0
Alcohol-related disorders 165,347 139.3 17,171 141.2 14,617 118.9 13,507 110.3 13,403 111.0 13,175 110.0
Substance-related disorders 55,133 44.7 5,976 47.2 4,890 38.3 4,132 32.6 4,011 32.1 2,369 19.1
Anxiety disorders 249,882 212.0 30,177 250.7 29,290 242.2 28,780 240.2 28,721 243.9 26,381 226.7
Post-traumatic stress disorder 138,221 114.1 16,973 137.1 14,691 117.7 13,999 112.8 13,406 109.6 12,662 104.5
Depressive disorders 281,829 242.5 31,048 261.9 28,805 240.7 27,110 227.6 26,503 225.5 24,830 213.1
Bipolar disorder 19,666 15.9 1,841 14.5 1,669 13.0 1,432 11.2 1,423 11.3 1,299 10.5
Personality disorders 36,510 29.6 3,059 24.1 2,886 22.6 2,937 23.1 2,974 23.8 2,929 23.7
Schizophrenia 2,867 2.3 313 2.5 288 2.2 248 1.9 249 2.0 271 2.2
Psychotic disorders 11,514 9.3 1,267 10.0 1,160 9.0 967 7.6 828 6.6 712 5.7
Other mental health disorders 244,535 209.3 26,942 225.9 25,035 208.3 22,809 191.0 23,321 198.1 27,163 233.8
No. of individuals
>1 type of mental health diagnosis 435,898 379.3 41,155 345.1 36,547 301.4 34,658 285.4 34,990 290.5 33,184 276.7
Any mental health diagnosisc 853,060 742.3 128,483 1077.4 117,724 970.7 109,293 899.9 108,603 901.7 110,419 920.6
aAn individual may be a case within a category only once per lifetime.bRate per 10,000 person-yearscAt least one recorded mental health disorder diagnosis
MSMR Vol. 25 No. 3 March 2018 Page 6
(35.8%) of all incident diagnoses of these mental health problems were related to substance abuse counseling and an addi-tional one-third (34.2%) were related to lifestyle problems (Table 2b). A little more than one-quarter (26.6%) were related to family/support group problems and only 3.4% were related to maltreatment (i.e., counseling and encounters for victims or perpetrators of abuse).
Rates of any V-/Z-coded mental health problems were fairly stable from 2007 through 2014, and then increased sharply in 2015 and 2016 (Figure 6). This increase was primarily driven by family/support group problems. Rates of lifestyle-related prob-lems increased steadily from 2010 through 2016, whereas substance abuse counseling decreased steadily during 2009–2016. In general, rates of mental health problems
related to family/support group and mal-treatment were higher among service mem-bers in the Army, women, non-Hispanic blacks, those aged 20–24 years, and those in motor transport occupations (data not shown). Incidence of substance abuse coun-seling was highest among service mem-bers in the Air Force, men, those aged 24 years or younger, and those in “other” occupations. Incidence of substance abuse counseling was relatively evenly distrib-uted among the race/ethnicity categories. Finally, incidence of lifestyle-related prob-lems was highest among service members in the Air Force and Army, women, non-Hispanic blacks, those less than 20 years of age, and those in “other” and motor trans-port occupations (data not shown).
A significant proportion of mental health problems related to lifestyle occur
in the first 6 months of service members’ military service; overall, 10% of these life-style-related problems were diagnosed within the first 6 months of service (data not shown). Only 5.5% of mental health prob-lems related to substance abuse counseling, 1.8% related to family/support group, and 0.4% related to maltreatment were diag-nosed in the first 6 months of service.
During 2008–2016, there were 53,966 individuals with any diagnosis for a men-tal health disorder during deployment to a CENTCOM AOR, representing 154,676 total encounters (data not shown). The num-ber of individuals affected by any men-tal health diagnosis during deployment to a CENTCOM AOR decreased during the surveillance period, from 10,951 in 2008 to 3,239 in 2016 (Figure 7).
T A B L E 2 b. Incident diagnoses and rates of V-/Z-coded mental health visits, among those without a mental health disorder diagnoses, active component, U.S. Armed Forces, 2007–2016
T A B L E 2 b ( c o n t . ) Incident diagnoses and rates of V-/Z-coded mental health visits, among those without a mental health disorder diag-noses, active component, U.S. Armed Forces, 2007–2016
Total (2007–2016) 2007 2008 2009 2010 2011
Categorya No. Rateb No. Rateb No. Rateb No. Rateb No. Rateb No. Rateb
Family/support group problems 32,964 27.1 2,417 21.3 2,476 21.4 2,234 18.6 2,661 21.7 2,653 21.6
Maltreatment-related 4,218 3.4 580 5.0 339 2.9 217 1.8 306 2.5 292 2.4
Lifestyle problems 42,316 34.9 3,210 28.4 3,000 26.0 4,008 33.4 2,620 21.5 2,990 24.4
Substance abuse counseling 44,265 36.4 4,395 38.6 5,066 43.7 5,769 47.9 5,159 42.2 4,819 39.3
No. of individuals
>1 type of V-/Z-coded diagnosis 7,982 6.9 324 3.2 368 3.5 251 2.3 296 2.6 348 3.0
Any V-/Z-coded diagnosisc 115,378 100.4 10,271 102.0 10,500 100.1 11,971 107.8 10,444 91.3 10,401 89.8
Total (2007–2016) 2012 2013 2014 2015 2016
Categorya No. Rateb No. Rateb No. Rateb No. Rateb No. Rateb No. Rateb
Family/support group problems 32,964 27.1 2,995 23.9 3,122 24.7 3,060 24.4 4,094 33.1 7,252 59.4
Maltreatment-related 4,218 3.4 229 1.8 281 2.2 344 2.7 484 3.9 1,146 9.3
Lifestyle problems 42,316 34.9 3,694 29.5 4,650 36.9 5,071 40.5 6,135 49.8 6,938 57.0
Substance abuse counseling 44,265 36.4 4,544 36.3 4,682 37.2 3,783 30.2 3,263 26.5 2,785 22.8
No. of individuals
>1 type of V-/Z-coded diagnosis 7,982 6.9 350 2.9 441 3.6 459 3.8 602 5.0 920 7.7
Any V-/Z-coded diagnosisc 115,378 100.4 11,106 93.1 12,281 101.3 11,786 97.0 13,357 110.9 17,178 143.2
aAn individual may be a case within a category only once per lifetime.bRate per 10,000 person-yearscAt least one reported mental health problem (V-/Z-coded diagnosis)
March 2018 Vol. 25 No. 3 MSMR Page 7
E D I T O R I A L C O M M E N T
This report describes incident diag-noses for mental health disorders among active component service members of the
U.S. Armed Forces. Similar to the findings of the previous MSMR report, adjustment disorders were the most commonly diag-nosed incident mental health disorder, and depressive disorders, anxiety disor-ders, alcohol-related disorders, and “other”
mental health disorders were also rela-tively common.2 In contrast to the previ-ous MSMR report, which documented an overall increase in mental health disorders from 2003 through 2009, data presented here show an overall decline in crude inci-dence of any mental health disorder from 2007 to 2016, with notable decreases in the incidence of alcohol- and substance-related disorders, personality disorders, and depressive disorders. The incidence rates of most other mental health diag-noses remained relatively stable during the period.
The overall decline in rates of incident mental health disorder diagnoses could have been driven by two primary fac-tors. First, the period from 2011 through 2016 coincided with a period of significant reduction of U.S. Armed Forces in Iraq, and with an official end to combat opera-tions in Afghanistan at the end of 2014. In this report and in several previous studies, mental health disorders such as anxiety, depression, and PTSD have been found to be significantly higher among service members with histories of deployment to a CENTCOM AOR, and the decline in mental health disorders could be related to reduced levels of deployment and com-bat exposure during this period.5-7 This assessment is reinforced by the finding of decreasing numbers of medical encoun-ters for, and individuals receiving, men-tal health diagnoses during deployment, and the rates of several mental health disorders being higher among those in combat-related occupations. Second, the Department of Defense (DoD) has recently promoted anti-stigma efforts to encourage individuals to seek treatment and to dem-onstrate that seeking treatment will not harm one’s military career. One example of this is the “Real Warriors” campaign launched in 2009, which utilized a web-site with articles on psychological disor-ders and their treatment, as well as a crisis intervention hotline (https://www.realwar-riors.net).8 Although these efforts to com-bat stigma may have resulted in an initial increase of diagnoses as more people with symptoms came forward, they may have also attenuated the incidence of new diag-noses if service members self-treated (e.g., stress reduction, counseling, resilience
F I G U R E 1 . Annual incidence rates of mental health disorders, active component, U.S. Armed Forces, 2007–2016
F I G U R E 2 . Incidence rates of mental health disorder diagnoses, by category and sex, active component, U.S. Armed Forces, 2007–2016
0
100
200
300
400
500
600
2007 2008 2009 2010 2011 2012 2013 2014 2015 2016
Inci
dent
dia
gnos
es p
er 1
0,00
0 p-
yrs
Adjustment disorders Depressive disordersAnxiety disorders Other mental healthAlcohol-related disorders Post-traumatic stress disorderSubstance-related disorders Personality disordersBipolar disorder Psychotic disordersSchizophrenia
0
100
200
300
400
500
600
700
800
Adj
ustm
ent d
isor
ders
Alc
ohol
-rel
ated
dis
orde
rs
Sub
stan
ce-re
late
d di
sord
ers
Anx
iety
dis
oder
s
Pos
t-tra
umat
ic s
tress
diso
rder
Dep
ress
ive
diso
rder
s
Bip
olar
dis
orde
r
Per
sona
lity
diso
rder
s
Sch
izop
hren
ia
Oth
er p
sych
oses
Oth
er m
enta
l hea
lth
Inci
dent
dia
gnos
es p
er 1
0,00
0 p-
yrs Male
Female
MSMR Vol. 25 No. 3 March 2018 Page 8
F I G U R E 3 . Incidence rates of mental health disorder diagnoses, by category and age group, active component, U.S. Armed Forces, 2007–2016
F I G U R E 4 . Incidence rates of mental health disorder diagnoses, by category and service, active component, U.S. Armed Forces, 2007–2016
0
100
200
300
400
500
600
700
Adju
stm
ent d
isor
ders
Alco
hol-r
elat
ed d
isor
ders
Subs
tanc
e-re
late
d di
sord
ers
Anxi
ety
diso
rder
s
Post
-trau
mat
ic s
tress
dis
orde
r
Dep
ress
ive
diso
rder
s
Bipo
lar d
isor
der
Pers
onal
ity d
isor
ders
Schi
zoph
reni
a
Oth
er p
sych
oses
Oth
er m
enta
l hea
lth
Inci
dent
dia
gnos
es p
er 1
0,00
0 p-
yrs
<20
20–24 25–29 30–34 35–39 40–49 50+
0
100
200
300
400
500
600
700
800
Adju
stm
ent d
isor
ders
Alco
hol-r
elat
ed d
isor
ders
Subs
tanc
e-re
late
d di
sord
ers
Anxi
ety
diso
rder
s
Post
-trau
mat
ic s
tress
dis
orde
r
Dep
ress
ive
diso
rder
s
Bipo
lar d
isor
der
Pers
onal
ity d
isor
ders
Schi
zoph
reni
a
Oth
er p
sych
oses
Oth
er m
enta
l hea
lth
Inci
dent
dia
gnos
es p
er 1
0,00
0 p-
yrs
ArmyNavyAir ForceMarine Corps
March 2018 Vol. 25 No. 3 MSMR Page 9
F I G U R E 5 . Incidence rates of mental health disorder diagnoses, by category and military occupation, active component, U.S. Armed Forces, 2007–2016
aInfantry/artillery/combat engineering
0
100
200
300
400
500
600
700
Adju
stm
ent d
isor
ders
Alco
hol-r
elat
eddi
sord
ers
Subs
tanc
e-re
late
ddi
sord
ers
Anxi
ety
diso
rder
s
Post
-trau
mat
ic s
tress
diso
rder
Dep
ress
ive
diso
rder
s
Bipo
lar d
isor
der
Pers
onal
ity d
isor
ders
Schi
zoph
reni
a
Oth
er p
sych
oses
Oth
er m
enta
l hea
lth
Inci
dent
dia
gnos
es p
er 1
0,00
0 p-
yrs
Combat-relatedª Motor transport Pilot/aircrew Repair/engineer Comm/intel Health care Other
F I G U R E 6 . Annual incidence rates of V-/Z-coded mental health diagnoses, active component, U.S. Armed Forces, 2007–2016
0
20
40
60
80
100
120
140
160
2007 2008 2009 2010 2011 2012 2013 2014 2015 2016
Inci
dent
dia
gnos
es p
er 1
0,00
0 p-
yrs
Any V-/Z-coded diagnoses Substance abuse counseling Lifestyle problemsFamily/support group problems Maltreatment-related
building) before more severe clinical diag-noses were made.
Also in accordance with a previous report, rates of incident mental health disorders were generally higher among females than males and among Army ser-vice members, but rates declined with increasing age.2 Of note, however, the inci-dence of PTSD began to shift to older age groups around 2010. The reasons for this are not immediately apparent, although the shift could be related to the draw-down of U.S Armed Forces in Iraq and Afghanistan during the surveillance period because older service members are more likely to have had one or multiple deploy-ments. A recent meta-analysis of risk fac-tors for combat-related PTSD reported mixed findings with respect to the relation-ship between age and PTSD.9 In addition, PTSD was more common among men than women in the previous MSMR report cov-ering a 2000–2011 surveillance period, but

MSMR Vol. 25 No. 3 March 2018 Page 10
the findings presented here demonstrate a higher incidence among women from 2009 to 2016. This could be related to a growing number of women having been exposed to combat or other traumatic exposures such as sexual harassment or sexual assault.10
The decline of alcohol- and substance-related disorders diagnosed during the surveillance period is also noteworthy. In 2012, the Institute of Medicine (IOM) released a report that analyzed the policies and programs within the DoD that per-tain to prevention, screening, diagnosis, and treatment of substance use disorders among service members. The IOM report recommended to military leadership sev-eral proactive public health interventions such as limiting access to alcohol, encour-aging service members to seek help with-out fear of stigma or negative consequences through confidential treatment programs, increasing the use of evidence-based pro-grams and practices, and expanding access to care.11 Although the results presented here cannot provide direct evidence for the effectiveness of these programs, they do
support the hypothesis that at least some of these interventions have been effective in reducing rates of substance use disorders.
There are significant limitations to this report that should be considered when interpreting the results. For example, inci-dent cases of mental health disorders and mental health problems were ascertained from ICD-9-/ICD-10-coded diagnoses that were reported on standardized adminis-trative records of outpatient clinic visits and hospitalizations. Such records are not completely reliable indicators of the num-bers and types of mental health disorders and mental health problems that actually affect military members. For example, the numbers reported here are underestimates to the extent that affected service members did not seek care or received care that is not routinely documented in records that were used for this analysis (e.g., private practi-tioner, deployed troop clinic, counseling or advocacy support center); that mental health disorders and mental health prob-lems were not diagnosed or reported on standardized records of care; and/or that
some indicator diagnoses were miscoded or incorrectly transcribed on the centrally transmitted records. On the other hand, some conditions may have been errone-ously diagnosed or miscoded as mental health disorders or mental health prob-lems (e.g., screening visits). In addition, the analyses reported here summarize the experiences of individuals while they were serving in an active component of the U.S. military; as such, the results do not include mental health disorders and mental health problems that affected members of reserve components or veterans of recent military service who received care outside of the Military Health System.
The accuracy of estimates of the num-bers, natures, and rates of illnesses and injuries of surveillance interest depend to a great extent on specifications of the surveil-lance case definitions that are used to iden-tify cases. If case definitions with different specifications were used to identify cases of nominally the same conditions, the resul-tant estimates of numbers, rates, and trends might vary from those reported here. Fur-thermore, the transition from ICD-9 to ICD-10 posed a challenge in creating com-parable code groupings for the behavioral health V-/Z-coded disorders. In particular, the increase in V-/Z-coded diagnoses from 2015 through 2016 is likely related to the transition from ICD-9 to ICD-10. Future analyses using only Z-coded diagnoses will help to determine whether there is a true increase in mental health problems such as family/support group problems.
Overall, this report indicates that the incidence of mental health disorders has stabilized in the past decade, in contrast to the trend of increasing incidence observed in previous years. Ongoing efforts to assist and treat service members should con-tinue to promote help-seeking behavior to improve the psychological and emotional well-being of U.S. service members.
R E F E R E N C E S
1. Armed Forces Health Surveillance Branch. Ab-solute and relative morbidity burdens attributableto various illnesses and injuries, active component,U.S. Armed Forces, 2016. MSMR. 2017;24(4):2–8.2. Armed Forces Health Surveillance Center. Men-tal disorders and mental health problems, active
F I G U R E 7 . Annual numbers of individuals affected by any mental health disorder diagnosis during deployment to a U.S. Central Command area of responsibility, active component, U.S. Armed Forces, 2008–2016
10,951
7,914 8,521
6,907
5,327 4,779
2,874 3,454 3,239
0
2,000
4,000
6,000
8,000
10,000
12,000
2008 2009 2010 2011 2012 2013 2014 2015 2016
No.
of i
ndiv
idua
ls
March 2018 Vol. 25 No. 3 MSMR Page 11
component, U.S. Armed Forces, 2000–2011. MSMR. 2012;19(6):11–17. 3. Garvey Wilson AL, Messer SC, Hoge CW. U.S.military mental health care utilization and attritionprior to the wars in Iraq and Afghanistan. Soc Psy-chiatry Psychiatr Epidemiol. 2009;44(6):473–481. 4. Skopp NA, Trofimovich L, Grimes J, et al. Rela-tions between suicide and traumatic brain injury,psychiatric diagnoses, and relationship problems,active component, U.S. Armed Forces, 2001–2009.MSMR. 2012;19(2):7–11.5. Vasterling JJ, Proctor SP, Friedman MJ, et al. PTSD symptom increases in Iraq-deployed soldiers:
comparison with nondeployed soldiers and associa-tions with baseline symptoms, deployment experi-ences, and postdeployment stress. J Traum Stress. 2010;23(1):41–51.6. Hoge CW, Auchterlonie JL, Milliken CS. Mental health problems, use of mental health services,and attrition from military service after returningfrom deployment to Iraq or Afghanistan. JAMA.2006;295(9):1023–1032.7. Packnett ER, Elmasry H, Toolin CF, Cowan DB,Boivin MR. Epidemiology of major depressive dis-order disability in the U.S. military: FY 2007–2012. JNerv Ment Dis. 2017;205(9):672–678.
8. Dingfelder SF. The military’s war on stigma. Moni-tor on Psychology. 2009;40(6):52. www.apa.org/monitor/2009/06/stigma-war.aspx.9. Xue C, Yang G, Tang B, et al. A meta-analysisof risk factors for combat-related PTSD amongmilitary personnel and veterans. PLoS One.2015;10(3):e0120270.10. Resnick EM, Mallampalli M, Carter CL. Currentchallenges in female veterans’ health. J WomensHealth (Larchmt). 2012;21(9):895–900. 11. Institute of Medicine. Substance Use Disordersin the U.S. Armed Forces. 2012. http://nationalacad-emies.org/hmd/Reports/2012/Substance-Use-Dis-orders-in-the-US-Armed-Forces.aspx.

MSMR Vol. 25 No. 3 March 2018 Page 12
During 2007–2016, 18.1% of all active component service members were diagnosed with at least one of the five risk factors for cardiovascular disease (CVD) studied in this analysis. In addition, 0.6% of service members were diagnosed with at least one of the four CVDs studied. The most frequently diagnosed risk factors were (in descending order of frequency) obesity, hyperlipidemia, essential hypertension, abnormal blood glucose level, and diabetes mellitus. Incidence rates of both risk factors and CVD were progres-sively higher with advancing age. Annual incidence rates during the 10-year period declined for the risk factors hyperlipidemia, hypertension, and diabe-tes, but rose for obesity and abnormal blood glucose level. Annual rates of the CVDs ischemic heart disease and cerebrovascular disease declined, but rates of hypertensive heart/kidney disease and atherosclerosis remained relatively stable. Noteworthy findings were the increase in incidence rates of obesity, the decline in incidence rates of ischemic heart disease, and the decline in rates of hypertension in non-Hispanic black service members. The identifica-tion of CVD risk factors, including others not studied in this analysis, offers the opportunity for preventive interventions that can reduce the rates of clin-ical CVD during, but especially after, military service.
Incidence Rates of Diagnoses of Cardiovascular Diseases and Associated Risk Factors, Active Component, U.S. Armed Forces, 2007–2016Francis L. O’Donnell, MD, MPH (COL, USA, Ret.); Shauna Stahlman, PhD, MPH; Alexis A. Oetting, MPH
The American Heart Association (AHA) estimates that more than one-third of American adults have
at least one type of cardiovascular disease (CVD) and 50% of the affected adults are 60 years of age or older.1 Furthermore, the AHA cites projections that, by the year 2030, 44% of the U.S. population will have some form of CVD.1 Since the early 1900s, CVD has accounted for more deaths in the U.S. than any other major cause of death.1 Although U.S. mortality rates from CVD have declined during the past two decades, in 2014, CVD was the underlying cause of 30.8% of all deaths, whereas cancer—the second leading cause of death—was responsible for 22.5% of all deaths.1
Numerous major risk factors have been linked to CVD. They include high blood cholesterol levels, high blood pressure,
smoking, insulin resistance (marked by elevated fasting blood glucose level), diabe-tes, overweight or obesity, lack of physical activity, unhealthy diet, older age, and fam-ily history (particularly a history of early coronary heart disease).2 Optimal cardio-vascular health is marked by the absence of those risk factors that are susceptible to intervention. Of those factors mentioned above, only age and family history are not modifiable by either individual lifestyle modification or medical detection and intervention.1
With respect to risk factors for CVD, members of the Armed Forces differ from the general U.S. population by virtue of being younger (96% are less than 45 years old), more physically active, and having been in good physical health at the time of entry into military service.3 However,
following entry, many service members develop or are discovered to have risk fac-tors for CVD.4 Most service members with risk factors may never develop overt CVD while in uniform. However, if the risk fac-tors are recognized and they take steps to modify their lifestyles or obtain appropriate medical intervention, then they can reduce the likelihood of significant CVD not only while members of the Armed Forces, but also during the years following their mili-tary service.
Studies of the burden of disease and injury among active component service members have documented that the inci-dence of diagnoses of CVD is consider-ably lower than the incidence of many other types of disorders.5 Given the relative youth of service members and the nature of their duties, these observations about the relatively infrequent occurrence of CVDs are not surprising. This report represents an extension of a previous MSMR study that examined the incidence and preva-lence of select risk factors for CVD among active component service members in the U.S. Armed Forces.4 This analysis not only reports on more recent incidence rates of CVD risk factors through 2016, but also provides estimates of the incidence rates of major categories of cardiovascular diseases themselves.
M E T H O D S
The surveillance period was 1 January 2007 through 31 December 2016. The sur-veillance population included any individual who served in the active component (AC) of the U.S. Army, Navy, Air Force, or Marine Corps at any time during the surveillance period. All data used to determine inci-dent cases were derived from records rou-tinely maintained in the Defense Medical
March 2018 Vol. 25 No. 3 MSMR Page 13
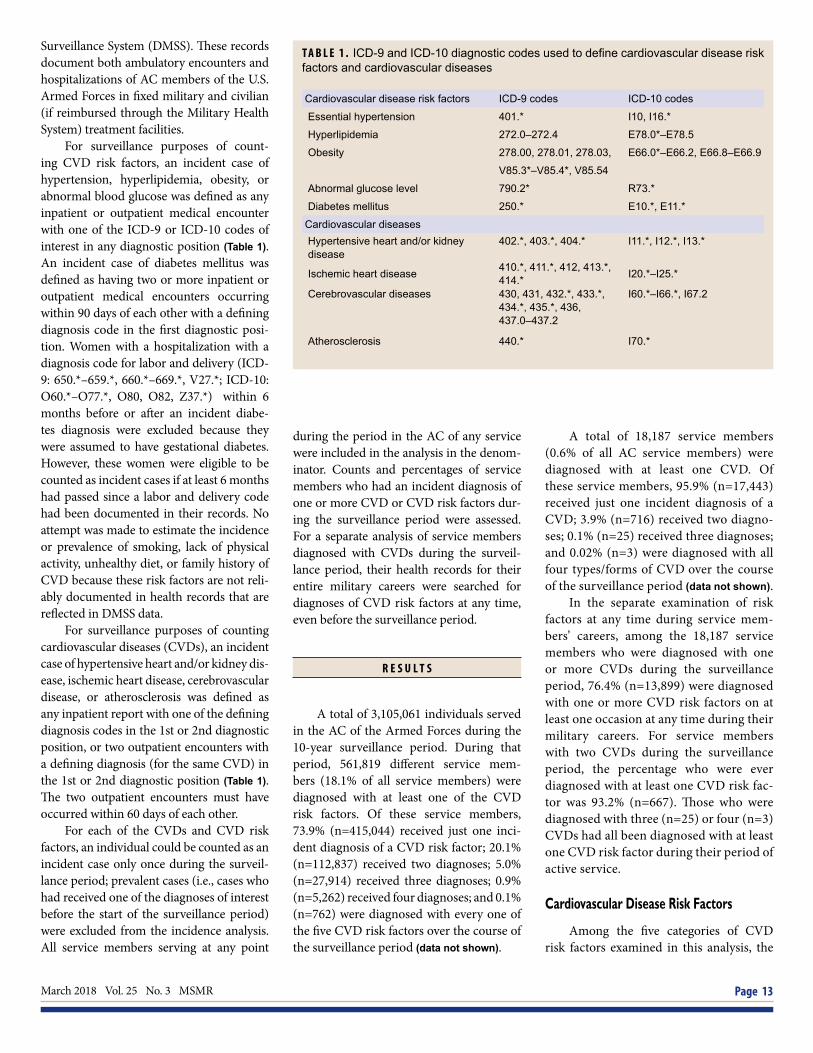
T A B L E 1 . ICD-9 and ICD-10 diagnostic codes used to define cardiovascular disease risk factors and cardiovascular diseases
Surveillance System (DMSS). These records document both ambulatory encounters and hospitalizations of AC members of the U.S. Armed Forces in fixed military and civilian (if reimbursed through the Military Health System) treatment facilities.
For surveillance purposes of count-ing CVD risk factors, an incident case of hypertension, hyperlipidemia, obesity, or abnormal blood glucose was defined as any inpatient or outpatient medical encounter with one of the ICD-9 or ICD-10 codes of interest in any diagnostic position (Table 1). An incident case of diabetes mellitus was defined as having two or more inpatient or outpatient medical encounters occurring within 90 days of each other with a defining diagnosis code in the first diagnostic posi-tion. Women with a hospitalization with a diagnosis code for labor and delivery (ICD-9: 650.*–659.*, 660.*–669.*, V27.*; ICD-10: O60.*–O77.*, O80, O82, Z37.*) within 6 months before or after an incident diabe-tes diagnosis were excluded because they were assumed to have gestational diabetes. However, these women were eligible to be counted as incident cases if at least 6 months had passed since a labor and delivery code had been documented in their records. No attempt was made to estimate the incidence or prevalence of smoking, lack of physical activity, unhealthy diet, or family history of CVD because these risk factors are not reli-ably documented in health records that are reflected in DMSS data.
For surveillance purposes of counting cardiovascular diseases (CVDs), an incident case of hypertensive heart and/or kidney dis-ease, ischemic heart disease, cerebrovascular disease, or atherosclerosis was defined as any inpatient report with one of the defining diagnosis codes in the 1st or 2nd diagnostic position, or two outpatient encounters with a defining diagnosis (for the same CVD) in the 1st or 2nd diagnostic position (Table 1). The two outpatient encounters must have occurred within 60 days of each other.
For each of the CVDs and CVD risk factors, an individual could be counted as an incident case only once during the surveil-lance period; prevalent cases (i.e., cases who had received one of the diagnoses of interest before the start of the surveillance period) were excluded from the incidence analysis. All service members serving at any point
during the period in the AC of any service were included in the analysis in the denom-inator. Counts and percentages of service members who had an incident diagnosis of one or more CVD or CVD risk factors dur-ing the surveillance period were assessed. For a separate analysis of service members diagnosed with CVDs during the surveil-lance period, their health records for their entire military careers were searched for diagnoses of CVD risk factors at any time, even before the surveillance period.
R E S U L T S
A total of 3,105,061 individuals served in the AC of the Armed Forces during the 10-year surveillance period. During that period, 561,819 different service mem-bers (18.1% of all service members) were diagnosed with at least one of the CVD risk factors. Of these service members, 73.9% (n=415,044) received just one inci-dent diagnosis of a CVD risk factor; 20.1% (n=112,837) received two diagnoses; 5.0% (n=27,914) received three diagnoses; 0.9% (n=5,262) received four diagnoses; and 0.1% (n=762) were diagnosed with every one of the five CVD risk factors over the course of the surveillance period (data not shown).
A total of 18,187 service members (0.6% of all AC service members) were diagnosed with at least one CVD. Of these service members, 95.9% (n=17,443) received just one incident diagnosis of a CVD; 3.9% (n=716) received two diagno-ses; 0.1% (n=25) received three diagnoses; and 0.02% (n=3) were diagnosed with all four types/forms of CVD over the course of the surveillance period (data not shown).
In the separate examination of risk factors at any time during service mem-bers’ careers, among the 18,187 service members who were diagnosed with one or more CVDs during the surveillance period, 76.4% (n=13,899) were diagnosed with one or more CVD risk factors on at least one occasion at any time during their military careers. For service members with two CVDs during the surveillance period, the percentage who were ever diagnosed with at least one CVD risk fac-tor was 93.2% (n=667). Those who were diagnosed with three (n=25) or four (n=3) CVDs had all been diagnosed with at least one CVD risk factor during their period of active service.
Cardiovascular Disease Risk Factors
Among the five categories of CVD risk factors examined in this analysis, the
Cardiovascular disease risk factors ICD-9 codes ICD-10 codes
Essential hypertension 401.* I10, I16.*
Hyperlipidemia 272.0–272.4 E78.0*–E78.5
Obesity 278.00, 278.01, 278.03, E66.0*–E66.2, E66.8–E66.9
V85.3*–V85.4*, V85.54
Abnormal glucose level 790.2* R73.*
Diabetes mellitus 250.* E10.*, E11.*
Cardiovascular diseasesHypertensive heart and/or kidney disease
402.*, 403.*, 404.* I11.*, I12.*, I13.*
Ischemic heart disease 410.*, 411.*, 412, 413.*, 414.* I20.*–I25.*
Cerebrovascular diseases 430, 431, 432.*, 433.*, 434.*, 435.*, 436, 437.0–437.2
I60.*–I66.*, I67.2
Atherosclerosis 440.* I70.*

MSMR Vol. 25 No. 3 March 2018 Page 14
T A B L E 2 . Incident counts and incidence rates of cardiovascular disease risk factors by type and demographic/military characteristics, active component, U.S. Armed Forces, 2007–2016
Obesity Hyperlipidemia Essential hypertension
Abnormal glucose level
Diabetes mellitus
No. Ratea No. Ratea No. Ratea No. Ratea No. Ratea
Total 244,358 19.1 234,553 18.7 196,892 15.3 62,246 4.6 11,269 0.8
Inpatient 4,356 0.3 3,560 0.3 8,271 0.6 1,862 0.1 810 0.1
Outpatient 240,002 18.8 230,993 18.4 188,621 14.7 60,384 4.5 10,459 0.8
Sex
Male 201,966 18.4 212,715 20.0 175,736 16.1 51,768 4.5 10,084 0.9
Female 42,392 23.2 21,838 11.5 21,156 11.1 10,478 5.3 1,185 0.6
Race/ethnicity
Non-Hispanic white 136,081 17.4 141,240 18.4 110,997 14.1 31,600 3.8 4,712 0.6
Non-Hispanic black 52,171 26.0 39,786 19.7 47,296 23.7 14,727 6.8 3,649 1.7
Hispanic 34,271 21.8 27,718 17.7 19,078 11.8 7,538 4.5 1,301 0.8
Asian/Pacific Islander 7,609 15.7 11,036 24.1 8,089 16.9 4,006 8.0 908 1.8
Other/unknown 14,226 16.3 14,773 17.3 11,432 13.0 4,375 4.8 699 0.8
Age
<20 5,949 6.8 1,505 1.7 2,613 3.0 1,360 1.6 146 0.2
20–29 133,991 18.3 68,959 9.2 75,069 10.0 14,919 2.0 2,114 0.3
30–39 72,000 21.8 96,666 30.4 71,629 21.5 21,553 6.0 3,785 1.0
40–49 29,635 25.5 60,972 65.6 42,271 39.2 20,962 16.7 4,480 3.4
50+ 2,783 23.5 6,451 80.6 5,310 54.4 3,452 28.9 744 5.8
Service
Army 129,294 26.8 108,654 22.4 96,891 19.7 25,362 4.9 5,429 1.0
Navy 46,226 15.1 57,526 19.6 39,981 13.1 19,931 6.3 3,074 1.0
Air Force 58,586 19.7 51,993 17.8 44,148 14.6 13,672 4.3 2,236 0.7
Marine Corps 10,252 5.4 16,380 8.8 15,872 8.4 3,281 1.7 530 0.3
Status
Recruit 1,947 7.1 589 2.2 1,665 6.1 1,931 7.1 84 0.3
Nonrecruit 242,411 19.4 233,964 19.0 195,227 15.5 60,315 4.6 11,185 0.8
Rank
Junior enlisted (E1–E4) 112,260 19.5 46,030 7.8 58,344 10.0 12,243 2.1 1,998 0.3
Senior enlisted (E5–E9) 106,492 22.1 133,691 28.5 105,289 21.6 36,169 6.9 7,486 1.4
Junior officer (O1–O3) 11,478 9.4 19,387 16.4 12,782 10.5 3,535 2.8 454 0.4
Senior officer (O4–O10) 11,264 14.1 29,622 45.8 16,549 22.1 8,866 10.7 1,076 1.3
Warrant officer (W01–W05) 2,864 16.5 5,823 38.1 3,928 23.5 1,433 7.8 255 1.4
Occupation
Combat-specificb 31,662 16.4 29,734 15.6 26,676 13.8 6,008 3.0 1,262 0.6
Armor/motor transport 8,416 21.8 6,304 16.2 6,432 16.5 1,955 4.8 396 1.0
Pilot/air crew 3,988 8.1 10,216 22.7 4,741 9.7 1,627 3.2 217 0.4
Repair/engineering 73,266 19.9 66,675 18.3 55,532 14.9 16,892 4.3 3,217 0.8
Communications/intelligence 61,238 22.1 57,894 21.1 47,915 17.1 16,358 5.5 2,962 1.0
Healthcare 24,732 23.0 24,610 23.3 21,718 20.1 7,944 6.9 1,255 1.1
Other 41,056 16.9 39,120 16.4 33,878 13.9 11,462 4.5 1,960 0.8
aRate per 1,000 person-yearsbInfantry/artillery/combat engineering
March 2018 Vol. 25 No. 3 MSMR Page 15
numbers of service members with diag-nosed risk factors during the surveillance period were (in decreasing order of fre-quency) obesity (n=244,358 individu-als), hyperlipidemia (n=234,553), essential hypertension (n=196,892), abnormal blood glucose level (n=62,246), and diabetes mel-litus (n=11,269) (Table 2).
For all CVD risk factors, overall inci-dence rates were higher among service members in healthcare occupations than members of the other occupational cat-egories. In addition, incidence rates were higher among service members in the Army compared to the other services for all CVD risk factors except abnormal glu-cose level, which was highest among Navy members (Table 2). Overall incidence rates for risk factors were higher among men for hypertension, hyperlipidemia, and diabe-tes, but women’s rates were higher for obe-sity and abnormal glucose levels. For all five risk factors examined, rates were pro-gressively higher with advancing age, with the highest rates found among the oldest age category (50 years or older) except for obesity, for which the peak rate was among those 40–49 years of age. Consistent with this age-related pattern of incidence rates of all risk factors, rates were also higher in more senior enlisted and officer person-nel compared to junior service members (Table 2).
Obesity
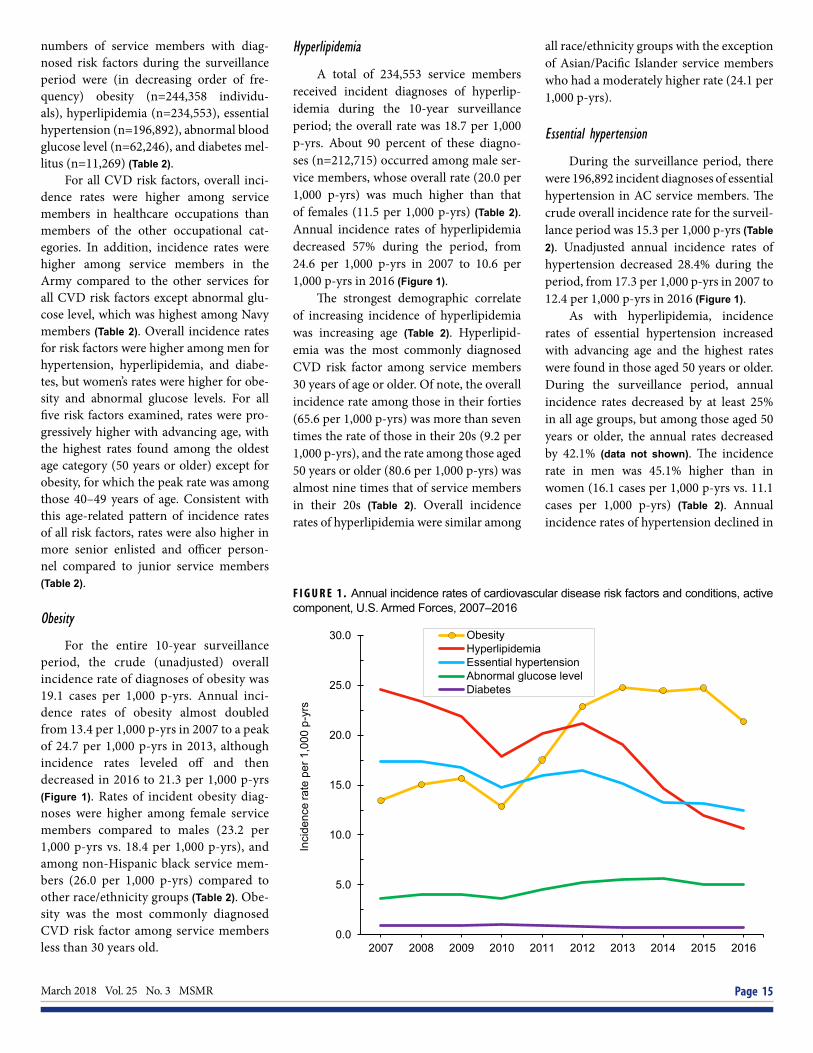
For the entire 10-year surveillance period, the crude (unadjusted) overall incidence rate of diagnoses of obesity was 19.1 cases per 1,000 p-yrs. Annual inci-dence rates of obesity almost doubled from 13.4 per 1,000 p-yrs in 2007 to a peak of 24.7 per 1,000 p-yrs in 2013, although incidence rates leveled off and then decreased in 2016 to 21.3 per 1,000 p-yrs (Figure 1). Rates of incident obesity diag-noses were higher among female service members compared to males (23.2 per 1,000 p-yrs vs. 18.4 per 1,000 p-yrs), and among non-Hispanic black service mem-bers (26.0 per 1,000 p-yrs) compared to other race/ethnicity groups (Table 2). Obe-sity was the most commonly diagnosed CVD risk factor among service members less than 30 years old.
Hyperlipidemia
A total of 234,553 service members received incident diagnoses of hyperlip-idemia during the 10-year surveillance period; the overall rate was 18.7 per 1,000 p-yrs. About 90 percent of these diagno-ses (n=212,715) occurred among male ser-vice members, whose overall rate (20.0 per 1,000 p-yrs) was much higher than that of females (11.5 per 1,000 p-yrs) (Table 2). Annual incidence rates of hyperlipidemia decreased 57% during the period, from 24.6 per 1,000 p-yrs in 2007 to 10.6 per 1,000 p-yrs in 2016 (Figure 1).
The strongest demographic correlate of increasing incidence of hyperlipidemia was increasing age (Table 2). Hyperlipid-emia was the most commonly diagnosed CVD risk factor among service members 30 years of age or older. Of note, the overall incidence rate among those in their forties (65.6 per 1,000 p-yrs) was more than seven times the rate of those in their 20s (9.2 per 1,000 p-yrs), and the rate among those aged 50 years or older (80.6 per 1,000 p-yrs) was almost nine times that of service members in their 20s (Table 2). Overall incidence rates of hyperlipidemia were similar among
all race/ethnicity groups with the exception of Asian/Pacific Islander service members who had a moderately higher rate (24.1 per 1,000 p-yrs).
Essential hypertension
During the surveillance period, there were 196,892 incident diagnoses of essential hypertension in AC service members. The crude overall incidence rate for the surveil-lance period was 15.3 per 1,000 p-yrs (Table 2). Unadjusted annual incidence rates of hypertension decreased 28.4% during the period, from 17.3 per 1,000 p-yrs in 2007 to 12.4 per 1,000 p-yrs in 2016 (Figure 1).
As with hyperlipidemia, incidence rates of essential hypertension increased with advancing age and the highest rates were found in those aged 50 years or older. During the surveillance period, annual incidence rates decreased by at least 25% in all age groups, but among those aged 50 years or older, the annual rates decreased by 42.1% (data not shown). The incidence rate in men was 45.1% higher than in women (16.1 cases per 1,000 p-yrs vs. 11.1 cases per 1,000 p-yrs) (Table 2). Annual incidence rates of hypertension declined in
F I G U R E 1 . Annual incidence rates of cardiovascular disease risk factors and conditions, active component, U.S. Armed Forces, 2007–2016
0.0
5.0
10.0
15.0
20.0
25.0
30.0
2007 2008 2009 2010 2011 2012 2013 2014 2015 2016
Inci
denc
e ra
te p
er 1
,000
p-y
rs
ObesityHyperlipidemiaEssential hypertensionAbnormal glucose levelDiabetes
MSMR Vol. 25 No. 3 March 2018 Page 16
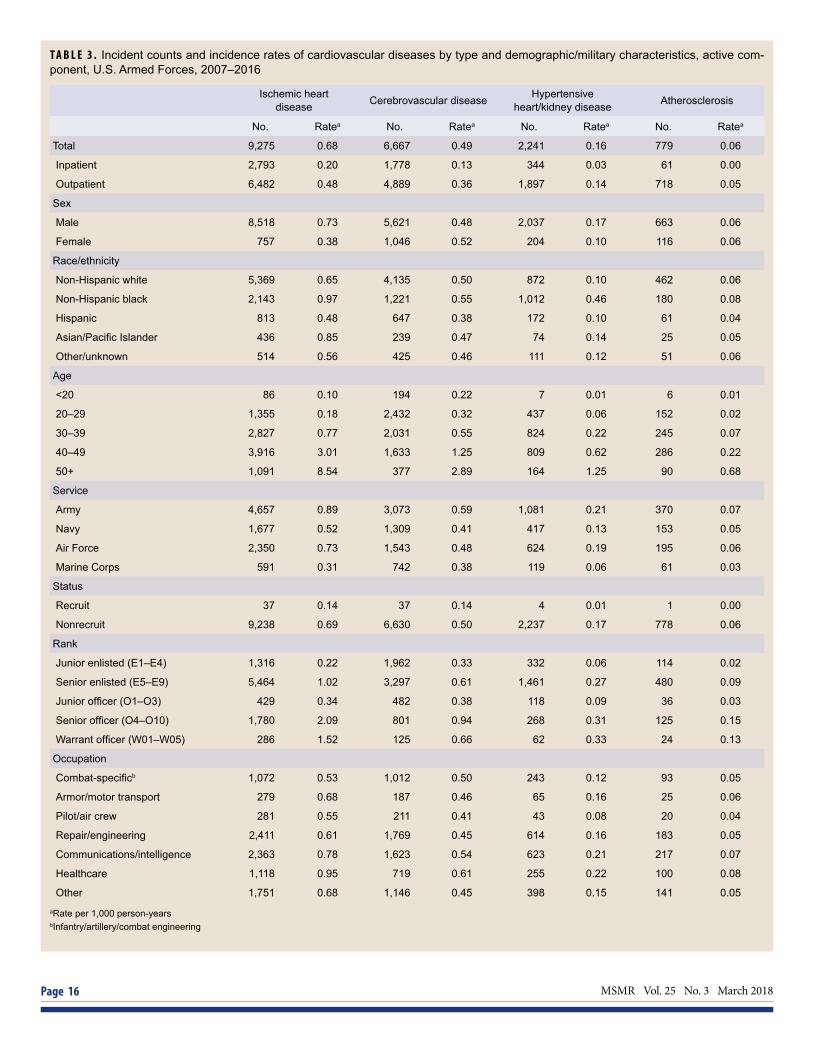
T A B L E 3 . Incident counts and incidence rates of cardiovascular diseases by type and demographic/military characteristics, active com-ponent, U.S. Armed Forces, 2007–2016
Ischemic heart disease Cerebrovascular disease Hypertensive
heart/kidney disease Atherosclerosis
No. Ratea No. Ratea No. Ratea No. Ratea
Total 9,275 0.68 6,667 0.49 2,241 0.16 779 0.06
Inpatient 2,793 0.20 1,778 0.13 344 0.03 61 0.00
Outpatient 6,482 0.48 4,889 0.36 1,897 0.14 718 0.05
Sex
Male 8,518 0.73 5,621 0.48 2,037 0.17 663 0.06
Female 757 0.38 1,046 0.52 204 0.10 116 0.06
Race/ethnicity
Non-Hispanic white 5,369 0.65 4,135 0.50 872 0.10 462 0.06
Non-Hispanic black 2,143 0.97 1,221 0.55 1,012 0.46 180 0.08
Hispanic 813 0.48 647 0.38 172 0.10 61 0.04
Asian/Pacific Islander 436 0.85 239 0.47 74 0.14 25 0.05
Other/unknown 514 0.56 425 0.46 111 0.12 51 0.06
Age
<20 86 0.10 194 0.22 7 0.01 6 0.01
20–29 1,355 0.18 2,432 0.32 437 0.06 152 0.02
30–39 2,827 0.77 2,031 0.55 824 0.22 245 0.07
40–49 3,916 3.01 1,633 1.25 809 0.62 286 0.22
50+ 1,091 8.54 377 2.89 164 1.25 90 0.68
Service
Army 4,657 0.89 3,073 0.59 1,081 0.21 370 0.07
Navy 1,677 0.52 1,309 0.41 417 0.13 153 0.05
Air Force 2,350 0.73 1,543 0.48 624 0.19 195 0.06
Marine Corps 591 0.31 742 0.38 119 0.06 61 0.03
Status
Recruit 37 0.14 37 0.14 4 0.01 1 0.00
Nonrecruit 9,238 0.69 6,630 0.50 2,237 0.17 778 0.06
Rank
Junior enlisted (E1–E4) 1,316 0.22 1,962 0.33 332 0.06 114 0.02
Senior enlisted (E5–E9) 5,464 1.02 3,297 0.61 1,461 0.27 480 0.09
Junior officer (O1–O3) 429 0.34 482 0.38 118 0.09 36 0.03
Senior officer (O4–O10) 1,780 2.09 801 0.94 268 0.31 125 0.15
Warrant officer (W01–W05) 286 1.52 125 0.66 62 0.33 24 0.13
Occupation
Combat-specificb 1,072 0.53 1,012 0.50 243 0.12 93 0.05
Armor/motor transport 279 0.68 187 0.46 65 0.16 25 0.06
Pilot/air crew 281 0.55 211 0.41 43 0.08 20 0.04
Repair/engineering 2,411 0.61 1,769 0.45 614 0.16 183 0.05
Communications/intelligence 2,363 0.78 1,623 0.54 623 0.21 217 0.07
Healthcare 1,118 0.95 719 0.61 255 0.22 100 0.08
Other 1,751 0.68 1,146 0.45 398 0.15 141 0.05aRate per 1,000 person-yearsbInfantry/artillery/combat engineering
March 2018 Vol. 25 No. 3 MSMR Page 17
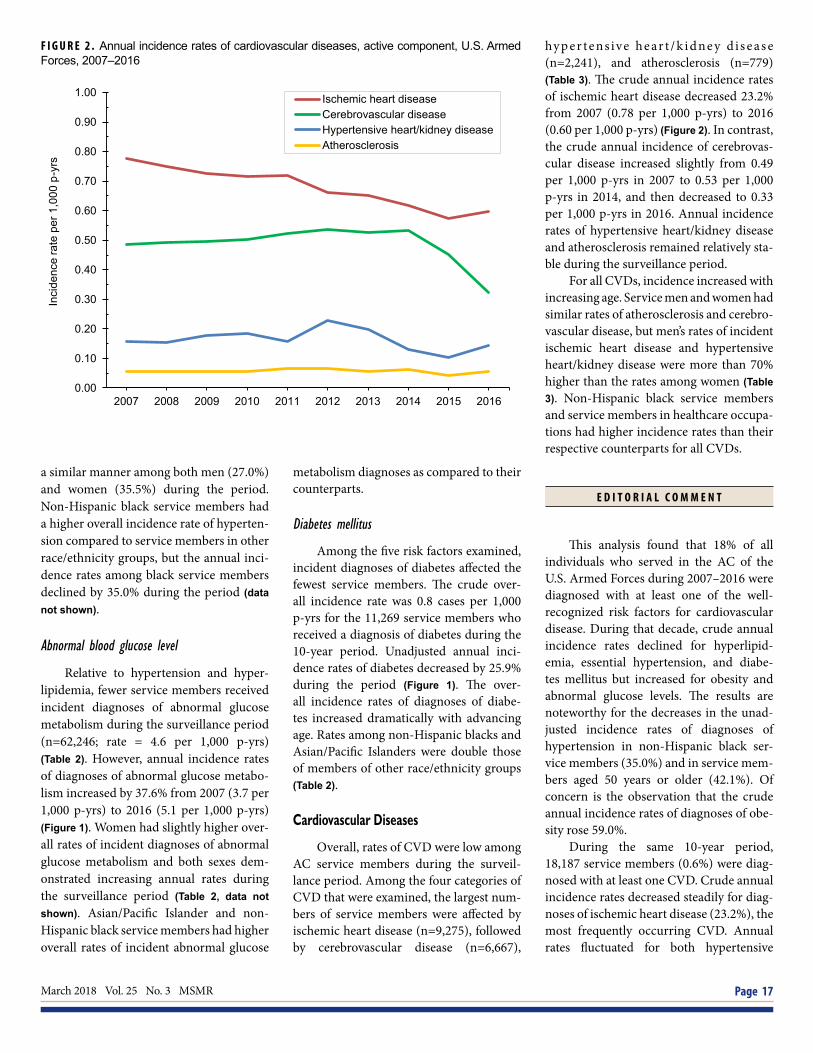
F I G U R E 2 . Annual incidence rates of cardiovascular diseases, active component, U.S. Armed Forces, 2007–2016
0.00
0.10
0.20
0.30
0.40
0.50
0.60
0.70
0.80
0.90
1.00
2007 2008 2009 2010 2011 2012 2013 2014 2015 2016
Inci
denc
e ra
te p
er 1
,000
p-y
rs
Ischemic heart diseaseCerebrovascular diseaseHypertensive heart/kidney diseaseAtherosclerosis
a similar manner among both men (27.0%) and women (35.5%) during the period. Non-Hispanic black service members had a higher overall incidence rate of hyperten-sion compared to service members in other race/ethnicity groups, but the annual inci-dence rates among black service members declined by 35.0% during the period (data not shown).
Abnormal blood glucose level
Relative to hypertension and hyper-lipidemia, fewer service members received incident diagnoses of abnormal glucose metabolism during the surveillance period (n=62,246; rate = 4.6 per 1,000 p-yrs) (Table 2). However, annual incidence rates of diagnoses of abnormal glucose metabo-lism increased by 37.6% from 2007 (3.7 per 1,000 p-yrs) to 2016 (5.1 per 1,000 p-yrs) (Figure 1). Women had slightly higher over-all rates of incident diagnoses of abnormal glucose metabolism and both sexes dem-onstrated increasing annual rates during the surveillance period (Table 2, data not shown). Asian/Pacific Islander and non-Hispanic black service members had higher overall rates of incident abnormal glucose
metabolism diagnoses as compared to their counterparts.
Diabetes mellitus
Among the five risk factors examined, incident diagnoses of diabetes affected the fewest service members. The crude over-all incidence rate was 0.8 cases per 1,000 p-yrs for the 11,269 service members who received a diagnosis of diabetes during the 10-year period. Unadjusted annual inci-dence rates of diabetes decreased by 25.9% during the period (Figure 1). The over-all incidence rates of diagnoses of diabe-tes increased dramatically with advancing age. Rates among non-Hispanic blacks and Asian/Pacific Islanders were double those of members of other race/ethnicity groups (Table 2).
Cardiovascular Diseases
Overall, rates of CVD were low among AC service members during the surveil-lance period. Among the four categories of CVD that were examined, the largest num-bers of service members were affected by ischemic heart disease (n=9,275), followed by cerebrovascular disease (n=6,667),
hyp er tens ive he ar t /k idne y d i s e as e (n=2,241), and atherosclerosis (n=779) (Table 3). The crude annual incidence rates of ischemic heart disease decreased 23.2% from 2007 (0.78 per 1,000 p-yrs) to 2016 (0.60 per 1,000 p-yrs) (Figure 2). In contrast, the crude annual incidence of cerebrovas-cular disease increased slightly from 0.49 per 1,000 p-yrs in 2007 to 0.53 per 1,000 p-yrs in 2014, and then decreased to 0.33 per 1,000 p-yrs in 2016. Annual incidence rates of hypertensive heart/kidney disease and atherosclerosis remained relatively sta-ble during the surveillance period.
For all CVDs, incidence increased with increasing age. Service men and women had similar rates of atherosclerosis and cerebro-vascular disease, but men’s rates of incident ischemic heart disease and hypertensive heart/kidney disease were more than 70% higher than the rates among women (Table 3). Non-Hispanic black service members and service members in healthcare occupa-tions had higher incidence rates than their respective counterparts for all CVDs.
E D I T O R I A L C O M M E N T
This analysis found that 18% of all individuals who served in the AC of the U.S. Armed Forces during 2007–2016 were diagnosed with at least one of the well-recognized risk factors for cardiovascular disease. During that decade, crude annual incidence rates declined for hyperlipid-emia, essential hypertension, and diabe-tes mellitus but increased for obesity and abnormal glucose levels. The results are noteworthy for the decreases in the unad-justed incidence rates of diagnoses of hypertension in non-Hispanic black ser-vice members (35.0%) and in service mem-bers aged 50 years or older (42.1%). Of concern is the observation that the crude annual incidence rates of diagnoses of obe-sity rose 59.0%.
During the same 10-year period, 18,187 service members (0.6%) were diag-nosed with at least one CVD. Crude annual incidence rates decreased steadily for diag-noses of ischemic heart disease (23.2%), the most frequently occurring CVD. Annual rates fluctuated for both hypertensive

MSMR Vol. 25 No. 3 March 2018 Page 18
heart/kidney disease and atherosclerosis and the net 10-year declines for those con-ditions were 7.4% and 4.0%, respectively. Annual rates of diagnoses of cerebrovascu-lar disease slowly increased by 9.8% from 2007 to 2014 but then fell sharply in 2015 and 2016 to a 10-year low rate that repre-sented an overall decline of 33.1%.
The observed declines in incidence for some CVD risk factors and CVD among service members mirror trends seen the U.S. population in recent years and, for that matter, recent decades.1 For service members, the ready access to health care enables early detection of risk factors such as hypertension and hyperlipidemia for which therapeutic interventions can lessen the likelihood of subsequent development of certain CVDs. The early detection of obesity can inform service members’ life-style changes (e.g., diet, exercise) aimed at weight reduction. The benefits of such interventions, if sustained, hold the prom-ise of reducing, or at least delaying, the development of clinical CVDs during their military service as well as long after they have ended their active military careers.
This analysis did not attempt to deter-mine whether risk factors were diagnosed before or after incident diagnoses of CVD. It is plausible that, for many service mem-bers, the diagnoses of risk factors were first recorded at the time of the earliest diagno-ses of CVD. For that reason, the observed associations between increasing numbers of CVDs and the proportions who were diagnosed with at least one CVD risk fac-tor are difficult to interpret. At the time service members were first diagnosed with CVDs they were very likely to have been thoroughly evaluated for the presence of known risk factors. Nevertheless, this anal-ysis found that 23.6% of all service mem-bers with incident CVD diagnoses during the surveillance period did not have any documentation of diagnoses of risk factors in their records at any time during their careers. In contrast, ostensibly healthy ser-vice members never diagnosed with a CVD may not have been carefully evaluated for
all of the five risk factors examined in this study. The presence of hypertension and obesity are readily observable during rou-tine healthcare encounters, but the per-formance of blood testing is required to identify hyperlipidemia, elevated blood glucose, or diabetes.
The observation that incidence rates of all risk factors and CVDs were higher for service members in healthcare occupa-tions than those in other occupations sug-gests that both ready access to health care and enhanced interest in personal health may have enabled this finding. Consistent with this interpretation is the observation that, for most of the diagnoses, the rates for healthcare personnel were only slightly higher than the rates for other occupational groups.
It should be emphasized that this study was not able to capture important risk fac-tor information pertaining to smoking, levels of physical activity, diet, or family his-tory of CVD. Previous surveys of military personnel have found that approximately 25% of service members were current ciga-rette smokers, a level higher than contem-poraneous estimates of about 20% for U.S. civilians.6,7 Data on these risk factors would have been highly relevant to the discussion about the occurrence of CVD in service members who ostensibly had no risk fac-tors; for example, it is possible that many of these individuals were cigarette smok-ers, but data were not available to make this determination. The absence of data about smoking, physical activity, diet, and family history necessitates caution in interpreting the relative impact of risk factors on CVD incidence described in this analysis.
Except for the diagnosis of diabetes mellitus, the counts of risk factors required documentation of a risk factor diagno-sis only once in a service member’s health record. Some of these incident cases of risk factors may represent miscoded, errone-ously coded, or “rule out” (tentative) diag-noses. Finally, it should be emphasized that service members who leave military service prior to receiving a diagnosis would not be
captured in this report. This means that the true incidence of CVD could be underesti-mated among older service members if, for example, only healthier service members (e.g., those with fewer CVD risk factors) stay in military service during older age.
In summary, this analysis documented that diagnoses of CVD risk factors are rel-atively common in active component ser-vice members and that diagnoses of CVDs themselves are uncommon, but not rare. Because the incidence of CVDs tends to rise with advancing age, the identification of CVD risk factors among the relatively young and fit population of service mem-bers offers the opportunity for preventive interventions (medical, lifestyle) that can reduce the incidence of later onset of clini-cal CVD during, but especially after, mili-tary service.
R E F E R E N C E S
1. Benjamin EJ, Blaha MJ, Chiuve SE, et al. Heart Disease and Stroke Statistics–2017 Update: A Re-port from the American Heart Association. Circula-tion. 2017;135(10): e146–e603. 2. National Heart, Lung, and Blood Institute. Cor-onary Heart Disease. https://www.nhlbi.nih.gov/health-topics/coronary-heart-disease. Accessed on 27 February 2018.3. Armed Forces Health Surveillance Center. Sur-veillance snapshot: Age and gender distribution of service members, active component, U.S. Armed Forces, compared to the U.S. population, 2011. MSMR. 2013;20(11):16.4. Armed Forces Health Surveillance Center. Incidence and prevalence of select cardiovas-cular risk factors and conditions, active compo-nent, U.S. Armed Forces, 2003–2012. MSMR. 2013;20(12):16–19.5. Armed Forces Health Surveillance Branch. Ab-solute and relative morbidity burdens attributable to various illnesses and injuries, active component, U.S. Armed Forces, 2016. MSMR. 2017;24(4):2–8.6. Barlas FM, Higgins WB, Pflieger JC, Diecker K. 2011 Department of Defense Health Related Be-haviors Survey of Active Duty Military Personnel. U.S. Department of Defense, TRICARE Manage-ment Activity, Defense Health Cost Assessment and Program Evaluation, and the United States Coast Guard 2013.7. Centers for Disease Control and Prevention (CDC). Current cigarette smoking among adults - United States, 2011. MMWR Morb Mortal Wkly Rep. 2012;61(44):889–894.

March 2018 Vol. 25 No. 3 MSMR Page 19
During 2000–2016, a total of 52,895 active component service members received incident diagnoses of herpes zoster (HZ), for an overall unadjusted incidence rate of 2.5 cases per 1,000 person-years. Compared to their respec-tive counterparts, overall incidence rates of HZ were highest among females, those aged 50 years or older, and Air Force members. Overall rates generally increased with increasing age and were highest among non-Hispanic whites and Asian/Pacific Islanders and lowest among non-Hispanic blacks. Unad-justed annual incidence rates of HZ increased steadily from 2000 to a peak in 2014. From 2000 through 2016, annual rates of HZ increased in each service and increases in annual rates were seen in all race/ethnicity groups. Individu-als who were identified as immunocompromised constituted 2.1% of the total incident HZ cases. During 2000–2016, the cumulative numbers of incident cases of HZ were highest during June, July, and August. The increase in HZ incidence observed in this and many other studies is a public health concern that requires a better understanding of key risk factors. Additional research focused on these factors could make trends more interpretable, suggest new approaches for prevention and treatment of HZ, and allow for better target-ing of existing strategies.
Herpes Zoster, Active Component, U.S. Armed Forces, 2000–2016Valerie F. Williams, MA, MS; Shauna Stahlman, PhD, MPH; Saixia Ying, PhD
Herpes zoster (HZ), also known as shingles, is a blistering, often painful rash caused by a reacti-
vation of the varicella-zoster virus (VZV) that has remained dormant within the sensory ganglia following primary VZV infection (chickenpox).1 HZ rash most commonly appears on the trunk along a thoracic dermatome.1 In most cases, the rash does not cross the body's midline; however, in approximately one-fifth of HZ cases, the rash overlaps adjacent der-matomes.1 The rash generally develops into vesicular lesions that form over 3–5 days and progressively dry and crust over, after which the lesions are no longer con-sidered infectious.1 HZ-infected individu-als can spread the virus to those who are susceptible to varicella because they nei-ther experienced chickenpox nor received the varicella vaccine.2 VZV is transmitted by direct contact with active HZ lesions or by respiratory aerosols from infected
individuals.2-4 The most common compli-cation of HZ is chronic pain (postherpetic neuralgia), which is related to inflamma-tion of the dorsal spinal ganglion and hem-orrhagic necrosis of peripheral nerve cells.5 Although HZ seldom results in mortality, the morbidity of this disease can have sig-nificant negative effects on the functional status and health-related quality of life of affected individuals.6,7
In the U.S. general population, the incidence rate of HZ is between three and five cases per 1,000 person-years (p-yrs), with similar rates reported in Canada, Europe, and Asia-Pacific.8,9 The incidence of HZ increases rapidly after age 50 and is correlated with waning cell-mediated immunity.10 HZ incidence is also high among people with immunosuppressive conditions.11
There has been a gradual increase in HZ incidence rates among adults in the U.S. over the past several decades
independent of the aging demographic.12-16 Similar temporal increases have been reported in Canada, the U.K., Spain, Japan, Taiwan, and Australia.17-26 The basis for the increase remains unclear, but hypotheses include the widespread use of childhood varicella vaccination, which might decrease the boosting of immunity from exposure to wild-type VZV; the introduction of antivi-ral therapy, which might increase the num-ber of HZ-infected individuals who seek care; and the increased use of immunosup-pressive therapies for numerous chronic conditions, which might increase suscepti-bility to HZ.13,14,21,24,27
In 2011, the MSMR reported informa-tion on the overall and annual incidence rates of HZ among active component mem-bers during 2000–2010.28 That report doc-umented consistently increasing numbers and rates (unadjusted) of HZ during the 11-year surveillance period.28 The current analysis updates and expands on this earlier work by examining age of HZ onset, deter-mining the number of active component service members with qualifying diagno-ses of HZ during deployment (2008–2016), identifying the proportion of HZ cases clas-sified as immunosuppressed, and describ-ing the incidence of HZ during 2000–2016.
M E T H O D S
The surveillance period was 1 Janu-ary 2000 through 31 December 2016. The surveillance population consisted of active component service members of the U.S. Army, Navy, Air Force, or Marine Corps who served at any time during the surveil-lance period. Diagnoses were ascertained from administrative records of all medi-cal encounters of individuals who received care in fixed (i.e., not deployed or at sea) medical facilities of the Military Health System (MHS) or civilian facilities in the

MSMR Vol. 25 No. 3 March 2018 Page 20
T A B L E 1 . ICD-9 and ICD-10 diagnostic codes used for herpes zoster case classificationpurchased care system. These data are maintained in the electronic database of the Defense Medical Surveillance System (DMSS). In-theater diagnoses were iden-tified from the medical records of service members deployed to a U.S. Central Com-mand area of responsibility and whose healthcare encounters were documented in the Theater Medical Data Store (TMDS).
An incident case of HZ was defined by the presence of any qualifying ICD-9 or ICD-10 diagnosis code in the 1st or 2nd diagnostic position of the record of a healthcare encounter in an outpatient or inpatient setting (Table 1). A similar case definition was employed in several U.S. studies of HZ incidence using administra-tive data.12,13,29 Because a previous MSMR analysis used a case definition that allowed for any qualifying diagnosis code in any diagnostic position, a sensitivity analysis was conducted to compare the incidence rates obtained from using the two different case definitions.28 The incident date was considered the date of the case-defining diagnosis. An individual could be counted as an incident case of HZ once per lifetime. Service members with case-defining HZ diagnoses before the start of the surveil-lance period were excluded from the anal-ysis because they were not considered at risk of incident (i.e., first ever) HZ.
Consistent with many published studies of HZ incidence,13,14,18,28,29,30 indi-viduals with episodes first denoted by a diagnosis code for postherpetic trigemi-nal neuralgia (ICD-9: 053.12; ICD-10: B02.22) or postherpetic polyneuropathy (ICD-9: 053.13; ICD-10: B02.23) were not included as incident HZ cases because of the increased potential that these diagno-ses represent sporadic long-term follow-up for prior HZ episodes (HZ sequelae). Because the risk of HZ is markedly elevated in immunosuppressed individuals, service members who were diagnosed as incident HZ cases who were immunosuppressed in the year prior to their incident case diag-nosis were identified. Immunosuppression status was determined by the presence of two ICD-9 or ICD-10 diagnostic, proce-dure, or CPT codes (in any position) denot-ing care for certain hematologic diseases (e.g., aplastic anemia), cancer, HIV infec-tion, or transplantation (hematopoietic
stem cell or solid organ) on different days during an inpatient or outpatient encoun-ter (Table 2).18
Incidence rates were calculated as inci-dent HZ diagnoses per 1,000 p-yrs of active component service. Person-time was cen-sored when any of the following condi-tions was met: an individual was identified as an HZ case; an individual left service or died; the surveillance period ended. Only non-deployed person-time was used in the denominator. If a service member had more than one case-defining encounter, an inpatient diagnosis was prioritized over an outpatient diagnosis.
HZ cases occurring during deploy-ments were analyzed separately. To qualify as a case of HZ during deployment, an indi-vidual needed to have a medical encoun-ter with a case-defining diagnosis of HZ
documented in the TMDS. This medical encounter had to occur between the start and end dates of a deployment record. TMDS records that fell outside of the start and end dates of a deployment record were excluded from the analysis. The number of deployed service members in a given year was calculated as the total number of unique service members with a deploy-ment record overlapping with each given calendar year. The surveillance period of 2008–2016 was used to examine cases dur-ing deployment because TMDS data first became available in the DMSS in 2008.
Median age at incident HZ diagno-sis was computed overall and by race/eth-nicity group. Finally, the cumulative total numbers of incident HZ cases per month were computed to identify any pattern of seasonality.
ICD-9 codes ICD-10 codes 053.0 (herpes zoster with meningitis) B02.1 (zoster meningitis)
053.1 (herpes zoster with nervous system complications)
- 053.10 (herpes zoster with unspecified nervous system complication)
- B02.29 (other postherpetic nervous system involvement)
- 053.11 (geniculate herpes zoster – herpetic geniculate ganglionitis)
- B02.21 (postherpetic geniculate ganglionitis)
- 053.14 (herpes zoster myelitis) - B02.24 (postherpetic myelitis)
- 053.19 (herpes zoster with other nervous system complications – other)
B02.0 (zoster encephalitis) B02.2 (zoster with other nervous system involvement)
053.2 (herpes zoster with ophthalmic complications)
B02.3 (zoster ocular disease)
- 053.20 (herpes zoster dermatitis of eyelid) - B02.39 (other herpes zoster eye disease)
- 053.21 (herpes zoster keratoconjunctivitis) - B02.33 (zoster keratitis)
- 053.22 (herpes zoster iridocyclitis) - B02.32 (zoster iridocyclitis)
- 053.29 (herpes zoster with other ophthalmic complication)
- B02.30 (zoster ocular disease, unspecified) - B02.31 (zoster conjunctivitis) - B02.34 (zoster scleritis) - B02.39 (above)
053.7 (herpes zoster with other specified complications)
B02.8 (zoster with other complications)
- 053.71 (otitis externa due to herpes zoster) B02.8 (above)
- 053.79 (herpes zoster with other specified complications)
B02.8 (above)
053.8 (herpes zoster with unspecified complication)
B02.7 (disseminated zoster)B02.8 (above)
053.9 (herpes zoster without mention of complication)
B02.9 (zoster without complications)
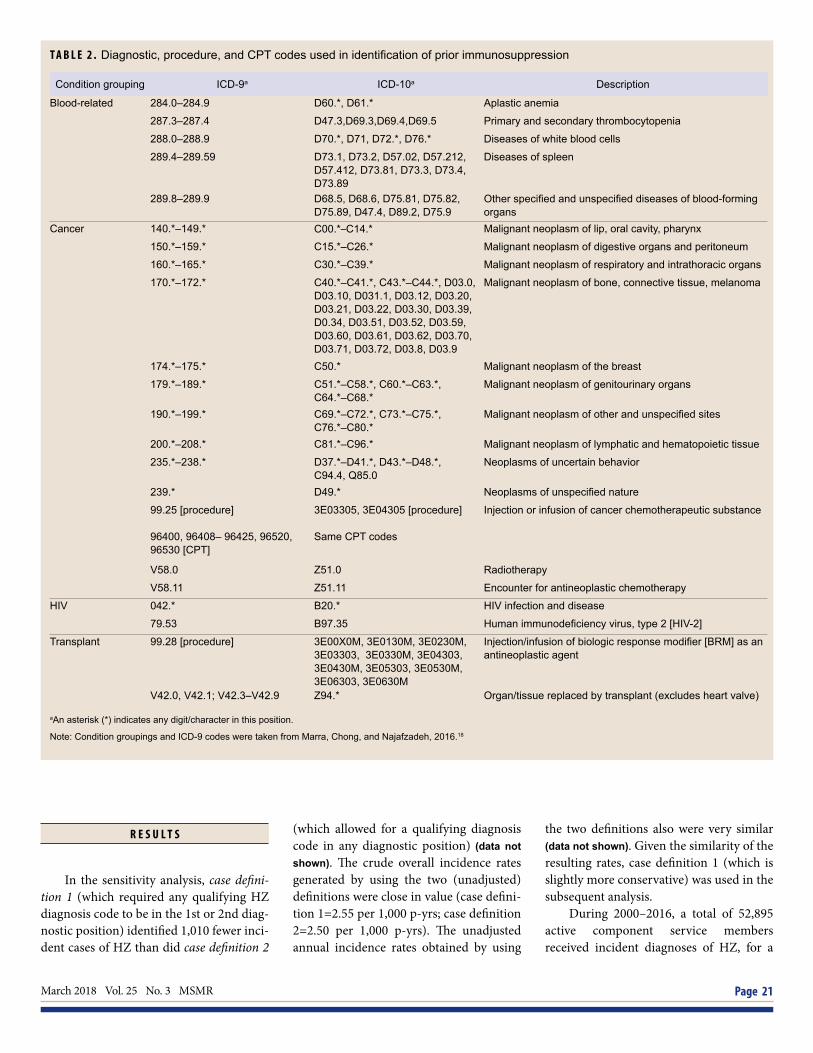
March 2018 Vol. 25 No. 3 MSMR Page 21
R E S U L T S
In the sensitivity analysis, case defini-tion 1 (which required any qualifying HZ diagnosis code to be in the 1st or 2nd diag-nostic position) identified 1,010 fewer inci-dent cases of HZ than did case definition 2
(which allowed for a qualifying diagnosis code in any diagnostic position) (data not shown). The crude overall incidence rates generated by using the two (unadjusted) definitions were close in value (case defini-tion 1=2.55 per 1,000 p-yrs; case definition 2=2.50 per 1,000 p-yrs). The unadjusted annual incidence rates obtained by using
the two definitions also were very similar (data not shown). Given the similarity of the resulting rates, case definition 1 (which is slightly more conservative) was used in the subsequent analysis.
During 2000–2016, a total of 52,895 active component service members received incident diagnoses of HZ, for a
T A B L E 2 . Diagnostic, procedure, and CPT codes used in identification of prior immunosuppression
Condition grouping ICD-9a ICD-10a Description
Blood-related 284.0–284.9 D60.*, D61.* Aplastic anemia
287.3–287.4 D47.3,D69.3,D69.4,D69.5 Primary and secondary thrombocytopenia
288.0–288.9 D70.*, D71, D72.*, D76.* Diseases of white blood cells
289.4–289.59 D73.1, D73.2, D57.02, D57.212, D57.412, D73.81, D73.3, D73.4, D73.89
Diseases of spleen
289.8–289.9 D68.5, D68.6, D75.81, D75.82, D75.89, D47.4, D89.2, D75.9
Other specified and unspecified diseases of blood-forming organs
Cancer 140.*–149.* C00.*–C14.* Malignant neoplasm of lip, oral cavity, pharynx
150.*–159.* C15.*–C26.* Malignant neoplasm of digestive organs and peritoneum
160.*–165.* C30.*–C39.* Malignant neoplasm of respiratory and intrathoracic organs
170.*–172.* C40.*–C41.*, C43.*–C44.*, D03.0, D03.10, D031.1, D03.12, D03.20, D03.21, D03.22, D03.30, D03.39, D0.34, D03.51, D03.52, D03.59, D03.60, D03.61, D03.62, D03.70, D03.71, D03.72, D03.8, D03.9
Malignant neoplasm of bone, connective tissue, melanoma
174.*–175.* C50.* Malignant neoplasm of the breast
179.*–189.* C51.*–C58.*, C60.*–C63.*, C64.*–C68.*
Malignant neoplasm of genitourinary organs
190.*–199.* C69.*–C72.*, C73.*–C75.*, C76.*–C80.*
Malignant neoplasm of other and unspecified sites
200.*–208.* C81.*–C96.* Malignant neoplasm of lymphatic and hematopoietic tissue
235.*–238.* D37.*–D41.*, D43.*–D48.*, C94.4, Q85.0
Neoplasms of uncertain behavior
239.* D49.* Neoplasms of unspecified nature
99.25 [procedure]
96400, 96408– 96425, 96520, 96530 [CPT]
3E03305, 3E04305 [procedure]
Same CPT codes
Injection or infusion of cancer chemotherapeutic substance
V58.0 Z51.0 Radiotherapy
V58.11 Z51.11 Encounter for antineoplastic chemotherapy
HIV 042.* B20.* HIV infection and disease
79.53 B97.35 Human immunodeficiency virus, type 2 [HIV-2]
Transplant 99.28 [procedure] 3E00X0M, 3E0130M, 3E0230M, 3E03303, 3E0330M, 3E04303, 3E0430M, 3E05303, 3E0530M, 3E06303, 3E0630M
Injection/infusion of biologic response modifier [BRM] as an antineoplastic agent
V42.0, V42.1; V42.3–V42.9 Z94.* Organ/tissue replaced by transplant (excludes heart valve)
aAn asterisk (*) indicates any digit/character in this position.
Note: Condition groupings and ICD-9 codes were taken from Marra, Chong, and Najafzadeh, 2016.18

MSMR Vol. 25 No. 3 March 2018 Page 22
crude overall incidence rate of 2.5 cases per 1,000 p-yrs (Table 3). The vast major-ity (99.6%) of all incident HZ cases were diagnosed during outpatient visits (data not shown). Compared to their respective counterparts, the overall incidence rates were highest among females (3.2 cases per 1,000 p-yrs), those aged 50 years or older (6.1 cases per 1,000 p-yrs), and Air Force members (3.0 cases per 1,000 p-yrs). Over-all incidence rates generally increased with
increasing age (Table 3). Females aged 50 years or older had the highest subgroup-specific overall incidence rate (7.4 cases per 1,000 p-yrs) (Figure 1). The overall rates of HZ were highest among non-His-panic whites (2.7 cases per 1,000 p-yrs) and Asian/Pacific Islanders (2.6 cases per 1,000 p-yrs) and lowest among non-Hispanic blacks (1.9 cases per 1,000 p-yrs) (Table 3). Across military occupations, crude over-all incidence rates were highest among
healthcare workers (3.1 cases per 1,000 p-yrs) and lowest among those working in infantry/artillery/combat engineering (2.0 cases per 1,000 p-yrs) and armor/motor transport (2.0 cases per 1,000 p-yrs).
Annual incidence rates of HZ increased steadily from 1.4 cases per 1,000 p-yrs in 2000 to a peak of 3.1 cases per 1,000 p-yrs in 2014, after which rates declined slightly to 2.8 cases per 1,000 p-yrs in 2016 (Figure 2). This increasing trend was observed among both female and male service members, with annual rates of HZ among females con-sistently higher than among males (Figure 2). During the 17-year surveillance period, annual incidence rates of HZ increased in each service; however, during each year of the period, HZ rates were markedly higher among Air Force members than among members of the other services (Figure 3). Increases in annual HZ incidence rates occurred with increasing age in all but the youngest age group (less than 20 years), with the greatest increases observed among ser-vice members aged 30 years or older (Figure 4). During the surveillance period, increases in annual rates were seen in all race/ethnic-ity groups; Asian/Pacific Islander, non-His-panic white, and Hispanic service members showed the greatest increases over time and non-Hispanic black service members showed the smallest increase (Figure 5).
Between 2008 and 2016, TMDS records documented a total of 1,658 cases of HZ among active component service members during deployment to a U.S. Central Com-mand area of responsibility. During this period, the number of HZ cases per 10,000 deployed active component service mem-bers peaked at 6.8 in 2013 and subsequently declined to a low of 5.1 in 2016 (Figure 6).
The median age at case-defining HZ diagnosis was 28 years (interquartile range [IQR]=23–36) (data not shown). Crude com-parisons of the age at HZ diagnosis by race/ethnicity group showed that Hispanic service members and those of other/unknown race/ethnicity had the youngest median age at diagnosis (median 27 years, IQR=23–34 for both groups), while Asian/Pacific Islander service members had the oldest median age of onset (median 30 years, IQR=24–38) (data not shown).
The vast majority (89.7%) of incident HZ cases during the surveillance period had
T A B L E 3 . Incident cases and incidence rates of herpes zoster,a by demographic and military characteristics, active component, U.S. Armed Forces, 2000–2016
No. Rateb IRR
Total 52,895 2.5 .
Sex
Male 42,542 2.4 ref
Female 10,353 3.2 1.4
Age (years)
<20 5,227 1.8 ref
20–24 11,922 2.2 1.2
25–29 11,677 2.5 1.4
30–34 8,322 2.6 1.5
35–39 7,383 2.8 1.6
40–49 7,191 3.5 2.0
50+ 1,173 6.1 3.4
Race/ethnicity
Non-Hispanic white 35,000 2.7 ref
Non-Hispanic black 6,901 1.9 0.7
Hispanic 5,610 2.3 0.9
Asian/Pacific Islander 2,060 2.6 1.0
Other/unknown 3,324 2.4 0.9
Service
Army 19,210 2.6 ref
Navy 11,514 2.1 0.8
Air Force 16,295 3.0 1.2
Marine Corps 5,876 2.0 0.8
Military occupation
Infantry/artillery/combat engineering 5,657 2.0 ref
Armor/motor transport 1,260 2.0 1.0
Pilot 1,382 2.8 1.4
Aircrew 842 2.7 1.3
Repair/engineer 14,585 2.3 1.2
Communications/intelligence 12,781 2.7 1.3
Healthcare 5,808 3.1 1.6
Other/unknown 10,580 2.6 1.3
aOne inpatient or outpatient encounter with herpes zoster diagnosis in 1st or 2nd diagnostic positionbRate per 1,000 person-years

March 2018 Vol. 25 No. 3 MSMR Page 23
uncomplicated HZ (Table 4). Other nervous system involvement (3.8%), ophthalmic complications (3.3%), and zoster with other complications (2.7%) were relatively less frequent complications, while other zoster complications (meningitis [0.53%], enceph-alitis [0.01%]) were rare (Table 4).
Between 2000 and 2016, 2.1% (n=1,118) of the total incident HZ cases were identified as immunocompromised during the year
before their case-defining diagnoses (data not shown). HZ cases that were classified as immunocompromised were due to cancer (62.9%), blood-related conditions (18.9%) such as diseases of white blood cells (neutro-penia), HIV infection (14.6%), or transplant (3.7%) (data not shown).
Overall during 2000–2016, cumula-tive monthly numbers of incident HZ cases ranged from 3,899 (February) to 4,834 (June
and July). The cumulative numbers of inci-dent cases of HZ were highest during June, July, and August (Figure 7).
E D I T O R I A L C O M M E N T
The results of the current study show that the annual incidence rates of HZ diag-noses among active component service members doubled during the past 17 years. During this period, the incidence of HZ diagnoses increased in both sexes and in all but the youngest age groups. Increases in annual rates were seen over time in all race/ethnicity groups, with the greatest increases seen in Asian/Pacific Islander and Hispanic service members and the smallest increase seen in non-Hispanic black service mem-bers. The findings by sex and by age mir-ror the results of HZ incidence studies in the U.S. and elsewhere.10-13,16-18,26,27,29,31-35 The cause of the increase in HZ incidence over time remains unclear.
The overall incidence of HZ increased with increasing age and was higher among females than males in all age groups. The age-related rise of HZ observed in many other studies has been attributed to a decline in cell-mediated immunity to VZV due to immunosenescence.31,36 Differ-ences in healthcare-seeking behavior and/or immunologic or hormonal mechanisms have been suggested as possible reasons underlying the differences in incidence by sex.37 The overall rates of HZ were high-est among non-Hispanic whites and lowest among non-Hispanic blacks. Several stud-ies have found similar differences among race/ethnicity groups in the risk of HZ. Results of studies carried out in the U.S. and elsewhere suggest that blacks have about half the risk of HZ as whites.10,14,17,20,38-40 Possible reasons for these risk differences could include differences in genetic risk, access to health care, and/or healthcare-seeking behavior.37
Similar to the findings of the 2011 MSMR analysis, annual incidence rates of HZ were consistently higher among mem-bers of the Air Force, compared to mem-bers of the other services throughout the surveillance period.28 The Air Force has a relatively higher number of female service
F I G U R E 1 . Incidence rates of herpes zoster, total and by sex and age group, active component, U.S. Armed Forces, 2000–2016
F I G U R E 2 . Annual incidence rates of herpes zoster, total and by sex, active component, U.S. Armed Forces, 2000–2016
2.6 3.0 3.1 3.1
3.6
4.4
7.4
1.5 1.9
2.4 2.5 2.7
3.4
5.8
0.0
1.0
2.0
3.0
4.0
5.0
6.0
7.0
8.0
<20 20–24 25–29 30–34 35–39 40–49 50+
Inci
denc
e ra
te p
er 1
,000
p-y
rs
Age group
FemaleMaleTotal
2.3
3.2
1.3
2.8
0.0
1.0
2.0
3.0
4.0
5.0
2000
2001
2002
2003
2004
2005
2006
2007
2008
2009
2010
2011
2012
2013
2014
2015
2016
Inci
denc
e ra
te p
er 1
,000
p-y
rs
FemaleMaleTotal

MSMR Vol. 25 No. 3 March 2018 Page 24
members than the other services.41 This demographic difference may explain, at least in part, the higher rates of HZ among Air Force members relative to those in the other services. In addition, differences in HZ rates across the services may reflect differences in occupational and leisure activities.28 For example, results of several studies suggest that exposure to solar ultra-violet radiation may suppress cell-mediated immunity and possibly trigger reactivation of latent VZV.42,43 Given these findings, Air Force members, particularly high altitude
(fixed-wing) aviators, would be at increased occupational risk of HZ.
Another finding consistent with the results of the 2011 MSMR analysis was that the overall incidence rate of HZ was highest among healthcare workers. Survey-based studies suggested that physicians’ exposure to VZV may boost immunity to latent VZV and thus confers a protective effect. How-ever, these studies reported relatively low response rates and resultant small sample sizes.44,45 A more recent large population-based study conducted in Taiwan found
that healthcare workers (including der-matologists and pediatricians) had a sig-nificantly higher incidence of HZ than the general population.46
Crude comparisons of the age at diag-nosis by race/ethnicity group showed that Asian/Pacific Islander service members had the oldest median age at HZ diagno-sis, while Hispanic service members and those of other/unknown race/ethnicity had the youngest median age at onset. How-ever, this difference could be due, at least in part, to underlying differences in the age distributions of the race/ethnicity groups. There is limited evidence that race/eth-nicity is associated with age at HZ onset. A report of individuals with incident HZ participating in antiviral trials showed that being non-white and a resident of a tropi-cal country were independently associated with younger age at HZ onset, although it was noted that this association could reflect participation bias or undiagnosed HIV infection.47
The most common HZ complications were other nervous system involvement and zoster ophthalmicus, which also have been reported from a few previous studies con-ducted in the U.S. and elsewhere.11,48,49 The percentage of HZ cases who were immuno-compromised at the time of HZ diagnosis is relatively well documented in the U.S. over the past two decades and ranged from 6% to 11% in those studies whose populations included individuals younger than 65 years of age.11,50-52 It is important to note that the much lower percentage of total HZ cases classified as immunocompromised in the current study (2.1%) likely reflects differ-ences between the U.S. active component military population and the more special-ized and relatively older populations used in other studies.
Results of studies of a seasonal pattern to HZ incidence are mixed. Studies from the U.S., Japan, Poland, Taiwan, and Australia reported that incidence of HZ was higher in the summer, particularly for exposed skin sites.22,24,25,28,42,46 However, several other studies reported no seasonal pattern.10,17,53 It has been posited that high exposure to ultraviolet radiation during summer months may suppress cell-mediated immu-nity and possibly trigger reactivation of latent VZV.24,42,43,54,55 Herpes simplex virus,
F I G U R E 3 . Annual incidence rates of herpes zoster, by service, active component, U.S. Armed Forces, 2000–2016
F I G U R E 4 . Annual incidence rates of herpes zoster, by age group, active component, U.S. Armed Forces, 2000–2016
2.1
3.3
1.0
2.1
0.0
1.0
2.0
3.0
4.0
5.020
00
2001
2002
2003
2004
2005
2006
2007
2008
2009
2010
2011
2012
2013
2014
2015
2016
Inci
denc
e ra
te p
er 1
,000
p-y
rs
Air ForceArmyNavyMarine Corps
3.2
8.1 7.2
2.0
4.6
1.7
3.9
2.8
1.3
2.0
1.1
2.5 1.0
0.0
1.0
2.0
3.0
4.0
5.0
6.0
7.0
8.0
9.0
10.0
2000
2001
2002
2003
2004
2005
2006
2007
2008
2009
2010
2011
2012
2013
2014
2015
2016
Inci
denc
e ra
te p
er 1
,000
p-y
rs
50+40–49 35–39 30–34 25–29 20–24 <20

March 2018 Vol. 25 No. 3 MSMR Page 25
F I G U R E 5 . Annual incidence rates of herpes zoster, by race/ethnicity, active component, U.S. Armed Forces, 2000–2016
1.5
3.1
2.9
1.1
2.5
2.1
0.0
1.0
2.0
3.0
4.020
00
2001
2002
2003
2004
2005
2006
2007
2008
2009
2010
2011
2012
2013
2014
2015
2016
Inci
denc
e ra
te p
er 1
,000
p-y
rs
Non-Hispanic whiteAsian/Pacific IslanderOther/unknownHispanicNon-Hispanic black
T A B L E 4 . Incident counts of herpes zoster, by diagnostic type (4th digit level), active component, U.S. Armed Forces, 2000–2016
Total 2000–2016
Diagnostic type No. % of total cases
Zoster with other nervous system involvement (ICD-9: O53.10, O53.11, O53.14, O53.19; ICD-10: B02.21, B02.24, B02.29) 1,983 3.7
Zoster occular disease/with opthalmic complications (ICD-9: O53.2*; ICD-10: B02.3*) 1,771 3.3
Disseminated, unspecified or other complication (ICD-9: O53.7*, 053.8, O53.9; ICD-10: B02.7, B02.8) 1,424 2.7
Zoster meningitis (ICD-9: O53.0; ICD-10: B02.1) 278 0.5
Zoster encephalitis (ICD-9: O53.19; ICD-10: B02.0) 4 0.01
Without mention of complication (ICD-9: O53.9; ICD-10: B02.9) 47,435 89.7
Total 52,895 100.0
which belongs to the same alpha subfam-ily of herpes viruses as VZV, is reactivated by ultraviolet light.43 Although some slight seasonal variation in the numbers of HZ cases was observed in the current study, the possible role of other environmental factors in reactivation cannot be ruled out. Addi-tional research is needed to understand potential environmental factors associated with risk of HZ.
The current study had several limita-tions. The analysis did not capture service
members with HZ who did not seek med-ical care or who sought care outside the MHS, but both groups are anticipated to be small. In addition, as incident cases were identified based on the presence of a quali-fying ICD-9 or ICD-10 diagnosis code for HZ recorded during a healthcare encoun-ter, the validity of the results depends upon the accuracy of a physician-assigned diag-nosis of HZ and the resultant diagnostic coding generated by a given encounter. Misclassification between HZ and herpes
simplex virus has been reported56; however, the routine clinical diagnosis of HZ is gen-erally regarded as reliable.1 Furthermore, previous studies have found that the posi-tive predictive value of ICD-9 diagnostic codes for HZ in administrative claims data is relatively high (84%–94%).30,57,58 Finally, crude HZ incidence rate differences may have been due, at least in part, to differ-ences in the demographic factors of age, sex, and race/ethnicity. Observed differ-ences in incidence rates of HZ by service and occupational category warrant further analysis to examine adjusted (e.g., by age, sex, race/ethnicity) incidence rates among service members within these groups.
HZ-related pain and discomfort can have significant negative effects on employ-ment-related productivity, activities of daily living, and quality of life.6,7 Depend-ing on the location, extent and severity of the lesions, service members affected by HZ may experience debilitating pain and sequelae that could prevent them from car-rying out their daily duties, particularly in field operational settings. Furthermore, the management of HZ and its complica-tions impose considerable economic bur-den on the MHS. In the U.S., the annual cost of medical care for incident HZ cases has been estimated at $1.1 billion.59 The increase in HZ incidence observed in this and many other studies is a public health concern that requires better recognition and understanding of key risk factors. Additional research focused on these fac-tors could make trends more interpretable, suggest new approaches for prevention and treatment of HZ, and allow for better tar-geting of existing strategies.
R E F E R E N C E S
1. Gnann JW Jr, Whitley RJ. Clinical practice. Her-pes zoster. N Engl J Med. 2002;347(5):340–346.2. Centers for Disease Control and Prevention. Shingles (herpes zoster). http://www.cdc.gov/shingles/hcp/clinical–overview.html. Accessed on 1 December 2017.3. Yoshikawa T, Ihira M, Suzuki K, et al. Rapid contamination of the environments with varicella-zoster virus DNA from a patient with herpes zoster. J Med Virol. 2001;63(1):64–66. 4. Viner K, Perella D, Lopez A, et al. Transmission of varicella zoster virus from individuals with herpes zoster or varicella in school and day care settings. J Infect Dis. 2012;205(9):1336–1341.

MSMR Vol. 25 No. 3 March 2018 Page 26
F I G U R E 6 . Numbers of herpes zoster cases per 10,000 service members deployed to a U.S. Central Command area of responsibility, 2008–2016
F I G U R E 7 . Cumulative numbers of incident cases of herpes zoster, by month of diagnosis, ac-tive component, U.S. Armed Forces, 2000–2016
5.9 6.3 6.4 6.4
6.0
6.8
6.2 6.3
5.1
0.0
1.0
2.0
3.0
4.0
5.0
6.0
7.0
8.0
0
50,000
100,000
150,000
200,000
250,000
300,000
350,000
400,000
450,000
500,000
2008 2009 2010 2011 2012 2013 2014 2015 2016
Cas
es p
er 1
0,00
0 de
ploy
ed s
ervi
ce m
embe
rs
No.
of d
eplo
yed
serv
ice
mem
bers
4,215 3,899
4,585 4,340
4,528 4,609 4,834 4,834
4,367 4,430 4,136 4,118
0
1,000
2,000
3,000
4,000
5,000
6,000
Jan Feb Mar Apr May Jun Jul Aug Sep Oct Nov Dec
No.
of c
ases
5. Mueller NH, Gilden DH, Cohrs RJ, Mahalingam R, Nagel MA. Varicella zoster virus infection: clini-cal features, molecular pathogenesis of disease, and latency. Neurol Clin. 2008;26(3):675–697, viii.6. Katz J, Cooper EM, Walther RR, Sweeney EW, Dworkin RH. Acute pain in herpes zoster and its impact on health-related quality of life. Clin Infect Dis. 2004;39(3):342–348. 7. Rampakakis E, Stutz M, Kawai K, et al. Asso-ciation between work time loss and quality of life
in patients with herpes zoster: a pooled analysis of the MASTER studies. Health Qual Life Outcomes. 2017;15(1):11.8. Centers for Disease Control and Prevention. Shingles (Herpes Zoster). Clinical Overview. https://www.cdc.gov/shingles/hcp/clinical-overview.html. Accessed on 15 November 2017.9. Kawai K, Gebremeskel BG, Acosta CJ. Sys-tematic review of incidence and complications of herpes zoster: towards a global perspective. BMJ
Open. 2014;4(6):e004833.10. Cohen JI. Clinical practice: herpes zoster. N Engl J Med. 2013;369(3):255–263.11. Thomas SL, Hall AJ. What does epidemiology tell us about risk factors for herpes zoster? Lancet Infect Dis. 2004;4(1):26–33.12. Yawn BP, Saddier P, Wollan PC, et al. A popula-tion-based study of the incidence and complication rates of herpes zoster before zoster vaccine intro-duction. Mayo Clin Proc. 2007;82(11):1341–1349. 13. Rimland D, Moanna A. Increasing incidence of herpes zoster among Veterans. Clin Infect Dis. 2010;50(7):1000–1005. 14. Leung J, Harpaz R, Molinari NA, Jumaan A, Zhou F. Herpes zoster incidence among insured persons in the United States, 1993–2006: evalu-ation of impact of varicella vaccination. Clin Infect Dis. 2011;52(3):332–340.15. Hales CM, Harpaz R, Joesoef MR, et al. Ex-amination of links between herpes zoster incidence and childhood varicella vaccination. Ann Intern Med. 2013;159(11):739–745.16. Kawai K, Yawn BP, Wollan P, Harpaz R. In-creasing incidence of herpes zoster over a 60-year period from a population-based study. Clin Infect Dis. 2016;63(2):221–226.17. Brisson M, Edmunds WJ, Law B, et al. Epi-demiology of varicella zoster virus infection in Canada and the United Kingdom. Epidemiol Infect. 2001;127(2),305–314.18. Marra F, Chong M, Najafzadeh M. Increasing incidence associated with herpes zoster infec-tion in British Columbia, Canada. BMC Infect Dis. 2016;16(1):589.19. Russell ML, Schopflocher DP, Svenson L, Vi-rani SN. Secular trends in the epidemiology of shin-gles in Alberta. Epidemiol Infect. 2007;135(6):908–913.20. Esteban-Vasallo MD, GilPrieto R, Dominguez-Berjón MF, Ashtray-Mochales J, Gil de Miguel A. Temporal trends in incidence rates of herpes zoster among patients treated in primary care centers in Madrid (Spain), 2005–2012. J Infect. 2014;68(4):378–386.21. Pérez-Farinós N, Ordobás M, García-Fernán-dez C, et al. Varicella and herpes zoster in Madrid, based on the Sentinel General Practitioner Net-work: 1997–2004. BMC Infect Dis. 2007;7:59.22. Toyama N, Shiraki K; Society of the Miyaza-ki Prefecture Dermatologists. Epidemiology of herpes zoster and its relationship to varicella in Japan: a 10-year survey or 43,388 herpes zos-ter cases in Miyazaki prefecture. J Med Virol. 2009;81(10):2053–2058.23. Chao DY, Chien YZ, Yeh YP, Hsu PS, Lian IB. The incidence of varicella and herpes zoster in Taiwan during a period of increasing varicella vaccine coverage, 2000–2008. Epidemiol Infect. 2012;140(6):1131–1140. 24. Wu PY, Wu HD, Chou TC, Sung FC. Vari-cella vaccination alters the chronological trends of herpes zoster and varicella. PLoS One. 2013;8(10):e77709. 25. Jardine A, Conaty SJ, Vally H. Herpes zoster in Australia: evidence of increase in incidence in adults attributable to varicella immunization? Epi-demiol Infect. 2011;139(5):658–665. 26. MacIntyre CR, Stein A, Harrison C, Britt H, Mahimbo A, Cunningham A. Increasing trends of herpes zoster in Australia. PLoS One. 2015;10(4):e0125025.27. Jumaan AO, Yu O, Jackson LA, Bohlke K,
March 2018 Vol. 25 No. 3 MSMR Page 27
Galil K, Seward JF. Incidence of herpes zoster, before and after varicella vaccination-associated decreases in the incidence of varicella. J Infect Dis. 2005;191(12):2002–2007.28. Cockrill JA. Herpes zoster, active compo-nent, U.S. Armed Forces, 2000–2010. MSMR. 2011;18(7):16–18.29. Insinga RP, Itzler RF, Pellissier JM, Saddier P, Nikas AA. The incidence of herpes zoster in a United States administrative database. J Gen In-tern Med. 2005;20(8):748–753.30. Donahue JG, Choo PW, Manson JE, Platt R. The incidence of herpes zoster. Arch Intern Med. 1995;155(15):1605–1609.31. Hope-Simpson RE. Postherpetic neuralgia. J R Coll Gen Pract. 1975;25(157):571–575.32. Schmader K. Herpes zoster in older adults. Clin Infect Dis. 2001;32(10):1481–1486.33. Fleming DM, Cross KW, Cobb WA, Champion RS. Gender difference in the incidence of shingles. Epidemiol Infect. 2004;132(1):1–5.34. Oxman MN, Levin MJ, Johnson GR, et al. A vaccine to prevent herpes zoster and posther-petic neuralgia in older adults. N Engl J Med. 2005;352(22):2271–2284.35. Opstelten W, Van Essen GA, Schellevis F, Ver-heij TJ, Moons K. Gender as an independent risk fac-tor for herpes zoster: a population-based prospec-tive. Ann Epidemiol. 2006;1006;16(9):692–695.36. Berger R, Florent G, Just M. Decrease of the lymphoproliferative response to varicella-zoster virus antigen in the aged. Infect Immun. 1981;32(1):24–27.37. Kawai K, Yawn BP. Risk factors for herpes zos-ter: a systematic review and meta-analysis. Mayo Clin Proc. 2017;92(12):1806–1821.38. Tseng HF, Smith N, Harpaz R, Bialek SR, Sy LS, Jacobsen SJ. Herpes zoster vaccine in older adults and the risk of subsequent herpes zoster disease. JAMA. 2011;305(2):160–166.39. Schmader K, George LK, Burchett BM, Pieper CF. Racial differences in the occurrence of herpes
zoster. J Infect Dis. 1995;171(3):701–704.40. Pinchinat S, Cebrián-Cuenca AM, Bricout H, et al. Similar herpes zoster incidence across Europe: results from a systematic literature review. BMC In-fect Dis. 2013;13:170.41. Department of Defense, Office of the Deputy Assistant Secretary of Defense for Military Commu-nity and Family Policy (ODASD (MC&FP)). (2017). 2016 Demographics: Profile of the Military Commu-nity. Washington, DC.42. Zak-Prelich M, Borkowski JL, Alexander F, Nor-val M. The role of solar ultraviolet irradiation in zos-ter. Epidemiol Infect. 2002;129(3):593–597.43. Norval M. The effect of ultraviolet radiation on human viral infections. Photochem Photobiol. 2006;82(6):1495–1504.44. Solomon BA, Kaporis AG, Glass AT, Simon SI, Baldwin HE. Lasting immunity to varicella in doc-tors study (L.I.V.I.D. study). J Am Acad Dermatol. 1998;38(5 Pt 1):763–765.45. Terada K, Hiraga Y, Kawano S, Kataoka N. Incidence of herpes zoster in pediatricians and history of reexposure to varicella-zoster virus in patients with herpes zoster. Kansen Zasshi. 1995;69(8):908–912.46. Wu CY, Hu HY, Huang N, Pu CY, Shen HC, Chou YJ. Do the health-care workers gain pro-tection against herpes zoster infection? A 6-year population-based study in Taiwan. Dermatol. 2010;37(5):463–470.47. Nagasako EN, Johnson RW, Griffin DRJ, Elp-ern DJ, Dworkin RH. Geographic and racial as-pects of herpes zoster. J Med Virol 2003;70 Suppl 1:S20–S23.48. Weitzman D, Shavit O, Stein M, Cohen R, Chodick G, Shalev V. A population based study of the epidemiology of herpes zoster and its complica-tions. J Infect. 2013;67(5):463–469.49. Hillebrand K, Bricout H, Schulze-Rath R, Schink T, Garbe E. Incidence of herpes zoster and its complications in Germany, 2005–2009. J Infect. 2015;70(2):178–186.
50. Donahue JG, Choo PW, Manson JE, Platt R. The incidence of herpes zoster. Arch Intern Med. 1995;155(15):1605–1609.51. Joesoef RM, Harpaz R, Leung J, Bialek SR. Chronic medical conditions as risk factors for her-pes zoster. Mayo Clin Proc. 2012;87(10):961–967.52. Suaya JA, Chen SY, Li Q, Burstin SJ, Levin MJ. Incidence of herpes zoster and persistent post-zoster pain in adults with or without diabe-tes in the United States. Open Forum Infect Dis. 2014;1(2):ofu049.53. Garnett GP, Grenfell BT. The epidemiology of varicella-zoster virus infections: the influence of varicella on the prevalence of herpes zoster. Epide-miol Infect.1992;108(3):513–528.54. Glynn C, Crockford G, Gavaghan D, Cardno P, Price D, Miller J. Epidemiology of shingles. J R Soc Med. 1990;83(10):617–619.55. Gallerani M, Manfredini R. Seasonal varia-tion in herpes zoster infection. Br J Dermatol. 2000;142(3):588–589.56. Rubben A, Baron JM, Grussendorf-Conen EI. Routine detection of herpes simplex virus and varicella zoster virus by polymerase chain reac-tion reveals that initial herpes zoster is frequently misdiagnosed as herpes simplex. Br J Dermatol. 1997;137(2):259–261.57. Yawn BP, Wollan P, St Sauver J. Comparing shingles incidence and complication rates from medical record review and administrative database estimates: How close are they? Am J Epidemiol. 2011;174(9):1054–1061.58. Klompas M, Kulldorff M, Vilk Y, Bialek SR, Har-paz R. Herpes zoster and postherpetic neuralgia surveillance using structured electronic data. Mayo Clin Proc. 2011;86(12):1146–1153.59. Yawn BP, Itzler RF, Wollan PC, Pellissier JM, Sy LS, Saddier P. Health care utilization and cost burden of herpes zoster in a community population. Mayo Clin Proc. 2009;84(9):787–794.
MSMR’s Invitation to ReadersMedical Surveillance Monthly Report (MSMR) invites readers to submit topics for consideration as the basis for future MSMR reports. The
MSMR editorial staff will review suggested topics for feasibility and compatibility with the journal’s health surveillance goals. As is the case with most of the analyses and reports produced by Armed Forces Health Surveillance Branch staff, studies that would take advantage of the healthcare and personnel data contained in the Defense Medical Surveillance System (DMSS) would be the most plausible types. For each promising topic, Armed Forces Health Surveillance Branch staff members will design and carry out the data analysis, interpret the results, and write a manuscript to report on the study. This invitation represents a willingness to consider good ideas from anyone who shares the MSMR’s objective to publish evidence-based reports on subjects relevant to the health, safety, and well-being of military service members and other beneficiaries of the Military Health System (MHS).
In addition, the MSMR encourages the submission for publication of reports on evidence-based estimates of the incidence, distribution, impact, or trends of illness and injuries among members of the U.S. Armed Forces and other beneficiaries of the MHS. Information about manu-script submissions is available at www.health.mil/MSMRInstructions.
Please email your article ideas and suggestions to the MSMR Editor at [email protected].

Medical Surveillance Monthly Report (MSMR)Armed Forces Health Surveillance Branch11800 Tech Road, Suite 220 Silver Spring, MD 20904
MEDICAL SURVEILLANCE MONTHLY REPORT (MSMR), in continuous publication since 1995, is produced by the Armed Forces Health Surveillance Branch (AFHSB). The MSMR provides evidence-based estimates of the incidence, distribution, impact and trends of illness and injuries among U.S. military members and associated populations. Most reports in the MSMR are based on summaries of medical administrative data that are routinely provided to the AFHSB and integrated into the Defense Medical Surveillance System for health surveillance purposes.
Archive: Past issues of the MSMR are available as downloadable PDF files at www.health.mil/MSMRArchives.
Online Subscriptions: Submit subscription requests at www.health.mil/MSMRSubscribe.
Editorial Inquiries: Call (301) 319-3240 or send email to: [email protected].
Instructions for Authors: Information about article submissions is provided at www.health.mil/MSMRInstructions.
All material in the MSMR is in the public domain and may be used and reprinted without permission. Citation formats are available at www.health.mil/MSMR.
Opinions and assertions expressed in the MSMR should not be construed as reflecting official views, policies, or positions of the Department of Defense or the United States Government.
Follow us: www.facebook.com/AFHSBPAGE
http://twitter.com/AFHSBPAGE
ISSN 2158-0111 (print) ISSN 2152-8217 (online)
Chief, Armed Forces Health Surveillance Branch COL Douglas A. Badzik, MD, MPH (USA)
EditorFrancis L. O’Donnell, MD, MPH
Contributing EditorsLeslie L. Clark, PhD, MSShauna Stahlman, PhD, MPH
Writer/EditorValerie F. Williams, MA, MS
Managing/Production EditorElizabeth J. Lohr, MA
Layout/DesignDarrell Olson
Editorial OversightCol Dana J. Dane, DVM, MPH (USAF) COL P. Ann Loveless, MD, MS (USA)CDR Shawn S. Clausen, MD, MPH (USN)Mark V. Rubertone, MD, MPH