
investors.ansys.cominvestors.ansys.com/~/media/Files/A/Ansys-IR/quarterly-reports/... · 6 * '...
46
Morningstar ® Document Research ℠ FORM 10-Q ANSYS INC - ANSS Filed: August 05, 2014 (period: June 30, 2014) Quarterly report with a continuing view of a company's financial position The information contained herein may not be copied, adapted or distributed and is not warranted to be accurate, complete or timely. The user assumes all risks for any damages or losses arising from any use of this information, except to the extent such damages or losses cannot be limited or excluded by applicable law. Past financial performance is no guarantee of future results.
Transcript of investors.ansys.cominvestors.ansys.com/~/media/Files/A/Ansys-IR/quarterly-reports/... · 6 * '...

Morningstar® Document Research℠
FORM 10-QANSYS INC - ANSS
Filed: August 05, 2014 (period: June 30, 2014)
Quarterly report with a continuing view of a company's financial position
The information contained herein may not be copied, adapted or distributed and is not warranted to be accurate, complete or timely. The userassumes all risks for any damages or losses arising from any use of this information, except to the extent such damages or losses cannot belimited or excluded by applicable law. Past financial performance is no guarantee of future results.

UNITED STATESSECURITIES AND EXCHANGE COMMISSION
WASHINGTON, D.C. 20549
FORM 10-Q(Mark One)
x QUARTERLY REPORT PURSUANT TO SECTION 13 OR 15(d) OF THE SECURITIES EXCHANGE ACT OF 1934
For the quarterly period ended June 30, 2014
OR
o TRANSITION REPORT PURSUANT TO SECTION 13 OR 15(d) OF THE SECURITIES EXCHANGE ACT OF 1934
Commission File Number: 0-20853
ANSYS, Inc.(Exact name of registrant as specified in its charter)
Delaware 04-3219960(State or other jurisdiction of incorporation or organization) (I.R.S. Employer Identification No.)
275 Technology Drive, Canonsburg, PA 15317
(Address of principal executive offices) (Zip Code)
724-746-3304(Registrant’s telephone number, including area code)
Indicate by check mark whether the registrant (1) has filed all reports required to be filed by Section 13 or 15(d) of the Securities Exchange Act of 1934during the preceding 12 months (or for such shorter period that the registrant was required to file such reports), and (2) has been subject to such filingrequirements for the past 90 days.
Yes x No o
Indicate by check mark whether the registrant has submitted electronically and posted on its corporate Web site, if any, every Interactive Data File required tobe submitted and posted pursuant to Rule 405 of Regulation S-T (§232.405 of this chapter) during the preceding 12 months (or for such shorter period thatthe registrant was required to submit and post such files).
Yes x No o
Indicate by a check mark whether the registrant is a large accelerated filer, an accelerated filer, a non-accelerated filer, or a smaller reporting company (asdefined in Exchange Act Rule 12b-2). (Check one):
Large accelerated filer x Accelerated filer o
Non-accelerated filer o Smaller reporting company o
Indicate by check mark whether the registrant is a shell company (as defined in Rule 12b-2 of the Exchange Act).
Yes o No x
The number of shares of the Registrant’s Common Stock, par value $.01 per share, outstanding as of July 31, 2014 was 92,015,710 shares.
Source: ANSYS INC, 10-Q, August 05, 2014 Powered by Morningstar® Document Research℠The information contained herein may not be copied, adapted or distributed and is not warranted to be accurate, complete or timely. The user assumes all risks for any damages or losses arising from any use of this information,except to the extent such damages or losses cannot be limited or excluded by applicable law. Past financial performance is no guarantee of future results.

ANSYS, INC. AND SUBSIDIARIES
INDEX
PART I UNAUDITED FINANCIAL INFORMATION Page No.
Item 1. Financial Statements Condensed Consolidated Balance Sheets – June 30, 2014 and December 31, 2013 3 Condensed Consolidated Statements of Income – Three and Six Months Ended June 30, 2014 and 2013 4 Condensed Consolidated Statements of Comprehensive Income – Three and Six Months Ended June 30, 2014 and 2013 5 Condensed Consolidated Statements of Cash Flows – Six Months Ended June 30, 2014 and 2013 6 Notes to Condensed Consolidated Financial Statements 7 Report of Independent Registered Public Accounting Firm 16 Item 2. Management’s Discussion and Analysis of Financial Condition and Results of Operations 17 Item 3. Quantitative and Qualitative Disclosures About Market Risk 34 Item 4. Controls and Procedures 35 PART II OTHER INFORMATION Item 1. Legal Proceedings 36 Item 1A. Risk Factors 36 Item 2. Unregistered Sales of Equity Securities and Use of Proceeds 37 Item 3. Defaults Upon Senior Securities 37 Item 4. Mine Safety Disclosures 37 Item 5. Other Information 37 Item 6. Exhibits 38 SIGNATURES 39
2
Source: ANSYS INC, 10-Q, August 05, 2014 Powered by Morningstar® Document Research℠The information contained herein may not be copied, adapted or distributed and is not warranted to be accurate, complete or timely. The user assumes all risks for any damages or losses arising from any use of this information,except to the extent such damages or losses cannot be limited or excluded by applicable law. Past financial performance is no guarantee of future results.
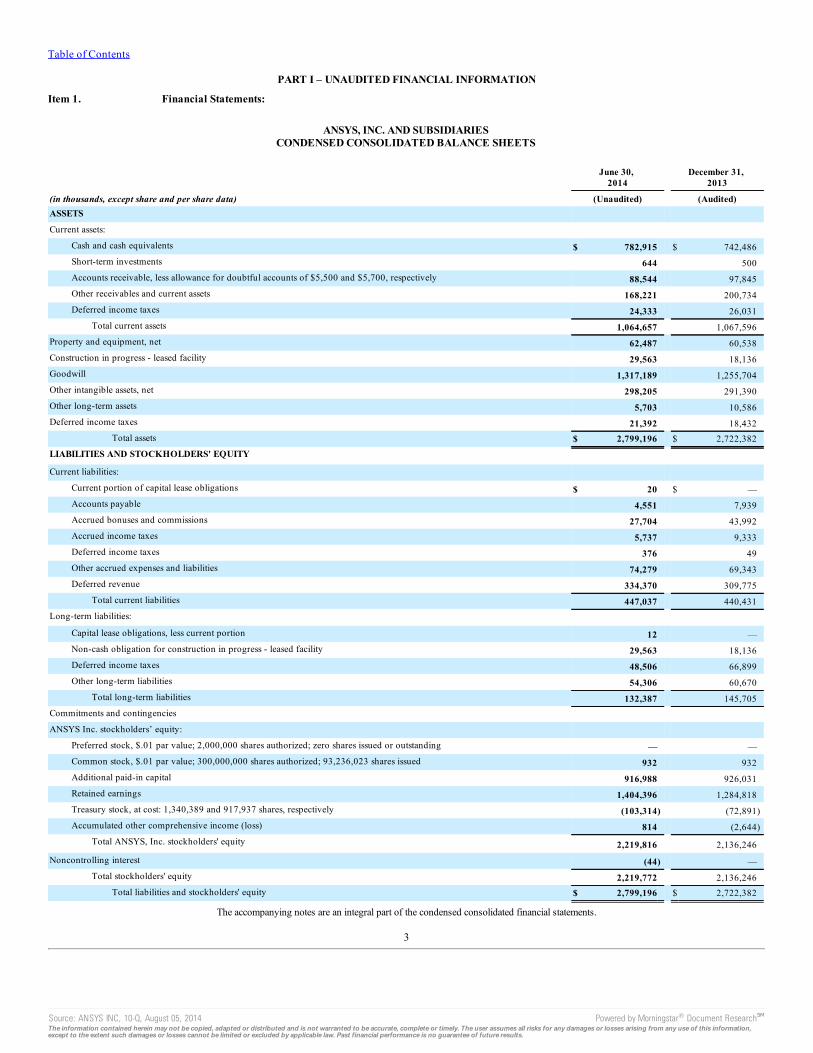
Table of Contents
PART I – UNAUDITED FINANCIAL INFORMATION
Item 1. Financial Statements:
ANSYS, INC. AND SUBSIDIARIESCONDENSED CONSOLIDATED BALANCE SHEETS
June 30,
2014 December 31,
2013
(in thousands, except share and per share data) (Unaudited) (Audited)ASSETS Current assets:
Cash and cash equivalents $ 782,915 $ 742,486Short-term investments 644 500Accounts receivable, less allowance for doubtful accounts of $5,500 and $5,700, respectively 88,544 97,845Other receivables and current assets 168,221 200,734Deferred income taxes 24,333 26,031
Total current assets 1,064,657 1,067,596Property and equipment, net 62,487 60,538Construction in progress - leased facility 29,563 18,136Goodwill 1,317,189 1,255,704Other intangible assets, net 298,205 291,390Other long-term assets 5,703 10,586Deferred income taxes 21,392 18,432
Total assets $ 2,799,196 $ 2,722,382LIABILITIES AND STOCKHOLDERS' EQUITY Current liabilities:
Current portion of capital lease obligations $ 20 $ —Accounts payable 4,551 7,939Accrued bonuses and commissions 27,704 43,992Accrued income taxes 5,737 9,333Deferred income taxes 376 49Other accrued expenses and liabilities 74,279 69,343Deferred revenue 334,370 309,775
Total current liabilities 447,037 440,431Long-term liabilities:
Capital lease obligations, less current portion 12 —Non-cash obligation for construction in progress - leased facility 29,563 18,136Deferred income taxes 48,506 66,899Other long-term liabilities 54,306 60,670
Total long-term liabilities 132,387 145,705Commitments and contingencies ANSYS Inc. stockholders’ equity:
Preferred stock, $.01 par value; 2,000,000 shares authorized; zero shares issued or outstanding — —Common stock, $.01 par value; 300,000,000 shares authorized; 93,236,023 shares issued 932 932Additional paid-in capital 916,988 926,031Retained earnings 1,404,396 1,284,818Treasury stock, at cost: 1,340,389 and 917,937 shares, respectively (103,314) (72,891)Accumulated other comprehensive income (loss) 814 (2,644)
Total ANSYS, Inc. stockholders' equity 2,219,816 2,136,246Noncontrolling interest (44) —
Total stockholders' equity 2,219,772 2,136,246Total liabilities and stockholders' equity $ 2,799,196 $ 2,722,382
The accompanying notes are an integral part of the condensed consolidated financial statements.
3
Source: ANSYS INC, 10-Q, August 05, 2014 Powered by Morningstar® Document Research℠The information contained herein may not be copied, adapted or distributed and is not warranted to be accurate, complete or timely. The user assumes all risks for any damages or losses arising from any use of this information,except to the extent such damages or losses cannot be limited or excluded by applicable law. Past financial performance is no guarantee of future results.

Table of Contents
ANSYS, INC. AND SUBSIDIARIESCONDENSED CONSOLIDATED STATEMENTS OF INCOME
(Unaudited)
Three Months Ended Six Months Ended
(in thousands, except per share data)June 30,
2014 June 30,
2013 June 30,
2014 June 30,
2013
Revenue: Software licenses $ 140,489 $ 133,117 $ 266,918 $ 251,992Maintenance and service 91,886 81,733 180,728 160,590
Total revenue 232,375 214,850 447,646 412,582Cost of sales:
Software licenses 7,364 6,769 14,508 13,734Amortization 9,406 9,984 18,721 19,858Maintenance and service 21,908 19,927 43,194 39,322
Total cost of sales 38,678 36,680 76,423 72,914Gross profit 193,697 178,170 371,223 339,668Operating expenses:
Selling, general and administrative 62,280 55,262 115,830 105,275Research and development 42,098 38,670 82,218 74,677Amortization 5,787 5,813 10,581 11,742
Total operating expenses 110,165 99,745 208,629 191,694Operating income 83,532 78,425 162,594 147,974Interest expense (181) (370) (429) (741)Interest income 710 743 1,551 1,475Other expense, net (179) (173) (377) (494)Income before income tax provision 83,882 78,625 163,339 148,214Income tax provision 20,846 22,680 43,761 41,246Net income $ 63,036 $ 55,945 $ 119,578 $ 106,968Earnings per share – basic:
Basic earnings per share $ 0.68 $ 0.60 $ 1.29 $ 1.15Weighted average shares – basic 92,314 92,860 92,398 92,884
Earnings per share – diluted: Diluted earnings per share $ 0.67 $ 0.59 $ 1.26 $ 1.12Weighted average shares – diluted 94,338 95,040 94,644 95,103
The accompanying notes are an integral part of the condensed consolidated financial statements.
4
Source: ANSYS INC, 10-Q, August 05, 2014 Powered by Morningstar® Document Research℠The information contained herein may not be copied, adapted or distributed and is not warranted to be accurate, complete or timely. The user assumes all risks for any damages or losses arising from any use of this information,except to the extent such damages or losses cannot be limited or excluded by applicable law. Past financial performance is no guarantee of future results.

Table of Contents
ANSYS, INC. AND SUBSIDIARIESCONDENSED CONSOLIDATED STATEMENTS OF COMPREHENSIVE INCOME
(Unaudited)
Three Months Ended Six Months Ended
(in thousands)June 30,
2014 June 30,
2013 June 30,
2014 June 30,
2013
Net income $ 63,036 $ 55,945 $ 119,578 $ 106,968Other comprehensive income (loss):
Foreign currency translation adjustments 2,527 (5,377) 3,458 (14,302)Comprehensive income $ 65,563 $ 50,568 $ 123,036 $ 92,666
The accompanying notes are an integral part of the condensed consolidated financial statements.
5
Source: ANSYS INC, 10-Q, August 05, 2014 Powered by Morningstar® Document Research℠The information contained herein may not be copied, adapted or distributed and is not warranted to be accurate, complete or timely. The user assumes all risks for any damages or losses arising from any use of this information,except to the extent such damages or losses cannot be limited or excluded by applicable law. Past financial performance is no guarantee of future results.

Table of Contents
ANSYS, INC. AND SUBSIDIARIESCONDENSED CONSOLIDATED STATEMENTS OF CASH FLOWS
(Unaudited)
Six Months Ended
(in thousands)June 30,
2014 June 30,
2013Cash flows from operating activities:
Net income $ 119,578 $ 106,968Adjustments to reconcile net income to net cash provided by operating activities:
Depreciation and amortization 39,872 41,385Deferred income tax benefit (5,969) (7,358)Provision for bad debts 930 658Stock-based compensation expense 17,630 17,661Excess tax benefits from stock-based compensation (5,845) (6,728)Other 242 47Changes in operating assets and liabilities:
Accounts receivable 11,340 10,676Other receivables and current assets 33,542 9,034Other long-term assets (106) 195Accounts payable, accrued expenses and current liabilities (17,714) (19,146)Accrued income taxes 1,742 4,984Deferred revenue 22,727 35,200Other long-term liabilities (6,497) (10,994)
Net cash provided by operating activities 211,472 182,582Cash flows from investing activities:
Acquisitions, net of cash acquired (102,517) (4,224)Capital expenditures (11,923) (8,680)Purchases of short-term investments (186) (121)Maturities of short-term investments 58 73
Net cash used in investing activities (114,568) (12,952)Cash flows from financing activities:
Principal payments on long-term debt — (26,575)Principal payments on capital leases (81) —Purchase of treasury stock (72,096) (73,457)Restricted stock withholding taxes paid in lieu of issued shares (5,108) (4,269)Contingent consideration payments (1,418) —Proceeds from issuance of common stock under Employee Stock Purchase Plan 1,611 1,274Proceeds from exercise of stock options 12,549 16,903Excess tax benefits from stock-based compensation 5,845 6,728
Net cash used in financing activities (58,698) (79,396)Effect of exchange rate fluctuations on cash and cash equivalents 2,223 (7,534)Net increase in cash and cash equivalents 40,429 82,700Cash and cash equivalents, beginning of period 742,486 576,703Cash and cash equivalents, end of period $ 782,915 $ 659,403Supplemental disclosures of cash flow information:
Income taxes paid $ 63,338 $ 40,737Interest paid $ 430 $ 711
Construction in progress - leased facility $ 11,427 $ 6,258The accompanying notes are an integral part of the condensed consolidated financial statements.
6
Source: ANSYS INC, 10-Q, August 05, 2014 Powered by Morningstar® Document Research℠The information contained herein may not be copied, adapted or distributed and is not warranted to be accurate, complete or timely. The user assumes all risks for any damages or losses arising from any use of this information,except to the extent such damages or losses cannot be limited or excluded by applicable law. Past financial performance is no guarantee of future results.
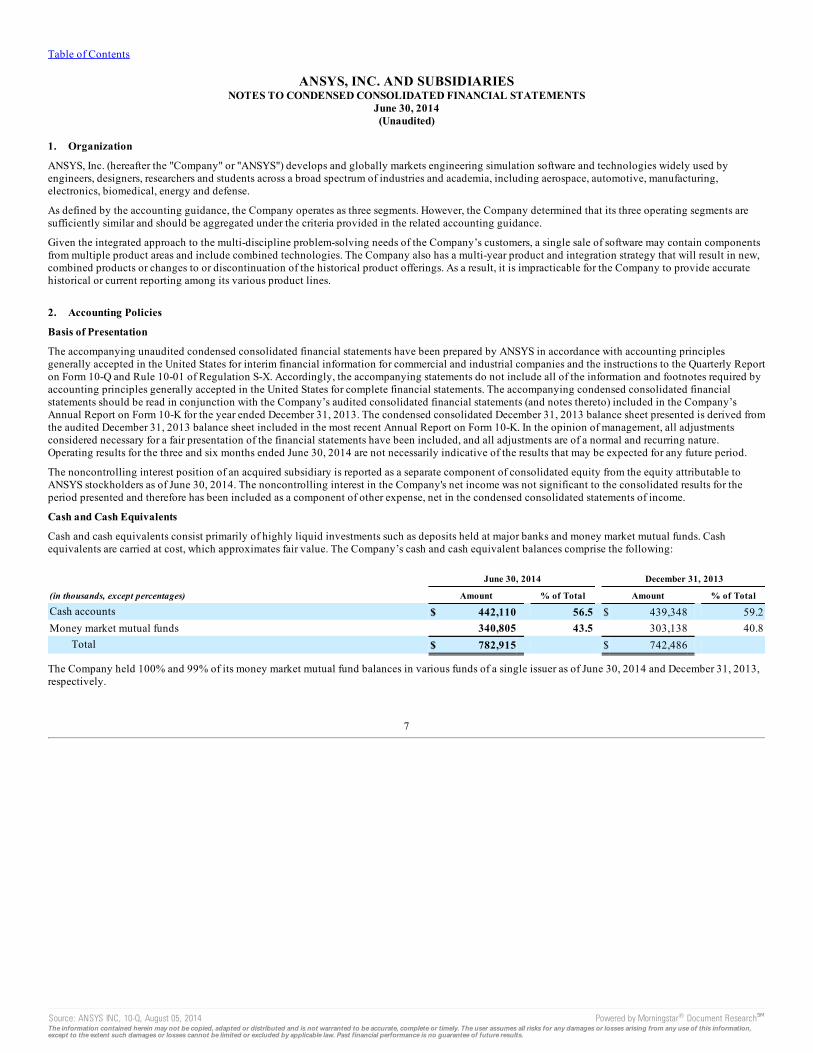
Table of Contents
ANSYS, INC. AND SUBSIDIARIESNOTES TO CONDENSED CONSOLIDATED FINANCIAL STATEMENTS
June 30, 2014(Unaudited)
1. Organization
ANSYS, Inc. (hereafter the "Company" or "ANSYS") develops and globally markets engineering simulation software and technologies widely used byengineers, designers, researchers and students across a broad spectrum of industries and academia, including aerospace, automotive, manufacturing,electronics, biomedical, energy and defense.
As defined by the accounting guidance, the Company operates as three segments. However, the Company determined that its three operating segments aresufficiently similar and should be aggregated under the criteria provided in the related accounting guidance.
Given the integrated approach to the multi-discipline problem-solving needs of the Company’s customers, a single sale of software may contain componentsfrom multiple product areas and include combined technologies. The Company also has a multi-year product and integration strategy that will result in new,combined products or changes to or discontinuation of the historical product offerings. As a result, it is impracticable for the Company to provide accuratehistorical or current reporting among its various product lines.
2. Accounting Policies
Basis of Presentation
The accompanying unaudited condensed consolidated financial statements have been prepared by ANSYS in accordance with accounting principlesgenerally accepted in the United States for interim financial information for commercial and industrial companies and the instructions to the Quarterly Reporton Form 10-Q and Rule 10-01 of Regulation S-X. Accordingly, the accompanying statements do not include all of the information and footnotes required byaccounting principles generally accepted in the United States for complete financial statements. The accompanying condensed consolidated financialstatements should be read in conjunction with the Company’s audited consolidated financial statements (and notes thereto) included in the Company’sAnnual Report on Form 10-K for the year ended December 31, 2013. The condensed consolidated December 31, 2013 balance sheet presented is derived fromthe audited December 31, 2013 balance sheet included in the most recent Annual Report on Form 10-K. In the opinion of management, all adjustmentsconsidered necessary for a fair presentation of the financial statements have been included, and all adjustments are of a normal and recurring nature.Operating results for the three and six months ended June 30, 2014 are not necessarily indicative of the results that may be expected for any future period.
The noncontrolling interest position of an acquired subsidiary is reported as a separate component of consolidated equity from the equity attributable toANSYS stockholders as of June 30, 2014. The noncontrolling interest in the Company's net income was not significant to the consolidated results for theperiod presented and therefore has been included as a component of other expense, net in the condensed consolidated statements of income.
Cash and Cash Equivalents
Cash and cash equivalents consist primarily of highly liquid investments such as deposits held at major banks and money market mutual funds. Cashequivalents are carried at cost, which approximates fair value. The Company’s cash and cash equivalent balances comprise the following:
June 30, 2014 December 31, 2013
(in thousands, except percentages) Amount % of Total Amount % of Total
Cash accounts $ 442,110 56.5 $ 439,348 59.2Money market mutual funds 340,805 43.5 303,138 40.8
Total $ 782,915 $ 742,486
The Company held 100% and 99% of its money market mutual fund balances in various funds of a single issuer as of June 30, 2014 and December 31, 2013,respectively.
7
Source: ANSYS INC, 10-Q, August 05, 2014 Powered by Morningstar® Document Research℠The information contained herein may not be copied, adapted or distributed and is not warranted to be accurate, complete or timely. The user assumes all risks for any damages or losses arising from any use of this information,except to the extent such damages or losses cannot be limited or excluded by applicable law. Past financial performance is no guarantee of future results.

Table of Contents
3. Acquisitions
SpaceClaim Corporation
On April 30, 2014, the Company completed the acquisition of SpaceClaim Corporation ("SpaceClaim"), a leading provider of 3-D modeling technology.Under the terms of the agreement, ANSYS acquired SpaceClaim for a purchase price of $84.9 million, which was paid almost entirely in cash, plus retentionvehicles and an adjustment for working capital.
SpaceClaim's software provides customers with a powerful and intuitive 3-D direct modeling solution to author new concepts and then leverage the power ofsimulation to rapidly iterate on these designs to drive innovation. The broad appeal of the SpaceClaim technology can help the Company deliver simulationtools to any engineer in any industry. The complementary combination is expected to accelerate development of new and innovative products to themarketplace while lowering design and engineering costs for customers.
The operating results of SpaceClaim have been included in the Company's consolidated financial statements from April 30, 2014, the date of acquisition. Theoperating results of the acquired business were not material to the Company's consolidated results of operations during the period from April 30, 2014 toJune 30, 2014.
The assets and liabilities of SpaceClaim have been recorded based upon management's estimates of their fair market values as of the acquisition date. Thefollowing tables summarize the fair value of consideration transferred and the preliminary fair values of identified assets acquired and liabilities assumed atthe acquisition date:
Fair Value of Consideration Transferred:
(in thousands) Cash $ 84,843ANSYS replacement stock options 68
Total consideration transferred at fair value $ 84,911
Recognized Amounts of Identifiable Assets Acquired and Liabilities Assumed:
(in thousands) Cash $ 723Accounts receivable and other tangible assets 1,857Developed technology (10-year life) 15,800Customer relationships (6-year life) 9,400Trade name (6-year life) 1,300Contract backlog (6-year life) 550Non-compete agreement (2-year life) 300Net deferred tax assets 4,137Accounts payable and other liabilities (1,925)Deferred revenue (460)
Total identifiable net assets $ 31,682Goodwill $ 53,229
The goodwill, which is not tax-deductible, is attributed to intangible assets that do not qualify for separate recognition, including the assembled workforce ofthe acquired business and the synergies expected to arise as a result of the acquisition of SpaceClaim.
The fair values of the assets acquired and liabilities assumed are based on preliminary calculations and the estimates and assumptions for these items aresubject to change as additional information about what was known and knowable at the acquisition date is obtained during the measurement period (up toone year from the acquisition date).
Pro forma results of operations have not been presented as the effects of the SpaceClaim business combination were not material to the Company'sconsolidated results of operations.
8
Source: ANSYS INC, 10-Q, August 05, 2014 Powered by Morningstar® Document Research℠The information contained herein may not be copied, adapted or distributed and is not warranted to be accurate, complete or timely. The user assumes all risks for any damages or losses arising from any use of this information,except to the extent such damages or losses cannot be limited or excluded by applicable law. Past financial performance is no guarantee of future results.

Table of Contents
In valuing deferred revenue on the SpaceClaim balance sheet as of the acquisition date, the Company applied the fair value provisions applicable to theaccounting for business combinations. Acquired deferred revenue with a historical carrying value of $3.3 million was ascribed a fair value of $0.5 million onthe opening balance sheet. As a result, the Company's post-acquisition revenue will be less than the sum of what would have otherwise been reported byANSYS and SpaceClaim absent the acquisition. The impact on reported revenue for the quarter ended June 30, 2014 was $0.7 million. The expected impacton reported revenue is $0.9 million and $2.2 million for the quarter ending September 30, 2014 and for the year ending December 31, 2014, respectively.
Reaction Design
On January 3, 2014, the Company completed the acquisition of Reaction Design, a leading developer of chemistry simulation software. Under the terms ofthe agreement, ANSYS acquired Reaction Design for a purchase price of $19.1 million in cash. Reaction Design's solutions enable transportationmanufacturers and energy companies to rapidly achieve their clean technology goals by automating the analysis of chemical processes via computersimulation and modeling solutions.
The operating results of Reaction Design have been included in the Company's condensed consolidated financial statements since the date of acquisition,January 3, 2014. The total consideration transferred was allocated to the assets and liabilities of Reaction Design based on management's estimates of the fairvalues of the assets acquired and the liabilities assumed. The allocation included $7.0 million to identifiable intangible assets, including core technology,customer lists and trade names, to be amortized over periods between two and eleven years, and $8.2 million to goodwill, which is not tax deductible. Thefair values of the assets acquired and liabilities assumed are based on preliminary calculations and the estimates and assumptions for these items are subjectto change as additional information about what was known and knowable at the acquisition date is obtained and assessed during the measurement period (upto one year from the acquisition date). During the period since the Reaction Design acquisition date, the Company decreased the fair values of identifiablefinite-lived intangible assets from $9.2 million to $7.0 million and increased the fair values of net deferred tax assets from $2.3 million to $3.0 million, withthe offset recorded to goodwill for $0.9 million and noncontrolling interest for $0.6 million. These adjustments were based on refinements to assumptionsused in the preliminary valuation of intangible assets and information about what was known and knowable as of the acquisition date in the calculation ofthe net deferred tax assets. The operating results of Reaction Design are not material to the condensed consolidated financial statements.
In valuing deferred revenue on the Reaction Design balance sheet as of the acquisition date, the Company applied the fair value provisions applicable to theaccounting for business combinations. Acquired deferred revenue with a historical carrying value of $2.3 million was ascribed no fair value on the openingbalance sheet. As a result, the Company's post-acquisition revenue will be less than the sum of what would have otherwise been reported by ANSYS andReaction Design absent the acquisition. The impact on reported revenue for the three and six months ended June 30, 2014 was $0.5 million and $1.4 million,respectively. The expected impact on reported revenue is $0.4 million and $2.0 million for the quarter ending September 30, 2014 and for the year endingDecember 31, 2014, respectively.
EVEN - Evolutionary Engineering AG
On April 2, 2013, the Company acquired EVEN - Evolutionary Engineering AG ("EVEN"), a leading provider of composite analysis and optimizationtechnology. Under the terms of the agreement, ANSYS acquired EVEN for a purchase price of $8.1 million, which consisted of $4.5 million in cash and anestimated $3.6 million of contingent consideration based on EVEN's achievement of certain technical milestones during the three years following theacquisition date. The Company made its first contingent payment totaling $1.6 million in March 2014.
The total consideration transferred was allocated to the assets and liabilities of EVEN based on management's estimates of the fair values of the assetsacquired and the liabilities assumed. The allocation included $2.6 million to identifiable intangible assets, including customer lists and core technology, tobe amortized over a period of five years, and $5.9 million to goodwill, which is not tax deductible. The fair values of the assets acquired and liabilitiesassumed are based on management's estimates of their fair values as of the acquisition date.
9
Source: ANSYS INC, 10-Q, August 05, 2014 Powered by Morningstar® Document Research℠The information contained herein may not be copied, adapted or distributed and is not warranted to be accurate, complete or timely. The user assumes all risks for any damages or losses arising from any use of this information,except to the extent such damages or losses cannot be limited or excluded by applicable law. Past financial performance is no guarantee of future results.

Table of Contents
4. Other Receivables and Current Assets
The Company's other receivables and current assets comprise the following balances:
(in thousands)June 30,
2014 December 31,
2013
Receivables related to unrecognized revenue $ 115,136 $ 140,051Income taxes receivable, including overpayments and refunds 32,212 42,357Prepaid expenses and other current assets 20,873 18,326
Total other receivables and current assets $ 168,221 $ 200,734
Receivables for unrecognized revenue represent the current portion of annual lease licenses and software maintenance that has not yet been recognized asrevenue.
5. Earnings Per Share
Basic earnings per share ("EPS") amounts are computed by dividing earnings by the weighted average number of common shares outstanding during theperiod. Diluted EPS amounts assume the issuance of common stock for all potentially dilutive equivalents outstanding. To the extent stock options are anti-dilutive, they are excluded from the calculation of diluted EPS.
The details of basic and diluted EPS are as follows:
Three Months Ended Six Months Ended
(in thousands, except per share data)June 30,
2014 June 30,
2013 June 30,
2014 June 30,
2013
Net income $ 63,036 $ 55,945 $ 119,578 $ 106,968Weighted average shares outstanding – basic 92,314 92,860 92,398 92,884Dilutive effect of stock plans 2,024 2,180 2,246 2,219Weighted average shares outstanding – diluted 94,338 95,040 94,644 95,103Basic earnings per share $ 0.68 $ 0.60 $ 1.29 $ 1.15Diluted earnings per share $ 0.67 $ 0.59 $ 1.26 $ 1.12Anti-dilutive options 1,191 1,170 1,198 1,144
6. Goodwill and Intangible Assets
The Company’s intangible assets and estimated useful lives are classified as follows:
June 30, 2014 December 31, 2013
(in thousands)
GrossCarryingAmount
AccumulatedAmortization
GrossCarryingAmount
AccumulatedAmortization
Amortized intangible assets: Developed software and core technologies (3 – 11 years) $ 323,886 $ (216,021) $ 300,493 $ (203,236)Customer lists and contract backlog (3 – 15 years) 249,215 (131,132) 237,173 (119,368)Trade names (2 – 10 years) 114,888 (57,074) 102,651 (50,990)Non-compete agreement (2 years) 300 (14) — —
Total $ 688,289 $ (404,241) $ 640,317 $ (373,594)
Unamortized intangible assets: Trade names $ 14,157 $ 24,667
Amortization expense for the intangible assets reflected above was $15.2 million and $15.8 million for the three months ended June 30, 2014 and 2013,respectively. Amortization expense for the intangible assets reflected above was $29.3 million and $31.6 million for the six months ended June 30, 2014 and2013, respectively.
10
Source: ANSYS INC, 10-Q, August 05, 2014 Powered by Morningstar® Document Research℠The information contained herein may not be copied, adapted or distributed and is not warranted to be accurate, complete or timely. The user assumes all risks for any damages or losses arising from any use of this information,except to the extent such damages or losses cannot be limited or excluded by applicable law. Past financial performance is no guarantee of future results.

Table of Contents
As of June 30, 2014, estimated future amortization expense for the intangible assets reflected above is as follows:
(in thousands)
Remainder of 2014 $ 31,6422015 57,7152016 48,3302017 44,8032018 31,1622019 17,372Thereafter 53,024
Total intangible assets subject to amortization 284,048Indefinite-lived trade names 14,157
Other intangible assets, net $ 298,205
The changes in goodwill during the six months ended June 30, 2014 and 2013 were as follows:
(in thousands) 2014 2013
Beginning balance – January 1 $ 1,255,704 $ 1,251,247Acquisitions 61,432 5,959Currency translation and other 53 (3,235)
Ending balance – June 30 $ 1,317,189 $ 1,253,971
During the first quarter of 2014, the Company completed the annual impairment test for goodwill and indefinite-lived intangible assets and determined thatthese assets had not been impaired as of the test date, January 1, 2014. No events or circumstances changed during the six months ended June 30, 2014 thatwould indicate that the fair values of the Company's reporting units or indefinite-lived intangible assets are below their carrying amounts.
7. Fair Value Measurement
The valuation hierarchy for disclosure of assets and liabilities reported at fair value prioritizes the inputs for such valuations into three broad levels:
• Level 1: quoted prices (unadjusted) in active markets for identical assets or liabilities;
• Level 2: quoted prices for similar assets and liabilities in active markets or inputs that are observable for the asset or liability, either directly orindirectly through market corroboration, for substantially the full term of the financial instrument; or
• Level 3: unobservable inputs based on the Company’s own assumptions used to measure assets and liabilities at fair value.
A financial asset's or liability's classification within the hierarchy is determined based on the lowest level input that is significant to the fair valuemeasurement.
11
Source: ANSYS INC, 10-Q, August 05, 2014 Powered by Morningstar® Document Research℠The information contained herein may not be copied, adapted or distributed and is not warranted to be accurate, complete or timely. The user assumes all risks for any damages or losses arising from any use of this information,except to the extent such damages or losses cannot be limited or excluded by applicable law. Past financial performance is no guarantee of future results.

Table of Contents
The following tables provide the assets and liabilities carried at fair value and measured on a recurring basis:
Fair Value Measurements at Reporting Date Using:
(in thousands)June 30,
2014
Quoted Prices inActive Markets
(Level 1)
Significant OtherObservable
Inputs(Level 2)
SignificantUnobservable
Inputs(Level 3)
Assets Cash equivalents $ 340,805 $ 340,805 $ — $ —Short-term investments $ 644 $ — $ 644 $ —Liabilities Contingent consideration $ (6,062) $ — $ — $ (6,062)Deferred compensation $ (711) $ — $ — $ (711)
Fair Value Measurements at Reporting Date Using:
(in thousands) December 31, 2013
Quoted Prices inActive Markets
(Level 1)
Significant OtherObservable
Inputs(Level 2)
SignificantUnobservable
Inputs(Level 3)
Assets Cash equivalents $ 303,138 $ 303,138 $ — $ —Short-term investments $ 500 $ — $ 500 $ —Liabilities Contingent consideration $ (7,389) $ — $ — $ (7,389)Deferred compensation $ (704) $ — $ — $ (704)
The cash equivalents in the preceding tables represent money market mutual funds.
The short-term investments in the preceding tables represent deposits held by certain foreign subsidiaries of the Company. The deposits have fixed interestrates with maturity dates ranging from three months to one year.
The contingent consideration in the tables above represents potential future payments related to the EVEN and Apache Design, Inc. ("Apache") acquisitionsin accordance with the respective agreements. The deferred compensation in the tables above is attributable to a retention agreement for a key member ofApache management, and was accounted for outside of that business combination. The net present value calculations for the contingent consideration anddeferred compensation include significant unobservable inputs in the assumption that all remaining payments will be made, and therefore the liabilities wereclassified as Level 3 in the fair value hierarchy.
12
Source: ANSYS INC, 10-Q, August 05, 2014 Powered by Morningstar® Document Research℠The information contained herein may not be copied, adapted or distributed and is not warranted to be accurate, complete or timely. The user assumes all risks for any damages or losses arising from any use of this information,except to the extent such damages or losses cannot be limited or excluded by applicable law. Past financial performance is no guarantee of future results.

Table of Contents
The following tables present the changes in the Company’s Level 3 liabilities that are measured at fair value on a recurring basis during the three and sixmonths ended June 30, 2014 and 2013:
Fair Value Measurement UsingSignificant Unobservable Inputs
(in thousands)Contingent
Consideration Deferred
Compensation
Balance as of January 1, 2014 $ 7,389 $ 704Contingent payment (1,578) —Interest expense and foreign exchange activity included in earnings 164 3
Balance as of March 31, 2014 $ 5,975 $ 707Interest expense and foreign exchange activity included in earnings 87 4
Balance as of June 30, 2014 $ 6,062 $ 711
Fair Value Measurement UsingSignificant Unobservable Inputs
(in thousands)Contingent
Consideration Deferred
Compensation
Balance as of January 1, 2013 $ 6,436 $ 1,394Interest expense included in earnings 31 6
Balance as of March 31, 2013 $ 6,467 $ 1,400EVEN contingent consideration 3,597 —Interest expense and foreign exchange activity included in earnings 134 7
Balance as of June 30, 2013 $ 10,198 $ 1,407
The carrying values of cash, accounts receivable, accounts payable, accrued expenses, other accrued liabilities and short-term obligations approximate theirfair values because of their short-term nature.
8. Geographic Information
Revenue to external customers is attributed to individual countries based upon the location of the customer. Revenue by geographic area is as follows:
Three Months Ended Six Months Ended
(in thousands)June 30,
2014 June 30,
2013 June 30,
2014 June 30,
2013
United States $ 78,399 $ 74,603 $ 151,779 $ 141,671Japan 27,790 27,088 56,720 55,703Germany 24,340 22,425 49,502 45,013Canada 3,319 3,629 6,489 6,833Other European 54,811 49,477 105,156 94,237Other international 43,716 37,628 78,000 69,125
Total revenue $ 232,375 $ 214,850 $ 447,646 $ 412,582
13
Source: ANSYS INC, 10-Q, August 05, 2014 Powered by Morningstar® Document Research℠The information contained herein may not be copied, adapted or distributed and is not warranted to be accurate, complete or timely. The user assumes all risks for any damages or losses arising from any use of this information,except to the extent such damages or losses cannot be limited or excluded by applicable law. Past financial performance is no guarantee of future results.

Table of Contents
Property and equipment by geographic area is as follows:
(in thousands)June 30,
2014 December 31,
2013
United States $ 46,042 $ 45,116India 3,337 3,226Germany 2,920 2,328United Kingdom 2,657 3,016France 2,286 2,275Japan 1,434 1,383Canada 825 618Other European 1,425 1,476Other international 1,561 1,100
Total property and equipment $ 62,487 $ 60,538
9. Stock-based Compensation
Total stock-based compensation expense and its net impact on basic and diluted earnings per share are as follows:
Three Months Ended Six Months Ended
(in thousands, except per share data)June 30,
2014 June 30,
2013 June 30,
2014 June 30,
2013
Cost of sales: Software licenses $ 498 $ 345 $ 799 $ 688Maintenance and service 547 588 1,038 1,172
Operating expenses: Selling, general and administrative 4,769 4,167 8,246 8,363Research and development 4,351 3,774 7,547 7,438
Stock-based compensation expense before taxes 10,165 8,874 17,630 17,661Related income tax benefits (2,804) (2,471) (4,860) (5,867)
Stock-based compensation expense, net of taxes $ 7,361 $ 6,403 $ 12,770 $ 11,794Net impact on earnings per share
Basic earnings per share $ (0.08) $ (0.07) $ (0.14) $ (0.13)Diluted earnings per share $ (0.08) $ (0.07) $ (0.13) $ (0.12)
10. Stock Repurchase Program
In February 2014, ANSYS announced that its Board of Directors approved an increase to its authorized stock repurchase program. Under the Company’s stockrepurchase program, the Company repurchased 970,200 shares during the six months ended June 30, 2014 at an average price per share of $74.31, for a totalcost of $72.1 million. During the six months ended June 30, 2013, the Company repurchased 988,000 shares at an average price per share of $74.35, for atotal cost of $73.5 million. As of June 30, 2014, approximately 2.0 million shares remained authorized for repurchase under the program.
11. Contingencies and Commitments
The Company is subject to various investigations, claims and legal proceedings that arise in the ordinary course of business, including alleged infringementof intellectual property rights, commercial disputes, labor and employment matters, tax audits and other matters. In the opinion of the Company, theresolution of pending matters is not expected to have a material, adverse effect on the Company’s consolidated results of operations, cash flows or financialposition. However, each of these matters is subject to various uncertainties and it is possible that an unfavorable resolution of one or more of theseproceedings could materially affect the Company’s results of operations, cash flows or financial position.
14
Source: ANSYS INC, 10-Q, August 05, 2014 Powered by Morningstar® Document Research℠The information contained herein may not be copied, adapted or distributed and is not warranted to be accurate, complete or timely. The user assumes all risks for any damages or losses arising from any use of this information,except to the extent such damages or losses cannot be limited or excluded by applicable law. Past financial performance is no guarantee of future results.

Table of Contents
An Indian subsidiary of the Company received a formal inquiry after a service tax audit. The service tax issues raised in the Company’s notice are very similarto the case, M/s Microsoft Corporation (I) (P) Ltd. Vs Commissions of Service Tax, currently being appealed to the Delhi Customs, Excise and Service TaxAppellate Tribunal (CESTAT). If the ruling is in favor of Microsoft, the Company expects a similar outcome for its audit case. If the ruling is unfavorable inthe case of Microsoft, the Company could incur tax charges and related liabilities, including those related to the service tax audit case, of approximately $6million. Of the two judicial members assigned to the Microsoft appeal, one member has ruled in favor of Microsoft and one has ruled in favor of theCommission. A third deciding judge will be appointed for a final decision. The Company can provide no assurances as to the outcome of the Microsoftappeal or to the impact of the Microsoft appeal on the Company’s audit case. The Company is uncertain as to when the service tax audit will be completed.
The Company sells software licenses and services to its customers under proprietary software license agreements. Each license agreement contains therelevant terms of the contractual arrangement with the customer, and generally includes certain provisions for indemnifying the customer against losses,expenses and liabilities from damages that are incurred by or awarded against the customer in the event the Company’s software or services are found toinfringe upon a patent, copyright or other proprietary right of a third party. To date, the Company has not had to reimburse any of its customers for any lossesrelated to these indemnification provisions and no material claims asserted under these indemnification provisions are outstanding as of June 30, 2014. Forseveral reasons, including the lack of prior material indemnification claims, the Company cannot determine the maximum amount of potential futurepayments, if any, related to such indemnification provisions.
12. Sale-Leaseback Arrangement
On September 14, 2012, the Company entered into a lease agreement for 186,000 square feet of rentable space to be located in a to-be-built office facility inCanonsburg, Pennsylvania, which will serve as the Company's new headquarters. The lease was effective as of September 14, 2012, but because the leasedpremises are under construction, the Company will not be obligated to pay rent until the later of (i) three months following the date that the leased premisesare delivered to ANSYS, which delivery, subject to certain limited exceptions, shall occur no later than October 1, 2014, or (ii) January 1, 2015. The term ofthe lease is 183 months, beginning on the date the Company takes possession of the facility. The lease agreement terms provide that the Company isresponsible for paying the cost of certain tenant improvements that exceed an allowance to be paid by the landlord. There is no cap to the Company'sobligation in excess of the landlord allowance, and the improvements do not meet the definition of "normal tenant improvements" as defined in theaccounting guidance. As a result, the Company is considered the owner of the building during the construction period and the lease is subject to sale-leaseback treatment.
As of June 30, 2014, the Company has recorded a $29.6 million construction-in-progress asset and a corresponding liability for construction debt funded bythe lessor on its condensed consolidated balance sheet. Upon completion and delivery of the building, the Company will determine whether the lease meetsthe criteria for capital treatment under the accounting guidance, or whether it has continuing involvement in the lease. If it is determined the lease fails tomeet the capitalization criteria, and the Company does not have continuing involvement in the lease, the construction-in-progress asset and liability will beremoved from the condensed consolidated balance sheet. The sale-leaseback treatment of the lease during the construction period does not have any impacton the Company's results of operations or cash flows.
13. New Accounting Guidance
Revenue from contracts with customers: In May 2014, the Financial Accounting Standards Board (FASB) issued Accounting Standards Update No. 2014-09, Revenue from Contracts with Customers (Topic 606) (ASU 2014-09). ASU 2014-09 supersedes most current revenue recognition guidance, includingindustry-specific guidance. Previous guidance requires an entity to recognize revenue when persuasive evidence of an arrangement exists, delivery hasoccurred or services have been rendered, the seller's price to the buyer is fixed or determinable, and collectibility is reasonably assured. Under the newguidance, an entity is required to evaluate revenue recognition by identifying a contract with a customer, identifying the performance obligations in thecontract, determining the transaction price, allocating the transaction price to the performance obligations in the contract and recognizing revenue when (oras) the entity satisfies a performance obligation. This guidance will be effective for periods after December 15, 2016. Entities have the option of using a fullretrospective, cumulative effect or modified approach to adopt the guidance. This update could impact the timing and amounts of revenue recognized. TheCompany is currently evaluating the effect that implementation of this update will have on its financial results upon adoption.
15
Source: ANSYS INC, 10-Q, August 05, 2014 Powered by Morningstar® Document Research℠The information contained herein may not be copied, adapted or distributed and is not warranted to be accurate, complete or timely. The user assumes all risks for any damages or losses arising from any use of this information,except to the extent such damages or losses cannot be limited or excluded by applicable law. Past financial performance is no guarantee of future results.

Table of Contents
REPORT OF INDEPENDENT REGISTERED PUBLIC ACCOUNTING FIRM
To the Board of Directors and Stockholders ofANSYS, Inc.Canonsburg, Pennsylvania
We have reviewed the accompanying condensed consolidated balance sheet of ANSYS, Inc. and subsidiaries (the "Company") as of June 30, 2014, and therelated condensed consolidated statements of income and comprehensive income for the three-month and six-month periods ended June 30, 2014 and 2013,and of cash flows for the six-month periods ended June 30, 2014, and 2013. These interim financial statements are the responsibility of the Company’smanagement.
We conducted our reviews in accordance with the standards of the Public Company Accounting Oversight Board (United States). A review of interimfinancial information consists principally of applying analytical procedures and making inquiries of persons responsible for financial and accountingmatters. It is substantially less in scope than an audit conducted in accordance with the standards of the Public Company Accounting Oversight Board(United States), the objective of which is the expression of an opinion regarding the financial statements taken as a whole. Accordingly, we do not expresssuch an opinion.
Based on our reviews, we are not aware of any material modifications that should be made to such condensed consolidated interim financial statements forthem to be in conformity with accounting principles generally accepted in the United States of America.
We have previously audited, in accordance with the standards of the Public Company Accounting Oversight Board (United States), the consolidated balancesheet of ANSYS, Inc. and subsidiaries as of December 31, 2013, and the related consolidated statements of income, comprehensive income, stockholders’equity, and cash flows for the year then ended (not presented herein); and in our report dated February 27, 2014, we expressed an unqualified opinion onthose consolidated financial statements. In our opinion, the information set forth in the accompanying condensed consolidated balance sheet as ofDecember 31, 2013 is fairly stated, in all material respects, in relation to the consolidated balance sheet from which it has been derived.
/s/ Deloitte & Touche LLPPittsburgh, PennsylvaniaAugust 5, 2014
16
Source: ANSYS INC, 10-Q, August 05, 2014 Powered by Morningstar® Document Research℠The information contained herein may not be copied, adapted or distributed and is not warranted to be accurate, complete or timely. The user assumes all risks for any damages or losses arising from any use of this information,except to the extent such damages or losses cannot be limited or excluded by applicable law. Past financial performance is no guarantee of future results.

Table of Contents
Item 2. Management’s Discussion and Analysis of Financial Condition and Results of Operations
Overview:
ANSYS, Inc.'s results for the three months ended June 30, 2014 reflect growth in revenue of 8.2%, operating income of 6.5% and diluted earnings per share of13.6% as compared to the three months ended June 30, 2013. The Company's results for the six months ended June 30, 2014 reflect growth in revenue of8.5%, operating income of 9.9% and diluted earnings per share of 12.5% as compared to the six months ended June 30, 2013. The Company experiencedhigher revenue in 2014 from growth in both license and maintenance revenue. The increase in revenue was partially offset by increased operating expenses,including higher salaries and incentive compensation.
The Company’s non-GAAP results for the three months ended June 30, 2014 reflect increases in revenue of 8.2%, operating income of 6.2% and dilutedearnings per share of 11.7% as compared to the three months ended June 30, 2013. The Company's non-GAAP results for the six months ended June 30, 2014reflect increases in revenue of 8.3%, operating income of 6.2% and diluted earnings per share of 9.5% as compared to the six months ended June 30, 2013.The non-GAAP results exclude the income statement effects of acquisition accounting adjustments to deferred revenue, stock-based compensation,acquisition-related amortization of intangible assets and transaction costs related to business combinations. For further disclosure regarding non-GAAPresults, see the section titled "Non-GAAP Results" immediately preceding the section titled "Liquidity and Capital Resources".
The Company’s financial position includes $783.6 million in cash and short-term investments, and working capital of $617.6 million as of June 30, 2014.
Under the Company’s stock repurchase program, the Company repurchased 970,200 shares during the six months ended June 30, 2014 at an average price pershare of $74.31, for a total cost of $72.1 million.
On April 30, 2014, the Company completed the acquisition of SpaceClaim, a leading provider of 3-D modeling technology. Under the terms of theagreement, ANSYS acquired SpaceClaim for a purchase price of $84.9 million, which was paid almost entirely in cash, plus retention vehicles and anadjustment for working capital. The operating results of SpaceClaim are included in the Company's consolidated financial statements from the date ofacquisition.
On January 3, 2014, the Company completed the acquisition of Reaction Design, a leading developer of chemistry simulation software. Under the terms ofthe agreement, ANSYS acquired Reaction Design for a purchase price of $19.1 million in cash. Reaction Design's solutions enable transportationmanufacturers and energy companies to rapidly achieve their clean technology goals by automating the analysis of chemical processes via computersimulation and modeling solutions. The operating results of Reaction Design are included in the Company's consolidated financial statements from the dateof acquisition.
ANSYS develops and globally markets engineering simulation software and services widely used by engineers, designers, researchers and students across abroad spectrum of industries and academia, including aerospace, automotive, manufacturing, electronics, biomedical, energy and defense. Headquarteredsouth of Pittsburgh, Pennsylvania, the Company and its subsidiaries employed approximately 2,690 people as of June 30, 2014 and focus on thedevelopment of open and flexible solutions that enable users to analyze designs directly on the desktop, providing a common platform for fast, efficient andcost-conscious product development, from design concept to final-stage testing and validation. The Company distributes its suite of simulation technologiesthrough a global network of independent channel partners and direct sales offices in strategic, global locations. It is the Company’s intention to continue tomaintain this hybrid sales and distribution model.
The Company licenses its technology to businesses, educational institutions and governmental agencies. Growth in the Company’s revenue is affected by thestrength of global economies, general business conditions, currency exchange rate fluctuations, customer budgetary constraints and the competitive positionof the Company’s products. The Company believes that the features, functionality and integrated multiphysics capabilities of its software products are asstrong as they have ever been. However, the software business is generally characterized by long sales cycles. These long sales cycles increase the difficultyof predicting sales for any particular quarter. The Company makes many operational and strategic decisions based upon short- and long-term sales forecaststhat are impacted not only by these long sales cycles but by current global economic conditions. As a result, the Company believes that its overallperformance is best measured by fiscal year results rather than by quarterly results.
The Company’s management considers the competition and price pressure that it faces in the short- and long-term by focusing on expanding the breadth,depth, ease of use and quality of the technologies, features, functionality and integrated multiphysics capabilities of its software products as compared to itscompetitors; investing in research and development to develop new and innovative products and increase the capabilities of its existing products; supplyingnew products and services; focusing on customer needs, training, consulting and support; and enhancing its distribution channels. From time to time, theCompany also considers acquisitions to supplement its global engineering talent, product offerings and distribution channels.
17
Source: ANSYS INC, 10-Q, August 05, 2014 Powered by Morningstar® Document Research℠The information contained herein may not be copied, adapted or distributed and is not warranted to be accurate, complete or timely. The user assumes all risks for any damages or losses arising from any use of this information,except to the extent such damages or losses cannot be limited or excluded by applicable law. Past financial performance is no guarantee of future results.

Table of Contents
Geographic Trends:
In North America, the Company experienced relative strength in the aerospace and defense markets, as well as in the automotive market. Comprehensivesystem simulation will be paramount to automotive companies handling the increasing complexity through upfront discovery and elimination of potentialfailure modes early in the product development process. While the Company continued to experience a cautious spending sentiment in the customer basestemming from concerns about their own revenue growth, North America revenue grew 5% and 7% for the three and six months ended June 30, 2014,respectively. The sales pipelines are continuing to build as a result of ongoing customer engagement activities in North America, including user groupmeetings that took place across North America during the quarter.
Europe, which continued to be the geography with the most challenging economic environment, delivered revenue growth of 5% and 6% in constantcurrency for the three and six months ended June 30, 2014, respectively. The volatility, geopolitical issues and ongoing developments in sanctions related toRussia and the surrounding territories, combined with a cautious customer spending environment and weaker than planned channel performance, continuedto have an adverse impact on new business growth during the quarter. However, renewal rates throughout Europe continued to be strong. From an industryperspective, the Company experienced growth in the industrial equipment; automotive; and metals, chemical and process industries. The strong push intoautonomous vehicles, coupled with the Company's strengths in radar simulation, helps in the growing segment of long-range radar for driverless cars. Themetals, chemical and process industries continued to grow due to the demand for energy efficiency and modernization.
The Company's General International Area ("GIA"), which includes all geographies except North America and Europe, continued to demonstrate measurableprogress with constant currency revenue growth of 12% for both the three and six months ended June 30, 2014. Japan, Korea and Taiwan continued to berelatively strong, and the sales pipelines continue to grow. China recovered in the second quarter, after posting lower growth in the first quarter, despite acontinuation of lower spending from state-owned enterprises. India was adversely affected by government spending softness and showed relative weakness,along with Brazil, during both the second quarter and the first six months of 2014. From an industry perspective, the Company experienced growth inelectronics; and metals, chemical and process industries. As consumer demand bounces back, consumer electronics companies are investing in research anddevelopment with a clear focus on smart products. During the quarter, the Company continued to make progress on internal improvement initiatives andfocused on customer engagement and pipeline building activities throughout the region.
The following discussion should be read in conjunction with the accompanying unaudited condensed consolidated financial statements and notes thereto forthe three and six months ended June 30, 2014, and with the Company’s audited consolidated financial statements and notes thereto for the year endedDecember 31, 2013 filed on the Annual Report on Form 10-K with the Securities and Exchange Commission. The Company’s discussion and analysis of itsfinancial condition and results of operations are based upon the Company’s condensed consolidated financial statements, which have been prepared inaccordance with GAAP. The preparation of these financial statements requires the Company to make estimates and judgments that affect the reportedamounts of assets, liabilities, revenues and expenses, and related disclosure of contingent assets and liabilities. On an ongoing basis, the Company evaluatesits estimates, including those related to fair value of stock awards, bad debts, contract revenue, valuation of goodwill, valuation of intangible assets,contingent consideration, deferred compensation, income taxes, uncertain tax positions, tax valuation reserves, useful lives for depreciation andamortization, and contingencies and litigation. The Company bases its estimates on historical experience, market experience, estimated future cash flows andon various other assumptions that are believed to be reasonable under the circumstances, the results of which form the basis for making judgments about thecarrying value of assets and liabilities that are not readily available from other sources. Actual results may differ from these estimates.
This Quarterly Report on Form 10-Q contains forward-looking statements within the meaning of Section 27A of the Securities Act of 1933 and Section 21Eof the Securities Exchange Act of 1934, including, but not limited to, the following statements, as well as statements that contain such words as "anticipates,""intends," "believes," "plans" and other similar expressions:
• The Company's expectations regarding the accelerated development and delivery of new and innovative products to the marketplace while loweringdesign and engineering costs for customers as a result of the SpaceClaim and Reaction Design acquisitions.
• The Company’s estimates regarding the expected impact on reported revenue related to the acquisition accounting treatment of deferred revenue.
• The Company’s estimation that it is probable that all remaining payments will be made for deferred compensation related to the Apache acquisitionand contingent consideration related to both the Apache and EVEN acquisitions.
• The Company’s assessment of the ultimate liabilities arising from various investigations, claims and legal proceedings.
• The Company's expectations regarding the outcome of its service tax audit case.
18
Source: ANSYS INC, 10-Q, August 05, 2014 Powered by Morningstar® Document Research℠The information contained herein may not be copied, adapted or distributed and is not warranted to be accurate, complete or timely. The user assumes all risks for any damages or losses arising from any use of this information,except to the extent such damages or losses cannot be limited or excluded by applicable law. Past financial performance is no guarantee of future results.
Table of Contents
• The Company’s intentions regarding its hybrid sales and distribution model.
• The Company’s statement regarding the strength of the features, functionality and integrated multiphysics capabilities of its software products.
• The Company's belief that its overall performance is best measured by fiscal year results rather than by quarterly results.
• The Company’s expectation that it will continue to make targeted investments in its global sales and marketing organization and its global businessinfrastructure to enhance major account sales activities and to support its worldwide sales distribution and marketing strategies, and the business ingeneral.
• The Company’s intentions related to investments in research and development, particularly as it relates to expanding the capabilities of its flagshipproducts and other products within its broad portfolio of simulation software, evolution of its ANSYS® Workbench™ platform, HPC capabilities,immersive user interface, robust design and ongoing integration.
• The Company's intention to repatriate previously taxed earnings and to reinvest all other earnings of its non-U.S. subsidiaries.
• The Company’s plans related to future capital spending.
• The sufficiency of existing cash and cash equivalent balances to meet future working capital and capital expenditure requirements.
• The Company’s intentions related to investments in complementary companies, products, services and technologies.
• The Company’s statement regarding increased exposure to volatility of foreign exchange rates.
Forward-looking statements should not be unduly relied upon because they involve known and unknown risks, uncertainties and other factors, some ofwhich are beyond the Company’s control. The Company’s actual results could differ materially from those set forth in forward-looking statements. Certainfactors, among others, that might cause such a difference include risks and uncertainties disclosed in the Company’s most recent Annual Report on Form 10-K, Part I, Item 1A. Information regarding new risk factors or material changes to these risk factors have been included within Part II, Item 1A of this QuarterlyReport on Form 10-Q.
19
Source: ANSYS INC, 10-Q, August 05, 2014 Powered by Morningstar® Document Research℠The information contained herein may not be copied, adapted or distributed and is not warranted to be accurate, complete or timely. The user assumes all risks for any damages or losses arising from any use of this information,except to the extent such damages or losses cannot be limited or excluded by applicable law. Past financial performance is no guarantee of future results.

Table of Contents
Results of Operations
Three Months Ended June 30, 2014 Compared to Three Months Ended June 30, 2013
Revenue:
Three Months Ended June 30, Change
(in thousands, except percentages) 2014 2013 Amount %
Revenue: Lease licenses $ 78,708 $ 73,370 $ 5,338 7.3Perpetual licenses 61,781 59,747 2,034 3.4
Software licenses 140,489 133,117 7,372 5.5Maintenance 86,196 76,058 10,138 13.3Service 5,690 5,675 15 0.3
Maintenance and service 91,886 81,733 10,153 12.4Total revenue $ 232,375 $ 214,850 $ 17,525 8.2
The Company’s revenue in the quarter ended June 30, 2014 increased 8.2% as compared to the quarter ended June 30, 2013. The growth was partiallyinfluenced by the Company’s continued investment in its global sales, support and marketing organizations. Revenue from lease licenses increased 7.3% ascompared to the quarter ended June 30, 2013 due primarily to growth in lease license revenue of Apache and electronics products. Perpetual license revenue,which is derived primarily from new sales during the quarter, increased 3.4% as compared to the prior-year quarter. Annual maintenance contracts that weresold with new perpetual licenses, along with maintenance contracts sold with new perpetual licenses in previous quarters, contributed to maintenancerevenue growth of 13.3%.
With respect to revenue, on average for the quarter ended June 30, 2014, the U.S. Dollar was approximately 2.3% weaker, when measured against theCompany’s primary foreign currencies, than for the quarter ended June 30, 2013. The net overall weakening resulted in increased revenue of $2.7 millionduring the quarter ended June 30, 2014, as compared with the same quarter of 2013. The impact on revenue was primarily driven by $3.1 million of favorableimpact due to a strengthening Euro, partially offset by $1.6 million of adverse impact due to a weakening Japanese Yen. The net overall weakening of theU.S. Dollar also resulted in increased operating income of approximately $1.3 million during the quarter ended June 30, 2014, as compared with the samequarter of 2013.
A substantial portion of the Company’s license and maintenance revenue is derived from annual lease and maintenance contracts. These contracts aregenerally renewed on an annual basis and typically have a high rate of customer renewal. In addition to the recurring revenue base associated with thesecontracts, a majority of customers purchasing new perpetual licenses also purchase related annual maintenance contracts. As a result of the significantrecurring revenue base, the Company’s license and maintenance revenue growth rate in any period does not necessarily correlate to the growth rate of newlicense and maintenance contracts sold during that period. To the extent the rate of customer renewal for lease and maintenance contracts is high, incrementallease contracts, and maintenance contracts sold with new perpetual licenses, will result in license and maintenance revenue growth. Conversely, if the rate ofrenewal for these contracts is adversely affected by economic or other factors, the Company’s license and maintenance growth will be adversely affected overthe term that the revenue for those contracts would have otherwise been recognized.
International and domestic revenues, as a percentage of total revenue, were 66.3% and 33.7%, respectively, during the quarter ended June 30, 2014, and65.3% and 34.7%, respectively, during the quarter ended June 30, 2013. The Company derived 24.5% and 24.8% of its total revenue through the indirectsales channel for the quarters ended June 30, 2014 and 2013, respectively.
In valuing deferred revenue on the balance sheets of the Company's recent acquisitions as of their respective acquisition dates, the Company applied the fairvalue provisions applicable to the accounting for business combinations, resulting in a reduction of deferred revenue as compared to its historical carryingamount. As a result, the Company's post-acquisition revenue will be less than the sum of what would have otherwise been reported by ANSYS and itssubsidiaries absent the acquisitions. The impacts on reported revenue were $1.6 million and $1.4 million for the quarters ended June 30, 2014 and 2013,respectively. The expected impact on reported revenue is $1.7 million and $5.6 million for the quarter ending September 30, 2014 and for the year endingDecember 31, 2014, respectively.
20
Source: ANSYS INC, 10-Q, August 05, 2014 Powered by Morningstar® Document Research℠The information contained herein may not be copied, adapted or distributed and is not warranted to be accurate, complete or timely. The user assumes all risks for any damages or losses arising from any use of this information,except to the extent such damages or losses cannot be limited or excluded by applicable law. Past financial performance is no guarantee of future results.

Table of Contents
Deferred Revenue and Backlog:
Deferred revenue consists of billings made or payments received in advance of revenue recognition from lease license and maintenance agreements. Thedeferred revenue on the Company's condensed consolidated balance sheets does not represent the total value of annual or multi-year, noncancellable leaselicense and maintenance agreements. The Company's backlog represents installment billings for periods beyond the current quarterly billing cycle andcustomer orders received but not processed. The Company's deferred revenue and backlog as of June 30, 2014 and December 31, 2013 consist of thefollowing:
Balance at June 30, 2014
(in thousands) Total Current Long-Term
Deferred revenue $ 344,883 $ 334,370 $ 10,513Backlog 95,421 37,895 57,526Total $ 440,304 $ 372,265 $ 68,039
Balance at December 31, 2013
(in thousands) Total Current Long-Term
Deferred revenue $ 317,730 $ 309,775 $ 7,955Backlog 91,786 33,446 58,340Total $ 409,516 $ 343,221 $ 66,295
Revenue associated with deferred revenue and backlog that is expected to be recognized in the subsequent twelve months is classified as current in the tableabove.
Cost of Sales and Gross Profit:
Three Months Ended June 30, 2014 2013 Change
(in thousands, except percentages) Amount % of
Revenue Amount % of
Revenue Amount %
Cost of sales: Software licenses $ 7,364 3.2 $ 6,769 3.2 $ 595 8.8Amortization 9,406 4.0 9,984 4.6 (578) (5.8)Maintenance and service 21,908 9.4 19,927 9.3 1,981 9.9
Total cost of sales 38,678 16.6 36,680 17.1 1,998 5.4Gross profit $ 193,697 83.4 $ 178,170 82.9 $ 15,527 8.7
Software Licenses: The increase in cost of software licenses was primarily due to the following:
• SpaceClaim-related cost of software licenses of $0.2 million for the period from the acquisition date (April 30, 2014) through June 30, 2014.
• Increased salaries of $0.2 million.
• Increased stock-based compensation expense of $0.2 million.
Amortization: The decrease in amortization expense was primarily due to a net decrease in amortization of acquired technology.
Maintenance and Service: The increase in maintenance and service costs was primarily due to increased salaries and incentive compensation of $1.5 millionand increased third-party technical support of $0.2 million.
The improvement in gross profit was a result of the increase in revenue offset by a smaller increase in related cost of sales.
21
Source: ANSYS INC, 10-Q, August 05, 2014 Powered by Morningstar® Document Research℠The information contained herein may not be copied, adapted or distributed and is not warranted to be accurate, complete or timely. The user assumes all risks for any damages or losses arising from any use of this information,except to the extent such damages or losses cannot be limited or excluded by applicable law. Past financial performance is no guarantee of future results.

Table of Contents
Operating Expenses:
Three Months Ended June 30, 2014 2013 Change
(in thousands, except percentages) Amount % of
Revenue Amount % of
Revenue Amount %
Operating expenses: Selling, general and administrative $ 62,280 26.8 $ 55,262 25.7 $ 7,018 12.7Research and development 42,098 18.1 38,670 18.0 3,428 8.9Amortization 5,787 2.5 5,813 2.7 (26) (0.4)
Total operating expenses $ 110,165 47.4 $ 99,745 46.4 $ 10,420 10.4
Selling, General and Administrative: The increase in selling, general and administrative costs was primarily due to the following:
• Increased salaries and other headcount-related costs, including incentive compensation of $2.3 million.
• SpaceClaim-related selling, general and administrative expenses of $1.2 million for the period from the acquisition date (April 30, 2014) throughJune 30, 2014.
• Reaction Design-related selling, general and administrative expenses of $0.6 million.
• Increased stock-based compensation expense of $0.6 million.
The Company anticipates that it will continue to make targeted investments in its global sales and marketing organization and its global businessinfrastructure to enhance sales and services activities and to support its worldwide sales distribution and marketing strategies, and the business in general.
Research and Development: The increase in research and development costs was primarily due to the following:
• Increased salaries of $1.6 million.
• Reaction Design-related research and development expenses of $0.6 million.
• SpaceClaim-related research and development expenses of $0.6 million for the period from the acquisition date (April 30, 2014) through June 30,2014.
• Increased stock-based compensation expense of $0.6 million.
The Company has traditionally invested significant resources in research and development activities and intends to continue to make investments in thisarea, particularly as it relates to expanding the ease of use and capabilities of its flagship products and other products within its broad portfolio of simulationsoftware, evolution of its ANSYS® Workbench™ platform, expanding its HPC capabilities, immersive user interface, robust design and ongoing integration ofacquired technology.
22
Source: ANSYS INC, 10-Q, August 05, 2014 Powered by Morningstar® Document Research℠The information contained herein may not be copied, adapted or distributed and is not warranted to be accurate, complete or timely. The user assumes all risks for any damages or losses arising from any use of this information,except to the extent such damages or losses cannot be limited or excluded by applicable law. Past financial performance is no guarantee of future results.

Table of Contents
Interest Expense: The Company’s interest expense consists of the following:
Three Months Ended
(in thousands)June 30,
2014 June 30,
2013
Discounted obligations $ 162 $ 226Term loan — 69Amortization of debt financing costs — 53Other 19 22
Total interest expense $ 181 $ 370
Other Expense, net: The Company's other expense consists of the following:
Three Months Ended
(in thousands)June 30,
2014 June 30,
2013
Foreign currency losses, net $ (215) $ (186)Noncontrolling interest in loss 38 —Other (2) 13
Total other expense, net $ (179) $ (173)
Income Tax Provision: The Company recorded income tax expense of $20.8 million and had income before income taxes of $83.9 million for the quarterended June 30, 2014. During the quarter ended June 30, 2013, the Company recorded income tax expense of $22.7 million and had income before incometaxes of $78.6 million. The effective tax rates were 24.9% and 28.8% for the second quarters of 2014 and 2013, respectively.
When compared to the federal and state combined statutory rate, these rates were favorably impacted by lower statutory tax rates in many of the Company’sforeign jurisdictions, the domestic manufacturing deduction and legal entity restructuring activities. In the second quarter of 2014, the rate was favorablyimpacted by $2.5 million in tax benefits associated with the repatriation of funds in connection with international restructuring activities. The rate was alsofavorably impacted by the reversal of reserves for uncertain tax positions in various jurisdictions. The availability of the U.S. research and development creditexpired at the end of the 2013 tax year. It is uncertain whether the U.S. Congress will reinstate this credit, or, if reinstated, the amount of the credit that mightbe available for 2014 or future periods.
Net Income: The Company’s net income in the second quarter of 2014 was $63.0 million as compared to net income of $55.9 million in the second quarter of2013. Diluted earnings per share was $0.67 in the second quarter of 2014 and $0.59 in the second quarter of 2013. The weighted average shares used incomputing diluted earnings per share were 94.3 million and 95.0 million in the second quarters of 2014 and 2013, respectively.
23
Source: ANSYS INC, 10-Q, August 05, 2014 Powered by Morningstar® Document Research℠The information contained herein may not be copied, adapted or distributed and is not warranted to be accurate, complete or timely. The user assumes all risks for any damages or losses arising from any use of this information,except to the extent such damages or losses cannot be limited or excluded by applicable law. Past financial performance is no guarantee of future results.

Table of Contents
Six Months Ended June 30, 2014 Compared to Six Months Ended June 30, 2013
Revenue:
Six Months Ended June 30, Change
(in thousands, except percentages) 2014 2013 Amount %
Revenue: Lease licenses $ 157,520 $ 146,281 $ 11,239 7.7Perpetual licenses 109,398 105,711 3,687 3.5
Software licenses 266,918 251,992 14,926 5.9Maintenance 169,229 149,702 19,527 13.0Service 11,499 10,888 611 5.6
Maintenance and service 180,728 160,590 20,138 12.5Total revenue $ 447,646 $ 412,582 $ 35,064 8.5
The Company’s revenue in the six months ended June 30, 2014 increased 8.5% as compared to the six months ended June 30, 2013. The growth was partiallyinfluenced by the Company’s continued investment in its global sales, support and marketing organizations. Revenue from lease licenses increased 7.7% ascompared to the six months ended June 30, 2013, due primarily to growth in lease license revenue of Apache and electronics products. Perpetual licenserevenue, which is derived primarily from new sales, increased 3.5% as compared to the six months ended June 30, 2013. Annual maintenance contracts thatwere sold with new perpetual licenses, along with maintenance contracts sold with new perpetual licenses in previous quarters, contributed to maintenancerevenue growth of 13.0%.
With respect to revenue, on average for the six months ended June 30, 2014, the U.S. Dollar was approximately 0.7% weaker, when measured against theCompany’s primary foreign currencies, than for the six months ended June 30, 2013. The net overall weakening resulted in increased revenue of $1.7 millionduring the six months ended June 30, 2014, as compared to the six months ended June 30, 2013. The impact on revenue was primarily driven by $5.5 millionof favorable impact due to a strengthening Euro, partially offset by $4.9 million of adverse impact due to a weakening Japanese Yen. The net overallweakening of the U.S. Dollar also resulted in increased operating income of approximately $0.4 million during the six months ended June 30, 2014, ascompared to the six months ended June 30, 2013.
International and domestic revenues, as a percentage of total revenue, were 66.1% and 33.9%, respectively, during the six months ended June 30, 2014, and65.7% and 34.3%, respectively, during the six months ended June 30, 2013. The Company derived 24.0% and 24.8% of its total revenue through the indirectsales channel for the six months ended June 30, 2014 and 2013, respectively.
In valuing deferred revenue on the balance sheets of the Company's recent business combinations as of their respective acquisition dates, the Companyapplied the fair value provisions applicable to the accounting for business combinations, resulting in a reduction of deferred revenue as compared to itshistorical carrying amount. As a result, the Company's post-acquisition revenue will be less than the sum of what would have otherwise been reported byANSYS and its subsidiaries absent the acquisitions. The impacts on reported revenue were $2.8 million and $3.2 million for the six-month periods endedJune 30, 2014 and 2013, respectively.
Cost of Sales and Gross Profit:
Six Months Ended June 30, 2014 2013 Change
(in thousands, except percentages) Amount % of
Revenue Amount % of
Revenue Amount %
Cost of sales: Software licenses $ 14,508 3.2 $ 13,734 3.3 $ 774 5.6Amortization 18,721 4.2 19,858 4.8 (1,137) (5.7)Maintenance and service 43,194 9.6 39,322 9.5 3,872 9.8
Total cost of sales 76,423 17.1 72,914 17.7 3,509 4.8Gross profit $ 371,223 82.9 $ 339,668 82.3 $ 31,555 9.3
Amortization: The decrease in amortization expense was primarily due to a net decrease in amortization of acquired technology, partially offset by a netincrease in trade name amortization.
24
Source: ANSYS INC, 10-Q, August 05, 2014 Powered by Morningstar® Document Research℠The information contained herein may not be copied, adapted or distributed and is not warranted to be accurate, complete or timely. The user assumes all risks for any damages or losses arising from any use of this information,except to the extent such damages or losses cannot be limited or excluded by applicable law. Past financial performance is no guarantee of future results.

Table of Contents
Maintenance and Service: The increase in maintenance and service costs was primarily due to increased salaries and incentive compensation of $2.7 million.In addition, there was an increase in third-party technical support costs of $0.5 million.
The improvement in gross profit was a result of the increase in revenue offset by a smaller increase in related cost of sales.
Operating Expenses:
Six Months Ended June 30, 2014 2013 Change
(in thousands, except percentages) Amount % of
Revenue Amount % of
Revenue Amount %
Operating expenses: Selling, general and administrative $ 115,830 25.9 $ 105,275 25.5 $ 10,555 10.0Research and development 82,218 18.4 74,677 18.1 7,541 10.1Amortization 10,581 2.4 11,742 2.8 (1,161) (9.9)
Total operating expenses $ 208,629 46.6 $ 191,694 46.5 $ 16,935 8.8
Selling, General and Administrative: The increase in selling, general and administrative costs was primarily due to the following:
• Increased salaries and other headcount-related costs, including incentive compensation of $4.6 million.
• Reaction Design-related selling, general and administrative expenses of $1.2 million for the period from the acquisition date (January 3, 2014)through June 30, 2014.
• SpaceClaim-related selling, general and administrative expenses of $1.2 million for the period from the acquisition date (April 30, 2014) throughJune 30, 2014.
• Increased third-party commissions of $0.8 million.
• Increased professional fees of $0.8 million.
Research and Development: The increase in research and development costs was primarily due to the following:
• Increased salaries and incentive compensation of $4.2 million.
• Reaction Design-related research and development expenses of $1.1 million for the period from the acquisition date (January 3, 2014) through June30, 2014.
• SpaceClaim-related research and development expenses of $0.6 million for the period from the acquisition date (April 30, 2014) through June 30,2014.
• EVEN-related research and development expenses of $0.6 million, primarily as a result of six months of EVEN activity in the current year ascompared to three months of activity in the prior year.
Amortization: The decrease in amortization expense was primarily due to a net decrease in amortization of contract backlog, partially offset by a net increasein amortization of customer lists.
25
Source: ANSYS INC, 10-Q, August 05, 2014 Powered by Morningstar® Document Research℠The information contained herein may not be copied, adapted or distributed and is not warranted to be accurate, complete or timely. The user assumes all risks for any damages or losses arising from any use of this information,except to the extent such damages or losses cannot be limited or excluded by applicable law. Past financial performance is no guarantee of future results.

Table of Contents
Interest Expense: The Company’s interest expense consists of the following:
Six Months Ended
(in thousands)June 30,
2014 June 30,
2013
Discounted obligations $ 358 $ 348Term loan — 208Amortization of debt financing costs — 145Other 71 40
Total interest expense $ 429 $ 741
Other Expense, net: The Company's other expense consists of the following:
Six Months Ended
(in thousands)June 30,
2014 June 30,
2013
Foreign currency losses, net $ (388) $ (509)Noncontrolling interest in loss 48 —Other (37) 15
Total other expense, net $ (377) $ (494)
Income Tax Provision: The Company recorded income tax expense of $43.8 million and had income before income taxes of $163.3 million for the sixmonths ended June 30, 2014. During the six months ended June 30, 2013, the Company recorded income tax expense of $41.2 million and had incomebefore income taxes of $148.2 million. The effective tax rates were 26.8% and 27.8% for the six months ended June 30, 2014 and 2013, respectively. In thefirst six months of 2014, the rate was favorably impacted by $3.2 million in tax benefits associated with the repatriation of funds in connection withinternational restructuring activities. In the first six months of 2013, the rate was favorably impacted by approximately $2.3 million related to thereinstatement of the U.S. research and development credit for 2012 activity.
Net Income: The Company’s net income for the six months ended June 30, 2014 was $119.6 million as compared to net income of $107.0 million for the sixmonths ended June 30, 2013. Diluted earnings per share was $1.26 for the six months ended June 30, 2014 and $1.12 for the six months ended June 30, 2013.The weighted average shares used in computing diluted earnings per share were 94.6 million and 95.1 million for the six months ended June 30, 2014 and2013, respectively.
26
Source: ANSYS INC, 10-Q, August 05, 2014 Powered by Morningstar® Document Research℠The information contained herein may not be copied, adapted or distributed and is not warranted to be accurate, complete or timely. The user assumes all risks for any damages or losses arising from any use of this information,except to the extent such damages or losses cannot be limited or excluded by applicable law. Past financial performance is no guarantee of future results.

Table of Contents
Non-GAAP ResultsThe Company provides non-GAAP revenue, non-GAAP operating income, non-GAAP operating profit margin, non-GAAP net income and non-GAAP dilutedearnings per share as supplemental measures to GAAP measures regarding the Company’s operational performance. These financial measures exclude theimpact of certain items and, therefore, have not been calculated in accordance with GAAP. A detailed explanation and a reconciliation of each non-GAAPfinancial measure to its most comparable GAAP financial measure are described below.
Three Months Ended
June 30, 2014 June 30, 2013(in thousands, except percentages and per sharedata)
AsReported Adjustments
Non-GAAPResults
AsReported Adjustments
Non-GAAPResults
Total revenue $ 232,375 $ 1,555 (1) $ 233,930 $ 214,850 $ 1,377 (4) $ 216,227Operating income 83,532 27,535 (2) 111,067 78,425 26,173 (5) 104,598Operating profit margin 35.9% 47.5% 36.5% 48.4%Net income $ 63,036 $ 18,509 (3) $ 81,545 $ 55,945 $ 17,408 (6) $ 73,353Earnings per share – diluted:
Diluted earnings per share $ 0.67 $ 0.86 $ 0.59 $ 0.77Weighted average shares – diluted 94,338 94,338 95,040 95,040
(1) Amount represents the revenue not reported during the period as a result of the acquisition accounting adjustment associated with accounting fordeferred revenue in business combinations.
(2) Amount represents $15.2 million of amortization expense associated with intangible assets acquired in business combinations, $10.2 million of stock-based compensation expense, the $1.6 million adjustment to revenue as reflected in (1) above and $0.6 million of acquisition-related transactionexpenses.
(3) Amount represents the impact of the adjustments to operating income referred to in (2) above, adjusted for the related income tax impact of $9.0million.
(4) Amount represents the revenue not reported during the period as a result of the acquisition accounting adjustment associated with accounting fordeferred revenue in business combinations.
(5) Amount represents $15.8 million of amortization expense associated with intangible assets acquired in business combinations, $8.9 million of stock-based compensation expense, the $1.4 million adjustment to revenue as reflected in (4) above and $0.1 million of acquisition-related transactionexpenses.
(6) Amount represents the impact of the adjustments to operating income referred to in (5) above, adjusted for the related income tax impact of $8.8million.
27
Source: ANSYS INC, 10-Q, August 05, 2014 Powered by Morningstar® Document Research℠The information contained herein may not be copied, adapted or distributed and is not warranted to be accurate, complete or timely. The user assumes all risks for any damages or losses arising from any use of this information,except to the extent such damages or losses cannot be limited or excluded by applicable law. Past financial performance is no guarantee of future results.

Table of Contents
Six Months Ended
June 30, 2014 June 30, 2013(in thousands, except percentages and per sharedata)
AsReported Adjustments
Non-GAAPResults
AsReported Adjustments
Non-GAAPResults
Total revenue $ 447,646 $ 2,779 (1) $ 450,425 $ 412,582 $ 3,165 (4) $ 415,747Operating income 162,594 50,636 (2) 213,230 147,974 52,729 (5) 200,703Operating profit margin 36.3% 47.3% 35.9% 48.3%Net income $ 119,578 $ 33,887 (3) $ 153,465 $ 106,968 $ 34,137 (6) $ 141,105Earnings per share – diluted:
Diluted earnings per share $ 1.26 $ 1.62 $ 1.12 $ 1.48Weighted average shares – diluted 94,644 94,644 95,103 95,103
(1) Amount represents the revenue not reported during the period as a result of the acquisition accounting adjustment associated with accounting fordeferred revenue in business combinations.
(2) Amount represents $29.3 million of amortization expense associated with intangible assets acquired in business combinations, $17.6 million of stock-based compensation expense, the $2.8 million adjustment to revenue as reflected in (1) above and $0.9 million of acquisition-related transactionexpenses.
(3) Amount represents the impact of the adjustments to operating income referred to in (2) above, adjusted for the related income tax impact of $16.7million.
(4) Amount represents the revenue not reported during the period as a result of the acquisition accounting adjustment associated with accounting fordeferred revenue in business combinations.
(5) Amount represents $31.6 million of amortization expense associated with intangible assets acquired in business combinations, $17.7 million of stock-based compensation expense, the $3.2 million adjustment to revenue as reflected in (4) above and $0.3 million of acquisition-related transactionexpenses.
(6) Amount represents the impact of the adjustments to operating income referred to in (5) above, adjusted for the related income tax impact of $18.6million.
Non-GAAP Measures
Management uses non-GAAP financial measures (a) to evaluate the Company's historical and prospective financial performance as well as its performancerelative to its competitors, (b) to set internal sales targets and spending budgets, (c) to allocate resources, (d) to measure operational profitability and theaccuracy of forecasting, (e) to assess financial discipline over operational expenditures and (f) as an important factor in determining variable compensationfor management and its employees. In addition, many financial analysts that follow the Company focus on and publish both historical results and futureprojections based on non-GAAP financial measures. The Company believes that it is in the best interest of its investors to provide this information to analystsso that they accurately report the non-GAAP financial information. Moreover, investors have historically requested and the Company has historicallyreported these non-GAAP financial measures as a means of providing consistent and comparable information with past reports of financial results.
While management believes that these non-GAAP financial measures provide useful supplemental information to investors, there are limitations associatedwith the use of these non-GAAP financial measures. These non-GAAP financial measures are not prepared in accordance with GAAP, are not reported by all ofthe Company’s competitors and may not be directly comparable to similarly titled measures of the Company’s competitors due to potential differences in theexact method of calculation. The Company compensates for these limitations by using these non-GAAP financial measures as supplements to GAAP financialmeasures and by reviewing the reconciliations of the non-GAAP financial measures to their most comparable GAAP financial measures.
28
Source: ANSYS INC, 10-Q, August 05, 2014 Powered by Morningstar® Document Research℠The information contained herein may not be copied, adapted or distributed and is not warranted to be accurate, complete or timely. The user assumes all risks for any damages or losses arising from any use of this information,except to the extent such damages or losses cannot be limited or excluded by applicable law. Past financial performance is no guarantee of future results.

Table of Contents
The adjustments to these non-GAAP financial measures, and the basis for such adjustments, are outlined below:
Acquisition accounting for deferred revenue and its related tax impact. Historically, the Company has consummated acquisitions in order to support itsstrategic and other business objectives. In accordance with the fair value provisions applicable to the accounting for business combinations, acquireddeferred revenue is often recorded on the opening balance sheet at an amount that is lower than the historical carrying value. Although this purchaseaccounting requirement has no impact on the Company’s business or cash flow, it adversely impacts the Company’s reported GAAP revenue in the reportingperiods following an acquisition. In order to provide investors with financial information that facilitates comparison of both historical and future results, theCompany provides non-GAAP financial measures which exclude the impact of the acquisition accounting adjustment. The Company believes that this non-GAAP financial adjustment is useful to investors because it allows investors to (a) evaluate the effectiveness of the methodology and information used bymanagement in its financial and operational decision-making, and (b) compare past and future reports of financial results of the Company as the revenuereduction related to acquired deferred revenue will not recur when related annual lease licenses and software maintenance contracts are renewed in futureperiods.
Amortization of intangibles from acquisitions and its related tax impact. The Company incurs amortization of intangibles, included in its GAAPpresentation of amortization expense, related to various acquisitions it has made in recent years. Management excludes these expenses and their related taximpact for the purpose of calculating non-GAAP operating income, non-GAAP operating profit margin, non-GAAP net income and non-GAAP dilutedearnings per share when it evaluates the continuing operational performance of the Company because these costs are fixed at the time of an acquisition, arethen amortized over a period of several years after the acquisition and generally cannot be changed or influenced by management after the acquisition.Accordingly, management does not consider these expenses for purposes of evaluating the performance of the Company during the applicable time periodafter the acquisition, and it excludes such expenses when making decisions to allocate resources. The Company believes that these non-GAAP financialmeasures are useful to investors because they allow investors to (a) evaluate the effectiveness of the methodology and information used by management in itsfinancial and operational decision-making, and (b) compare past reports of financial results of the Company as the Company has historically reported thesenon-GAAP financial measures.
Stock-based compensation expense and its related tax impact. The Company incurs expense related to stock-based compensation included in its GAAPpresentation of cost of software licenses; cost of maintenance and service; research and development expense and selling, general and administrativeexpense. Although stock-based compensation is an expense of the Company and viewed as a form of compensation, management excludes these expenses forthe purpose of calculating non-GAAP operating income, non-GAAP operating profit margin, non-GAAP net income and non-GAAP diluted earnings per sharewhen it evaluates the continuing operational performance of the Company. Specifically, the Company excludes stock-based compensation during its annualbudgeting process and its quarterly and annual assessments of the Company’s and management’s performance. The annual budgeting process is the primarymechanism whereby the Company allocates resources to various initiatives and operational requirements. Additionally, the annual review by the board ofdirectors during which it compares the Company's historical business model and profitability to the planned business model and profitability for theforthcoming year excludes the impact of stock-based compensation. In evaluating the performance of senior management and department managers, chargesrelated to stock-based compensation are excluded from expenditure and profitability results. In fact, the Company records stock-based compensation expenseinto a stand-alone cost center for which no single operational manager is responsible or accountable. In this way, management is able to review, on a period-to-period basis, each manager’s performance and assess financial discipline over operational expenditures without the effect of stock-based compensation.The Company believes that these non-GAAP financial measures are useful to investors because they allow investors to (a) evaluate the Company's operatingresults and the effectiveness of the methodology used by management to review the Company's operating results, and (b) review historical comparability inthe Company's financial reporting as well as comparability with competitors' operating results.
Transaction costs related to business combinations. The Company incurs expenses for professional services rendered in connection with businesscombinations, which are included in its GAAP presentation of selling, general and administrative expense. These expenses are generally not tax deductible.Management excludes these acquisition-related transaction expenses for the purpose of calculating non-GAAP operating income, non-GAAP operating profitmargin, non-GAAP net income and non-GAAP diluted earnings per share when it evaluates the continuing operational performance of the Company, as itgenerally would not have otherwise incurred these expenses in the periods presented as a part of its continuing operations. The Company believes that thesenon-GAAP financial measures are useful to investors because they allow investors to (a) evaluate the Company's operating results and the effectiveness of themethodology used by management to review the Company's operating results, and (b) review historical comparability in the Company's financial reporting aswell as comparability with competitors' operating results.
29
Source: ANSYS INC, 10-Q, August 05, 2014 Powered by Morningstar® Document Research℠The information contained herein may not be copied, adapted or distributed and is not warranted to be accurate, complete or timely. The user assumes all risks for any damages or losses arising from any use of this information,except to the extent such damages or losses cannot be limited or excluded by applicable law. Past financial performance is no guarantee of future results.

Table of Contents
Non-GAAP financial measures are not in accordance with, or an alternative for, GAAP. The Company's non-GAAP financial measures are not meant to beconsidered in isolation or as a substitute for comparable GAAP financial measures, and should be read only in conjunction with the Company's consolidatedfinancial statements prepared in accordance with GAAP.
The Company has provided a reconciliation of the non-GAAP financial measures to the most directly comparable GAAP financial measures as listed below:
GAAP Reporting Measure Non-GAAP Reporting Measure
Revenue Non-GAAP RevenueOperating Income Non-GAAP Operating IncomeOperating Profit Margin Non-GAAP Operating Profit MarginNet Income Non-GAAP Net IncomeDiluted Earnings Per Share Non-GAAP Diluted Earnings Per Share
30
Source: ANSYS INC, 10-Q, August 05, 2014 Powered by Morningstar® Document Research℠The information contained herein may not be copied, adapted or distributed and is not warranted to be accurate, complete or timely. The user assumes all risks for any damages or losses arising from any use of this information,except to the extent such damages or losses cannot be limited or excluded by applicable law. Past financial performance is no guarantee of future results.

Table of Contents
Liquidity and Capital Resources
(in thousands)June 30,
2014 December 31,
2013 Change
Cash, cash equivalents and short-term investments $ 783,559 $ 742,986 $ 40,573Working capital $ 617,620 $ 627,165 $ (9,545)
Cash, Cash Equivalents and Short-term Investments
Cash and cash equivalents consist primarily of highly liquid investments such as money market mutual funds and deposits held at major banks. Short-terminvestments consist primarily of deposits held by certain foreign subsidiaries of the Company with original maturities of three months to one year. Thefollowing table presents the Company's foreign and domestic holdings of cash, cash equivalents and short-term investments as of June 30, 2014 andDecember 31, 2013:
(in thousands)June 30,
2014 % of Total December 31,
2013 % of Total
Cash, cash equivalents and short-term investments held domestically $ 539,472 68.8% $ 530,680 71.4%Cash, cash equivalents and short-term investments held by foreign subsidiaries 244,087 31.2% 212,306 28.6%Total $ 783,559 $ 742,986
If the foreign balances were repatriated to the U.S., they would be subject to domestic tax, resulting in a tax obligation in the period of repatriation. Ingeneral, it is the practice and intention of the Company to repatriate previously taxed earnings and to reinvest all other earnings of its non-U.S. subsidiaries.The amount of cash, cash equivalents and short-term investments held by foreign subsidiaries is subject to translation adjustments caused by changes inforeign currency exchange rates as of the end of each respective reporting period, the offset to which is recorded in accumulated other comprehensive incomeon the Company’s condensed consolidated balance sheet.
Cash Flows from Operating Activities
Six Months Ended June 30, (in thousands) 2014 2013 Change
Net cash provided by operating activities $ 211,472 $ 182,582 $ 28,890
Cash flows from operations increased during the current fiscal year due to increased net cash flows from operating assets and liabilities of $15.1 million andincreased net income (net of non-cash operating adjustments) of $13.8 million.
31
Source: ANSYS INC, 10-Q, August 05, 2014 Powered by Morningstar® Document Research℠The information contained herein may not be copied, adapted or distributed and is not warranted to be accurate, complete or timely. The user assumes all risks for any damages or losses arising from any use of this information,except to the extent such damages or losses cannot be limited or excluded by applicable law. Past financial performance is no guarantee of future results.

Table of Contents
Cash Flows from Investing Activities
Six Months Ended June 30, (in thousands) 2014 2013 Change
Net cash used in investing activities $ (114,568) $ (12,952) $ (101,616)
Cash used in investing activities increased during the current fiscal year due primarily to an increase in acquisition-related cash outlays of $98.3 millionrelated to the acquisitions of SpaceClaim and Reaction Design as discussed below. The Company currently plans capital spending of $35 million to $45million for the 2014 fiscal year as compared to $28.8 million in 2013. The planned increase is attributable to costs associated with the Company's newCanonsburg, Pennsylvania headquarters facility expected to be completed in late 2014. The Company has occupied its current headquarters facility since1997. The level of spending will be dependent upon various factors, including growth of the business and general economic conditions.
Cash Flows from Financing Activities
Six Months Ended June 30, (in thousands) 2014 2013 Change
Net cash used in financing activities $ (58,698) $ (79,396) $ 20,698
The change in cash activity related to financing activities was due primarily to the Company having no long-term debt payments in 2014. During the firstquarter of 2013, the Company made its scheduled $26.6 million principal payment on its term loan. The Company paid its outstanding loan balance atmaturity on July 31, 2013. Partially offsetting the change related to debt payments were decreased proceeds from the exercise of stock options of $4.4 millionin the six months ended June 30, 2014 as compared to the six months ended June 30, 2013.
On April 30, 2014, the Company completed its acquisition of SpaceClaim, a leading provider of 3-D modeling technology. Under the terms of the agreement,ANSYS acquired SpaceClaim for a purchase price of $84.9 million, which was paid almost entirely in cash, plus retention vehicles and an adjustment forworking capital. The operating results of SpaceClaim have been included in the Company's condensed consolidated financial statements since the date ofacquisition.
In February 2014, the Company received a $26.8 million refund related to its 2009 and 2010 federal income tax returns. The Joint Committee on Taxationreviewed these returns in 2013 and took no exception.
On January 3, 2014, the Company completed the acquisition of Reaction Design, a leading developer of chemistry simulation software. Under the terms ofthe agreement, ANSYS acquired Reaction Design for a purchase price of $19.1 million in cash. The operating results of Reaction Design have been includedin the Company's condensed consolidated financial statements since the date of acquisition.
The Company believes that existing cash and cash equivalent balances of $782.9 million, together with cash generated from operations, will be sufficient tomeet the Company’s working capital and capital expenditure requirements through the next twelve months. The Company’s cash requirements in the futuremay also be financed through additional equity or debt financings. There can be no assurance that such financings can be obtained on favorable terms, if atall.
Under the Company’s stock repurchase program, the Company repurchased 970,200 shares during the six months ended June 30, 2014 at an average price pershare of $74.31, for a total cost of $72.1 million. During the six months ended June 30, 2013, the Company repurchased 988,000 shares at an average priceper share of $74.35, for a total cost of $73.5 million. As of June 30, 2014, 2.0 million shares remain authorized for repurchase under the Company's stockrepurchase program.
The Company continues to generate positive cash flows from operating activities and believes that the best use of its excess cash is to invest in the business,to repurchase stock in order to offset dilution and to return capital to stockholders in excess of its requirements with the goal of increasing stockholdervalue. Additionally, the Company has in the past, and expects in the future, to acquire or make investments in complementary companies, products, servicesand technologies. Any future acquisitions may be funded by available cash and investments, cash generated from operations, credit facilities, or from theissuance of additional securities.
Off-Balance-Sheet Arrangements
The Company does not have any special purpose entities or off-balance-sheet financing.
32
Source: ANSYS INC, 10-Q, August 05, 2014 Powered by Morningstar® Document Research℠The information contained herein may not be copied, adapted or distributed and is not warranted to be accurate, complete or timely. The user assumes all risks for any damages or losses arising from any use of this information,except to the extent such damages or losses cannot be limited or excluded by applicable law. Past financial performance is no guarantee of future results.

Table of Contents
Contractual Obligations
There were no material changes to the Company’s significant contractual obligations during the six months ended June 30, 2014 as compared to thosepreviously reported in “Management’s Discussion and Analysis of Financial Condition and Results of Operations” within the Company’s most recent AnnualReport on Form 10-K.
Critical Accounting Policies and Estimates
During the first quarter of 2014, the Company completed the annual impairment test for goodwill and indefinite-lived intangible assets and determined thatthese assets had not been impaired as of the test date, January 1, 2014. No events or circumstances changed during the six months ended June 30, 2014 thatwould indicate that the fair values of the Company's reporting units or indefinite-lived intangible assets are below their carrying amounts.
No significant changes have occurred to the Company’s critical accounting policies and estimates as previously reported within “Management’s Discussionand Analysis of Financial Condition and Results of Operations” in the Company’s most recent Annual Report on Form 10-K.
33
Source: ANSYS INC, 10-Q, August 05, 2014 Powered by Morningstar® Document Research℠The information contained herein may not be copied, adapted or distributed and is not warranted to be accurate, complete or timely. The user assumes all risks for any damages or losses arising from any use of this information,except to the extent such damages or losses cannot be limited or excluded by applicable law. Past financial performance is no guarantee of future results.

Table of Contents
Item 3. Quantitative and Qualitative Disclosures About Market RiskInterest Income Rate Risk. Changes in the overall level of interest rates affect the interest income that is generated from the Company’s cash and short-terminvestments. For each of the three months ended June 30, 2014 and 2013, total interest income was $0.7 million. For the six months ended June 30, 2014 and2013, total interest income was $1.6 million and $1.5 million, respectively. Cash and cash equivalents consist primarily of highly liquid investments such asmoney market mutual funds and deposits held at major banks.
Foreign Currency Transaction Risk. As the Company continues to expand its business presence in international regions, the portion of its revenue,expenses, cash, accounts receivable and payment obligations denominated in foreign currencies continues to increase. As a result, changes in currencyexchange rates will affect the Company’s financial position, results of operations and cash flows. The Company is most impacted by movements in andamong the Euro, Japanese Yen, British Pound, Korean Won, Indian Rupee and the U.S. Dollar.
With respect to revenue, on average for the quarter ended June 30, 2014, the U.S. Dollar was approximately 2.3% weaker, when measured against theCompany’s primary foreign currencies, than for the quarter ended June 30, 2013. The net overall weakening resulted in increased revenue of $2.7 millionduring the quarter ended June 30, 2014, as compared with the same quarter of 2013. The impact on revenue was primarily driven by $3.1 million of favorableimpact due to a strengthening Euro, partially offset by $1.6 million of adverse impact due to a weakening Japanese Yen. The net overall weakening of theU.S. Dollar also resulted in increased operating income of approximately $1.3 million during the quarter ended June 30, 2014, as compared with the samequarter of 2013.
With respect to revenue, on average for the six months ended June 30, 2014, the U.S. Dollar was approximately 0.7% weaker, when measured against theCompany’s primary foreign currencies, than for the six months ended June 30, 2013. The net overall weakening resulted in increased revenue of $1.7 millionduring the six months ended June 30, 2014, as compared to the six months ended June 30, 2013. The impact on revenue was primarily driven by $5.5 millionof favorable impact due to a strengthening Euro, partially offset by $4.9 million of adverse impact due to a weakening Japanese Yen. The net overallweakening of the U.S. Dollar also resulted in increased operating income of approximately $0.4 million during the six months ended June 30, 2014, ascompared to the six months ended June 30, 2013.
The Company has foreign currency denominated liabilities. In order to provide a natural hedge to mitigate the foreign currency exchange risk, the Companywill purchase foreign currencies and hold these currencies in cash until the liabilities are settled.
The most significant currency impacts on revenue and operating income were primarily attributable to U.S. Dollar exchange rate changes against the BritishPound, Euro and Japanese Yen as reflected in the charts below:
Period End Exchange Rates
As of GBP/USD EUR/USD USD/JPY
June 30, 2013 1.521 1.301 99.108December 31, 2013 1.656 1.375 105.263June 30, 2014 1.711 1.369 101.317
Average Exchange Rates
Three Months Ended GBP/USD EUR/USD USD/JPY
March 31, 2013 1.550 1.320 92.335June 30, 2013 1.536 1.307 98.615September 30, 2013 1.552 1.326 98.864December 31, 2013 1.620 1.361 100.445March 31, 2014 1.655 1.370 102.753June 30, 2014 1.684 1.371 102.137
No other material change has occurred in the Company’s market risk subsequent to December 31, 2013.
34
Source: ANSYS INC, 10-Q, August 05, 2014 Powered by Morningstar® Document Research℠The information contained herein may not be copied, adapted or distributed and is not warranted to be accurate, complete or timely. The user assumes all risks for any damages or losses arising from any use of this information,except to the extent such damages or losses cannot be limited or excluded by applicable law. Past financial performance is no guarantee of future results.

Table of Contents
Item 4. Controls and ProceduresEvaluation of Disclosure Controls and Procedures. As required by Rules 13a-15 and 15d-15 of the Securities Exchange Act of 1934, as amended, or theExchange Act, the Company has evaluated, with the participation of management, including the Chief Executive Officer and the Chief Financial Officer, theeffectiveness of the design and operation of its disclosure controls and procedures as of the end of the period covered by this report. Based on suchevaluation, the Chief Executive Officer and Chief Financial Officer have concluded that such disclosure controls and procedures are effective, as defined inRule 13a-15(e) of the Exchange Act.
The Company has a Disclosure Review Committee to assist in the quarterly evaluation of the Company’s internal disclosure controls and procedures and inthe review of the Company’s periodic filings under the Exchange Act. The membership of the Disclosure Review Committee consists of the Company’s ChiefExecutive Officer, Chief Financial Officer, Global Controller, General Counsel, Director of Investor Relations and Global Insurance, Vice President ofWorldwide Sales and Support, Vice President of Human Resources, Vice President of Marketing and Chief Product Officer. This committee is advised byexternal counsel, particularly on SEC-related matters. Additionally, other members of the Company’s global management team advise the committee withrespect to disclosure via a sub-certification process.
The Company believes, based on its knowledge, that the financial statements and other financial information included in this report fairly present, in allmaterial respects, the financial condition, results of operations and cash flows of the Company as of and for the periods presented in this report. The Companyis committed to both a sound internal control environment and to good corporate governance.
Because of its inherent limitations, internal control over financial reporting may not prevent or detect misstatements. Projections of any evaluation ofeffectiveness to future periods are subject to the risk that controls may become inadequate because of changes in conditions, or that the degree of compliancewith policies or procedures may deteriorate.
From time to time, the Company reviews the disclosure controls and procedures and may make changes to enhance their effectiveness and to ensure that theCompany’s systems evolve with its business.
Changes in Internal Control. The Company is in the process of extending its internal controls to its acquisition of SpaceClaim. Otherwise, there were nochanges in the Company’s internal control over financial reporting that occurred during the three months ended June 30, 2014 that materially affected, orwere reasonably likely to materially affect, the Company's internal control over financial reporting.
35
Source: ANSYS INC, 10-Q, August 05, 2014 Powered by Morningstar® Document Research℠The information contained herein may not be copied, adapted or distributed and is not warranted to be accurate, complete or timely. The user assumes all risks for any damages or losses arising from any use of this information,except to the extent such damages or losses cannot be limited or excluded by applicable law. Past financial performance is no guarantee of future results.

Table of Contents
PART II – OTHER INFORMATION Item 1. Legal ProceedingsThe Company is subject to various investigations, claims and legal proceedings that arise in the ordinary course of business, including alleged infringementof intellectual property rights, commercial disputes, labor and employment matters, tax audits and other matters. In the opinion of the Company, theresolution of pending matters is not expected to have a material, adverse effect on the Company’s consolidated results of operations, cash flows or financialposition. However, each of these matters is subject to various uncertainties and it is possible that an unfavorable resolution of one or more of theseproceedings could in the future materially affect the Company’s results of operations, cash flows or financial position.
Item 1A. Risk FactorsThe Company cautions investors that its performance (and, therefore, any forward-looking statement) is subject to risks and uncertainties. Various importantfactors may cause the Company’s future results to differ materially from those projected in any forward-looking statement. These factors were disclosed in,but are not limited to, the items within the Company’s most recent Annual Report on Form 10-K, Part I, Item 1A. Any material changes which occurredregarding the Company's risk factors subsequent to December 31, 2013 are discussed below.
On April 30, 2014, the Company completed the acquisition of SpaceClaim. Under the terms of the agreement, ANSYS acquired SpaceClaim for a purchaseprice of $84.9 million, which was paid almost entirely in cash, plus retention vehicles and an adjustment for working capital. On January 3, 2014, theCompany completed the acquisition of Reaction Design. Under the terms of the agreement, ANSYS acquired Reaction Design for a purchase price of $19.1million in cash. The acquisitions are expected to accelerate development of new and innovative products to the marketplace while lowering design andengineering costs for customers. As a result of these acquisitions, the Company has been or may be exposed to the following additional risks:
Challenges of the Acquisitions
The Company will need to meet significant challenges to realize the expected benefits and synergies of the acquisitions. These challenges include:
• integrating the management teams, strategies, cultures and operations of the companies;
• retaining and assimilating the key personnel of each company;
• integrating sales and business development operations;
• retaining existing customers of each company;
• developing new products and services that utilize the technologies and resources of the companies;
• creating uniform standards, controls, procedures, policies and information systems;
• realizing the anticipated cost savings in the combined company; and
• combining the businesses of the Company, SpaceClaim and Reaction Design in a manner that does not materially disrupt SpaceClaim’s or ReactionDesign's existing customer relationships nor otherwise result in decreased revenues and that allows the Company to capitalize on SpaceClaim’s andReaction Design's growth opportunities.
The accomplishment of these post-acquisition objectives will involve considerable risks, including:
• the loss of key employees that are critical to the successful integration and future operations of the companies;
• the potential disruption of each company’s ongoing business and distraction of their respective management teams;
• the difficulty of incorporating acquired technology and rights into the Company’s products and services;
• unanticipated expenses related to technology integration;
• potential disruptions in each company’s operations, loss of existing customers, loss of key information, expertise or know-how, and unanticipatedadditional recruitment and training costs;
• possible inconsistencies in standards, controls, procedures and policies that could adversely affect the Company’s ability to maintain relationshipswith customers and employees or to achieve the anticipated benefits of the acquisitions; and
• potential unknown liabilities associated with the acquisitions.
36
Source: ANSYS INC, 10-Q, August 05, 2014 Powered by Morningstar® Document Research℠The information contained herein may not be copied, adapted or distributed and is not warranted to be accurate, complete or timely. The user assumes all risks for any damages or losses arising from any use of this information,except to the extent such damages or losses cannot be limited or excluded by applicable law. Past financial performance is no guarantee of future results.

Table of Contents
If the Company does not succeed in addressing these challenges or any other problems encountered in connection with the acquisitions, its operating resultsand financial condition could be adversely affected.
Market Price of the Company’s Common Stock
The market price of the Company’s common stock may decline as a result of the acquisitions for a number of reasons, including:
• the integration of SpaceClaim and Reaction Design by the Company may be unsuccessful;
• the Company may not achieve the perceived benefits of the acquisitions as rapidly as, or to the extent, anticipated by financial or industry analysts;and
• the effect of the acquisitions on the Company’s financial results may not be consistent with the expectations of financial or industry analysts.
Item 2. Unregistered Sales of Equity Securities and Use of Proceeds(c) Issuer Purchases of Equity Securities
Period Total Number ofShares Purchased
Average Price Paid perShare
Total Number ofShares Purchased as
Part of PubliclyAnnounced Plans or
Programs
Maximum Number ofShares that May YetBe Purchased UnderPlans or Programs
April 1 - April 30, 2014 — — — 3,000,000(1)
May 1 - May 31, 2014 813,900 $ 74.36 813,900 2,186,100June 1 - June 30, 2014 156,300 $ 74.06 156,300 2,029,800
Total 970,200 $ 74.31 970,200 2,029,800
(1) The Company initially announced its stock repurchase program in February 2000, and subsequently announced various amendments to the program. InFebruary 2014, the Company's Board of Directors approved the repurchase of up to a total of 3,000,000 shares under the program, which does not have anexpiration date.
Item 3. Defaults Upon Senior SecuritiesNone.
Item 4. Mine Safety DisclosuresNot applicable.
Item 5. Other InformationNone.
37
Source: ANSYS INC, 10-Q, August 05, 2014 Powered by Morningstar® Document Research℠The information contained herein may not be copied, adapted or distributed and is not warranted to be accurate, complete or timely. The user assumes all risks for any damages or losses arising from any use of this information,except to the extent such damages or losses cannot be limited or excluded by applicable law. Past financial performance is no guarantee of future results.

Table of Contents
Item 6. Exhibits
(a) Exhibits.
Exhibit No. Exhibit
15 Independent Registered Public Accountant’s Letter Regarding Unaudited Financial Information.
31.1 Certification of Chief Executive Officer pursuant to Section 302 of the Sarbanes-Oxley Act of 2002.
31.2 Certification of Chief Financial Officer pursuant to Section 302 of the Sarbanes-Oxley Act of 2002.
32.1 Certification pursuant to 18 U.S.C. Section 1350, as adopted pursuant to Section 906 of the Sarbanes-Oxley Act of 2002.
32.2 Certification pursuant to 18 U.S.C. Section 1350, as adopted pursuant to Section 906 of the Sarbanes-Oxley Act of 2002.
101.INS XBRL Instance Document
101.SCH XBRL Taxonomy Extension Schema
101.CAL XBRL Taxonomy Extension Calculation Linkbase
101.DEF XBRL Taxonomy Extension Definition Linkbase
101.LAB XBRL Taxonomy Extension Label Linkbase
101.PRE XBRL Taxonomy Extension Presentation Linkbase
38
Source: ANSYS INC, 10-Q, August 05, 2014 Powered by Morningstar® Document Research℠The information contained herein may not be copied, adapted or distributed and is not warranted to be accurate, complete or timely. The user assumes all risks for any damages or losses arising from any use of this information,except to the extent such damages or losses cannot be limited or excluded by applicable law. Past financial performance is no guarantee of future results.

Table of Contents
SIGNATURES
Pursuant to the requirements of the Securities Exchange Act of 1934, the Registrant has duly caused this report to be signed on its behalf by the undersigned,thereunto duly authorized.
ANSYS, Inc.
Date: August 5, 2014 By: /s/ James E. Cashman III James E. Cashman III President and Chief Executive Officer
Date: August 5, 2014 By: /s/ Maria T. Shields Maria T. Shields Chief Financial Officer
39
Source: ANSYS INC, 10-Q, August 05, 2014 Powered by Morningstar® Document Research℠The information contained herein may not be copied, adapted or distributed and is not warranted to be accurate, complete or timely. The user assumes all risks for any damages or losses arising from any use of this information,except to the extent such damages or losses cannot be limited or excluded by applicable law. Past financial performance is no guarantee of future results.

EXHIBIT 15
August 5, 2014
ANSYS, Inc.275 Technology DriveCanonsburg, PA 15317
We have reviewed, in accordance with the standards of the Public Company Accounting Oversight Board (United States), the unaudited interim financialinformation of ANSYS, Inc. and subsidiaries for the periods ended June 30, 2014, and 2013, as indicated in our report dated August 5, 2014; because we didnot perform an audit, we expressed no opinion on that information.
We are aware that our report referred to above, which is included in your Quarterly Report on Form 10-Q for the quarter ended June 30, 2014, is incorporatedby reference in Registration Statement Nos. 333-08613, 333-69506, 333-110728, 333-137274, 333-152765, 333-174670, 333-177030, and 333-196393 onForm S-8.
We also are aware that the aforementioned report, pursuant to Rule 436(c) under the Securities Act of 1933, is not considered a part of the RegistrationStatement prepared or certified by an accountant or a report prepared or certified by an accountant within the meaning of Sections 7 and 11 of that Act.
/s/ Deloitte & Touche LLPPittsburgh, Pennsylvania
Source: ANSYS INC, 10-Q, August 05, 2014 Powered by Morningstar® Document Research℠The information contained herein may not be copied, adapted or distributed and is not warranted to be accurate, complete or timely. The user assumes all risks for any damages or losses arising from any use of this information,except to the extent such damages or losses cannot be limited or excluded by applicable law. Past financial performance is no guarantee of future results.

EXHIBIT 31.1
CHIEF EXECUTIVE OFFICER CERTIFICATION
I, James E. Cashman III, certify that:
1. I have reviewed this quarterly report on Form 10-Q of ANSYS, Inc. (“ANSYS”);
2. Based on my knowledge, this report does not contain any untrue statement of a material fact or omit to state a material fact necessary to make thestatements made, in light of the circumstances under which such statements were made, not misleading with respect to the period covered by thisreport;
3. Based on my knowledge, the financial statements, and other financial information included in this report, fairly present in all material respects thefinancial condition, results of operations and cash flows of ANSYS as of, and for, the periods presented in this report;
4. ANSYS’s other certifying officer and I are responsible for establishing and maintaining disclosure controls and procedures (as defined in Exchange ActRules 13a-15(e) and 15d-15(e)) and internal control over financial reporting (as defined in Exchange Act Rules 13a-15(f) and 15d-15(f)) for ANSYSand have:
a. Designed such disclosure controls and procedures, or caused such disclosure controls and procedures to be designed under our supervision, toensure that material information relating to ANSYS, including its consolidated subsidiaries, is made known to us by others within those entities,particularly during the period in which this report is being prepared;
b. Designed such internal control over financial reporting, or caused such internal control over financial reporting to be designed under oursupervision, to provide reasonable assurance regarding the reliability of financial reporting and the preparation of financial statements forexternal purposes in accordance with generally accepted accounting principles;
c. Evaluated the effectiveness of ANSYS’s disclosure controls and procedures and presented in this report our conclusions about the effectivenessof the disclosure controls and procedures, as of the end of the period covered by this report based on such evaluation; and
d. Disclosed in this report any change in ANSYS’s internal control over financial reporting that occurred during ANSYS’s most recent fiscalquarter (ANSYS’s fourth fiscal quarter in the case of an annual report) that has materially affected, or is reasonably likely to materially affect,ANSYS’s internal control over financial reporting; and
5. ANSYS’s other certifying officer and I have disclosed, based on our most recent evaluation of internal control over financial reporting, to ANSYS’sauditors and the audit committee of ANSYS’s board of directors (or persons performing the equivalent functions):
a. All significant deficiencies and material weaknesses in the design or operation of internal control over financial reporting which are reasonablylikely to adversely affect ANSYS’s ability to record, process, summarize and report financial information; and
b. Any fraud, whether or not material, that involves management or other employees who have a significant role in ANSYS’s internal control overfinancial reporting.
Date: August 5, 2014 /s/ James E. Cashman III James E. Cashman III President and Chief Executive Officer
Source: ANSYS INC, 10-Q, August 05, 2014 Powered by Morningstar® Document Research℠The information contained herein may not be copied, adapted or distributed and is not warranted to be accurate, complete or timely. The user assumes all risks for any damages or losses arising from any use of this information,except to the extent such damages or losses cannot be limited or excluded by applicable law. Past financial performance is no guarantee of future results.

EXHIBIT 31.2
CHIEF FINANCIAL OFFICER CERTIFICATION
I, Maria T. Shields, certify that:
1. I have reviewed this quarterly report on Form 10-Q of ANSYS, Inc. (“ANSYS”);
2. Based on my knowledge, this report does not contain any untrue statement of a material fact or omit to state a material fact necessary to make thestatements made, in light of the circumstances under which such statements were made, not misleading with respect to the period covered by thisreport;
3. Based on my knowledge, the financial statements, and other financial information included in this report, fairly present in all material respects thefinancial condition, results of operations and cash flows of ANSYS as of, and for, the periods presented in this report;
4. ANSYS’s other certifying officer and I are responsible for establishing and maintaining disclosure controls and procedures (as defined in Exchange ActRules 13a-15(e) and 15d-15(e)) and internal control over financial reporting (as defined in Exchange Act Rules 13a-15(f) and 15d-15(f)) for ANSYSand have:
a. Designed such disclosure controls and procedures, or caused such disclosure controls and procedures to be designed under our supervision, toensure that material information relating to ANSYS, including its consolidated subsidiaries, is made known to us by others within those entities,particularly during the period in which this report is being prepared;
b. Designed such internal control over financial reporting, or caused such internal control over financial reporting to be designed under oursupervision, to provide reasonable assurance regarding the reliability of financial reporting and the preparation of financial statements forexternal purposes in accordance with generally accepted accounting principles;
c. Evaluated the effectiveness of ANSYS’s disclosure controls and procedures and presented in this report our conclusions about the effectivenessof the disclosure controls and procedures, as of the end of the period covered by this report based on such evaluation; and
d. Disclosed in this report any change in ANSYS’s internal control over financial reporting that occurred during ANSYS’s most recent fiscalquarter (ANSYS’s fourth fiscal quarter in the case of an annual report) that has materially affected, or is reasonably likely to materially affect,ANSYS’s internal control over financial reporting; and
5. ANSYS’s other certifying officer and I have disclosed, based on our most recent evaluation of internal control over financial reporting, to ANSYS’sauditors and the audit committee of ANSYS’s board of directors (or persons performing the equivalent functions):
a. All significant deficiencies and material weaknesses in the design or operation of internal control over financial reporting which are reasonablylikely to adversely affect ANSYS’s ability to record, process, summarize and report financial information; and
b. Any fraud, whether or not material, that involves management or other employees who have a significant role in ANSYS’s internal control overfinancial reporting.
Date: August 5, 2014 /s/ Maria T. Shields Maria T. Shields Chief Financial Officer
Source: ANSYS INC, 10-Q, August 05, 2014 Powered by Morningstar® Document Research℠The information contained herein may not be copied, adapted or distributed and is not warranted to be accurate, complete or timely. The user assumes all risks for any damages or losses arising from any use of this information,except to the extent such damages or losses cannot be limited or excluded by applicable law. Past financial performance is no guarantee of future results.

EXHIBIT 32.1
CERTIFICATION PURSUANT TO18 U.S.C. SECTION 1350
AS ADOPTED PURSUANT TOSECTION 906 OF THE SARBANES-OXLEY ACT OF 2002
In connection with the Quarterly Report of ANSYS, Inc. (the “Company”) on Form 10-Q for the quarter ended June 30, 2014 as filed with the Securities andExchange Commission on the date hereof (the “Report”), I, James E. Cashman III, President and Chief Executive Officer of the Company, certify, pursuant to18 U.S.C. Section 1350, as adopted pursuant to Section 906 of the Sarbanes-Oxley Act of 2002, that to my knowledge:
(1) The Report fully complies with requirements of Section 13(a) or 15(d) of the Securities Exchange Act of 1934, as amended, and
(2) The information contained in the Report fairly presents, in all material respects, the financial condition and results of operations of theCompany.
This certification is provided solely pursuant to 18 U.S.C. Section 1350, as adopted pursuant to Section 906 of the Sarbanes-Oxley Act of 2002, and shall notbe deemed to be part of the Report or filed for any purpose whatsoever.
/s/ James E. Cashman IIIJames E. Cashman IIIPresident and Chief Executive OfficerAugust 5, 2014
Source: ANSYS INC, 10-Q, August 05, 2014 Powered by Morningstar® Document Research℠The information contained herein may not be copied, adapted or distributed and is not warranted to be accurate, complete or timely. The user assumes all risks for any damages or losses arising from any use of this information,except to the extent such damages or losses cannot be limited or excluded by applicable law. Past financial performance is no guarantee of future results.

EXHIBIT 32.2
CERTIFICATION PURSUANT TO18 U.S.C. SECTION 1350
AS ADOPTED PURSUANT TOSECTION 906 OF THE SARBANES-OXLEY ACT OF 2002
In connection with the Quarterly Report of ANSYS, Inc. (the “Company”) on Form 10-Q for the quarter ended June 30, 2014 as filed with the Securities andExchange Commission on the date hereof (the “Report”), I, Maria T. Shields, Chief Financial Officer of the Company, certify, pursuant to 18 U.S.C.Section 1350, as adopted pursuant to Section 906 of the Sarbanes-Oxley Act of 2002, that to my knowledge:
(1) The Report fully complies with requirements of Section 13(a) or 15(d) of the Securities Exchange Act of 1934, as amended, and
(2) The information contained in the Report fairly presents, in all material respects, the financial condition and results of operations of theCompany.
This certification is provided solely pursuant to 18 U.S.C. Section 1350, as adopted pursuant to Section 906 of the Sarbanes-Oxley Act of 2002, and shall notbe deemed to be part of the Report or filed for any purpose whatsoever.
/s/ Maria T. ShieldsMaria T. ShieldsChief Financial OfficerAugust 5, 2014
Source: ANSYS INC, 10-Q, August 05, 2014 Powered by Morningstar® Document Research℠The information contained herein may not be copied, adapted or distributed and is not warranted to be accurate, complete or timely. The user assumes all risks for any damages or losses arising from any use of this information,except to the extent such damages or losses cannot be limited or excluded by applicable law. Past financial performance is no guarantee of future results.

Source: ANSYS INC, 10-Q, August 05, 2014 Powered by Morningstar® Document Research℠The information contained herein may not be copied, adapted or distributed and is not warranted to be accurate, complete or timely. The user assumes all risks for any damages or losses arising from any use of this information,except to the extent such damages or losses cannot be limited or excluded by applicable law. Past financial performance is no guarantee of future results.