Media Ownership and Concentration in Canada, 1984 – · PDF fileMedia Ownership and...
28
1 Media Ownership and Concentration in Canada, 1984 – 2010 1 Dwayne Winseck Introduction The media economy in Canada is typically cast as being dwarfed by the world’s largest media economy on its doorstep, the United States. In fact, it is the eighth largest media economy on the planet. As with most countries, the media economy in Canada has been transformed by extraordinary growth and greater differentiation within the media ecology over the past quarter of a century. New services have developed (pay television, wireless telephony, Internet) and at least during the 1980s and early-1990s more competition took hold in most sectors of the media economy. Such trends, however, soon yielded to higher levels of concentration from the late-1990s until the present, as shown below. In this chapter, I analyze the evolution of a dozen of the most significant media markets in Canada. I call the totality of these sectors the telecom-media-Internet (TMI) industries, and the analysis is based on a body of data assembled for each sector from 1984 until 2010: wired and wireless telecom services, broadcast television, multi-channel pay television, cable, satellite & IPTV distributors, newspapers, magazines, music, radio, Internet access, Search Engines and Social Network Sites. The aim is create a systematic body of data covering the past two and a half decades where there is currently none. It is also to use standard concentration ratios (CR4) as well as the Herfindhahl – Hirschman Index (HHI) to examine whether media markets have become more or less concentrated over time. In Media Ownership and Concentration in America, Eli Noam (2009) laments the lack of a systematic, empirically-based portrait of the state of media concentration in the United States and points to two reasons for this: first, the issue is highly politicized and, second, gathering data on complex industries over long spans of time is not easy. Much the same can be said for Canada. Ultimately, the data collected for this element of the International Media Concentration Research project aims to help fill this gap. Furthermore, it will also serve as a stepping-stone to a long-term effort to annually update the portrait, broaden and improve the scope and quality of its coverage, and to think long and hard about why we should study this issue in the first place. The Historical Record and Renewed Interest in Media Concentration in the 21st Century Media ownership and concentration has emerged repeatedly, even if episodically, as a highly contested topic in Canada since the 19th and early-20th centuries. In the early 1900s, for example, the Canadian Pacific Telegraph Company and Great Northwestern Telegraph Company (the latter an arm of the New York-based goliath, Western Union) dominated the telegraph industry west and east of Montreal respectively. They also shared the exclusive Canadian distribution rights for the Associated Press news service. The two telegraph companies essentially gave away the American news wire service to
Transcript of Media Ownership and Concentration in Canada, 1984 – · PDF fileMedia Ownership and...

1
Media Ownership and Concentration in Canada, 1984 – 20101
Dwayne Winseck
Introduction The media economy in Canada is typically cast as being dwarfed by the world’s largest media economy on its doorstep, the United States. In fact, it is the eighth largest media economy on the planet. As with most countries, the media economy in Canada has been transformed by extraordinary growth and greater differentiation within the media ecology over the past quarter of a century. New services have developed (pay television, wireless telephony, Internet) and at least during the 1980s and early-1990s more competition took hold in most sectors of the media economy. Such trends, however, soon yielded to higher levels of concentration from the late-1990s until the present, as shown below. In this chapter, I analyze the evolution of a dozen of the most significant media markets in Canada. I call the totality of these sectors the telecom-media-Internet (TMI) industries, and the analysis is based on a body of data assembled for each sector from 1984 until 2010: wired and wireless telecom services, broadcast television, multi-channel pay television, cable, satellite & IPTV distributors, newspapers, magazines, music, radio, Internet access, Search Engines and Social Network Sites. The aim is create a systematic body of data covering the past two and a half decades where there is currently none. It is also to use standard concentration ratios (CR4) as well as the Herfindhahl – Hirschman Index (HHI) to examine whether media markets have become more or less concentrated over time. In Media Ownership and Concentration in America, Eli Noam (2009) laments the lack of a systematic, empirically-based portrait of the state of media concentration in the United States and points to two reasons for this: first, the issue is highly politicized and, second, gathering data on complex industries over long spans of time is not easy. Much the same can be said for Canada. Ultimately, the data collected for this element of the International Media Concentration Research project aims to help fill this gap. Furthermore, it will also serve as a stepping-stone to a long-term effort to annually update the portrait, broaden and improve the scope and quality of its coverage, and to think long and hard about why we should study this issue in the first place. The Historical Record and Renewed Interest in Media Concentration in the 21st Century
Media ownership and concentration has emerged repeatedly, even if episodically, as a highly contested topic in Canada since the 19th and early-20th centuries. In the early 1900s, for example, the Canadian Pacific Telegraph Company and Great Northwestern Telegraph Company (the latter an arm of the New York-based goliath, Western Union) dominated the telegraph industry west and east of Montreal respectively. They also shared the exclusive Canadian distribution rights for the Associated Press news service. The two telegraph companies essentially gave away the American news wire service to

2
the leading daily newspaper in each city and town they served for free as a means to fortify their dominant stake in the vastly more lucrative telegraph business against smaller rivals. This was a boon to established members of the press and to AP. It helped the telegraph companies stitch up their lock on the telegraph business as well. Yet, such arrangements stifled competition amongst newspaper and choked the flow of news on the wires. As the muckraking journalist, W. F. Maclean, wrote in the Toronto World,
. . . attempts on the part of public service companies [the telegraph companies] to muzzle free expression of opinion by withholding privileges that are of general right cannot be too strongly condemned (quoted in Nichols, 1948, p. 41).
The Winnipeg-based Western Associated Press learned the lessons of concentration and vertical integration the hard way when it established a rival news service in 1907. The problem, however, was that there was just no way that its subscribers could afford to pay two costs — i.e. telegraph transmission charges and for the news service — and stay in business at the same time that AP’s service was being given away for free. In 1910, the Board of Railway Commissioners (BRC), one of the first regulatory bodies in Canada, stepped in to effectively slay the ‘double-headed news monopoly’. In the face of much corporate bluster to the effect that BRC had no jurisdiction over the matter, the BRC shot back that the law required it to insure that rates were “just and reasonable because, unless they were, the “telegraph companies could put out of business every newsgathering agency that dared to enter the field of competition with them” (p. 275). Thereafter, the three-fold alliance between the telegraph companies on the one side and Associated Press on the other unraveled – control over the medium forcefully separated from the message, so to speak. It was also the beginning of common carriage in Canada (Babe, 1990). While there were other moments of concern in the interim, media concentration issues came to a head again in the 1970s and early 1980s, when three inquiries were held: (1) the Special Senate Committee on Mass Media, The Uncertain Mirror (2 vols.)(Canada, 1970); (2) the Royal Commission on Corporate Concentration prompted partially by Gesca’s (Power Corp) bid to acquire the Argus group of newspapers (Canada, 1978); and (3) the Royal Commission on Newspapers (Kent Committee), which was called after a spate of newspaper consolidation and closures in 1980 (Canada, 1981). Whatever meager measures did come out of these events soon passed and there was little official interest in the subject for the following two decades. Instead, the realignment of political, technological and economic forces evident worldwide took root in Canada. Markets were opened, new media technologies introduced, and regulatory restraints loosened. New media services (pay television, cable and satellite distribution, Internet, etc.) meant that the media ecology grew larger and more differentiated. The number of distinct media ownership groups rose in the 1980s and early-1990s and there was more competition in many sectors but not all (see below). The gradual transformation of the media was strictly managed to minimize disrupting the industrial and regulatory status quo. This is mostly because large communication and media companies, then as now, were seen as national champions with the deep pockets and wherewithal needed to build

3
network infrastructure and fund the high-cost of Canadian programming relative to the bargain basement cost of U.S. cultural goods. Many media players that were once central to the Canadian media system have since disappeared (e.g. Southam, Hollinger, CHUM, Osprey, and many others), mostly through consolidation into ever-larger groups, although a few have collapsed in bankruptcy and financial disarray (e.g. Canwest, Craig Media, TQS). Several new groups have arisen in the traditional and emergent media sectors alike (e.g. Postmedia, Remstar, Channel Zero. Wind, Mobilicity, Public Mobile). Major players that were big in the 1980s, notably Bell, Rogers, Shaw and TVA/Videotron (now part of Quebecor Media Inc, QMI), have since become massively larger, and vertically integrated to a degree that is probably unique in the world. Bell, Rogers, Shaw and QMI have roots that reach deep back to the time when they were granted local and regional telephone and cable monopolies during the 20th century. Since the 1990s, they have leveraged their incumbent monopoly status in one area to become competitors with one another in duopolistic markets for network infrastructure services (e.g. telephone, tv distribution, Internet access) and oligopolistic broadcasting markets (alongside a few others with sizeable, sometimes even bigger stakes in such areas, e.g. CBC, Astral) as well as wireless cellphone services. There are areas where they don’t compete with one another at all, as well, as is true for newspapers, where QMI holds a dominant position alongside a handful of groups that are very strong in newspapers but not much else: e.g. Postmedia (12 dailies and National Post), Torstar (Toronto Star and Harlequin romance novels), Thomson family (Globe & Mail, Thomson Reuters), Gesca (the La Presse chain of dailies). In areas such as search engines and social networking sites, none of these entities has much sway, while Google, Yahoo, Facebook, LinkIn and, until recently, MySpace rule the roost. While gradual transformation was the sign of the times in the 1980s and early 1990s, by the late-1990s circumstances shifted abruptly. A slew of mergers and acquisitions set in motion a wave of consolidation in the press, television, telecoms, radio and cable sectors as well as cross-media ownership on an unprecedented scale (see evidence below). These changes thrust the issue of media concentration back into the spotlight. Whereas, there had been no formal inquiries for more than two decades, three were called between 2003 and 2007: (1) the Standing Committee on Canadian Heritage, Our Cultural Sovereignty (2003); (2) the Standing Senate Committee on Transport and Communications, Final Report on the Canadian News Media (2006);2 and (3) the Canadian Radio-Television and Telecommunications Commission’s Diversity of Voices inquiry in 2008. Again, while finding that concentration was high, none of these efforts did much to stem the tide. The CRTC’s response to its Diversity of Voices hearings at least had the merit of adopting, for the first time ever, a formal set of rules and thresholds to guide its decisions in the future about mergers, acquisition and consolidation. Its new rules on cross-media ownership also put an end to a situation where Canada stood unique in the world, except for New Zealand, for having no formal limits on the matter at all. Drawing on lessons

4
learnt from Australia, the United Kingdom and United States, the CRTC’s (2008) new rules are based on four central elements:
1. 2 out of 3 Rule: “The Commission, as a general rule, will not approve applications . . . that would result in the ownership or control, by one person, of a radio station, a television station and a newspaper serving the same market”.
2. Ownership Caps: the CRTC adopted thresholds originally developed by the Competition Bureau for measuring competition in banking services. According to the new rules, any transaction that results in a single ownership group controlling less than 35% of the television broadcasting and pay and specialty market will be seen as not diminishing diversity and approved. Those that fall into the 35-45% range will be considered as potentially lessening competition and reviewed, while anything over 45% will be seen as creating excessive concentration and rejected.
3. Telco/Cable/DTH cross-ownership: The Commission, as a general rule, will not
approve consolidation amongst the incumbent telephone and cable companies that would result in one company being able to control Internet access and the delivery of programming services in any given local market.
4. Vertical integration of programming services and producers: ‘Access rules’
designed to limit vertically-integrated media conglomerates’ ability to foreclose access to their broadcast schedules to outside television and film producers. For conventional over-the-air television stations, three quarters of the programming broadcast has to be purchased from outside sources, while for digital specialty and pay services, at least 25% of Canadian programming, other than news, sports, and current affairs, must be produced and obtained from independent producers.
The results acknowledged that clear guidelines and limits to media concentration are important. They also recognized that concentration in traditional media – newspapers, television and radio – is still important because they are still the source of the majority of professionally produced media content that cascades across all media, including the Internet. However, while the new rules may be better than no rules at all, they are weak. This is mostly because the thresholds adopted import criteria used to review mergers and consolidation in the banking industry, effectively disarming the potential for the regulator to encounter a merger it couldn’t approve because of their extremely high levels. Such a standard also runs roughshod over the qualities that distinguish communications media from banks and industry. Thus, instead of striving to maximize the range of diversity and freedom of expression possible, the CRTC’s guiding philosophy is the wholly uninspiring goal of achieving as much diversity “as practicable”. In other words, it is a technocratic standard rather than a democratic one. Canadian Research and Perspectives on Media Ownership and Concentration Although debates on media ownership and concentration are commonplace and enduring, the evidentiary baseline of much of the discussion is rudimentary. The resurgence of

5
interest in the subject in the 2000s did, however, stoke something of a revival in research, with three basic easily positions discernable. First, there are serious critical scholars such as Marc Raboy and David Taras from McGill University and University of Calgary, respectively and for instance, who have been critical of the direction that things are taking and who played key roles in the proceedings that led to the Our Cultural Sovereignty report (Canada, 2003). David Skinner and Mike Gasher (2005) also published a good overview of the lay of the land with respect to media ownership and concentration historically and as such matters played out in the late-1990s and early-2000s. Monica Auer (2007) has also contributed thoughtful, empirically-rich critiques of television and radio concentration, and the convoluted reasoning by policy-makers and the CRTC that has led to such outcomes. Some radical critics constantly see media concentration as going from bad to worse, depleting Canadians of “democracy’s oxygen” (Winter, 1997), or creating “Canada’s most dangerous media company” (Edge, 2007). A second stance mocks concern with media concentration altogether, whether of the critical scholarly type or in the more lurid form adopted by some. This was perhaps best epitomized by the famous and cocky quote by Leonard Asper, then CEO of Canwest, in response to the Senate committee called to look into just such issues. As he quipped, “the media are more fragmented than ever. People who think otherwise probably believe that Elvis is still alive” (quoted in Foss, 2002, p. B4). Chris Dornan (2006) also set this tone in an article for the Literary Review of Canada, “’Big media bad thing’”: how a Senate committee wrote a media report with its head in the sand”. There is a more sophisticated view from this perspective, and in Canada it is probably best exemplified by Kenneth Goldstein’s work. His intervention on behalf of Canwest during the Diversity of Voices hearings, and a study that he wrote about the state of the newspaper industry in Canada, marshal an impressive body of evidence, historical insight and argument to support the conclusion that media ownership is more dispersed and markets more competitive than ever. He sees this as being mostly due to the Internet, the proliferation of new distribution platforms as well as the shift of advertising from traditional to online media. The results, he argues, are eroding the economic base of television and newspapers, while splintering audiences into ever-finer niches. The consequence for democracy are all too real, too, he says, with a cacophony of voices emanating from the DIY world of online media eroding the common understanding upon which civil discourse and democracy rest. Any worries about media concentration in this context, he argues, are anachronistic, and beside the point. A third view strives to hug the middle ground, quantitatively analyzing reams of media content only to find the evidence on the question about how changes in media ownership and market structure effect content to be “mixed and inconclusive” (Soderlund, et. al al. 2005). The problem, however, is that the conclusion assumes that ‘affects on content’ is the proper measure of the circumstances at hand, or the main concern, and that preserving an already constrained status quo is not a significant problem on its own.

6
The CRTC, other than the Diversity of Voices hearings described above, does not study media ownership and concentration issues directly. Nonetheless, the CRTC’s annual Communications Monitoring Report and regularly updated ownership charts are useful sources, although both are limited in their value to researchers by several factors. For instance, the Communications Monitoring Report provides useful data on revenues and market shares (but typically not both) for the biggest 4 or 5 players in radio, television, cable and satellite distribution and telecoms. The problem, however, is that this coverage does not cover the rest of the players. In addition, the material is presented inconsistently from year-to-year, interspersing revenues, market share, and other measures willy-nilly, and in ways that sometimes seem to be deliberately designed to distract attention from unpleasant truths that might reflect badly on it or the industries it regulates. In addition, most of the information published by the CRTC, and Statistics Canada as well, is only done at the aggregate level out of deference to claims of corporate confidentiality and competitive secrets. Pressure on the CRTC by the industries it regulates to minimize disclosure even further for traditional telecoms and broadcasting sectors is growing and intense, and this is especially so for ‘new media’ such as online video distributors and the incumbents IPTV services. I have spoken with CRTC staff many times and filed a dozen requests under the Access to Information Act to obtain more detailed information, but to no avail. Perhaps most troubling, the CRTC routinely and randomly discards data more than eight years old. Susan Crawford (2011), a Professor at the Cardozo Law School in New York, and an expert on media anti-trust issues, sums up the CRTC’s minimalist vision of its role in this regard when she refers to its website as being “truly primitive”. Ultimately, the episodic nature of policy-driven research agendas, the minimalist stance the CRTC takes toward information disclosure, and the fact that media ownership and concentration is a highly politicized issue means that we do not have a systematic body of empirical evidence or a coherent portrait of the media industries. The research that does exist is often short-term and driven by the policy agenda of the day rather than an overarching scholarly effort that aims to create a systematic and coherent portrait of the media industries over the long run. As Philip Savage (2008) sums up the state of affairs, “the media ownership debate largely occurs in a vacuum, lacking evidence to ground arguments or potential policy creation either way” (p. 295). Mike Gasher (2008) concurs, asking rhetorically: “Who is really trying to measure media concentration and its impact in an empirical way? I honestly . . . cannot think of anyone who does that” (p. 295). But more than just a lack of evidence is at stake; a key consideration is how things are framed. The conventional focus on the news media and the affects of ownership and market structure on content, public opinion and ideology strains to draw the proverbial camel through the eye of the needle. Tim Wu’s (2010) The Master Switch, in contrast, focuses on the strong and recurring tendencies toward consolidation in the media and communication industries over the past century, and how such processes are now being manifested in relationship to ISPs, search engines, online music distribution, etc. He also examines the potential for players to leverage their power in one layer of the network media universe (networks, applications and content, devices) to influence what happens in others (also Noam, 2009, pp. 33-39). This is reminiscent of the turn-of-the-20th century ‘double-headed news monopoly’ scenario descibed above, but in new guises. Wu

7
also stresses how market power can be transposed into the technological design of communication media in order to buttress and extend market power from one medium to another. The conventional fixation on ideology and content completely ignores these issues. The extension of market dominance from one medium to another is also problematic because a more concentrated media is a more regulable media. The more regulable media are, the easier it is to require Internet Service Providers (ISPs), search engines (Google), social network sites (Facebook, Twitter) and device manufacturers (RIM, Apple, Hewlett Packard, Sony, etc.), for instance, to serve as intermediaries on others’ behalf, notably in matters of copyright, sexually-oriented content, law enforcement and national security. The responses taken to consolidation within and across layers of the network media will ultimately shape whether the emergent Internet-centric media ecology turns out to be as open as possible and guided by notions that human communication by Internet and any other media is a fundamental human right, as a recent Unesco report affirms (Dutton, et. al., 2011), or used as tools to backstop the interests of the media, entertainment and software industries as well as law, order and national security. Key Trends and Dynamics The Growth of the Network Media Economy, 1984 – 2010 The following section sketches the evolution and growth of the network media economy in Canada between 1984 and 2010, pointing to those sectors that have flourished, others that have stayed relatively stable, and the few cases where they have declined. I then rank order Canada relative to the other large national media markets worldwide. As Figure 1 below shows, the media economy grew immensely from $19.7 billion in 1984 to $56.1 billion in 2000 and to $68.7 billion in 2010 (‘real dollars’). Figure 1: The Growth of the Network Media Economy, 1984-2010
0.00 5,000.00 10,000.00 15,000.00 20,000.00 25,000.00 30,000.00 35,000.00 40,000.00 45,000.00 50,000.00 55,000.00 60,000.00 65,000.00 70,000.00
1984 1988 1992 1996 2000 2004 2006 2008 2009 2010
Wired Tel Wireless Tel Internet Access Cable & Sat TV Radio Newspapers Magazines Internet Adv Music Total

8
The emergence of new media – pay television and wireless cellphone services since the 1980s followed by Internet access and Internet advertising in the latter period – has more than tripled the size of the media economy over the past quarter-of-a-century. Wireless cellphone service alone is now an $18 billion sector, whereas it did not exist in 1984.
Wired line telecom revenues (excluding Internet access) have fallen sharply by a third from 2000 to just under $17 billion last year, although this has been more than offset by gains from wireless and Internet access. Even with those sharp declines, revenues for the ‘connectivity industries’ (wiredline, wireless, Internet access) have risen sharply from $25.9 billion in 1984, to $35.3 billion in 2000 to just under $42 billion last year.
Even bracketing aside for a moment wired and wireless telecoms services because they overshadow everything else on account of their size in order to focus just on the Internet centric and traditional media elements in the mix, a similar pattern emerges. Indeed, these ten sectors grew greatly from $12.1 billion in revenues in 1984, to $23 billion in 2000, to $33.8 billion last year (in real dollars). Table 1: The Growth of the Network Media Economy, 1984-2010 (excluding wired line and wireless telecoms) 1984 1988 1992 1996 2000 2004 2008 2010 Internet Access
312.2 2,195 4,673 6,365 6,800
Cable & Sat.
1380 2040.9 2287.7 3497.3 5,145 5606.9 7,139 8,100
TV 3,580.2 3573.8 3,999.3 4272.4 5,000 5,836.5 6,776 6,848
Radio 1,621.6 1,651.2 1,524.0 1,492.2 1,643 1,762.9 2,053 1,910
Press 4219.4 4803 3857.9 4323.6 5,731 5,600 5,544 4,300
Mags 1368.9 1272.3 1,401 1,362 1,585 2055.1 2,458 2,202 Internet Adv
134 406.1 1,643 2,200
Music 1548 1574.3 1,399 1,410
Total 12170 13,341 13,070 15,260 22,980 27,515 33,377 33,769
It is commonplace to hear that the core traditional media — television, music, newspaper, books — are teetering on the brink of calamity. The slightest whiff of troubles on the horizon, such as ‘cord cutting’, rising Netflix subscriptions, a drop in advertising revenue, or piracy, and the ‘media in crisis’ trope is trotted out time and time again.
Yet, looking at the chart above suggests a different picture. Broadcast television revenues – the poster child of a media sector in distress – did drift downwards from a high of $3.6 billion four years ago to $3.4 billion last year. Pay and specialty cable channel revenues, in contrast, doubled in the past decade to $3.5 billion, surpassing conventional television in 2010 (including the CBC’s annual subsidy).
Combine this with the more significant growth in the means of television distribution — cable, satellite and other ‘online video distributors’ (OVDs) — and the total television universe doubled in size between 1984 and 2000, and grew again to nearly $15 billion

9
last year. In short, television remains at the heart of the digital media universe, rather than serving as exhibit A for an ‘old medium’ imperiled by the new. To be sure, there are newcomers on the scene, notably Netflix and other OVDs, but with less than one percent of the television market, their stakes are limited rather than a mortal threat requiring the CRTC and policy-makers to revamp the existing rules, as many incumbents are eager to have them do.
The ascent of the Internet has contributed greatly to growth in the size and complexity of the media universe. Internet access rose from $239 million in revenue in 1996 to $6.8 billion last year. Internet advertising started from next-to-nothing in 2000 to become worth $2.2 billion last year, as well.
Growth for the network media economy as a whole, nonetheless, has stagnated since the economic downturn caused by the global financial crisis (2007ff). This is typical of a long-term historical tendency for the fortunes of the media economy to hinge on the state of the economy in general, however, as Figure 1 and Table 1 above show with respect to the comparatively milder recession years in the early 1990s when revenues for wired line telecoms and newspapers plummeted. Indeed, total revenues for all media combined in 1992 were down more than 20 percent from four years earlier.
The impact of the current economic downturn has varied. Revenues largely stagnated between 2008 and 2010, but some media have seen revenues rise substantially (wireless, cable, satellite & other video distribution platforms, Internet access, Internet advertising) or decline slightly (radio, magazines, music). When it comes to newspapers and wired telecom services revenues, however, there is no doubt that revenues dropped sharply.
Despite declining circulation and readership since the late-1950s (Goldstein, 2009), the newspaper sector’s revenues grew until reaching — and then roughly staying steady at — an all-time high between 2000 and 2006. They have fallen significantly since (about 20 percent). This is not nearly as severe as trends in Britain, the U.S. and a few other, mostly European countries. In the U.S., for example, circulation and advertising revenue in 2010 were down 10 and 40 percent respectively from all time highs in 2003 (see, for instance, PEJ, 2011; OECD, 2009). The trend in Canada has, however, been harsh enough to tip the bloated Canwest – once one of the largest media conglomerates in the country -- into bankruptcy. It also casts a shadow over prospects for Post Media, the company that took over the Canwest chain of newspapers last year. A standing invitation to its journalists and editorial staff to take early retirement, its convoluted ownership structure designed to meet Canadian cultural policy objectives buried in the income tax code, and shaky ride in the stock market after its initial IPO surve, however, raise questions about its future.
Newspaper Canada says there are ninety-four dailies across the country, with most (66) belonging to four groups: Postmedia (13 dailies), Quebecor (36), Power Corp/Gesca (7) and Transcontinental (19). By my count, however, only about a third of that many are actually publishing daily. Several have cut their schedules to five or six days per week in the last two years. In addition, many small- to mid-size town dailies have cut back further yet to just one or two days per week, albeit refreshed daily (continuously) with ‘content’ from regional content factories within these chains. This is significant because the press is the core of the ‘content factory’ when it comes to news across the media system as a

10
whole. Pound-for-pound, newspapers pack greater journalistic wallop than other media, so there is good reason for concern. The news is not all bleak, however, in light of the rise in advertising revenue (3.7%) and readership in 2010. The trend has been notable with younger readers who are beginning to obtain news online via social network sites such as Facebook, for example (Canadian Media Research Consortium, 2011). Lastly, “pure” newspaper publishers – e.g. Torstar, Transcontinental, etc. — appear to be recovering, and there is a chance that Post Media will make a go of things yet, or that someone else who can will fill its place. The other media where a slight decline can be seen since 2008 include radio, music and magazines. However, these declines are of such a modest magnitude and duration that changing the base of measurement from ‘real dollars’ to ‘current dollars’ – i.e. removing adjustments for inflation – turns things around. A plausible argument exists that inflation in the media and ICT sectors has actually pushed costs downwards, not upwards, and thus it is appropriate to use current dollars rather than just inflation-adjusted real dollars. The rise of the Internet, drawn out instabilities of the global financial crisis, and the rise of a DIY culture of mass self expression (sharing and piracy) have laid ruin to any of the core elements of the media universe. Of course, however, this does not mean that the demands to adjust to these emergent new realities – technological, economic, cultural and political – have not been pressing, even urgent. The growth of the network media economy can also be seen relative to Canada’s place in the world media economy. Table 1 below illustrates that the media economy in Canada is actually the eighth largest in the world. In 1998, accounted for 2.6 percent of the global media economy; it accounted for over three percent in 2010, all of which casts doubt on the notion that Canada’s “small media market” requires ‘big media’ to compete. Table 2: Top 10 Network Media, Entertainment and Internet Markets by Country (US$ Millions), 1998-2010.
1998 2000 2004 2008 2009 2010
(est.) %
Change
US 336885 395,695 395,936 420,397 406,733 411,357 +22%
Japan 94255 100,799 114,330 141,340 156,120 157,985 +68%
Germany 59919 68981 79,877 84,635 84,100 89,905 +50%
China 23,057 27599 32,631 66,310 72024 81,005 +247%
UK 56738 65319 75,637 72,346 70478 72,605 +28%
France 39,984 46031 53,302 63,863 58841 59,587 +49%
Italy 29,626 34,107 34,494 41,528 39890 39,924 +35%
Canada 18,346 21,432 25,842 31,287 30,701 33,789 +70%
S. Korea 17,687 18492 22,760 26,672 27394 28,589 +62%
Spain 19,219 22,132 25,622 28,736 27200 27,479 +43%
Total 695716 797,358 860,431 977,114 973,481 999,665 +44% Sources: PriceWaterhouseCoopers (2010; 2009; 2003), Global Entertainment and Media Outlook, p. 33 for all segments. IDATE (2009). DigiWorld Yearbook.

11
The Two (or Three) Waves of Media Consolidation, 1984 - 2010 It is important to note that trends in the telecom and media industries vary considerably over time. Between 1984 and 1996, the advent of new players led to greater diversity in all sectors, except for newspapers as well as cable and satellite video distribution, where concentration levels climbed significantly. Concentration levels remained very high in wired line telecoms in the 1980s and early 1990s, too, and in wireless, which was being developed by two companies, Bell and Rogers. As had been the case in many countries, telecoms competition moved slowly from the ends of the network into services and then into the network infrastructure. Only in the mid-1990s, did competition begin to take hold, although for just a few years before the trend was reversed and concentration levels once again began to climb. Conventional as well as pay and subscription television channels were already expanding steadily. In terms of ownership, however, it was mostly incumbents and a few newcomers – e.g. Allarcom and Netstar – that cultivated the field, with their reach and share of the market growing in tandem with the number of services available, with minor shuffles along the way. Most transactions in the 1980s and early-1990s involved players within single sectors, with Conrad Black’s take-over of the Southam newspaper chain in 1996 the poster child of the times. In broadcast television, amalgamation amongst local and regional ownership groups in the late-1980s and early-1990s produced the large national companies that came to single-handedly own the leading commercial television networks – e.g. CTV, Global, TVA, CHUM, TQS – by the late-1990s. While weighty in their own right, however, these amalgamations did not have a huge impact on the media as a whole. There were still significant levels of ownership and organizational diversity to be seen. The CBC also remained prominent, but was eclipsed by commercial television during this time, as its share of all resources in the television ‘system’ slipped from just under one-half in 1984 (46 percent) to half that amount by 2000 and roughly 18 percent today. Its audience share is under ten percent. This picture of significant, albeit gradual change shifted dramatically in the late-1990s. Investment poured into mergers and acquisitions, yielding huge media conglomerates with previously unheard of capitalization levels and debts. Figure 2 reveals the spike of acquisitions in the telecoms and media industries between 1996 and 2000 and again, albeit more modestly, from 2003 until 2007. Figure 2: Financial Investment in Mergers and Acquisitions in Media and Telecoms, 1984 – 2010 (Millions$)

12
Sources: Thomson Financial, 2009; FPInformart, 2010; Bloomberg Professional. We can see a clear trend towards mergers and acquisitions beginning in 1994, mounting steadily to unprecedented levels after that until 2000, a fall back after the collapse of the TMT bubble between 2000 and 2003, and a steady climb again until 2007, before falling off sharply in 2008 with the onset of the Global Financial Crisis. These patterns closely parallel trends in the US and globally. The processes of consolidation over this period of time can be seen as occurring in two, possibly three, relatively distinct waves. The results marked a watershed with the circumstances that had prevailed before. Wave 1 – 1994 to 2000: The first wave of consolidation began in 1994 when the largest cable company (Rogers) took-over Maclean-Hunter, a leading magazine publisher that also had interests in broadcasting, cable and a few other areas. The event inaugurated the rise of major media conglomerates in Canada. Two years later, Conrad Black’s Hollinger group took-over Southam, the largest and oldest chain of dailies at the time. However, both transactions were still a far cry from what was to follow a few years later.
.0
10000.0
20000.0
30000.0
40000.0
50000.0
60000.0
70000.0
80000.0
1985
1986
1987
1988
1989
1990
1991
1992
1993
1994
1995
1996
1997
1998
1999
2000
2001
2002
2003
2004
2005
2006
2007
2008
2009
2010
Telecom M&A Media M&A

13
In 2000, media transactions alone were worth $7.1 billion, more than eight times greater than five years earlier; telecoms and Internet acquisitions were more than ten times what they had been just a few years earlier. Primed by the easy cash of the Telecom-Media-Technology boom, visions of media convergence, and permissive policies of the then Liberal Government, media and telecom companies went on a buying spree. BCE acquired CTV and the Globe & Mail ($3.4b) (2000), while Quebecor bought the cable company Videotron, the largest French language television network, TVA, as well as the Sun newspaper chain ($7.4b) (1998 – 2001). The results were Quebec’s biggest media conglomerate and the fourth largest in the country. In 1998, Canwest purchased Western International Communication ($800m) to become the second largest broadcast television network, Global, in Canada followed two years later by its acquisition of the Hollinger (Southam) newspaper chain and the National Post ($3.2b) from Conrad Black. There was significant consolidation amongst smaller and larger ISPs, amongst cable companies, and between new wireless rivals and the incumbents as well. As the TMT bubble collapsed in 2000, many of the telecom, media and Internet firms created during the previous few years went bust or were taken over by the incumbents. As an example, Telus acquired Clearnet (the second largest independent competitor in wireless) in 2000 and PsiNet, the largest independent ISP at the time, the following year. This caused a lull of activity, but by 2003-2004 the processes of consolidation regained steam. Rogers took over the only remaining independent wireless provider, Microcell (Fido), in 2004, which had built up a sizeable 10 percent share of the industry. Canwest was already struggling to bring its debt under control and sold several small dailies to two regional chains, Transcontinental and Osprey (2002-2003). Craig Media, with financing from the U.S.-based private equity fund Providence Equity Partners, expanded its modest A-Channel and created a new station, Toronto One (2003). The effort failed, however, and Craig was forced into bankruptcy, Toronto One was sold to Quebecor, and Craig’s fledgling network of A-Channel stations sold to CHUM (2004). The latter, in turn, was the fifth largest broadcaster and owned a handful of television stations that made up the venerable and commercially/culturally innovative CityTV network in a half-dozen major Canadian cities. However, that too was short-lived. The debt-laden CHUM was sold after its founder’s death to Bell Globemedia in 2006 ($1.6b). But even Bell Globemedia was in disarray, and abandoned its convergence strategy by scaling back its stake in CTV and the Globe and Mail (71% to 15%) in late-2006. It also sold its stake in the second French-language commercial network, TQS, the next year. A rebranded CTVglobemedia emerged after the restructuring, with the Thomson family (40%) at the helm, and Ontario Teacher’s Pension Fund (25%), Torstar (20%) and Bell (15%) all holding minority interests. The last step in this tangled web of affairs occurred when the CRTC allowed CTVglobemedia to keep the A-Channel stations as well as the thirty-odd pay and specialty television services that it had acquired from CHUM, but forced it to sell the CityTV stations. Rogers snapped them up ($375m) within the year (CRTC, 2006; CRTC, 2007b). Three other transactions in 2007 marked the marked the high point of the second wave of consolidation. The fifth largest pay and specialty television and radio broadcaster in the

14
country, Astral Media, bought Standard Broadcasting. A small chain of newspapers, Osprey, was sold to Quebecor. Lastly, Canwest and the New York-based investment bank, Goldman Sachs, bought broadcaster and film and television production company Alliance Atlantis for $2.3 billion. Although the fact that Goldman Sachs held two-thirds of the equity in the television services would seem to have put the transaction afoul of Canada’s foreign ownership rules, the regulator blessed the transaction based on the fiction that Canwest maintained control of the voting stock and board of directors. The deal gave Canwest ownership majority stakes in thirteen specialty and pay television channels (e.g. BBC Canada, HGTV, National Geographic, Showcase, etc.) and a successful film and television production venture (CRTC, 2007; Goldstein, 2007; CEP, 2007). During this second wave of consolidation, media acquisitions neared their dot.com highs, with similar questionable outcomes as debt and capitalization levels soared. Wave 3 – 2010? Whether events since 2010 constitute a third wave of consolidation, or just the fall-out from the collapse of Canwest, it is still too early to tell. However, in the past year, Canwest’s newspapers have been sold to Post Media ($1.2 billion), and its TV assets sold to Shaw ($2 billion), already the largest video distribution provider and one of the top ISPs in Canada. Shaw also swapped some of the radio stations it owns, via Corus, in Quebec with Cogeco, a mid-size cable company, in return for others in predominantly English-speaking cities. Bell Canada renewed its convergence gambit by buying-back CTV ($3.2 billion), giving it a second run to make vertical integration work between its telephone, satellite and ISP (i.e. network infrastructure) businesses, on the one hand, and those of the largest media group in the country, on the other, with its CTV and A-channel networks, 31 satellite and cable television channels, 28 local television stations and 33 radio stations. The only real difference between now and ten years ago when it first tried this strategy is that BCE scaled back its stake in the Globe & Mail (15 percent) and that media conglomerates have fallen from fashion in most developed capitalist economies (albeit with the obvious exception of the Comcast/NBC-Universal merger approved in the United States in 2011). The idea that consolidation occurs in waves is important for several reasons. First, it shows that there is a certain periodicity to the run of events rather than a process leading constantly to either greater competition or more consolidation. Second, it shows that there is little that renders the telecom, media and Internet industries immune to consolidation. In fact, powerful forces push them in the opposite direction, notably the fact that, from the mid- to late-1990s, the telecom, media and Internet sectors have been destinations for capital investment at a rate far out of proportion to their weight in the ‘real economy’. In a way, they have been harbingers of the ‘great transformation’ that has taken place during this time in which the important of finance and financial markets in the general scheme of the economy as a whole has increased tremendously. Third, consolidation has given rise to a new kind of entity now at the core of the network media ecology: the media conglomerate. Altogether, four massive media conglomerates and a half-dozen large but more specialized companies that are half their size, constitute the ‘big 10’ media firms in Canada, as outlined in Table 3, below.

15
Table 3: The ‘Big 10’ Media Companies in Canada, 2010 (millions$) (excluding wired line and wireless telecoms)
Ownership Mrkt Share of All Media
(%)
Total $ Cable & Sat Dist
Internet Access
Total TV
Radio Press/ Mags
Bell/ CTV
Diversified 16 5175.2 1676 1,407.80 1801.3 290.1
Shaw Shaw Family 15.2 4957.2 2331.8 916.4 1469 240 Rogers Rogers
Family 11.7 3825.7 1830 842 802 213.1 138.6
QMI Péladeau 9.3 3027.9 982 644.3 345.2 1056.4 CBC Public 4.9 1593.4 1235.1 358.3 Post Media
(Godfrey, et. al.)
4.1 1350.2 1350.2
Cogeco Audet (60%), Rogers (40%)
2.9 938.5 594.9 281.7 61.9
Astral Greenberg 2.7 888.1 550 338.1 Telus Diversified 2.1 679.4 60 619.4 Torstar Atkinson,
Thall Hindmarsh, Campbell, Honderich,
1.5 490.2 490.2
Total 71 32,360 8,100 6,800 6847.6 1,910 6,502
Table 3 shows the sheer size of the leading ‘really big’ four telecom-media-Internet conglomerates and the half-dozen specialized firms in broadcasting and newspaers that follow. It gives us a clear picture of who the key players are, and the media segments in which they operate. It does not, however indicate whether the media have become more or less concentrated over time (Flew, 2007, p. 81). Others also argue that focusing on specific firms and who owns is misleading because media companies are generally now owned by shareholders and controlled by managers. According to Noam (2009), owner-controlled media firms in the U.S. fell from 35 percent to just 20 percent between 1984 and 2005 (p. 6). Demers and Merskins (2000) argue that the managerial revolution has signaled the demise of the media mogul. They argue that this is a good thing as well, because media managers do not have ideological axes to grind, although they do have deep pockets and the expertise needed to support better media performance and higher quality journalism than owner-controlled companies. The upshot from of all this is that the media are more competitive and fragmented than ever. Or are they? The fact that all of the ‘big 10’ media firms, except Bell and the CBC, are owner-controlled suggests that Demers and Merskins’ (2000) and Noam’s case does not fit the Canadian context. Such arguments usually suggest that the results are part of a steady process of incremental change, but events in Canada suggest that a sharp, dramatic bout of consolidation occurred in the last half of the 1990s and again in the mid-2000 that produced a sharp rise in concentration without altering the structure of media ownership.

16
The ‘big 10’ media firms’ share of all revenues (excluding telecoms services) between 2000 and 2010 hovered steadily around 71-75% -- a substantial rise from 61% in 1996, and an increase further still from 56% in 1992. In other words, while the telecom-media-Internet ecology has grown much larger and more structurally differentiated over time, the ‘big 10’ players’ share of it has become larger. Measuring Concentration Trends Over Time, 1984 – 2010 Taken individually, each media sector, except magazines, was highly concentrated in 2010 according to the CR method. HHI scores show similar trends, as Figure 3 below reveals: Wired line and wireless telecoms (2,855 and 3041.4, respectively), conventional television (2081), cable and satellite distribution (1984), pay and specialty tv channels (1945) and newspapers (1862). Radio (1151) is moderately concentrated, while Internet Access (968) and the network media as a whole (780) are un-concentrated by HHI standards. Figure 3: HHI Scores for the Network Media Industries, 1984 – 2010
In the next few paragraphs, I begin by separating each of the sectors into two categories: one for the ‘network infrastructure industries’ (wired and wireless telecom services, ISPs, cable, satellite and other OVDs) and another for the ‘content industries’ (newspapers, tv, magazines, radio). At the end, I pool each of these categories together and examine the trends over time using CR and HHI standards.
0
1000
2000
3000
4000
5000
6000
1984 1988 1992 1996 2000 2004 2006 2008 2010 Wireless Wired Telecom Cable & Sat. Dist. All TV Pay & Spec. TV Conv. TV Radio Newspapers Magazines Internet Access Total Network Media
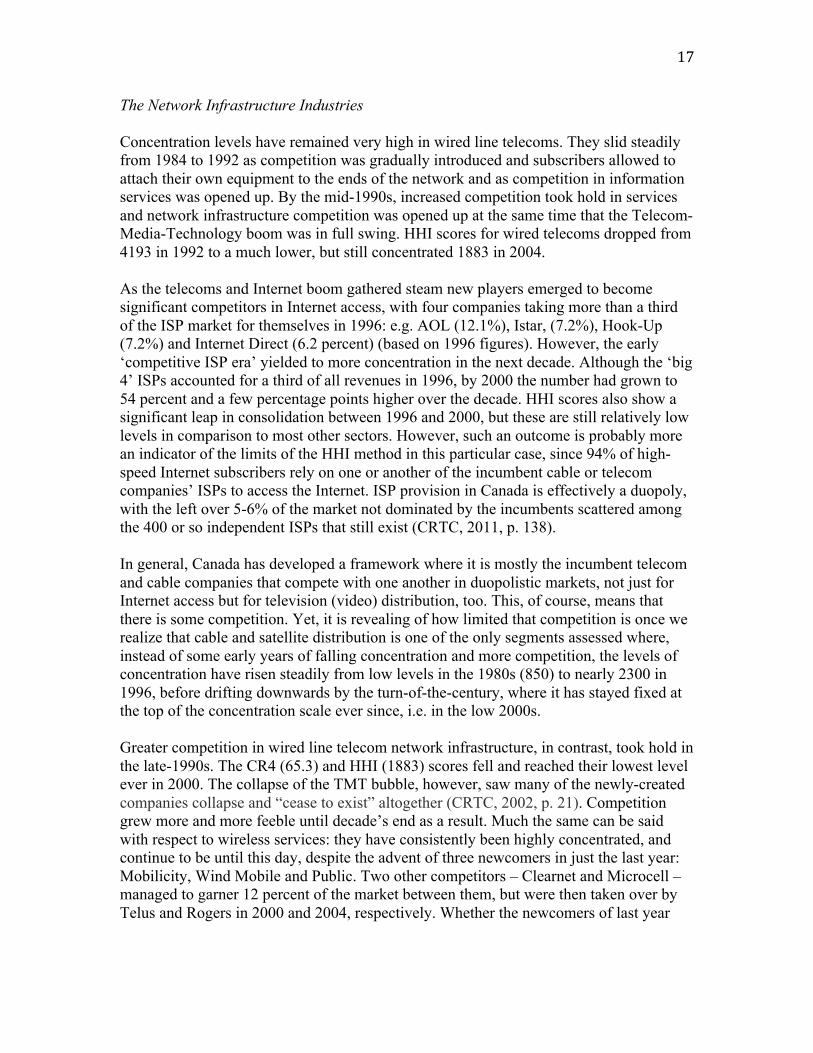
17
The Network Infrastructure Industries Concentration levels have remained very high in wired line telecoms. They slid steadily from 1984 to 1992 as competition was gradually introduced and subscribers allowed to attach their own equipment to the ends of the network and as competition in information services was opened up. By the mid-1990s, increased competition took hold in services and network infrastructure competition was opened up at the same time that the Telecom-Media-Technology boom was in full swing. HHI scores for wired telecoms dropped from 4193 in 1992 to a much lower, but still concentrated 1883 in 2004. As the telecoms and Internet boom gathered steam new players emerged to become significant competitors in Internet access, with four companies taking more than a third of the ISP market for themselves in 1996: e.g. AOL (12.1%), Istar, (7.2%), Hook-Up (7.2%) and Internet Direct (6.2 percent) (based on 1996 figures). However, the early ‘competitive ISP era’ yielded to more concentration in the next decade. Although the ‘big 4’ ISPs accounted for a third of all revenues in 1996, by 2000 the number had grown to 54 percent and a few percentage points higher over the decade. HHI scores also show a significant leap in consolidation between 1996 and 2000, but these are still relatively low levels in comparison to most other sectors. However, such an outcome is probably more an indicator of the limits of the HHI method in this particular case, since 94% of high-speed Internet subscribers rely on one or another of the incumbent cable or telecom companies’ ISPs to access the Internet. ISP provision in Canada is effectively a duopoly, with the left over 5-6% of the market not dominated by the incumbents scattered among the 400 or so independent ISPs that still exist (CRTC, 2011, p. 138). In general, Canada has developed a framework where it is mostly the incumbent telecom and cable companies that compete with one another in duopolistic markets, not just for Internet access but for television (video) distribution, too. This, of course, means that there is some competition. Yet, it is revealing of how limited that competition is once we realize that cable and satellite distribution is one of the only segments assessed where, instead of some early years of falling concentration and more competition, the levels of concentration have risen steadily from low levels in the 1980s (850) to nearly 2300 in 1996, before drifting downwards by the turn-of-the-century, where it has stayed fixed at the top of the concentration scale ever since, i.e. in the low 2000s. Greater competition in wired line telecom network infrastructure, in contrast, took hold in the late-1990s. The CR4 (65.3) and HHI (1883) scores fell and reached their lowest level ever in 2000. The collapse of the TMT bubble, however, saw many of the newly-created companies collapse and “cease to exist” altogether (CRTC, 2002, p. 21). Competition grew more and more feeble until decade’s end as a result. Much the same can be said with respect to wireless services: they have consistently been highly concentrated, and continue to be until this day, despite the advent of three newcomers in just the last year: Mobilicity, Wind Mobile and Public. Two other competitors – Clearnet and Microcell – managed to garner 12 percent of the market between them, but were then taken over by Telus and Rogers in 2000 and 2004, respectively. Whether the newcomers of last year

18
will fare any better it is still too early to tell, but with only .6 of the market as of 2010 they are a long way from the high tide of competition set a decade ago. Table 4: CR and HHI Scores for the Network Infrastructure Industries, 1984 - 2010
CR 1984 1988 1992 1996 2000 2004 2006 2008 2010 Wireless 100 97.3 100 99.7 99.8 96.4
Wired 96.7 95.6 96.2 89.3 83.8 86.3 85.7 81.9 79.5
Cable & Sat. Dist.
35.3 54.1 69.1 78.9 80.9 85.6 84.3 85 84.2
Internet Access
33.6 54.2 53.8 54.7 54.6 56.1
HHI
Wireless 5591.7 5050 5238.7 2675.6 3379.9 3222.4 3246.6 3041.3
Wired Telecom
5,034 4,431 4193.1 3,333 2,617 1,883 2,861 2,725 2,855
Cable & Sat. Dist.
848.4 1189.3 1780.6 2288.2 2008.7 2130 2008.6 2051.4 1984.1
Internet Access
591.9 974.5 1239.4 955.5 926 967.7
The Content Industries Until the mid-1990s, all aspects of the television industry were moderately concentrated by HHI standards and significantly so by CR measures, with the top 4 firms, including the CBC, accounting for between fifty to sixty-odd percent of revenues. Competition and diversity made some modest inroads from 1998 to 2004, but the trend abruptly reversed course and levels have climbed steadily since. Shaw’s take over of Canwest’s television assets and Bell’s buy-back of CTV pushed the levels to new extremes by 2010. The four largest commercial television companies – CTV, Global, TVA and CityTV – as well as more than 100 of the most important cable and satellite channels available are owned by Bell, Shaw, Rogers and Astral. Together, these four players control more than two thirds of all television revenue (excluding distribution). The CBC accounts for eighteen percent and QMI five percent of television revenues, meaning that the top six television groups account for just over ninety percent of the entire television industry, with each of its sub-components (conventional television, pay and specialty channels) each also having high levels of concentration. Like the cable industries, there has never been a moment when diversity and competition flourished in the newspaper sector. Consolidation rose steadily from 1984, when the top four players accounted for two-thirds of all revenues, to 1996, when they accounted for nearly three three-quarters – a level that has stayed fairly steady since, despite periodic shuffling amongst the main players at the top. Of all media sectors, magazines are the least concentrated. This has been the case throughout the timeframe covered here, and

19
has become more evident over time, with concentration levels falling by one-half on the basis of CR scores and two-thirds for the HHI. Radio is also amongst the most diverse and competitive amongst all of the media sectors on the basis of HHI scores, although the C4 measure suggests that the ‘big four’ in the sector still dominate. The trends are shown in Table 5, below. Table 5: CR and HHI Scores for the Content Industries, 1984 - 2010
CR 1984 1988 1992 1996 2000 2004 2006 2008 2010 Pay & Spec. TV
61.6 61.8 62.8 51 67.6 59.3 71.3 84.5
Conv. TV 67.2 66.7 65.8 67.9 79.9 81 80.1 80.6 81.1
All TV 64.1 61.3 57.5 56.9 64.1 61.2 59.5 71.1 77.5
Radio 49.6 44.8 50 47.9 52.2 55.5 55.5 58.8 56.4
Newspapers 66.1 68.3 70.3 74.3 73.9 73.1 73.1 77.3 77.1
Magazines 38.8 46 40.9 30.4 32.1 24.8 22.5
20 20
HHI Pay & Spec. TV
1140 1306.7 1390.4 857.6 1385.1 1197.3 1588.3 1945.1
Conv. TV 2554.1 2066.9 2001.1 1819.4 1840.8 1939.2 1911.7 1929
2080.7
All TV 2307.5 1799.8 1522.1 1328.8 1243.7 1207.1 1190.9 1519.4
1705.8
Radio 1257.3 935.7 1171.9 1042.6 924.3 961.1 1006.6 1006.6
922.6
Newspapers 1451.3 1487.3 1536.9 2183 1791.1 1643.7 1643.7 1819.3 1861.8
Magazines 490 684 563 335 383 217 160 160 160 The Network Media Industries (excluding wired and wireless telecoms) Adding the network infrastructure industries (except wired and wireless telecoms because their revenues tend to overshadow everything else) and the content industries together allows us to chart concentration levels for the pooled network media as a whole over time. The results provide a particularly good map of long-term trends. Throughout the 1980s and early 1990s, the HHI for the network media fell, but by 1996 trends had reversed and levels were right back to where they were a dozen years earlier. Thereafter, the number rose steadily to 667 in 2000, where it hovered for most of the decade, until rising significantly again to 780 in 2010 (also see Figure 3 above). The CR4 standard shows the trend more starkly, yet, with the big four media conglomerates – i.e. Bell, Shaw, Rogers & QMI – accounting for more than half of all revenues last year, a significant increase in a far larger media universe from the forty percent held by the ‘big four’ media companies in 1984. Over time, some media giants have collapsed (Canwest) and some new players have emerged (Channel Zero, Post Media, Remstar), but the long-term trend has been for a substantial rise in concentration levels across the network media as a whole. Figure 4 illustrates the trends on the basis of CR4 standards.

20
Figure 4: CR Scores for the Network Media Industries, 1984 - 2010
In some ways, this portrait understates media concentration. The national measure used, for example, does not fully capture the extent to which QMI, in particular, dominates the French-language media. The shares of media conglomerates in English-language markets would be much higher as well if this factor was taken into account (see CRTC, 2011, p. 55). A web of alliances between the big players also blunts the sharp edge of competition. Rogers owns forty percent of Cogeco and Bell retains a residual 15 percent stake in the Globe and Mail, while Bell Media, Rogers, QMI, Shaw (Corus), Astral and Cogeco co-own a dozen or so cable and satellite television channels (CRTC, 2011, pp. 77-81). There are also several instances where directors from the big 10 sit on one another’s boards, as is the case with Astral and Torstar, for example, as well as Post Media and Astral. As we have seen, the Internet neither obviates concerns with concentration within the ‘traditional media’ nor is it immune to such tendencies itself. Beyond the network layer represented by ISPs, for instance, we can look at search engines, social media and online news sources. When we do so, the answers are quite clear. Google not only dominates the search engine market, but its dominance is growing. By 2010, it accounted for 81 percent of searches. Microsoft (6.8%), Yahoo! (5%), and Ask.com (4%) trail far behind, yielding a CR4 of 97% and an HHI of 6,713. Social media sites display a similar trend, with Facebook accounting for 63.2% of time spent on such sites in 2010, trailed by Google’s YouTube (20.4%), Microsoft (1.2%),
0
10
20
30
40
50
60
70
80
90
100
1984 1988 1992 1996 2000 2004 2006 2008 2010 Cable & Sat. Dist. All TV Pay & Spec. TV Conv. TV Radio Newspapers Magazines Internet Access Total Network Media

21
Twitter (0.7%), and News Corp.’s MySpace (.6%) (Experien Hitwise Canada, 2010). Again, the CR4 score of 86% and HHI score of 4426 reveal that social networking sites are highly concentrated. Similar patterns exist with respect to the top ten websites in Canada, with the amount of time spent on such sites nearly doubling from 20 to 38 percent between 2003 and 2008, and with most of the top 15 online news sites belonging to established media companies: cbc.ca, Quebecor, CTV, Globe & Mail, Radio Canada, Toronto Star, Post Media, Power Corp. CNN, BBC, Reuters, MSN, Google and Yahoo! account for almost all of the rest (Comscore, 2009; Zamaria & Fletcher, 2008, p. 176). Indeed, similar patterns emerge across the layers of the media ecology, including the interfaces and devices used to access the Internet. The top four web browsers used in Canada – Microsoft’s Explorer (52.8%), Google’s Chrome (17.7%), Firefox (17.1%) and Apple’s Safari (3%) – have a combined market share of just over 90 percent (Comscore, 2011). While there is no data available for Canada with respect to smartphone operating systems, US data shows that the top four players in 2010 accounted for 93 percent of all revenues: Google’s Android OS (29%), Apple’s iOS (27%), RIM (27%) and Microsoft’s Windows 7 (10%) (Nielsen, 2011). Ultimately, the point is that new media domains are no more impervious to the forces of consolidation than media in the past. Four giants may compete ferociously amongst themselves, but four players does not a market make. As Tim Wu (2010) shows, new players at different layers in the network media ecology – e.g. networks, content and applications, devices -- are amassing significant clout and the ability to set the terms of trade for the music industries (Apple), for revenue distribution in the linked economy (Google) (an especially important matter for newspapers, television, film, apps, books and blogs) as well as the conditions for the harvesting and sale of personal information and user-created content (Google, Facebook, Apple). Noam (2009) argues similarly that digitization magnifies the power of economies of scale, and that this is leading to a two-tiered digital media system organized around a few “large integrator firms” which in turn are surrounded by many smaller, specialist firms (pp. 33-39). These are the gateways, or better the sluices, that exist at key junctures and which regulate interactions right across the digital media terrain. This does not mean that it is time for a massive trust-busting initiative on the digital media frontier, but it is essential to know the empirical trends one way or the other, and to at least keep an open mind, if not altogether vigilant. The potential to use dominant market power amassed in one layer of the network media ecology to lock in users, inhibit information flows, or stifle competition in other layers is at the heart of debates over, for example, network neutrality. It is also the crux of vertical integration issues since the time of the telegraph and indeed time immemorial. As Andrew Odlyzko (2009) observes, the issues essentially turn on a centuries’ old “conflict between society’s drives for economic efficiency and for fairness” that has never been adequately resolved:
. . . There is no reason to expect that this conflict will lessen, and instead there are arguments that suggest it will intensify. Should something like net neutrality prevail, the conflict would likely move to another level. That level might become

22
search neutrality . . . or . . . if “cloud computing” does become as significant as its enthusiasts claim, . . . (p. 41).
. . . there might have a push for ‘cloud neutrality’, and so on it goes. And it is more than just the competing values of economic efficiency and social justice that are at stake, but also politics and where we place the values of a free press and democracy in the general scheme of things. Concluding Thoughts Based on the aims of the International Media Concentration Research Project and my reading of Noam’s Media Concentration in America, four key things from this chapter stand out: First, historically and theoretically-informed yet empirically-driven research is badly needed. Second, the trajectory of events in Canada is similar to patterns in the United States. Concentration levels declined in the 1980s, rose sharply in the late-1990s until peaking around 2000, where they stayed relatively stable until rising significantly again between 2007 and 2010. All of this took place amidst a major increase in the size of the total network media economy, meaning that the biggest players obtained a larger slice of a bigger pie. Third, media concentration levels in Canada are roughly double those in the U.S. and high by global standards. Fourth, the decades old vision of convergence, where a small clutch of large media conglomerates straddle both the network and content sides of the media industries, appears to be more prominent in mid-size markets such as Canada, Brazil and Spain versus countries with large media markets, notably the U.S. Germany, Japan, China and the UK. Changes in media ownership during the past two years have mainly been about shuffling the assets from one large but bankrupt company (Canwest) to others. Canwest’s demise magnified concentration levels for newspapers because some of the smaller papers that it had previously sold off were later taken over by some of the largest players (e.g. QMI). The PostMedia Group’s acquisition of Canwest’s newspapers means that there is a new name on the ownership papers, but it does not add to diversity to the field because there has been no net increase in the number of publishers. It does add, however, a new voice to the overall media economy, although in terms of market share, that benefit has been submerged by trends elsewhere, notably in television. Whether Post Media will even survive is an open question, but the standing offer of buy-outs to all of its journalists and editors and wobbly stock market valuation do not auger well. Concentration in conventional as well as pay and specialty cable and satellite channels has also grown significantly since 2008, mostly because Canwest’s television holdings were acquired by a company that was already a big player in the industry: Shaw media. Bell’s take-over of CTV in 2010/11 pushed market share of the four biggest commercial television companies (Bell, Shaw, Rogers and Astral) to 68 percent in 2010, from sixty percent two years earlier. Bell, Shaw, Rogers and QMI (but not Astral) are all vertically-integrated, meaning that they have substantial operations in both distribution networks (telecom, wireless, cable & satellite, Internet) and broadcasting, and in magazines and newspapers in the case of the latter two, respectively. There is no debate in Canada about

23
whether these countries use their control over the medium (networks) to influence the flow of messages through them. They do. Near universal bandwidth caps and throttling hobbles World of Warcraft palyers as much as the ability of competitive online video distributors such as Netflix to survive by limiting bandwidth use for mid-range services to the equivalent of about 10 hours per month of film and television content. Online video services offered by Bell and Shaw, in contrast, are exempt from the bandwidth caps. The only debate in Canada, thus, is whether this should be the case or if there should be a set of principles and/or structures put into place to separate control over the medium from the message, either in the form of network neutrality, common carrier principles, structural separation, etc. One cannot help but have a sense of deju vu that the CRTC now stands in place similar to that occupied by its predecessor, the BRC, a century ago, albeit with far less inclination to act. If media history tells us anything, it is that once the structures of a new medium ecology are cemented into place they stay that way for a long time. Indeed, the structure of the ‘industrial media age’ set down in the late-19th and early-20th centuries has only begun to give way to the network media ecology of the 21st century in the past decade – with no small amount of resistance from entrenched interests all along the line.

24
References Auer, Monica. (2007, September). Is bigger really better? TV and radio ownership policy under review. Policy Options, 78-83. URL: http://www.irpp.org/po/archive/sep07/auer.pdf [Last accessed August 30, 2011] Babe, R. E. (1990). Telecommunications in Canada. Toronto: University of Toronto. Board of Railway Commissioners (BRC). (1910). The Western Associated Press v. The Canadian Pacific Railway Company’s Telegraph and the Great Northwestern Telegraph Company of Canada. In Sessional papers of the Parliament of Canada. Ottawa: J. De Labroquerie Tache, Printers to the King’s Most Excellent Majesty. Canada, Standing Senate Committee on Transport and Communications. Final Report on the Canadian News Media. Ottawa: Government of Canada. URL: http://www.parl.gc.ca/Content/SEN/Committee/391/TRAN/rep/repfinjun06vol1-e.pdf [Last accessed, August 30, 2011] Canada, Standing Senate Committee on Transport and Communications. Interim Report on the Canadian News Media. Ottawa: Government of Canada. URL: http://www.parl.gc.ca/37/3/parlbus/commbus/senate/com-e/tran-e/rep-e/01apr04-e.pdf [Last accessed, August 30, 2011] Canada, the Standing Committee on Canadian Heritage (2003). Our Cultural Sovereignty: The Second Century of Canadian Broadcasting. Ottawa: Government of Canada. URL. http://www.parl.gc.ca/HousePublications/Publication.aspx?DocId=1032284&Mode=1&Parl=37&Ses=2&Language=E Canada, Royal Commission on Corporate Concentration (1978). Report. Ottawa: Minister of Supply and Services Canada. Canada, Royal Commission on Newspapers (1981), Report. Ottawa: Minister of Supply and Services Canada. Canada, Special Senate Committee on the Mass Media (1970). The Uncertain Mirror (2 vols.). Ottawa: Queens Printer. Canadian Media Research Consortium (April 27, 2011). Social networks transforming how Canadians get the news. URL: www.cmrcccrm.ca/en/projects/documents/CRMCSocialnewsApril27.pdf [Last accessed, August 30, 2011] CRTC (2009a). Communications Monitoring Report. Ottawa: CRTC.

25
<www.crtc.gc.ca/eng/publications/reports/policymonitoring/2009/cmr.pdf> CRTC (2008). Diversity of Voices. Broadcasting Public Notice CRTC 2008-4. <www.crtc.gc.ca/eng/archive/2008/pb2008-4.pdf> CRTC (2006). Change in effective control Bell Globemedia Inc. Broadcasting Decision CRTC 2006-309. <<www.crtc.gc.ca/eng/archive/2006/db2006-309.htm> CRTC (2002). Status of Competition in Canadian Telecommunications Markets. Ottawa: Author. <www.crtc.gc.ca/eng/publications/reports/PolicyMonitoring/2002/gic2002.pdf> Communication Energy Paperworkers (CEP) (2007). Canwest MediaWorks Inc on behalf of Alliance Atlantis – Intervention re. Broadcasting notice of Public Hearing CRTC 2007-11. Ottawa: Canada. <www.crtc.gc.ca> Compaine, B. (2005). The Media Monopoly Myth. New York: New Millenium Research Council. Comscore (2010). Canada Digital Year in Review: Canada. URL: http://www.comscore.com/Press_Events/Presentations_Whitepapers/2011/2010_Canada_Digital_Year_in_Review [Last accessed August 30, 2011] Crawford, S. (June 29, 2011). Say you were Canadian. URL http://scrawford.net/blog/?s=say+you+were+canadian [Last accessed August 30, 2011]. D. Demers & D. Merskin (2000). Corporate News Structure and the Managerial Revolution. Journal of Media Economics, 13(2), pp. 103-121. Dornan, C. (2006). ‘Big media bad thing’: how a Senate committee wrote a media report with its head in the sand. Literary Review of Canada, (December). URL: http://findarticles.com/p/articles/mi_7019/is_10_14/ai_n28412445/ [Last accessed, August 30, 2011] Dutton, W. H., Dopatka, A., Hills, M. Law, G. & Nash, V. (2011). Freedom of Connection, Freedom of Expression: The Changing Legal and Regulatory Ecology Shaping the Internet. UNESCO: Paris. http://unesdoc.unesco.org/images/0019/001915/191594e.pdf [Last accessed, August 30, 2011] Edge, M. (2007). Asper Nation: Canada’s Most Dangerous Media Company. Vancouver: New Star Books. Experien Hitwise Canada. (2010). Main data centre: Top 20 Sites & Engines. URL: www.hitwise.com/ca/datacenter/main/dashboard-10557.html [Last accessed, August 30, 2011]

26
Foss, K. (March 2, 2002). CanWest presses Ottawa on media legislation. The Globe and Mail, p. B4. Flew, T. (2007). Understanding Global Media. London: Palgrave MacMillan. IDATE (2009). DigiWorld yearbook 2009. Montpellier, France: IDATE. Internet Advertising Bureau Canada. (2011). 2010 actual & 2011 estimated Canadian online advertising revenue survey. URL: http://www.iabcanada.com/wp-content/uploads/2011/07/IABCda_2010Act2011Bdg_ONLINEAdRevRpt_FINAL_Eng.pdf [September 20, 2010]. Odlyzko, A. (2009). Network neutrality, search neutrality, and the never-ending conflict between efficiency and fairness in markets. Review of Network Economics. 8(1), pp. 40-60. Savage, P. & Gasher, M. (2008). Gaps in Canadian Media Research. Canadian Journal of Communication, 33(2), pp. 291-301 Goldstein, K. (2009). Remarks. Paper Presented at the Ink and Beyond Conference of the Canadian Newspaper Association, Montreal, QC, May 21. Goldstein, K. (2007). Measuring Media: Ownership and Diversity. Revised Report Prepared for Canwest Mediaworks Inc. Submitted to the CRTC’s Diversity of Voices Hearings. Nichols, M. E. (1948). The Story of the Canadian Press. Toronto: Ryerson. Nielsen (March 3, 2011). Who is winning the smartphone battle? http://blog.nielsen.com/nielsenwire/online_mobile/who-is-winning-the-u-s-smartphone-battle/ [Last accessed, August 30, 2011]. Noam, E. (2009). Media Ownership and Concentration in America. New York: Oxford University. OECD. (2010). The evolution of news and the internet. URL: http://www.oecd.org/dataoecd/30/24/45559596.pdf [Last accessed, August 30, 2011]. PriceWaterhouseCoopers (PWC). (2010). Global entertainment and media outlook, 2010-14 (plus previous editions between 2000-2009). New York: PWC. Project for Excellence in Journalism (PEJ). (2010). The state of the news media, 2010. URL: www.stateofthenewsmedia.org/2010/ [Last accessed, August 30, 2011].

27
Skinner, D. & Gasher, M. (2005). So much by so few: media policy and ownership in Canada. In D. Skinner, J. R. Compton & M. Gasher (eds.). Converging Media, Diverging Politics: A Political Economy of News Media in the United States and Canada (pp. 51-76). Boulder, CA: Westview. Soderlund, W. & Hildebrandt, K. (2005). Canadian Newspaper Ownership in the Era of Convergence. Edmonton, AB: University of Alberta. Winter, J. (1997). Democracy’s Oxygen. Montreal: Black Rose. Wu, T. (2009). The Master Switch. Toronto: Random House. Zamaria, Charles, & Fletcher, Fred. (2008). Canada online! Internet, media and emerging technologies: Uses, attitudes, trends and international comparisons, year two report, 2007. Toronto, ON: Canadian Internet Project. URL: http://www.ciponline.ca/en/docs/2008/CIP07_CANADA_ONLINE-REPORT-FINAL%20.pdf [Last accessed, August 30, 2011]. Appendix Annual Reports by company. Bloomberg. (2010). Bloomberg Professional. New York: Bloomberg. Canada, Senate Committee on Transportation and Communication (2003) Interim Report on Canadian News Media. Ottawa, Can: Parliament of Canada. Canadian Broadcasting Corporation Annual Reports Canadian Newspaper Association (CNA). Newspaper Facts. Toronto, ON: CAN 2000 – 2008 (becomes Newspaper Canada) Canadian Newspaper (2003). Ownership of Canadian Newspapers. Toronto, ON: CNA CRTC (2011). Communications Monitoring Report. 2008-2011. CRTC Status of Competition in Canadian Telecommunications Markets 2000-2007. CRTC Broadcasting Policy Monitoring Report 2000-2007. CRTC Broadcast Monitoring Report and Pay and Specialty Statistical and Financial Summaries Canadian Wireless Telecommunications Association’s Mobile Wireless Subscribers in Canada.
28
Financial Post’s Survey of Industrials FPInfomart’s Historical Profiles (for each publicly-traded company). Friends of Canadian Broadcasting (2004). Change in Parliamentary Appropriation. Viewed Dec. 4, 2008 at http://friends.ca/files/PDF/CBCgrant04.pdf Internet Advertising Bureau Canada. (2011). 2010 actual & 2011 estimated Canadian online advertising revenue survey. URL: http://www.iabcanada.com/wp-content/uploads/2011/07/IABCda_2010Act2011Bdg_ONLINEAdRevRpt_FINAL_Eng.pdf [September 20, 2010]. Newspapers Canada Daily Newspapers: Circulation by Ownership Group. PriceWaterhouseCoopers (PWC). (2010). Global entertainment and media outlook, 2010-14 (plus previous editions between 2000-2009). New York: PWC. Statistics Canada. Cansim Tables for the following NAICS-defined sectors: 51111 Newspaper Publishers; 51112 Periodical Publishers; 51221-51223 Record Production, Distribution and Music Publishers; 51511 Radio Broadcasting; 51512 Television Broadcasting; 5152 Pay and Specialty Television; 51711 Wired Telecommunications Carriers; 517112 Cable and Other Program Distribution; 5172 Wireless Carriers (except Satellite); 51913 Internet Publishing and Broadcasting, and Web Search Portals 1 I would like to thank Adam Webb for his generous and pain-staking work assembling the data for 2010. 2 Also see the Senate Committee’s Interim Report, which has much more data than the 2006 final report.