MEDIA LANDSCAPE 2017 - SNAPSHOT - nielsen.com · The Conference Board® Global Consumer...
26
1 Copyright © 2018 The Nielsen Company (US), LLC. Confidential and proprietary. Do not distribute. At Nielsen, data drives everything we do—even art. That’s why we used real data to create this image. Copyright © 2018 The Nielsen Company (US), LLC. Confidential and proprietary. Do not distribute. AN OVERVIEW OF MALAYSIAN CONSUMERS & THEIR MEDIA CONSUMPTION BEHAVIOR MEDIA LANDSCAPE 2017 - SNAPSHOT
Transcript of MEDIA LANDSCAPE 2017 - SNAPSHOT - nielsen.com · The Conference Board® Global Consumer...
1 Copyright © 2018 The Nielsen Company (US), LLC. Confidential and proprietary. Do not distribute. At Nielsen, data drives everything we do—even art. That’s why we used real data to create this image.
Copyright © 2018 The Nielsen Company (US), LLC. Confidential and proprietary. Do not distribute.
AN OVERVIEW OF MALAYSIAN CONSUMERS & THEIR MEDIA CONSUMPTION BEHAVIOR
MEDIA LANDSCAPE
2017 - SNAPSHOT
2 Copyright © 2018 The Nielsen Company (US), LLC. Confidential and proprietary. Do not distribute.
This is an abridged version of the Nielsen 2017
Media Landscape Report. The full report, which is
available for purchase, covers:
Nielsen Consumer Confidence Index
(CCI)
Media Consumption Behaviour and
segmentation
Reach by media type
Newspaper - readership, advertizing
expenditure (ADEX), top titles, top
advertisers
Radio Listenership - profile, ADEX, top
advertisers
Television - reach, share, top channels by
race, free-to-air (FTA) viewership, top
genres, top advertisers
Out of Home
Cinema - frequency of visit, advertizing
opportunities, top advertisers
Total Adspend and top categories,
Digital Media - Internet users, online
activity, content consumption, tech
purchase
E-commerce
If you would like to purchase the full report, please
contact [email protected].
SETTING THE
CONTEXT

3 Copyright © 2018 The Nielsen Company (US), LLC. Confidential and proprietary. Do not distribute.
SNAPSHOT 4
DATA SOURCES 6
MALAYSIAN CONSUMERS 8
MALAYSIA CONSUMER CONFIDENCE
INDEX (CCI) 11
MEDIA CONSUMPTION BEHAVIOR 16
DIGITAL MEDIA CONSUMPTION 19
E-COMMERCE SHOPPER BEHAVIOR 22
CONTENTS
4 Copyright © 2018 The Nielsen Company (US), LLC. Confidential and proprietary. Do not distribute.
MALAYSIAN
CONSUMERS SNAPSHOT
5 Copyright © 2018 The Nielsen Company (US), LLC. Confidential and proprietary. Do not distribute.
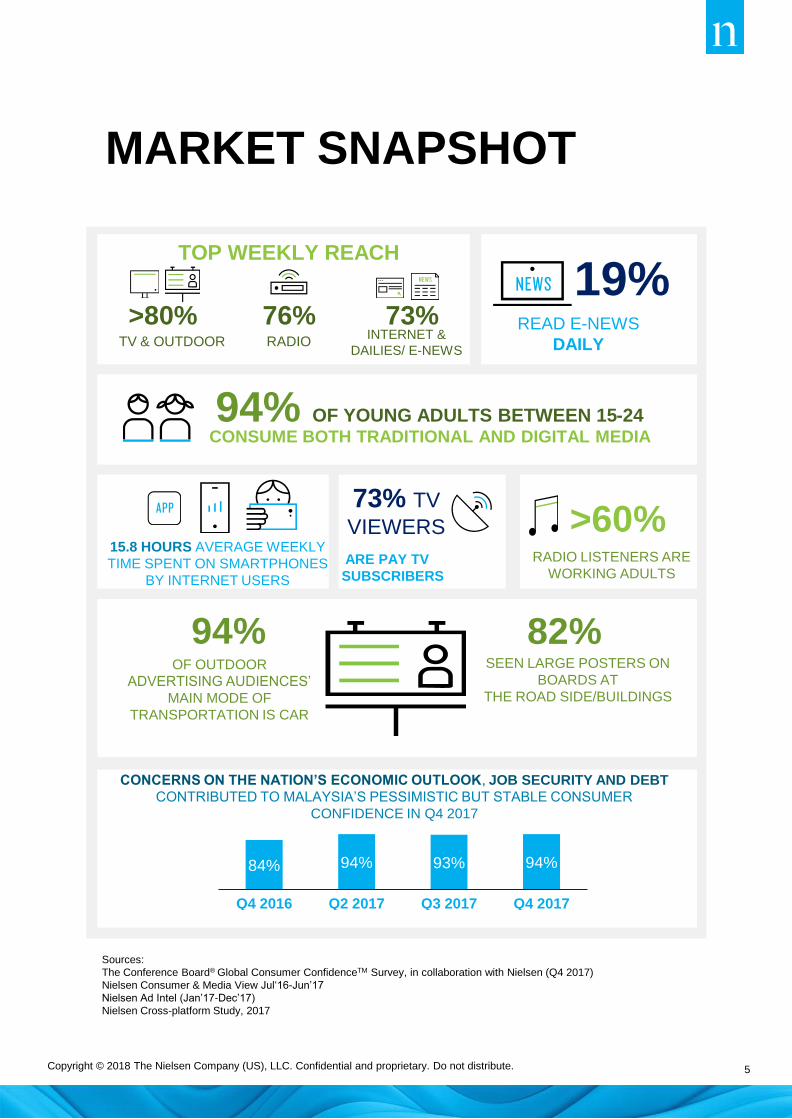
19% READ E-NEWS
DAILY
84% 94% 93% 94%
Q4 2016 Q2 2017 Q3 2017 Q4 2017
CONCERNS ON THE NATION’S ECONOMIC OUTLOOK, JOB SECURITY AND DEBT
CONTRIBUTED TO MALAYSIA’S PESSIMISTIC BUT STABLE CONSUMER
CONFIDENCE IN Q4 2017
94% OF YOUNG ADULTS BETWEEN 15-24 CONSUME BOTH TRADITIONAL AND DIGITAL MEDIA
>60% RADIO LISTENERS ARE
WORKING ADULTS
73% TV
VIEWERS
ARE PAY TV
SUBSCRIBERS
94% OF OUTDOOR
ADVERTISING AUDIENCES’
MAIN MODE OF
TRANSPORTATION IS CAR
82% SEEN LARGE POSTERS ON
BOARDS AT
THE ROAD SIDE/BUILDINGS
15.8 HOURS AVERAGE WEEKLY
TIME SPENT ON SMARTPHONES
BY INTERNET USERS
TOP WEEKLY REACH
>80% TV & OUTDOOR
76% RADIO
73% INTERNET &
DAILIES/ E-NEWS
MARKET SNAPSHOT
Sources:
The Conference Board® Global Consumer ConfidenceTM Survey, in collaboration with Nielsen (Q4 2017)
Nielsen Consumer & Media View Jul‘16-Jun’17
Nielsen Ad Intel (Jan’17-Dec’17)
Nielsen Cross-platform Study, 2017
6 Copyright © 2018 The Nielsen Company (US), LLC. Confidential and proprietary. Do not distribute.
DATA SOURCES
7 Copyright © 2018 The Nielsen Company (US), LLC. Confidential and proprietary. Do not distribute.
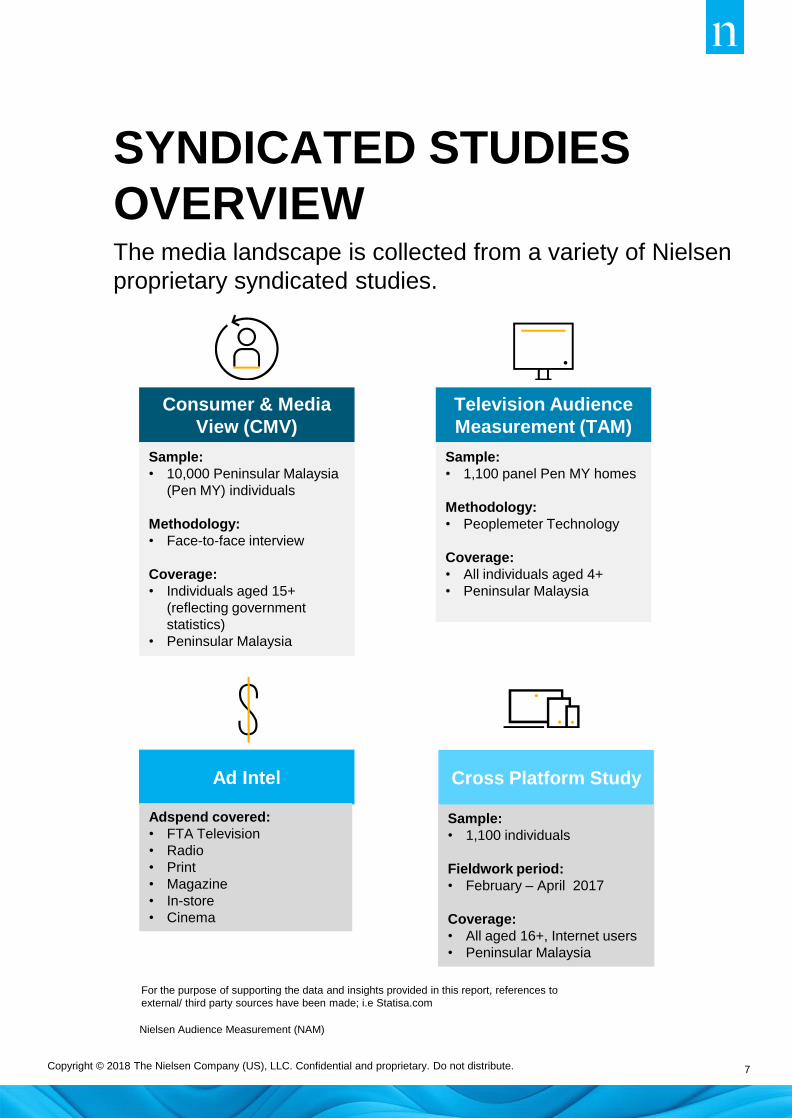
Nielsen Audience Measurement (NAM)
Consumer & Media
View (CMV)
Sample:
• 10,000 Peninsular Malaysia
(Pen MY) individuals
Methodology:
• Face-to-face interview
Coverage:
• Individuals aged 15+
(reflecting government
statistics)
• Peninsular Malaysia
Television Audience
Measurement (TAM)
Sample:
• 1,100 panel Pen MY homes
Methodology:
• Peoplemeter Technology
Coverage:
• All individuals aged 4+
• Peninsular Malaysia
Ad Intel
Adspend covered:
• FTA Television
• Radio
• Magazine
• In-store
• Cinema
Cross Platform Study
Sample:
• 1,100 individuals
Fieldwork period:
• February – April 2017
Coverage:
• All aged 16+, Internet users
• Peninsular Malaysia
For the purpose of supporting the data and insights provided in this report, references to
external/ third party sources have been made; i.e Statisa.com
SYNDICATED STUDIES
OVERVIEW The media landscape is collected from a variety of Nielsen
proprietary syndicated studies.
8 Copyright © 2018 The Nielsen Company (US), LLC. Confidential and proprietary. Do not distribute.
MALAYSIAN
CONSUMERS
9 Copyright © 2018 The Nielsen Company (US), LLC. Confidential and proprietary. Do not distribute.
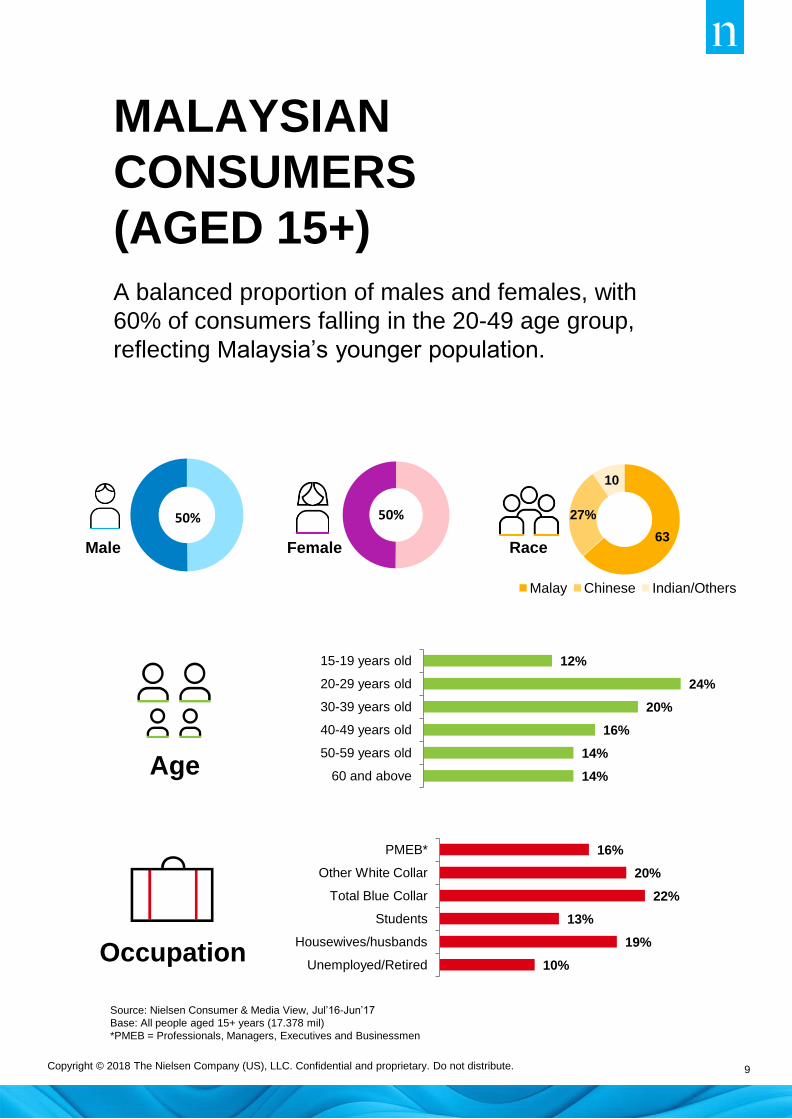
50%
Male
50%
Female Race 63
27%
10
Malay Chinese Indian/Others
12%
24%
20%
16%
14%
14%
15-19 years old
20-29 years old
30-39 years old
40-49 years old
50-59 years old
60 and above Age
16%
20%
22%
13%
19%
10%
PMEB*
Other White Collar
Total Blue Collar
Students
Housewives/husbands
Unemployed/Retired Occupation
A balanced proportion of males and females, with
60% of consumers falling in the 20-49 age group,
reflecting Malaysia’s younger population.
MALAYSIAN
CONSUMERS
(AGED 15+)
Source: Nielsen Consumer & Media View, Jul’16-Jun’17
Base: All people aged 15+ years (17.378 mil)
*PMEB = Professionals, Managers, Executives and Businessmen
10 Copyright © 2018 The Nielsen Company (US), LLC. Confidential and proprietary. Do not distribute.
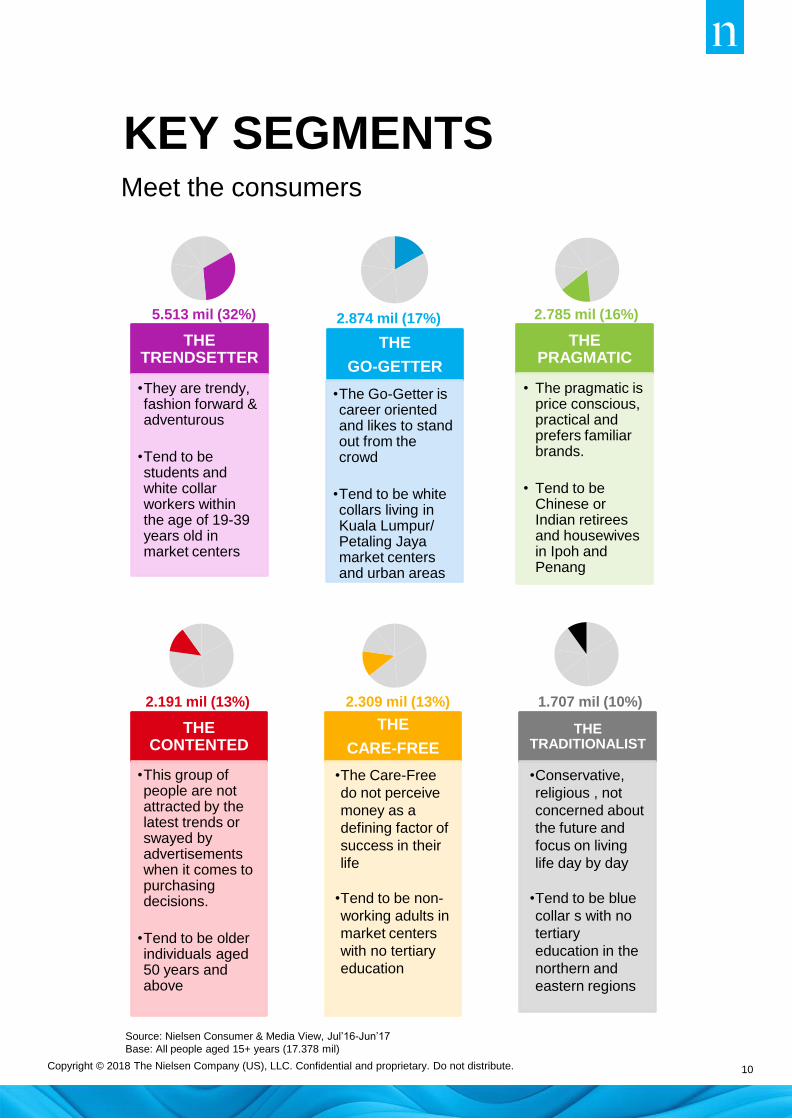
Meet the consumers
KEY SEGMENTS
Source: Nielsen Consumer & Media View, Jul’16-Jun’17
Base: All people aged 15+ years (17.378 mil)
THE TRENDSETTER
•They are trendy, fashion forward & adventurous
•Tend to be students and white collar workers within the age of 19-39 years old in market centers
5.513 mil (32%)
THE
GO-GETTER
•The Go-Getter is career oriented and likes to stand out from the crowd
•Tend to be white collars living in Kuala Lumpur/ Petaling Jaya market centers and urban areas
2.874 mil (17%)
THE PRAGMATIC
• The pragmatic is price conscious, practical and prefers familiar brands.
• Tend to be Chinese or Indian retirees and housewives in Ipoh and Penang
2.785 mil (16%)
THE CONTENTED
•This group of people are not attracted by the latest trends or swayed by advertisements when it comes to purchasing decisions.
•Tend to be older individuals aged 50 years and above
2.191 mil (13%)
THE
CARE-FREE
•The Care-Free
do not perceive
money as a
defining factor of
success in their
life
•Tend to be non-
working adults in
market centers
with no tertiary
education
2.309 mil (13%)
THE TRADITIONALIST
•Conservative,
religious , not
concerned about
the future and
focus on living
life day by day
•Tend to be blue
collar s with no
tertiary
education in the
northern and
eastern regions
1.707 mil (10%)
11 Copyright © 2018 The Nielsen Company (US), LLC. Confidential and proprietary. Do not distribute.
MALAYSIAN
CONSUMER
CONFIDENCE
12 Copyright © 2018 The Nielsen Company (US), LLC. Confidential and proprietary. Do not distribute.
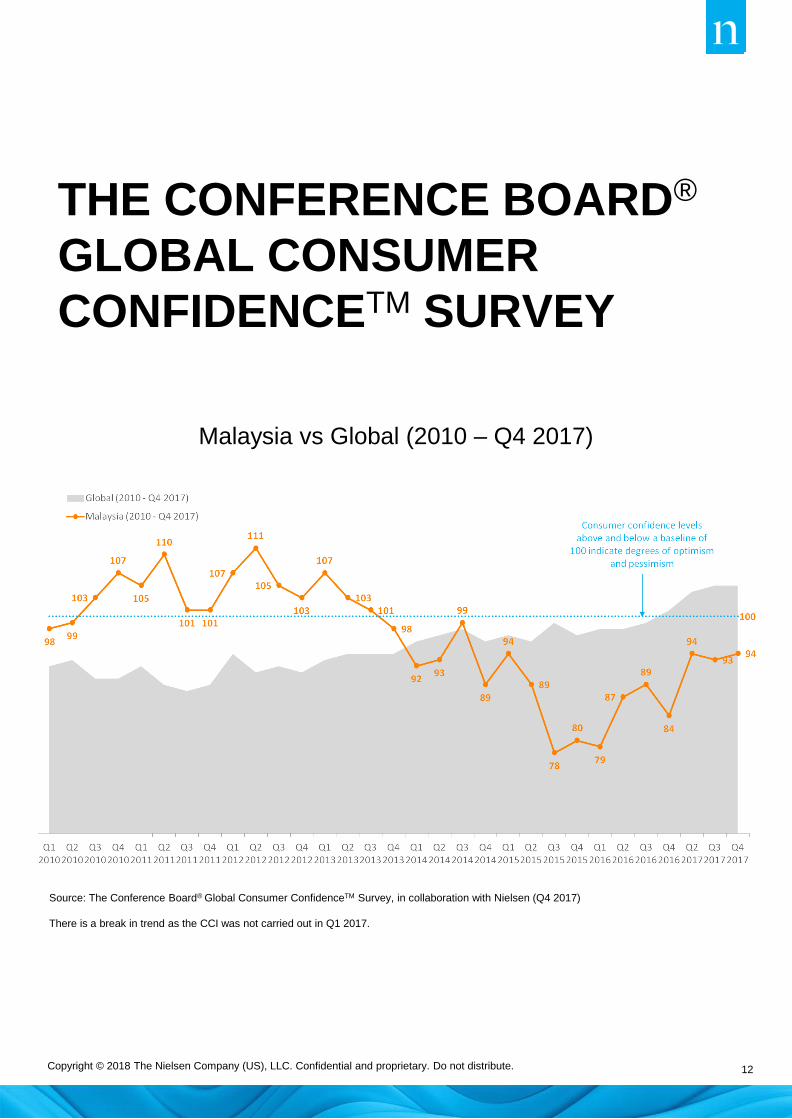
THE CONFERENCE BOARD®
GLOBAL CONSUMER
CONFIDENCETM SURVEY
Malaysia vs Global (2010 – Q4 2017)
Source: The Conference Board® Global Consumer ConfidenceTM Survey, in collaboration with Nielsen (Q4 2017)
There is a break in trend as the CCI was not carried out in Q1 2017.
13 Copyright © 2018 The Nielsen Company (US), LLC. Confidential and proprietary. Do not distribute.
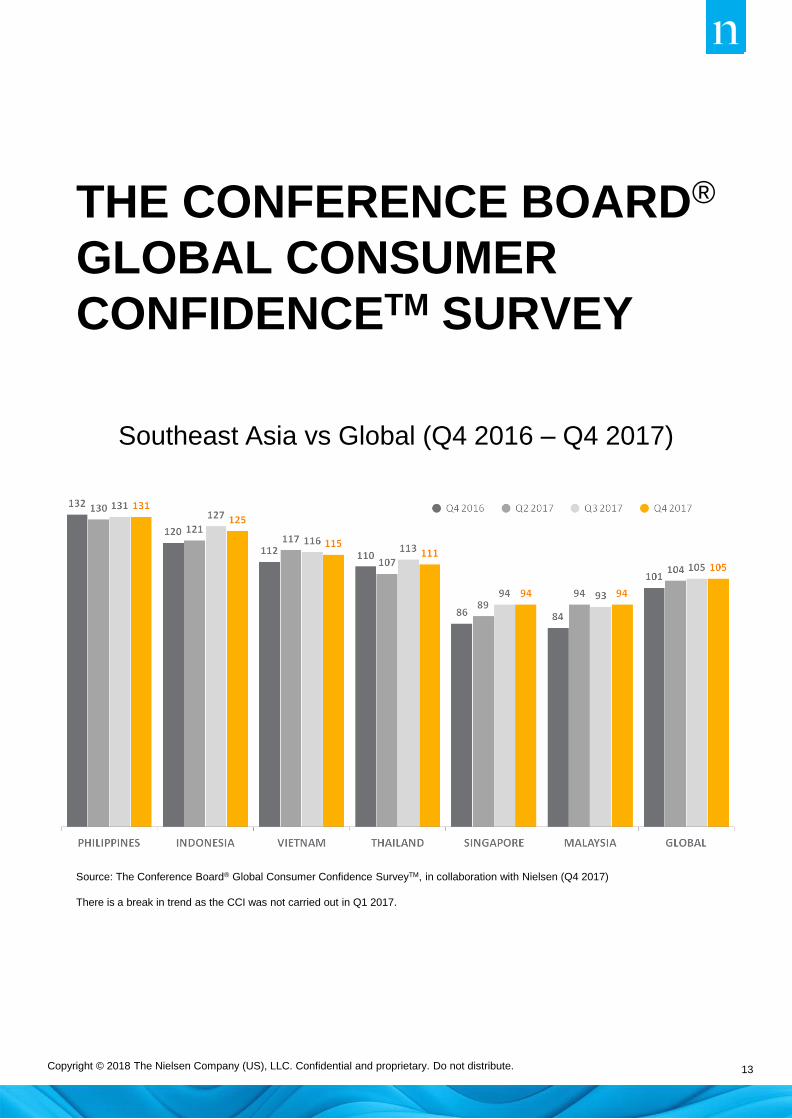
THE CONFERENCE BOARD®
GLOBAL CONSUMER
CONFIDENCETM SURVEY
Southeast Asia vs Global (Q4 2016 – Q4 2017)
Source: The Conference Board® Global Consumer Confidence SurveyTM, in collaboration with Nielsen (Q4 2017)
There is a break in trend as the CCI was not carried out in Q1 2017.
14 Copyright © 2018 The Nielsen Company (US), LLC. Confidential and proprietary. Do not distribute.
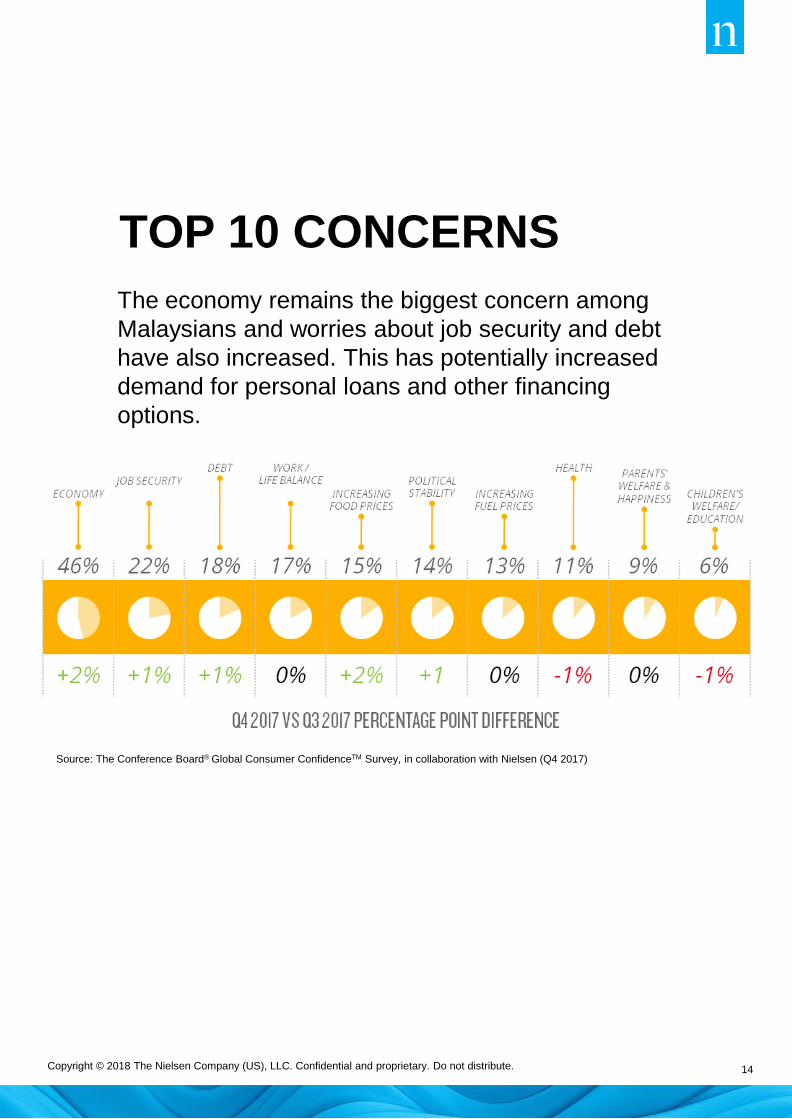
TOP 10 CONCERNS
The economy remains the biggest concern among
Malaysians and worries about job security and debt
have also increased. This has potentially increased
demand for personal loans and other financing
options.
Source: The Conference Board® Global Consumer ConfidenceTM Survey, in collaboration with Nielsen (Q4 2017)

15 Copyright © 2018 The Nielsen Company (US), LLC. Confidential and proprietary. Do not distribute.
SPENDING SPARE CASH
Malaysian consumers are prioritizing saving and
paying off debt, but travel is still a top intention. A
surge in campaigns offering affordable travel
packages and promotions in the past year could
result in spending spare cash on holidays/ vacations,
especially as overall confidence improves.
Source: The Conference Board® Global Consumer ConfidenceTM Survey, in collaboration with Nielsen (Q4 2017)
There is a break in trend as the CCI was not carried out in Q1 2017.
16 Copyright © 2018 The Nielsen Company (US), LLC. Confidential and proprietary. Do not distribute.
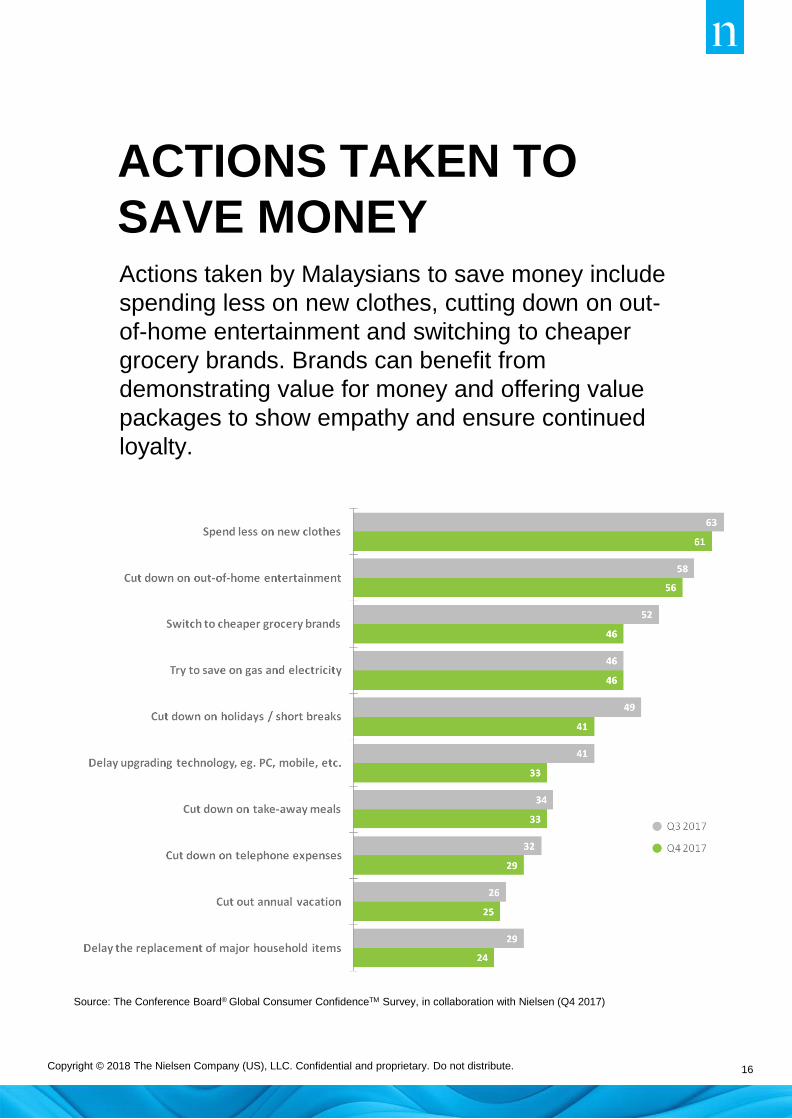
ACTIONS TAKEN TO
SAVE MONEY Actions taken by Malaysians to save money include
spending less on new clothes, cutting down on out-
of-home entertainment and switching to cheaper
grocery brands. Brands can benefit from
demonstrating value for money and offering value
packages to show empathy and ensure continued
loyalty.
Source: The Conference Board® Global Consumer ConfidenceTM Survey, in collaboration with Nielsen (Q4 2017)
17 Copyright © 2018 The Nielsen Company (US), LLC. Confidential and proprietary. Do not distribute.
MEDIA
CONSUMPTION
BEHAVIOUR
18 Copyright © 2018 The Nielsen Company (US), LLC. Confidential and proprietary. Do not distribute.
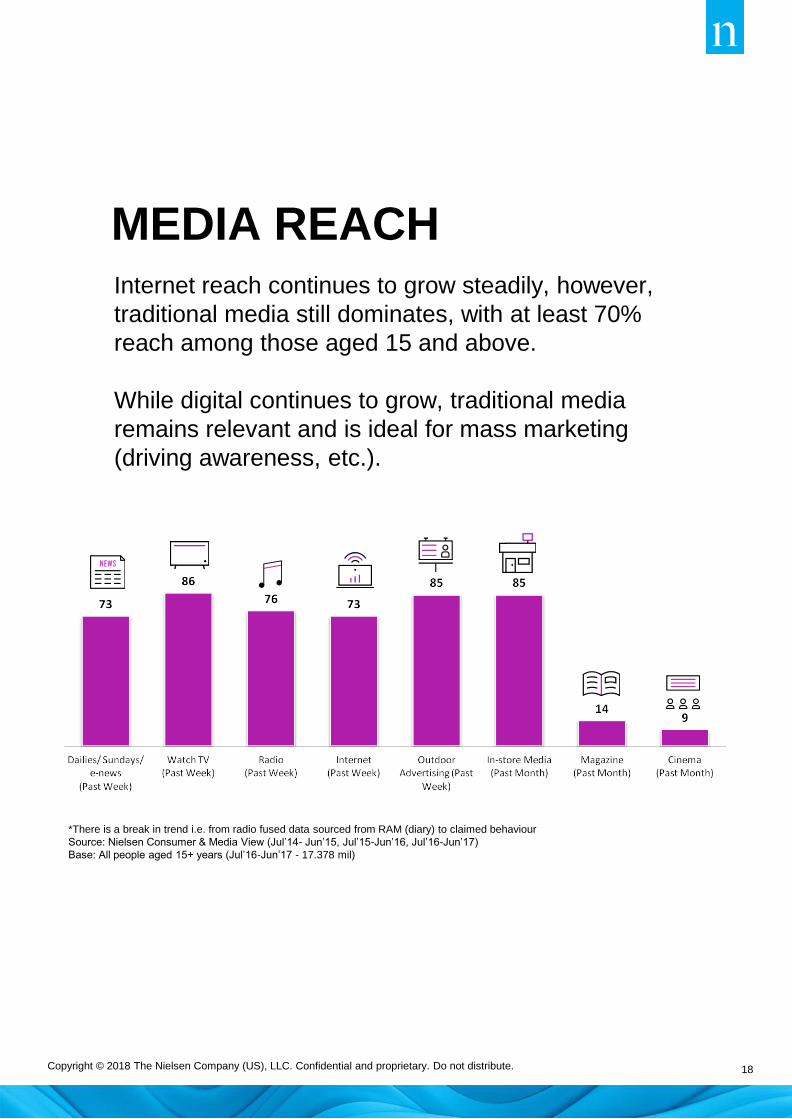
MEDIA REACH Internet reach continues to grow steadily, however,
traditional media still dominates, with at least 70%
reach among those aged 15 and above.
While digital continues to grow, traditional media
remains relevant and is ideal for mass marketing
(driving awareness, etc.).
*There is a break in trend i.e. from radio fused data sourced from RAM (diary) to claimed behaviour
Source: Nielsen Consumer & Media View (Jul’14- Jun’15, Jul’15-Jun’16, Jul’16-Jun’17)
Base: All people aged 15+ years (Jul’16-Jun’17 - 17.378 mil)
19 Copyright © 2018 The Nielsen Company (US), LLC. Confidential and proprietary. Do not distribute.
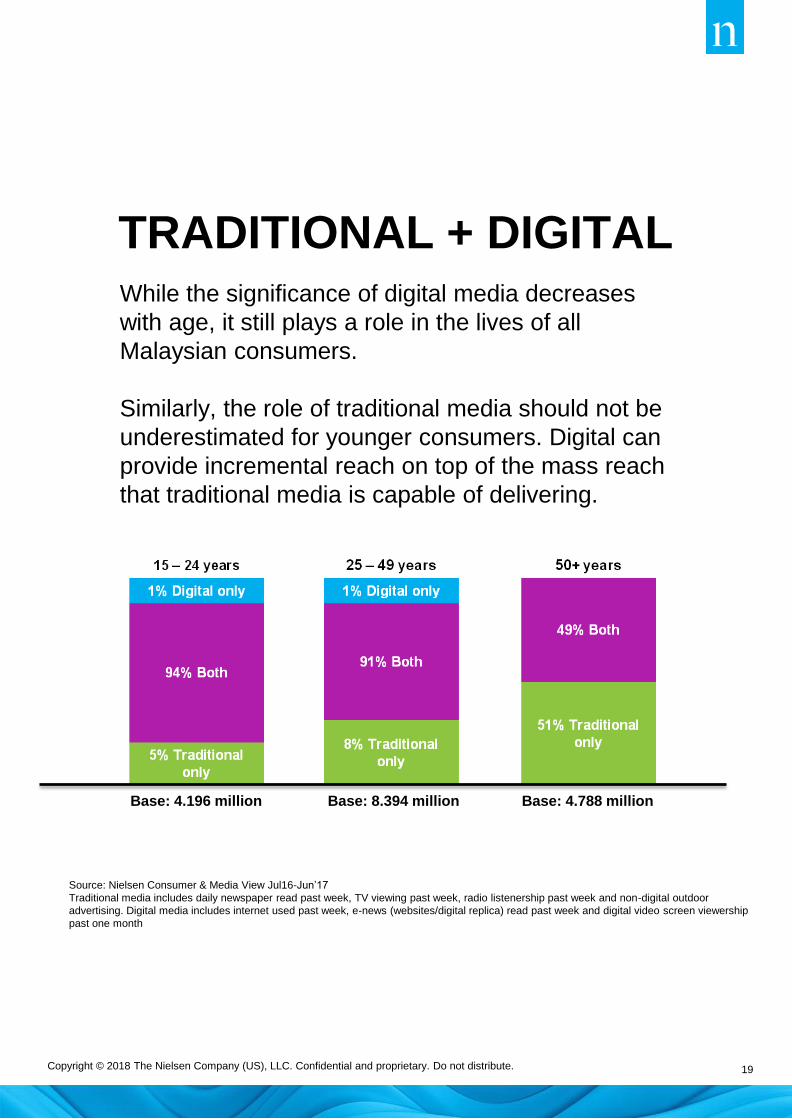
TRADITIONAL + DIGITAL While the significance of digital media decreases
with age, it still plays a role in the lives of all
Malaysian consumers.
Similarly, the role of traditional media should not be
underestimated for younger consumers. Digital can
provide incremental reach on top of the mass reach
that traditional media is capable of delivering.
Base: 4.196 million Base: 8.394 million Base: 4.788 million
Source: Nielsen Consumer & Media View Jul16-Jun’17
Traditional media includes daily newspaper read past week, TV viewing past week, radio listenership past week and non-digital outdoor
advertising. Digital media includes internet used past week, e-news (websites/digital replica) read past week and digital video screen viewership
past one month

20 Copyright © 2018 The Nielsen Company (US), LLC. Confidential and proprietary. Do not distribute.
2017 ADSPEND
OVERVIEW
Source: Nielsen Ad Intel (Jan’17-Dec’17)
Note: Nielsen measures advertising spending based on published rate cards and monitors adspend for FTA TV based on actual
broadcast times and commercial spots. Pay TV, Outdoor and Internet adspend are not reported.
Adspend got off to a good start in January due to the
Chinese New Year (CNY) festival, driving a boost in
spending by advertisers on CNY-related promotional
campaigns.
June recorded the highest adspend in 2017 as advertisers
increased their spending in conjunction with the Hari Raya
festival and mid-year school holidays.
Adspend grew by 19% in August compared to the previous
month of July, due to the launch of the 2017 Southeast
Asian (SEA) Games. This is indicated by the launch of new
ad campaigns related to the regional sports event.
JAN FEB MAR APR MAY JUN JUL AUG SEP OCT NOV DEC
534
RM (‘000,000)
406 562 517 581 625
480 571 540 522 553 532
2017
Chinese New
Year
Hari Raya
2017 SEA
Games

21 Copyright © 2018 The Nielsen Company (US), LLC. Confidential and proprietary. Do not distribute.
DIGITAL MEDIA
CONSUMPTION
22 Copyright © 2018 The Nielsen Company (US), LLC. Confidential and proprietary. Do not distribute.
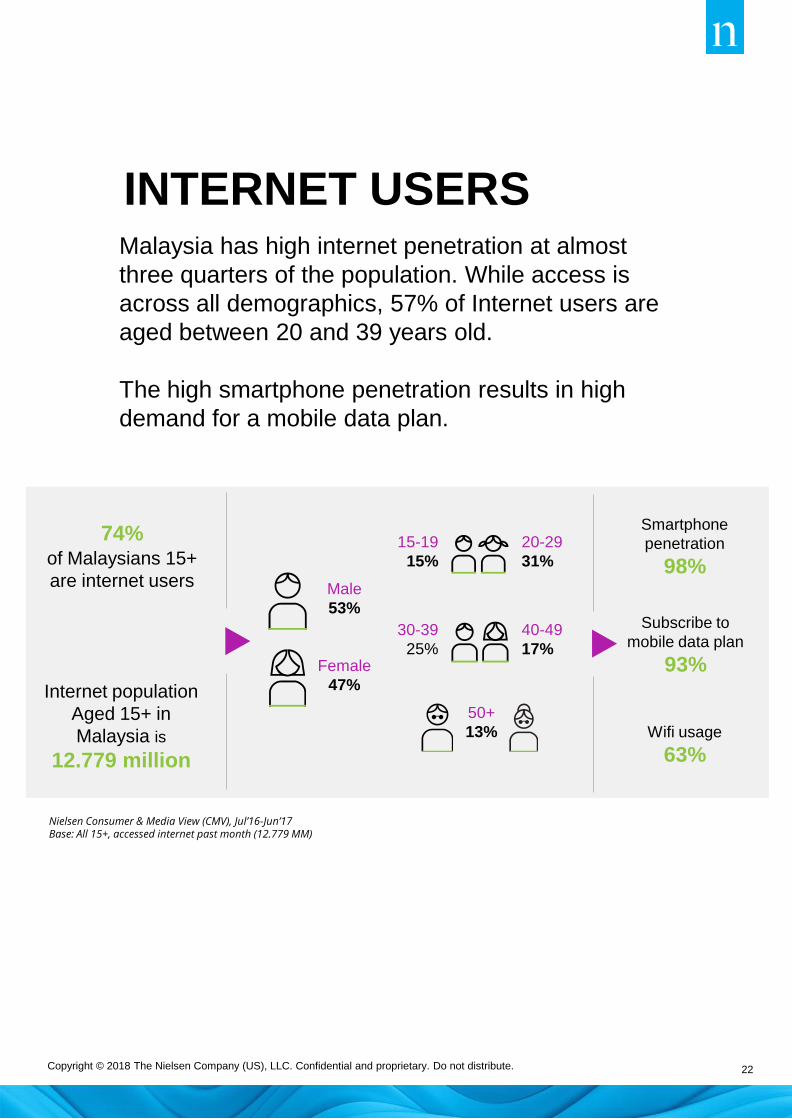
Malaysia has high internet penetration at almost
three quarters of the population. While access is
across all demographics, 57% of Internet users are
aged between 20 and 39 years old.
The high smartphone penetration results in high
demand for a mobile data plan.
INTERNET USERS
Nielsen Consumer & Media View (CMV), Jul’16-Jun’17 Base: All 15+, accessed internet past month (12.779 MM)
74% of Malaysians 15+
are internet users
Internet population
Aged 15+ in
Malaysia is
12.779 million
Male
53%
Female
47%
15-19
15%
20-29
31%
30-39
25%
40-49
17%
50+
13%
Smartphone
penetration
98%
Subscribe to
mobile data plan
93%
Wifi usage
63%
23 Copyright © 2018 The Nielsen Company (US), LLC. Confidential and proprietary. Do not distribute.
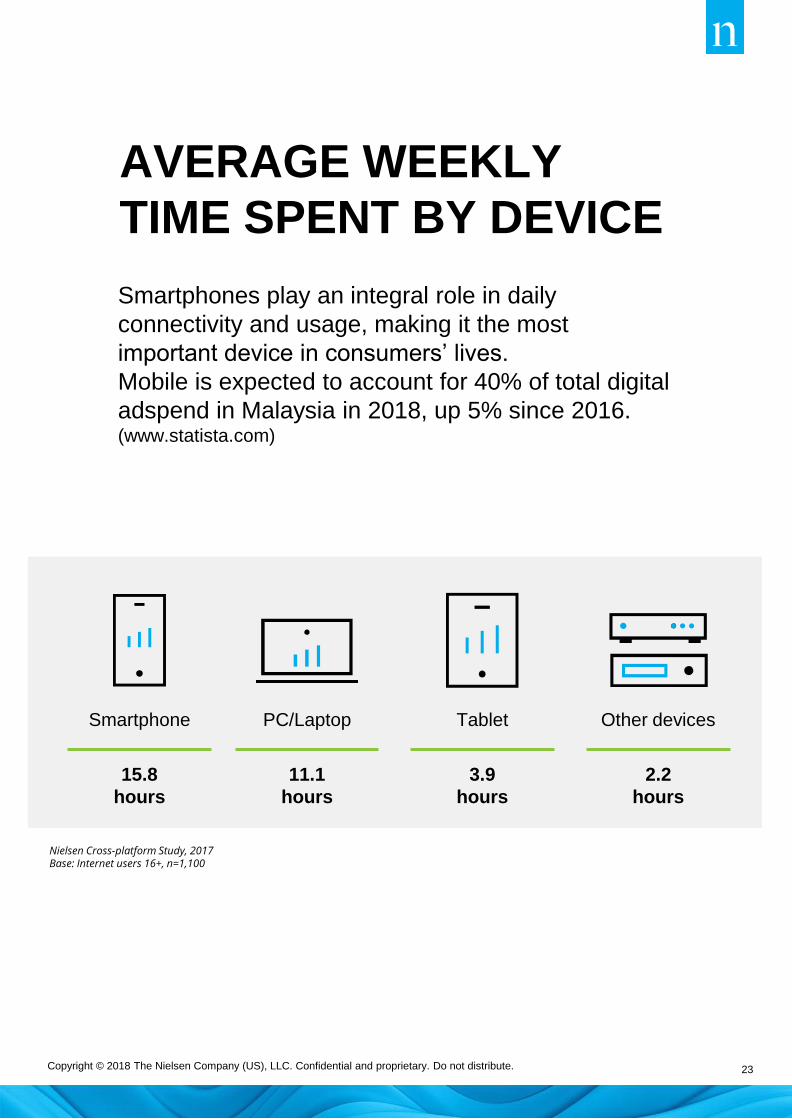
Smartphones play an integral role in daily
connectivity and usage, making it the most
important device in consumers’ lives.
Mobile is expected to account for 40% of total digital
adspend in Malaysia in 2018, up 5% since 2016. (www.statista.com)
AVERAGE WEEKLY
TIME SPENT BY DEVICE
Nielsen Cross-platform Study, 2017 Base: Internet users 16+, n=1,100
Smartphone
15.8
hours
Tablet
3.9
hours
Other devices
2.2
hours
PC/Laptop
11.1
hours

24 Copyright © 2018 The Nielsen Company (US), LLC. Confidential and proprietary. Do not distribute.
E-COMMERCE
SHOPPER BEHAVIOR
25 Copyright © 2018 The Nielsen Company (US), LLC. Confidential and proprietary. Do not distribute.
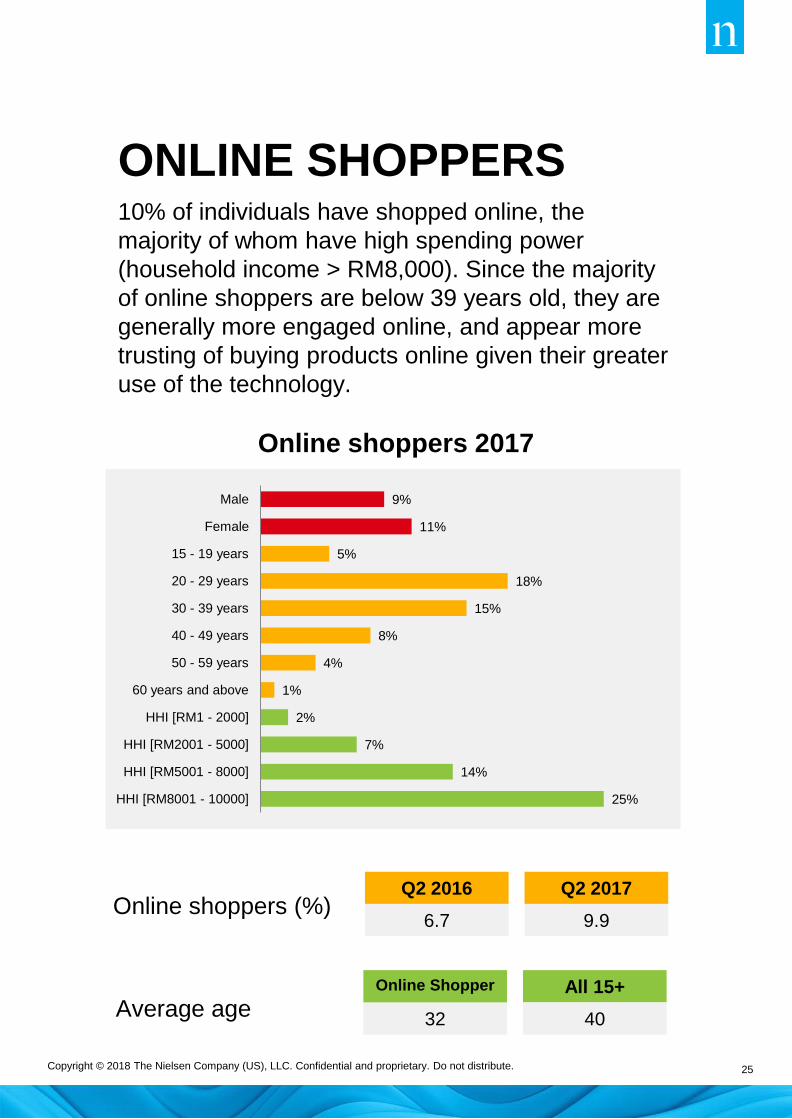
ONLINE SHOPPERS 10% of individuals have shopped online, the
majority of whom have high spending power
(household income > RM8,000). Since the majority
of online shoppers are below 39 years old, they are
generally more engaged online, and appear more
trusting of buying products online given their greater
use of the technology.
25%
14%
7%
2%
1%
4%
8%
15%
18%
5%
11%
9%
HHI [RM8001 - 10000]
HHI [RM5001 - 8000]
HHI [RM2001 - 5000]
HHI [RM1 - 2000]
60 years and above
50 - 59 years
40 - 49 years
30 - 39 years
20 - 29 years
15 - 19 years
Female
Male
Online shoppers 2017
Q2 2017
9.9
Q2 2016
6.7 Online shoppers (%)
32
All 15+ Online Shopper
40 Average age
26 Copyright © 2018 The Nielsen Company (US), LLC. Confidential and proprietary. Do not distribute.
ABOUT NIELSEN
Nielsen Holdings plc (NYSE: NLSN) is a global measurement and data analytics
company that provides the most complete and trusted view available of
consumers and markets worldwide. Our approach marries proprietary Nielsen
data with other data sources to help clients around the world understand
what’s happening now, what’s happening next, and how to best act on this
knowledge. For more than 90 years Nielsen has provided data and analytics
based on scientific rigor and innovation, continually developing new ways to
answer the most important questions facing the media, advertising, retail and
fast-moving consumer goods industries. An S&P 500 company, Nielsen has
operations in over 100 countries, covering more than 90% of the world’s
population. For more information, visit www.nielsen.com.
THE SCIENCE BEHIND WHAT’S NEXT