
Media Coverage of CEOs: Who? What? Where? When? · PDF fileMedia Coverage of CEOs: Who? What?...
59
Media Coverage of CEOs: Who? What? Where? When? Why? James T. Hamilton Sanford Institute of Public Policy Duke University [email protected] Richard Zeckhauser Kennedy School of Government Harvard University [email protected] Draft prepared for March 5-6, 2004 Workshop on the Media and Economic Performance, Stanford Institute for International Studies, Center on Development, Democracy, and the Rule of Law. We thank Stephanie Houghton and Pavel Zhelyazkov for expert research assistance.
Transcript of Media Coverage of CEOs: Who? What? Where? When? · PDF fileMedia Coverage of CEOs: Who? What?...

Media Coverage of CEOs: Who? What? Where? When? Why?
James T. Hamilton Sanford Institute of Public Policy
Duke University [email protected]
Richard Zeckhauser Kennedy School of Government
Harvard University [email protected]
Draft prepared for March 5-6, 2004 Workshop on the Media and Economic Performance, Stanford Institute for International Studies, Center on Development, Democracy, and the Rule of Law. We thank Stephanie Houghton and Pavel Zhelyazkov for expert research assistance.

Media Coverage of CEOs: Who? What? Where? When? Why? Abstract: Media coverage of CEOs varies predictably across time and outlets depending on the audience demands served by reporters, incentives pursued by CEOs, and changes in real economic indicators. Coverage of firms and CEOs in the New York Times is countercyclical, with declines in real GDP generating increases in the average number of articles per firm and CEO. CEO credit claiming follows a cyclical pattern, with the number of press releases mentioning CEOs and profits, earnings, or sales increasing as monthly business indicators increase. CEOs also generate more press releases with soft news stories as the economy and stock market grow. Major papers, because of their focus on entertainment, offer a higher percentage of CEO stories focused on soft news or negative news compared to CEO articles in business and finance outlets. Coverage of CEOs is highly concentrated, with 20% of chief executives generating 80% of coverage. Firms headed by celebrity CEOs do not earn higher average shareholder returns in the short or long run. For some CEOs media coverage equates to on-the-job consumption of fame. Controlling for many factors, we find that CEOs who generate soft news articles in the business and finance press are more likely to be charged later with evading regulations or misusing company resources.
3
I. Introduction CEOs have a love-hate relationship with media coverage. Publicity about its chief
executive can bring a firm investors, customers, and employees. Fame offers a CEO intrinsic
rewards such as recognition and adulation and instrumental returns such as higher compensation.
Yet media coverage can reduce some of the flexibility enjoyed by CEOs as agents of
shareholders. The hidden action and hidden information involved in the principal-agent
relationship give executives some leeway in making decisions. In a world of imperfect
information, CEOs can claim credit for success and try to shift blame for failures. The watchdog
role of the media complicates this balance, for managers must deal with the likelihood that
actions they would prefer to remain private information will come out in public. The media’s
watchdog role is affected by concerns about who will watch, e.g., pay attention to, the watchdog.
The need for journalists and their employers to attract readers and viewers in the media
marketplace means that coverage of CEOs will be shaped by a combination of audience demand
factors and cost considerations that go into gathering stories.
Media coverage of CEOs in the 1990s generated extensive media coverage itself. During
the decade three business leaders – Ted Turner of Turner Communications (and CNN), Andrew
Grove of Intel, and Jeff Bezos of Amazon.com – were each named as Time’s Person of the Year.
Financial journalist Lou Dobbs observed in 2000, “Business leaders are as well known as many
movie stars, musicians and TV stars and that’s a change in the last decade.”i Summarizing the
appeal of business news stories on television, cable anchor Neal Cavuto declared in 1998, “Big
pay packages for executives, big takeover targets, the huge corporate egos involved – these kinds
of stories beat an episode of Dallas any day.” The deluge of corporate scandals in 2001 and
2002, however, caused reporters to reexamine CEOs with a skeptical eye. As a Business Week

4
cover story declared in 2002, “The 1990s gave rise to the celebrity CEO, the larger-than-life hero
who muscles his way to the top of an organization and by sheer force of will remakes it in his
own image. But with that myth shattered by the likes of Kenneth Lay, Dennis Kozlowski,
Bernard Ebbers and other disgraced corporate chieftains, it’s time to reassess the very nature of
leadership.”
The image of CEOs as first saviors and then sinners makes it appear that coverage is
subject to fits and fads. In this article, however, we demonstrate that media coverage of CEOs
readily emerges from the forces of supply and demand in information markets. Our results show
that the amount and tenor of CEO coverage is predictable based on the incentives of journalists
and chief executives. We find that coverage of CEOs over a thirty year period in the New York
Times is countercyclical. Declines in real GDP are associated with an increase in the average
number of stories about firms and CEOs. Larger firms generate more stories in the New York
Times, though as the size of a firm increases the overall percentage of stories that mention the
CEO declines. Across market niches, major papers offer a higher percentage of CEO stories that
contain negative news and a greater percentage of stories that focus on soft news aspects of CEO
personal lives. The emphasis on bad news and CEO life stories in part reflects the entertainment
demands served by major papers relative to the producer information demands served by
business and finance news outlets. With the aftermath of a recession and the spate of corporate
scandals in 2002, major papers actually increased the number of CEO headline stories. The
adage that bad news is no news, however, applied to company press releases. The PR Newswire,
which contains corporate communications, declined in the number of articles mentioning CEOs
from 2000 to 2002. We also find that as monthly business indicators decline, firms issue fewer

5
press releases linking CEOs with profits, earnings, or sales and generate fewer releases
containing soft news stories about the CEOs.
Coverage in major papers is much more concentrated for CEOs than for firms, consistent
with a set of chief executives being chosen as winners and losers to follow. The best predictors
of which firms have CEOs treated as celebrities are not stock price changes or return on assets
(ROA). The most consistent predictor is the number of common shares outstanding, reflecting
the desire of reporters to write about firms with a wide audience of investors. Though some
consumers might choose to focus investments in the firms of celebrity CEOs, we find in the short
and long run that there is not a statistically significant difference in average shareholder returns
between firms with celebrity CEOs and other types of firms. In fact we find that the pursuit of
celebrity may have a cost at some companies. Comparing 30 firms where CEOs were involved in
scandals in 2001-2002 with a matched set of similar companies, we find that the CEOs later
involved in scandals were more likely to generate soft news stories in the time prior to their
indictment or resignation. The percentage of CEO coverage devoted to soft news in the business
and financial press and the information contained in press releases carried on the PR Newswire
in 1999 turns out to be a good predictor of which CEOs were involved in scandals in 2001-2002.
This suggests that some CEO coverage, particularly soft news coverage about life stories of chief
executives, may signal that the chief executive is the type willing to pursue fame at the expense
of shareholder interests.ii
II. Markets for CEO Coverage
CEO stories emerge from a variety of information demands and depend in part on the

6
willingness of firms to make information easily available to reporters. In Figure 1 we set forth
the factors that determine the demand for stories about chief executives, including the types of
data sought by decisionmakers, the niches targeted by news outlets, and the impact on
reader/viewer interest of business cycles and stock market gyrations. We view company public
relations efforts, such as the generation of press releases and the availability of CEOs for
interviews, as supply side factors since they lower the costs of information gathering for
reporters. We note that the public relations actions of firms will depend in part on the
motivations of their CEOs. Whether a firm has good or bad news to impart will also affect the
willingness of a CEO to be associated with a firm’s results, so changes in business output or
stock prices should also affect the supply of public relations efforts by firms.
Figure 1 notes that a basic distinction in reader/viewer interests in CEO stories relates to
the type of information demanded. In his classic work entitled An Economic Theory of
Democracy, Anthony Downs (1957) identified four different types of information demands that
people express. Producers want data that help with their business and production decisions.
Consumers want news about prices and quality to help with purchase decisions. People pursue
some information simply for entertainment and diversion. Voters and citizens need information
to help them make informed choices in politics. News coverage of CEOs can fill each of these
demands. Workers in financial services industries can read about CEOs to gain insight into the
potential operation of firms. Personal investors may consume information about chief executives
in their own pursuit of trading strategies. The compensation and attention devoted to CEOs
provide a subset of CEOs with the lifestyles of the rich and famous, which makes their life
stories and actions entertaining for some readers and viewers. The interplay between

7
corporations and politics, whether in the financing of elections or enforcement of regulations,
makes CEOs part of government stories too.iii
The mix of information demands served by CEO coverage will vary by market niche.
Major papers may provide entertaining stories about CEOs to grab the interest of general readers
or generate substantive profiles in the business section to cater to consumer (e.g., investor)
information demands. Business and finance periodicals may be more likely to focus on producer
or consumer information flows and less likely to emphasize the personal or soft news aspects of
CEO actions. Given the need for general interest publications to entertain and attract readers,
these outlets (including major newspapers) may be more likely to stress bad news about CEOs.
In contrast, business and finance publications may not treat good and bad news differently since
both have implications for investment and production decisions.
Demand for CEO information may also vary across time. Personal investors may express
great interest in following companies as the stock market rises, only to evince less interest as
returns fall.iv Yet coverage could also be countercyclical. Economic downturns may focus more
attention on the performance of CEOs and generate events such as large layoffs where CEOs
play a role in announcements and explanations. Interest in downturns and defeats helps make
bad news more entertaining than good news for many readers.
The supply of information about CEOs depends in part on incentives that chief
executives have to lower the cost of coverage for reporters by granting interviews and issuing
press releases. Publicity about a CEO may enhance firm profits and stock returns by attracting
the attention of investors, capturing the attention of product consumers (as when celebrity CEOs
appear in firm advertisements), or inspiring a particular firm culture by communicating to widely

8
dispersed employees.v In a world of imperfect information, knowledge of a CEO may substitute
for information about product or company quality. A chief executive’s reputation may become
part of a company’s brand image, so that efforts to burnish the CEO yield returns to
shareholders. Media coverage of a CEO may also be a form of compensation. If an executive
treats fame as a good valued in and of itself, then he or she may pursue it independent of whether
it helps the bottom line of a company.vi Fame could reduce compensation costs for a firm, have
positive spillovers for company profits, or involve a tradeoff of company resources for publicity
that yields negative returns to stockholders. In some cases the pursuit of celebrity levels of
coverage may come at the expense of shareholder interests, as a CEO uses company resources
for publicity and devotes less time to firm business. In cases where CEO reputation building
adds little to a firm’s fortunes but builds the external reputation of an executive, publicity can
promote a CEO’s mobility and ultimately leave the company with more training costs to bear
when the executive moves on.
Firm efforts to influence coverage may also vary with the business cycle. As output or
stock prices decline, CEOs may be less willing to be associated with firm outcomes. This means
fewer press releases mentioning CEOs and profits, sales, and earnings in bad times and less
effort to court soft news coverage through press releases when economic indicators are
declining. To be credible company news releases may have to impart some bad news when
outcomes are bad. If so, press releases should increase the use of negative terms as business
indicators drop. The work environment of CEOs has generated an extensive
literature, including research on CEO incentives relating to compensation (Yermack, 1997; Hall
and Liebman, 1998; Core, Holthausen, and Larcker, 1999; Rose and Wolfram, 2000; Ryan and

9
Wiggins, 2001), turnover (Huson, Parrino, and Starks, 2001), board composition (Farrell and
Whidbee, 2000), merger and acquisition activity (Avery, Chevalier, and Schaefer, 1998), and
firm internal organization (Holmstrom, 1999). Research on the effects of media coverage on the
stock market includes work on the impact of discussion of companies on CNBC on firm prices
and trading in the minutes following the reports (Busse and Green, 2002), the effect on stock
price and volatility when a firm makes the cover of Business Week (Urrutia and Vu, 1999), the
performance of recommendations made in popular investment magazines (Brody and Rees,
1996), the relationship between financial press coverage and expected stock returns
(Gadarowski, 2002), the general role of the media in speculative bubbles (Shiller, 2000), the
impact of media reports about earnings on stock price reactions (Dyck and Zingales, 2003), and
the impact of a single article (in the New York Times) on a stock’s price (Huberman and Regev,
2001). Dyck and Zingales (2002a,b) use cross-country differences in the diffusion of the media
to demonstrate that the press have an impact on corporate governance. They find that companies
are more responsive to environmental concerns and the interests of minority shareholders the
greater the newspaper circulation per capita. Our work differs from previous research in that we
focus explicitly on the supply and demand for stories about firm CEOs.vii In the next section we
examine the incentives behind CEO coverage and implications for investors by charting how
coverage varies across time, market outlets, companies, and CEO types.
III. Results
A. Coverage Across Time: 1970-1999
To examine coverage of CEOs across time we chose first to focus on how the top 80

10
firms in the Forbes annual list of 500 largest U.S. companies by sales were covered in the New
York Times (NYT). The NYT was selected in part because its archived editions from previous
decades are easily searchable, unlike other publications which may only be electronically
available for the previous five or ten years. Each spring Forbes releases a list of the top 500 U.S.
companies ranked by sales in the prior year. We focus on the top 80 firms as a way of measuring
how journalists over time have written about the CEOs of America’s leading companies. For
each year from 1970 to 1999 we searched the ProQuest archive of NYT to create a count for each
firm of the number of stories mentioning the company and the number of stories about the firm
that contained the CEO’s name.viii
Figure 2 shows that the average number of stories per firm for the top 80 Forbes
companies varies widely across the years in the New York Times. Coverage peaked in 1970 (235
stories per firm) and in 1999 (232 articles), reached its lowest level in 1978 (116), and followed
a cyclical pattern over the three decades. Figure 3 reveals that coverage of CEOs was not at
historically high levels in the late 1990s, contrary to observations in the popular press.ix The
average number of articles per CEO in the NYT was 12.6 in 1999, compared to 14.7 in 1979 or
15.5 in 1992. The mean number of articles per CEO too appears to follow a cyclical pattern over
the period 1970-1999. Viewed in terms of the percentage of firm stories in the NYT that mention
the top executive, CEO coverage was actually at relatively low levels in the late 1990s. Figure 4
charts the percentage defined by dividing total articles about the CEOs of the 80 firms by the
total articles mentioning these companies. In 1999 5.4% of the company articles in the NYT
referred to one of the CEOs in the sample. The focus on CEOs was much higher in prior years
such as 1975 (8.3%) or 1992 (8.2%).

11
In Table 1 we analyze journalists’ decisions to write about the large U.S. companies in
the Forbes list as a function of audience demand, business conditions, and firm size. We proxy
the size of the national audience with a demand for investor information about firms by the
number of mutual fund accounts. This implicitly treats the NYT as aiming at a national audience,
or assumes that changes in the New York home market for the NYT are correlated with national
changes . We use annual percentage changes in real GDP to capture variations in the economic
environment that reporters can choose to cover. In the specifications that analyze annual
averages for the top 80 Forbes firms we find that the patterns of business news coverage are
fairly predictable. As more people demanded business information for investment purposes, the
average number of stories per firm in the New York Times grew. Coverage also grew when the
economy declined, suggesting that bad news is news for business reporters. A one percentage
point drop in real GDP increased the average number of stories per firm by about 5 articles per
year.x Specification 2 shows that the growth in reader interest presumed to follow the expansion
of mutual fund accounts did not affect the mean number of CEO stories per year. CEO coverage
did increase with economic reversals, with a one percentage point drop in real GDP generating
an increase of .32 articles in mean CEO coverage.
Another way to analyze the NYT coverage is to estimate the attention paid at the firm
level, which generates a potential sample of 2400 observations over the course of 30 years. The
CEOs in the Forbes top 80 over time include some of the best known chief executives. If one
ranks the CEOs by the largest number of Times stories in a given year, the top five are Boeing’s
Thornton Wilson (1972, 163 articles), Chase Manhattan’s David Rockefeller (1974, 144),
General Motors’s Roger Smith (1990, 140), Chrysler’s Lee Iacocca (1979, 131), and Ford

12
Motor’s Philip Caldwell (1979, 124). The other CEO’s from the 1990s who made the top 25 in
articles per year are ATT’s Robert Allen (1993, 1994) and C. Michael Armstrong (1997),
General Motors’ Robert Stempel (1992), Chrysler’s Robert Eaton (1992), IBM’s Lewis Gerstner
(1993), and Time Warner’s Gerald Levin (1992).
Specifications 4-6 in Table 1 analyze at the company level over a 30 year period the
number of firm stories, CEO stories, and the percentage of firm stories mentioning the CEO for
the top 80 Forbes firms. The variable firm sales measures how large a company’s revenues were
in a given year expressed in 1999 dollars. As a firm’s sales grow larger, more stories are written
about the firm in the NYT. CEO coverage among these large companies does not increase with
firm size. On a percentage basis, however, this means that firms with larger sales had a slightly
smaller percentage of firm stories that mentioned the CEO. Bad news in the business cycle also
generated more stories. A one percentage point decline in real GDP translated into 4 more firm
stories and .29 more CEO articles for a company. This may be because declines in sales and
increases in layoffs generate announcements by CEOs and scrutiny of their performance. As
more people demanded business information for investment, proxied here by the number of
mutual fund accounts, the New York Times printed a lower percentage of articles mentioning the
CEO. This suggests that as the market for business news expands among personal investors that
stories in the NYT about the actions of CEOs, which may be of particular interest to business
managers, account for a lower percentage of articles about a firm.
Articles about CEOs vary in the type of information they convey. Some articles may
focus on hard news topics such as profits, others may concentrate on human interest angles in
covering a CEO, and some may emphasize negative outcomes or aspects of a company’s

13
operation. In this paper we use stories that contain the words profit, profits, earnings, or sales as
examples of hard news coverage. We define stories as containing soft news if they contain words
that focus on a CEO’s personal history or attributes: personality, married, divorced, smile, style,
wife, husband, emotional, graduated, graduate, educated, charity, charities, hobby, or hobbies.
We define soft news+ stories as those with these soft news words or with additional words
associated with positive profiles of CEOs: leader, reputation, vision, skills, or high profile.
Negative news is defined as stories which mention the words scandal, investigation, fire, resign,
dismiss, accuse, criticize, criticism, blame, false, misleading, allege, indict, arrest, guilty, fraud,
investigate, or criticism.
To see how these types of stories varied over time, we searched the ProQuest archive of
the New York Times to create yearly counts of articles which had the words chief executive
officer in the text and yearly counts of articles that in addition contained profit, soft news, or
negative terms. Figure 5 shows that this measure of CEO coverage peaked in the early 1980s,
with CEO articles totaling 1495 in 1982 and 1480 in 1984. CEO stories that mentioned profits,
earnings, or sales also peaked in those years. Soft news CEO coverage peaked in 1989, when 537
articles using the phrase chief executive officer also included at least one of the soft news terms.
Negative news CEO stories remained at a fairly steady rate of close to 200 per year in the Times.
Figure 6 tracks changes in the percentage of CEO coverage in the New York Times
accounted for by different types of stories. Stories mentioning profits, earnings or sales are
cyclical but account for approximately 45% of the stories about CEOs. Though negative stories
had a historic spike in 1976 (28%), there has been a general upward trend in the percentage of
CEO stories containing negative terms, which grew from 8% in 1970 to 25% in 1999. This is

14
consistent with an increasing emphasis on entertainment demands, also evident in the
increasingly negative tone of political campaign coverage in the media over time.xi Soft news
stories as a percentage of CEO coverage actually peaked in 1988 (48% of stories) and 1989
(51%).
B. Coverage Across Time: 2000-2003
If the market for CEO coverage operates as we propose in Figure 1, then coverage of
CEOs in daily newspapers and the public relations efforts of CEOs should vary with the business
cycle. Negative economic outcomes, either in terms of output or stock price movements, should
generate negative stories by reporters whose readers find following reversals more entertaining
than advances. CEOs anxious to shift the spotlight in bad times and claim attention in good times
should take more efforts to generate stories through PR as output and stock prices increase. To
test these hypotheses we examine monthly media outcomes for a 48 month period, January 2000
to December 2003. In the Lexis file containing company press releases, PR Newswire, we count
the number of articles with CEO in the headline or lead paragraph that contain profit, soft news,
or negative news terms in the text. For Lexis archives containing the New York Times,
Washington Post, and USA Today, we counted monthly the number of stories with chief
executive officer or CEO in the headline or lead paragraph, and then counted the articles in the
subsets containing profit, soft news, or negative news terms.
Figure 7 shows the CEO story counts from PR Newswire. The quarterly release of
earnings is evident in the jump in releases mentioning profits, sales, or earnings every third
month. Stories on PR Newswire mentioning CEOs and profits are highly correlated (.81) with
those containing soft news terms. Releases with hard news figures are negatively correlated (-

15
.47) with the count of CEO stories in daily papers that contain negative language. This suggests
that
CEOs are less likely to associate themselves with earnings information when the news is likely
to be bad. Figure 8 shows the counts by type of stories for CEO articles in the New York Times,
Washington Post, and USA Today. The results show that at times the coverage of CEOs follows
a quarterly pattern, with higher counts in months when earnings are released. Stories containing
hard news, such as profits and sales, outnumber those with soft news content. Negative news
appears very volatile, with a much wider range than the level of soft news coverage.
Table 2 shows how coverage varies with two monthly indicators of business activity, the
value (in $M) of manufacturers’ shipments as tracked by the U.S. Census Bureau and the level of
the Dow Jones Industrial Index. The count of stories on the PR Newswire mentioning CEOs in
the headline or lead paragraph (see columns 1-3) clearly shows a pattern of credit claiming and
blame shifting. When the economy is expanding, as measured by an increase in the
manufacturers’ value of shipments, the number of PR releases mentioning CEOs and profits,
sales, and earnings increases. This indicates that executives are more likely to associate
themselves with hard news numbers when the news is likely to be positive. CEOs are also more
likely to provide soft news information in their press releases when times are good. The number
of PR Newswire stories with soft news terms increases with both the value of manufacturers’
shipments and the level of the Dow Jones Index. Executives try to court soft news coverage in
times when journalists’ stories will likely carry positive news. Conveying negative information
may be an inevitable part of the CEO’s function at times. A decline in the Dow Jones Index is
associated with an increase in the number of negative CEO stories on the PR Newswire.
16
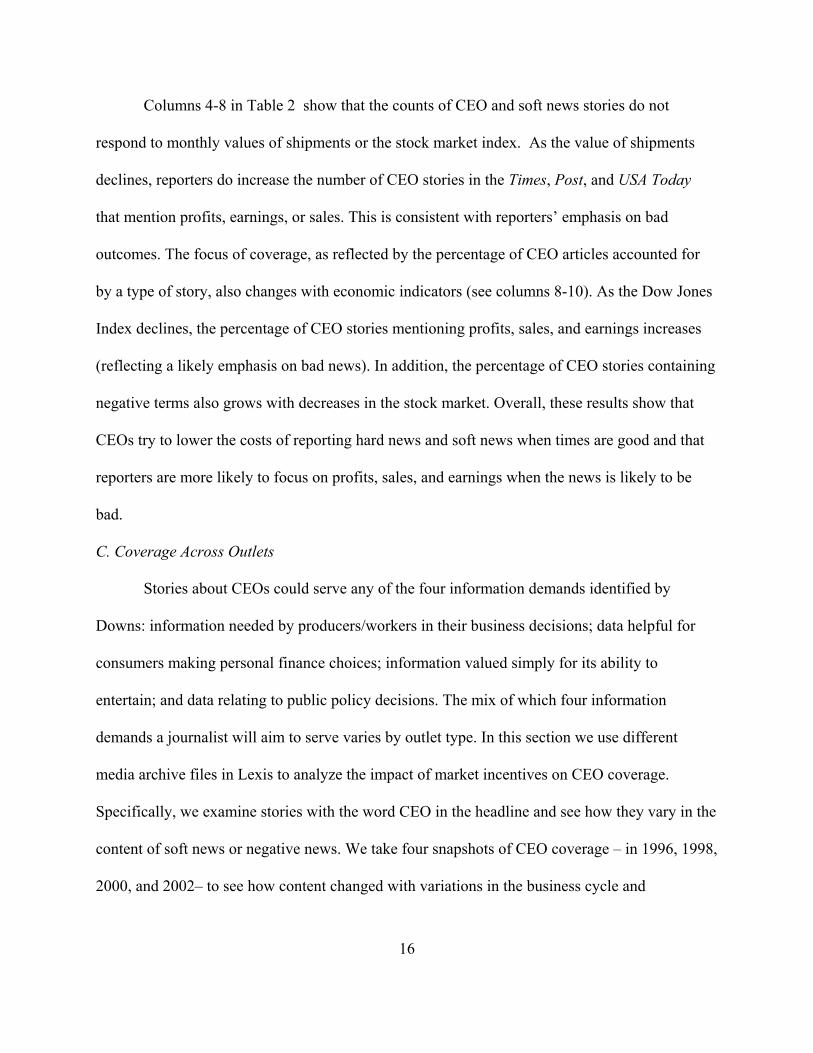
Columns 4-8 in Table 2 show that the counts of CEO and soft news stories do not
respond to monthly values of shipments or the stock market index. As the value of shipments
declines, reporters do increase the number of CEO stories in the Times, Post, and USA Today
that mention profits, earnings, or sales. This is consistent with reporters’ emphasis on bad
outcomes. The focus of coverage, as reflected by the percentage of CEO articles accounted for
by a type of story, also changes with economic indicators (see columns 8-10). As the Dow Jones
Index declines, the percentage of CEO stories mentioning profits, sales, and earnings increases
(reflecting a likely emphasis on bad news). In addition, the percentage of CEO stories containing
negative terms also grows with decreases in the stock market. Overall, these results show that
CEOs try to lower the costs of reporting hard news and soft news when times are good and that
reporters are more likely to focus on profits, sales, and earnings when the news is likely to be
bad.
C. Coverage Across Outlets
Stories about CEOs could serve any of the four information demands identified by
Downs: information needed by producers/workers in their business decisions; data helpful for
consumers making personal finance choices; information valued simply for its ability to
entertain; and data relating to public policy decisions. The mix of which four information
demands a journalist will aim to serve varies by outlet type. In this section we use different
media archive files in Lexis to analyze the impact of market incentives on CEO coverage.
Specifically, we examine stories with the word CEO in the headline and see how they vary in the
content of soft news or negative news. We take four snapshots of CEO coverage – in 1996, 1998,
2000, and 2002– to see how content changed with variations in the business cycle and

17
revelations of corporate scandals.
The major papers file in Lexis contains articles from large circulation papers, primarily
from the United States. Daily papers can serve a portfolio of information demands, since
consumers can choose which sections and story types to read. We expect major papers to serve
entertainment, producer, and consumer demands in their coverage of CEOs.xii Since the papers
in the major paper file change over time, we also examine a subset of three papers in the file that
have national audiences: the New York Times, Washington Post, and USA Today. Focusing on
the same outlets over time allows us to chart changes in the volume of coverage. The Knight
Ridder/Tribune Business News file contains stories from local papers and magazines, which
means that the coverage in part reflects incentives for business page writers in medium- and
small-sized newspaper markets in the U.S. The Lexis Business and Finance news file contains
the text of hundreds of specialized and general interest business publications targeted primarily
at filling producer and consumer information demands. Company press releases carried in the PR
Newswire are part of this file, but we also separately break out stores carried on the PR Newswire
to show what firms are highlighting in their public relations efforts. Finally, we analyze
transcripts from the cable channels CNBC and CNNfn. Their content may reflect conflicting
pressures: the entertainment demand associated with visual media; the demand for personal
investment news by consumers; and the need to fill programming hours at affordable expense,
which may cause the channels to rely heavily on information provided by firm pronouncements
and interviews.
Table 3 shows that CEO coverage clearly varies by market niche. Consider first the ways
that these executives were portrayed in 1996 in articles with CEO in the title.xiii In the New York

18
Times, Washington Post, and USA Today (i.e., national paper subset) 32% of the articles
contained soft news language versus only 16% in the business and finance publications. This is
as we would expect, since the national papers serve entertainment as well as consumer/business
information needs, while the specialized publications in the business and finance file are more
likely to provide information aimed at readers who demand information relevant to business
decisions. When the definition of soft news is expanded to include laudatory language such as
leader or reputation or vision, then business and finance outlets (40% soft news+ language) are
closer to the general interest publications such as major papers (38%), national newspapers
(47%), and the Knight Ridder/Tribune business news outlets (46%). The three national papers
have the highest percentage of negative news stories (24%), consistent with the rule of thumb
that bad news is more likely to be entertaining and capture reader attention. This is nearly twice
the percentage of negative news carried by business and finance news outlets (13% negative
news). Not surprisingly the PR Newswire contains the lowest percentage of negative news stories
(7%), demonstrating that firms are less likely to try and lower the costs to reporters of writing
negative stories.
The differences in the portrayal of CEOs by market niche continued in 2000. Major
papers, especially the three national ones, continued to have a higher percentage of soft news
articles than those targeted at the business and finance reader. At a time when stock prices, the
Internet, and the economy had generated conversation and optimism for years, soft news+
language appeared in 60% of the CEO headline stories in the New York Times, Washington Post,
and USA Today. This was even higher than the percentage of soft news+ stories (54%) in the
company news releases sent out over the PR Newswire, and much higher than the 38% of stories
19
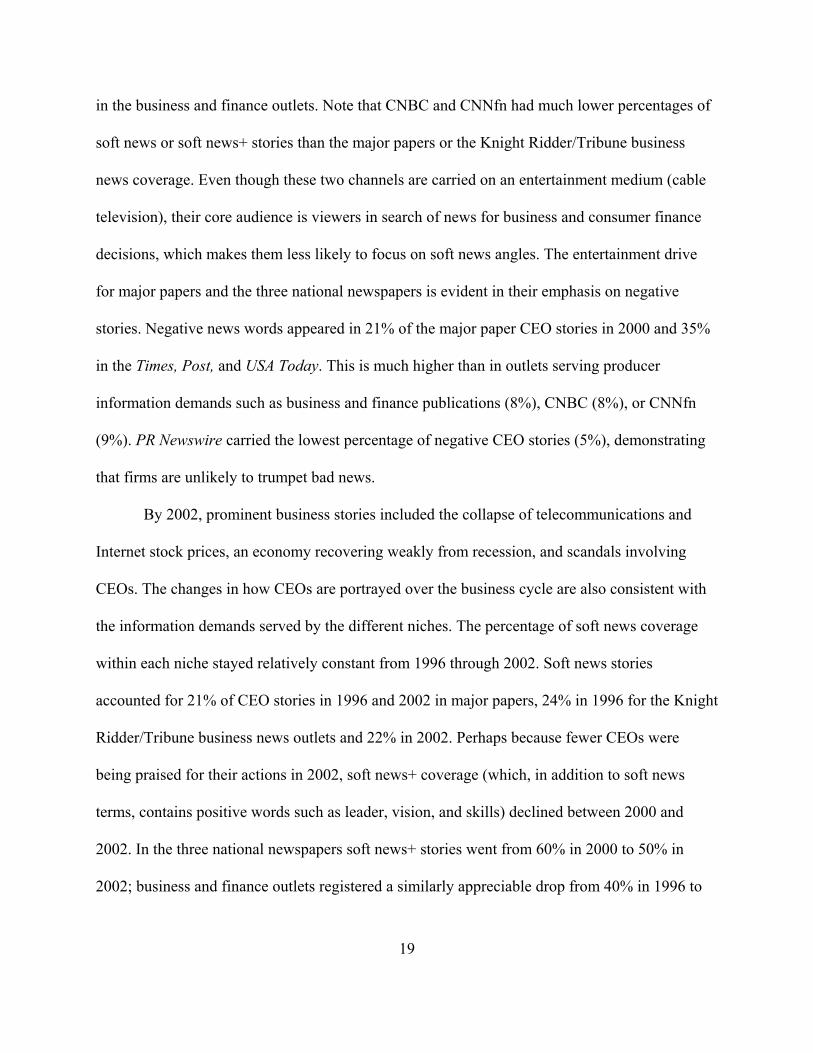
in the business and finance outlets. Note that CNBC and CNNfn had much lower percentages of
soft news or soft news+ stories than the major papers or the Knight Ridder/Tribune business
news coverage. Even though these two channels are carried on an entertainment medium (cable
television), their core audience is viewers in search of news for business and consumer finance
decisions, which makes them less likely to focus on soft news angles. The entertainment drive
for major papers and the three national newspapers is evident in their emphasis on negative
stories. Negative news words appeared in 21% of the major paper CEO stories in 2000 and 35%
in the Times, Post, and USA Today. This is much higher than in outlets serving producer
information demands such as business and finance publications (8%), CNBC (8%), or CNNfn
(9%). PR Newswire carried the lowest percentage of negative CEO stories (5%), demonstrating
that firms are unlikely to trumpet bad news.
By 2002, prominent business stories included the collapse of telecommunications and
Internet stock prices, an economy recovering weakly from recession, and scandals involving
CEOs. The changes in how CEOs are portrayed over the business cycle are also consistent with
the information demands served by the different niches. The percentage of soft news coverage
within each niche stayed relatively constant from 1996 through 2002. Soft news stories
accounted for 21% of CEO stories in 1996 and 2002 in major papers, 24% in 1996 for the Knight
Ridder/Tribune business news outlets and 22% in 2002. Perhaps because fewer CEOs were
being praised for their actions in 2002, soft news+ coverage (which, in addition to soft news
terms, contains positive words such as leader, vision, and skills) declined between 2000 and
2002. In the three national newspapers soft news+ stories went from 60% in 2000 to 50% in
2002; business and finance outlets registered a similarly appreciable drop from 40% in 1996 to

20
30% in 2002. The emphasis on negative stories among newspapers trying to reach the general
reader is evident in 2002. Between 2000 and 2002 negative news went from 21% of articles in
major papers to 37%, from 35% to 65% in the three national papers, and from 24% to 35% for
the regional business news outlets. Negative coverage grew in the business and finance press
(8% to 18%), though these outlets still contained lower percentages of negative news than the
general interest publications. PR Newswire registered only a slight increase in negative news,
with the percentage going from 5% to 8%. CNBC had its negative percentage jump from 8% to
44%, which may reflect the magnifying glass properties of cable television news.
Changes in the volume of coverage also reflect economic incentives. Bad news may be
more interesting for a general reader, while investors or producers may find equally helpful
information in good and bad news. The New York Times, Washington Post, and USA Today
increased the number of articles with CEO in the headline by 58% between 2000 and 2002. In
the business and finance file, CEO articles declined slightly (8%) between 2000 and 20002. The
reluctance of CEOs to be associated with bad news about firms may be evident in the drop in
mentions in the PR Newswire. The number of CEO headline stories in company press releases
increased by 128% between 1998 and 2000, a time when credit-claiming was advantageous.
Once the economic downturn set in, however, CEOs were less likely to be mentioned in
company press releases, with headline stories dropping 23% in PR Newswire between 2000 and
2002. CEOs may also have been less willing to appear or be interviewed on television. The
number of CEO headline stories dropped between 2000 and 2002 by 46% on CNBC and 50% on
CNNfn.
D. Coverage across Firms

21
Firms are not created equal in the eyes of journalists. Some companies will generate
changes in sales, returns, or strategy that trigger news stories. Once reporters start covering a
particular CEO or firm then other journalists may free ride and repeat the information, which
generates a cascade of stories about a given person or firm. In this section we explore the
concentration of attention devoted to CEOs, the characteristics of a company that give rise to
celebrity CEO coverage, and the short-run and long-run returns to investing in firms headed by
celebrity CEOs. For 1995, 1996, and 1997, we randomly selected 200 firms each year from the
Standard and Poor’s (S&P) 500 Index for that year. We collected information on coverage of
their CEOs from the major newspaper files in Lexis. We also gathered firm financial information
from Compustat about these companies. We use the companies in yearly samples to explore how
coverage varies across relatively large firms in the U.S.
Table 4 shows that coverage of CEOs is much more concentrated than coverage of firms.
Among the 200 S&P 500 firms in our sample for 1995, the top 5 firms in terms of stories in
major newspapers accounted for 23% of all articles during the year about the 200 sample firms.
The top 5 CEOs, however, accounted for 48% of the stories mentioning the chief executives of
these firms. In terms of articles with negative news, the companies with the five highest counts
of negative stories accounted for 28% of negative firm coverage. The top five CEOs in terms of
negative stories generated 50% of the negative CEO articles. Positive CEO stories (defined as
total CEO stories - negative CEO stories) and soft news CEO stories were similarly
concentrated, with the top 5 CEOs accounting for 47% of positive CEO articles and the top five
soft news CEOs generating 53% of that style of coverage. These results show that reporters
choose to focus on a relatively small set of winners and losers when casting business coverage in

22
terms of CEOs. The focus on a set of CEOs who become familiar helps fulfill an entertainment
demand, since readers can develop expectations about the personalities and actions of particular
individuals. The use of CEO coverage as contrasted with firm coverage to fulfill this
entertainment demand suggests that reporters will focus on familiar CEOs to garner reader
attention. The greater attention devoted to the top 5 CEOs versus firms is also evident in major
paper coverage in 1996 and 1997.
If one examines the top 20 firms or CEOs by type of coverage attention is also more
concentrated for stories dealing with chief executives. For the 200 S&P firms in our sample for
1995, the top 20 companies by story count generated 51% of all the articles in major papers
about these firms. The top 20 CEOs by coverage type accounted for 75% of negative CEO
stories, 75% of soft news articles, and 68% of positive CEO tales. If one examines the top 40
firms or CEOs, then Table 4 suggests that the top 20% of companies or chief executives generate
about 80% of the coverage. Among chief executives, the top 40 CEOs by story count generate
80% of the major paper articles in 1995 and similar percentages in 1996 (78%) and 1997 (80%).
The 40 CEOs most frequently covered in soft news language garnered 86% of soft news
coverage in 1995 and 1996 and 88% in 1997. Negative coverage is similarly focused, with the
top 40 CEOs generating 87% of major paper articles with negative language in 1995, 83% in
1996, and 86% in 1997.
The focus on a subset of CEOs is also evident when one compares the concentration of
CEO coverage with the concentration of sales among the 200 firms in the sample each year. For
1995, the top 5 firms in terms of sales accounted for 22.7% of the total sales made by the 200
S&P 500 companies examined. The 5 firms with the most articles garnered 23.2% of the stories

23
that year, while the top 5 CEOs in terms of positive stories generated 47.3% of the articles in
major papers. Companies in the top 20 in sales generated 45.2% of total sales, and firms in the
top 40 accounted for 61.6%. A similar pattern of sales holds for the 1996 and 1997 samples, with
firm coverage being a bit more concentrated than firm sales and CEO coverage being much more
concentrated than firm sales.xiv
The concentration of attention in media coverage of CEO also appears high relative to the
way journalists cover another set of decisionmakers, U.S. senators. In major papers in 1995, the
top 5 senators generated 26.4% of the total articles that mentioned U.S. senators by name. The
top 20 senators accounted for 55.5% of the coverage and the top 40 75.7% of the total stories.
The pattern for stories about senators in business and finance outlets was the same: top 5 26.7%,
top 20 57.3%, and top 40 77.1%. In contrast, major paper coverage of the 200 CEOs from the
S&P sample was much more concentrated for the top 5 executives (47.8%) and the top 20
(68.8%).
Becoming a celebrity CEO involves both a demand for information by journalists and a
supply of information by CEOs and their companies. In this section we model how the
characteristics of a firm affect decisions by reporters to cover a CEO. In the following section we
explore how types of CEOs may seek or avoid media coverage. We define celebrity CEOs here
using three measures – top 40 ranking in positive CEO stories, soft news CEO articles, or
negative CEO mentions. Numerous firm factors may attract reporter attention. Consider first the
case of whether a CEO was in the top 40 ranking of CEOs by positive story counts in 1995.
Variables that could influence coverage include firm sales, number of employees, or the return
on assets (ROA) for the year. The annual return to shareholders in 1995 captures how well the

24
company did in the stock market. Since changes can generate news, we also include sales
changes (expressed as a percentage change in 1995) and changes in assets (which captures
merger activity for the firm too). We include the number of common shares outstanding for a
firm, since the number of readers interested in a company may relate to how numerous and
hence potentially widely dispersed are shares in the firm.
Table 5 shows that, with two exceptions, there are not a consistent set of firm
characteristics that predict which companies will have chief executives treated as celebrity CEOs
by major papers. In 1995, an increase in a firm’s percentage change in assets for the year
increased the probability that the CEO would be in the top 40 in terms of positive CEO stories
and negative CEO stories. Earning a higher annual return for shareholders made it more likely
that a CEO was covered with soft news stories and more likely that the CEO garnered negative
coverage too. These variables, however, were not statistically significant in predicting celebrity
CEO status in major paper coverage in 1996 or 1997 (except that firms with higher shareholder
returns in that year were less likely to generate large amounts of positive coverage). Return on
assets was not statistically significant in any of the nine specifications, which suggests that
reporters do not use this real measure of return (or some proxy for it) as a guide to determining
which CEOs to feature in newspaper coverage. The two variables that had a consistent impact
over time were employee numbers and common shares outstanding. The larger the number of
employees, the more likely that a CEO was covered with soft news stories at the celebrity
volume level in 1996 and 1997. This may be because a larger number of employees translates
into more readers potentially interested in the fate of a (familiar) firm. The number of common
shares outstanding is positive and statistically significant in eight of the nine specifications in

25
Table 5. This suggests that the larger the number of shareholders for a firm, the more likely
reporters are to cover the CEO as celebrity in positive, negative, and soft news terms. Larger
shareholder numbers can translate into more demand for personal finance information, which
major papers in part may meet by focusing on CEOs. This allows them to meet two demands at
once, since relating business stories through the use of celebrity CEOs can also provide
entertainment to nonshareholders.
In Table 6 we explore how well the shareholders of celebrity firms fare over time. For the
200 firm samples in 1995, 1996, 1997, we divide the firms into two groups each year based on
whether the CEO was in the top 40 chief executives generating positive stories or not. We also
divided the firms by whether the CEO was in the top 40 chief executives generating soft new
stories, but the results are not reported since they were similar to our findings for celebrity
defined by positive news stories. For each group of celebrity versus non-celebrity firms we
determined the mean annual return to shareholders in years one through five following the year
in which we calculated their media coverage. We divide the firms based on celebrity status in
part to see how investors who follow the buzz about CEOs may fare. Since attention to the CEO
may derive from underlying business successes and from hype and public relations, it is an open
question whether celebrity firms will generate higher shareholder returns in the short or long run.
For each year we compare using difference of means tests the average annual shareholder
returns for firms with top 40 CEOs versus the other companies in the sample.xv Table 6 indicates
that for most years the difference in average annual returns between the two sets of firms is not
statistically significant. Only in 1998 did the firms of celebrity CEOs earn mean returns that
were statistically significantly different: 33.9% versus 9.8% for the 1995 sample (where year 3

26
was 1998); 38.3% versus 11.0% for the 1996 sample (where year 2 was 1998); and 25.7% versus
6.8% for the 1997 sample (where year 1 was 1998). In two cases the returns were higher and
statistically significant for the noncelebrity firms. In year 4 for the 1996 sample, celebrity CEO
firms earned an average annual return of -3.6% versus 17.0% for the noncelebrity companies. In
year 4 for the 1997 sample, celebrity CEO firms earned an average annual return of -1.1% versus
10.0% for the noncelebrity firms. If the three samples are pooled together, the average return
over a five year period is 6.1% for the celebrity CEO firms and 7.4% for the noncelebrity firms
(a difference which is not statistically significant).
Taken as a whole, the results in Table 6 suggest that investors using celebrity CEOs as an
investment guide will not earn returns that are significantly different statistically from those with
less heralded chief executives. Celebrity CEOs, defined by positive stories, do differ from other
company heads in another dimension – compensation. Consider the difference of means for top
40 CEOs in terms of positive stories versus other CEOs in the 1995 sample of S&P companies.
Means in 1995 for the 40 celebrity CEOs were $869,000 salary, $1,071,000 bonus, and
$5,918,000 in total compensation (including the total value of stock options granted, using
Black-Scholes). The mean values in the Compustat database for other 160 CEOs in the 1995
sample were $732,000 salary, $741,000 bonus, and $3,181,000 total compensation. For each
form of compensation the differences are statistically significant (at the .05 level or lower).
Similar patterns hold for the 1996 sample (mean total compensation $9,380,000 for the top 40
CEOs versus $4,017,000 for others) and the 1997 sample (mean total compensation $12,655,000
for celebrity CEOs versus $6,803,000 for the other CEOs). If celebrity is defined by number of
soft news stories, chief executives in the top 40 also earn higher salaries and total compensation

27
than their less famous counterparts.16
D. Coverage across CEO Types
CEOs vary along many dimensions, including vanity, honesty, and responsibility. In the
principal-agent relationship between shareholders and chief executives, the inevitable hurdles of
hidden information and hidden action provide CEOs with some ability to take actions that may
go against the long-run interests of shareholders (see Pratt and Zeckhauser, 1985). Similar
obstacles to scrutiny give CEOs some leeway in evading government regulations. In this section
we investigate whether media coverage can distinguish different types of CEOs before they are
publicly identified as involved in scandal. Some CEOs may court media attention as a form of
on-the-job consumption, independent of whether their publicity helps the firm. They may use
company resources to generate press releases and public relations efforts to build their
reputations. If these efforts are not aimed at maximizing firm profits, their pursuit may be a
signal that the CEO is the type of executive willing to cut corners, evade regulation, and pursue
strategies that are illegal.17 It may also be the case, however, that dishonest or unscrupulous
CEOs seek to avoid media coverage, in the hopes that their illegal or unethical activities in
running their firm will be less likely to come to light if they maintain low public profiles.
Independent of the impact of CEO reputation on firm reputation and fortunes, chief executives
who pursue their interests at the expense of shareholders may seek or avoid media coverage– the
question is open empirically. The degree that the press is an effective monitor whose reporting
can presage future CEO behavior is also an empirical question.
To study media coverage of CEOs willing to engage in illegal or unethical conduct, we
started by searching the major paper files in Lexis in 2001 and 2002 looking for articles with

28
CEO and scandal or fraud in the headline or lead paragraphs or CEO, SEC, and investigate in the
text. This search generated almost 150 companies or CEOs involved in financial scandals or
personal misconduct. To secure longitudinal results, we narrowed the sample by focusing on
CEOs of companies who were involved in scandal in 2001 or 2002 and who were also the CEO
of the firm in 1998 and 1999. This yielded a total of 30 scandal-related CEOs, with the sample
broken down as follows: 15 CEOs who had been formally charged in 2001-2002 by the
Securities and Exchange Commission, Justice Department, or State Attorney General’s Office in
a civil or criminal action in cases where charges and investigation did not publicly surface before
2001; 5 CEOs who resigned or were forced out of office in 2001-2002 during a scandal or
investigation for their actions, where the investigation or scandal did not surface prior to 2001
(and with those resigning simply for poor company performance not included in the sample); 9
CEOs formally charged in 2001-2002 but with the investigation or scandal made public in 2000;
and 1 firm where the CEO resigned during 2001-2002 and had only been appointed during 2000.
We call these 30 chief executives the scandal set of CEOs. We matched each firm with a
company from Hoover’s list of top competitors or all competitors for the firm based on the
magnitude of company sales. These 30 firms constitute the set of non-scandal firms.18
Table 7 reports the results of difference of means tests between scandal and nonscandal
firm and CEO coverage in major papers, business and finance news outlets, and PR Newswire
for each year from 1999 through 2002. In 1999 the scandal and nonscandal firms are similar in
terms of the mean number of CEO articles and average percentage of firm stories that mention
the CEO. In the major paper coverage, the percentage of CEO stories that contain negative
language is much higher for scandal firms (22.7%) than for nonscandal firms (5.4%). This
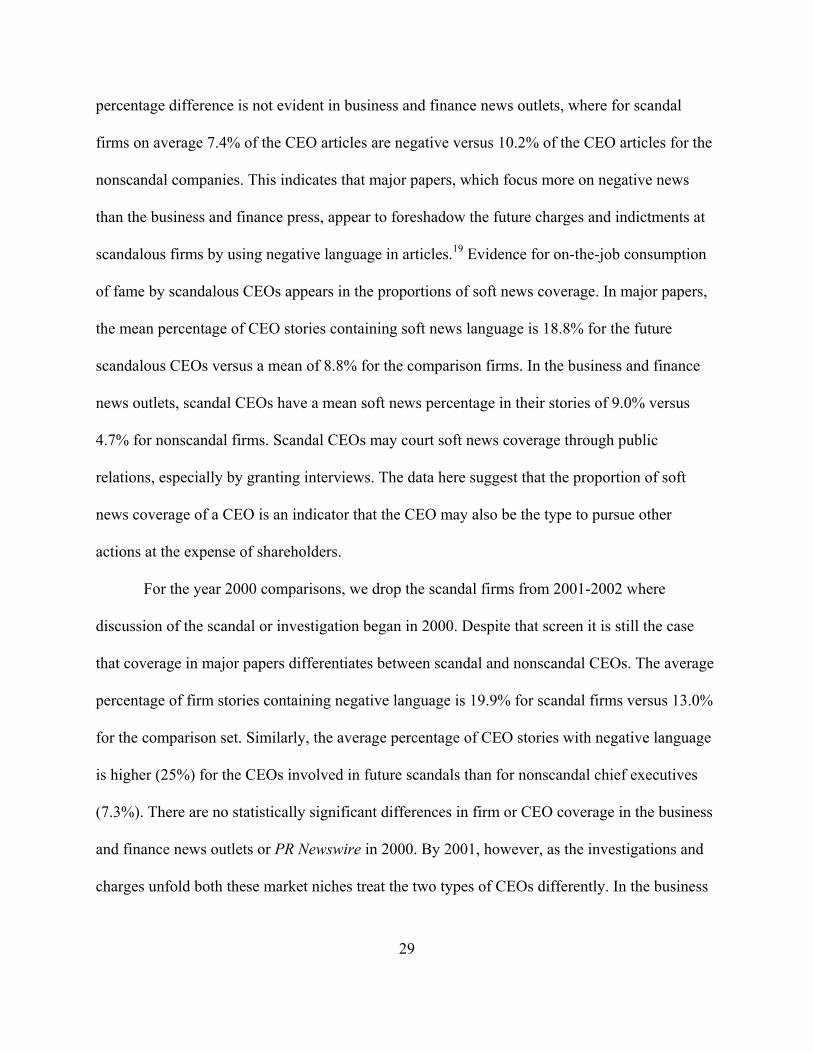
29
percentage difference is not evident in business and finance news outlets, where for scandal
firms on average 7.4% of the CEO articles are negative versus 10.2% of the CEO articles for the
nonscandal companies. This indicates that major papers, which focus more on negative news
than the business and finance press, appear to foreshadow the future charges and indictments at
scandalous firms by using negative language in articles.19 Evidence for on-the-job consumption
of fame by scandalous CEOs appears in the proportions of soft news coverage. In major papers,
the mean percentage of CEO stories containing soft news language is 18.8% for the future
scandalous CEOs versus a mean of 8.8% for the comparison firms. In the business and finance
news outlets, scandal CEOs have a mean soft news percentage in their stories of 9.0% versus
4.7% for nonscandal firms. Scandal CEOs may court soft news coverage through public
relations, especially by granting interviews. The data here suggest that the proportion of soft
news coverage of a CEO is an indicator that the CEO may also be the type to pursue other
actions at the expense of shareholders.
For the year 2000 comparisons, we drop the scandal firms from 2001-2002 where
discussion of the scandal or investigation began in 2000. Despite that screen it is still the case
that coverage in major papers differentiates between scandal and nonscandal CEOs. The average
percentage of firm stories containing negative language is 19.9% for scandal firms versus 13.0%
for the comparison set. Similarly, the average percentage of CEO stories with negative language
is higher (25%) for the CEOs involved in future scandals than for nonscandal chief executives
(7.3%). There are no statistically significant differences in firm or CEO coverage in the business
and finance news outlets or PR Newswire in 2000. By 2001, however, as the investigations and
charges unfold both these market niches treat the two types of CEOs differently. In the business

30
and finance news outlets, the mean 2001 percentage of firm articles with negative language is
14.6% for the scandal firms versus 8.7% for the comparison set. Companies are also conveying
information about their negative outcomes, with the average percentage of negative firm articles
registering 6.7% for scandal firms in the press releases carried by PR Newswire and 2.1% for the
nonscandal companies. Means for the percentage of CEO coverage that is negative are also
higher in the business and finance outlets for the scandal firms (19.8% versus 7.8%) and PR
Newswire (17.3% versus 1.6%). Note that the mean percentage of CEO coverage that is soft
news is higher for scandal firm CEOs (16.2%) than the comparison set of chief executives
(7.5%), consistent with the on-the-job consumption hypothesis.
By the end of 2002 the CEOs in our scandal sample by definition have been charged or
resigned. Table 7 shows how scandal can dominate firm coverage. In terms of the mean
percentage of firm coverage that is negative, scandal firms have much more negative news
proportions than the comparison set in major papers (52.1% vs 24.5%), business and finance
news outlets (37.7% vs 12.8%), and even PR Newswire (15% vs 5.9%). The average number of
major paper articles mentioning a firm and CEO was much higher for scandal firms (408) than
nonscandal firms (30) in 2002. The lure of scandal is evident when one compares the mean
number of firm and CEO articles in 1999 for the scandal firms (26 stories) and comparison set
(27 articles). The negative tone clearly dominates in those articles that mention CEO. Of CEO
coverage in the major papers, the mean percentage of stories containing negative language is
66.3% for scandal firms versus 30.4% for nonscandal firms. These differences are also evident in
the average negative CEO coverage in business and finance news outlets (50.9% vs 15.5%) and
PR Newswire (33.8% vs 5.0%).

31
Media coverage of Enron, one of the scandal firms in the dataset, shows how significant
problems with a company may generally go undetected by reporters until an event generates a
burst of critical scrutiny. Table 8 contains counts of articles in major papers and business and
finance outlets (minus PR Newswire) that mention Enron in the headline or lead paragraph, as
well as counts of articles that go on to mention in the text terms associated with profits, soft
news, or negative news. In January 2001 there were 92 stories with Enron leads in major papers,
with 23 of these (25%) containing negative language. In the business press there were 270 stories
focusing on Enron, with 43 (16%) containing negative terms. During most of 2001 coverage of
Enron remained relatively positive, despite a prescient story in the March 2001 Fortune entitled
“Is Enron Overpriced” and the resignation of CEO Jeffrey Skilling in August for personal
reasons.20 Negative coverage began in earnest, however, when Enron on October 16, 2001
announced a loss of $618 million for the third quarter. Reporters for the Wall Street Journal
linked the losses to partnerships that Enron executives had profited from. Damaging stories and
announcements multiplied quickly, and the company filed for bankruptcy on December 2, 2001.
The sudden eruption of the scandal increased coverage by a factor of ten. In January
2002, major paper coverage of Enron had jumped to 3,446 stories, of which 2,220 (64%) were
negative. In the business press 2,439 stories had Enron in the headline or lead paragraph, with
2,229 (94%) containing negative news. While 37% of the major paper articles in January 2002
focused on profits, earnings, or sales, these terms figured in 80% of the business and finance
coverage. While the percentage of stories with soft news terms stayed relatively constant
throughout the year, the jump in total coverage volume meant that the count of soft news stories
about Enron grew from 9 in January 2001 in major papers to 397 in January 2002. The rush of
32
negative events, information, and coverage is reflected starkly in the stock price drop from $80
on January 31, 2001 to $.60 on December 31, 2001.
Table 9 suggests that media coverage can uncover a CEO’s type before a scandal
becomes public and the chief executive is indicted or resigns. In specification 1, we estimate the
degree to which information in the business and finance news outlets file in Lexis, which
includes company press releases on PR Newswire, in 1999 predicts which firms will be involved
in CEO scandals in 2001-2002. The number of articles about the firm, the percentage of firm
articles that are negative or focus on the CEO, and company sales are not statistically significant.
The greater the percentage of stories about the CEO in 1999 that contained soft news, however,
the more likely the firm was to be involved in scandal in 2001-2002. This is consistent with
scandal-prone CEOs being more likely to engage in on-the-job consumption of fame and
reputation. Those CEOs who give interviews and search out soft news coverage are more likely
to be the ones that abuse the principal-agent relationship in ways that result in their indictment or
resignation later. Specification 2 drops the PR Newswire articles from the business and finance
news outlets and finds the same result as in (1). The higher the percentage of CEO stories in
business and finance news stories that include soft news details, the greater likelihood that the
company CEO will later be found involved in scandal.
IV. Conclusions
Our research shows that media coverage of a CEO is determined by market forces. We
find that the level and tenor of stories about chief executives emerge from the interaction of
CEOs seeking attention, journalists aiming for readers and viewers, and news consumers in
search of work information, investment advice, and diversion. Coverage of CEOs follows real

33
world outcomes. When real GDP declines, the average number of stories about large firms and
their CEOs increases in the New York Times. As firm sales increase, the number of articles in the
Times increases, while the overall percentage mentioning the CEO declines.
Given the wide set of potential company stories the real world serves up, however, our
results show that the articles that reporters chose to write vary considerably with audience
interests and niche targeting. Major papers offer CEO stories with a higher percentage of
negative news and soft news elements than the business and finance press. This is consistent
with major papers being more likely to serve entertainment demands than the producer
information demand served by the specialized business press. A focus on negative news and soft
news is also a hallmark of criticism of major paper coverage of political figures.21 The emphasis
on scandal, reverses, and lifestyles in major paper coverage of economics and politics again
relates to the fact that some consumers will be reading for diversion rather than for information
that helps them make investment or voting decisions.
We find that the set of CEOs covered as celebrities, either in positive stories, negative
stories, or soft news profiles, is highly concentrated. Major paper coverage of CEOs is much
more concentrated than coverage of firms, consistent with the notion that CEOs are used to
create familiar continuing stories that will attract and interest readers. Reporters are more likely
to treat CEOs as celebrities the greater the potential audience of investors, reflected in the
number of common shares outstanding in the firm. Though celebrity CEOs may attract attention
in the stock market, we find in the short and long run that firms with celebrity CEOs do not earn
higher average shareholder returns. CEO attempts to court media coverage vary with the
business cycle. As manufacturing shipments or the Dow Jones Industrials Index increase, the
34
number of press releases mentioning CEOs and soft news terms increases. As shipments grow,
companies also issue more press releases linking CEOs with profits, earnings, or sales.
We have not attempted to untangle the impact of CEO coverage on daily share price
movements, CEO salaries, or the future mobility of chief executives. Our research does suggest,
however, that for some CEOs media coverage equates to on-the-job consumption of fame. These
are the same CEOs who may take advantage of shareholders in ways that lead to their indictment
or resignation amid scandals. CEOs later involved in scandal generate much higher levels of soft
news coverage in the years before their illegal or unethical actions come to light. In major paper
articles, for example, CEOs later involved in scandals in 2001-2002 had twice the percentage of
soft news coverage in 1999 than a comparison set of CEOs. We find that, controlling for many
factors, CEOs who generate soft news articles in the business and financial press are more likely
to be the type of executives later found to be charged with misusing company resources or
violating regulations. Though soft news is often criticized as insubstantial and unenlightening,
our results suggest there is real information buried in the personal stories of CEOs. The
willingness of CEOs to grant interviews and take steps to court soft news coverage are a signal
that the chief executive may not be an ideal or honest agent in the long run.

35
References Avery, Christopher, Judith A. Chevalier, and Scott Schaefer. 1998. “Why Do Managers
Undertake Acquisitions? An Analysis of Internal and External Rewards for Acquisitiveness,” 14 Journal of Law, Economics, and Organization 24-43.
Brody, Richard G., and Lynn Rees. 1996. “The Performance of Popular Investment Magazine
Stock Analysts,” 12 Journal of Applied Business Research 42-46. Busse, Jeffrey A., and T. Clifton Green. 2002. “Market Efficiency in Real Time,” 65 Journal
of Financial Economics 415-437. Core, John E., Robert W. Holthausen, and David F. Larcker. 1999. “Corporate Governance,
Chief Executive Officer Compensation, and Firm Performance,” 51 Journal of Financial Economics 371-406.
Cowen, Tyler. 2000. What Price Fame? Cambridge: Harvard University Press. Downs, Anthony. 1957. An Economic Theory of Democracy. New York: Harper. Dyck, Alexander, and Luigi Zingales. 2002a. “The Corporate Governance Role of the Media,”
in The Right to Tell: The Role of Mass Media in Economic Development. Washington, D.C.: The World Bank.
________. 2002b. “Private Benefits of Control: An International Comparison,” Working Paper
No. 8711, National Bureau of Economic Research. ________. 2003. “The Media and Asset Prices,” Working paper, Harvard Business School. Farber, Henry S., and Kevin F. Hallock. 1999. “Have Employment Reductions Become Good
News For Shareholders? The Effect of Job Loss Announcements on Stock Prices, 1970-97,” Working Paper No. 7295, National Bureau of Economic Research.
Farrell, Kathleen A., and David A. Whidbee. 2000. “The Consequences of Forced CEO
Succession for Outside Directors,” 73 Journal of Business 597-627. Gadarowski, Christopher. 2002. “Financial Press Coverage and Expected Stock Returns,”
Working Paper, Cornell University. Gaines-Ross, Leslie. 2003. CEO Capital: A Guide to Building CEO Reputation and Company
Success. Hoboken, N.J.: John Wiley & Sons, Inc. Hall, Brian J., and Jeffrey B. Liebman. 1998. “Are CEOs Really Paid Like Bureaucrats?” 113
The Quarterly Journal of Economics 653-691. Hamilton, James T. 2004. All The News That’s Fit to Sell: How the Market Transforms

36
Information into News. Princeton: Princeton University Press. Holmstrom, Bengt. 1999. “The Firm as a Subeconomy,” 15 Journal of Law, Economics, and
Organization 74-102. Huberman, Gur, and Tomer Regev. 2001. “Contagious Speculation and a Cure for Cancer: A
Nonevent that Made Stock Prices Soar,” 56:1 Journal of Finance 387-396. Huson, Mark R., Robert Parrino, and Laura T. Starks. 2001. “Internal Monitoring Mechanisms
and CEO Turnover: A Long-Term Perspective,” 56 The Journal of Finance 2265-2297. Lieberman, David. 2000. “TV’s New Look: All Business, All the Time.” USA Today, Final
Edition, January 14, 1A. McLean, Bethany, and Peter Elkind. 2003. The Smartest Guys in the Room: The Amazing Rise
and Scandalous Fall of Enron. New York: Portfolio. Morris, Stephen, and Hyun Song Shin. 2001. “The CNBC Effect: Welfare Effects of Public
Information,” Discussion Paper No. 1312, Cowles Foundation for Research in Economics at Yale University.
Norris, Floyd. 2003. “The Incomplete Resume,” in A. Leckey and A. Sloan, eds. The Best Business Stories of the Year. New York: Vintage Books. Patterson, Thomas E. 1993. Out of Order. New York: Alfred A. Knopf. ________. 2000. Doing Well and Doing Good: How Soft News and Critical Journalism Are
Shrinking the News Audience and Weakening Democracy- and What News Outlets Can Do About It. Joan Shorenstein Center Soft News Project Report. John F. Kennedy School of Government, Harvard University.
Pratt, John W., and Richard Zeckhauser (eds.). 1985. Principals and Agents: The Structure of
Business. Boston: Harvard Business School Press. Rose, Nancy L., and Catherine Wolfram. 2000. “Executive Compensation: Has the ‘Million-
Dollar Cap’ Affected CEO Pay?” 90 AEA Papers and Proceedings 197-202. Ryan, Harley E., Jr., and Roy A. Wiggins III. 2001. “The Influence of Firm- and Manager-
Specific Characteristics on the Structure of Executive Compensation,” 7 Journal of Corporate Finance 101-123.
Sherman, Scott. 2002. “Enron: Uncovering the Uncovered Story,” March/April Columbia
Journalism Review 22-28.

37
Shiller, Robert J. 2000. Irrational Exuberance. Princeton, N.J.: Princeton University Press. Smillie, Dirk. 1998. “TV is Bullish for Business News.” Christian Science Monitor, July 17,
B1. Smith, Rebecca, and John R. Emshwiller. 2003. 24 Days. New York: HarperCollins Urrutia, Jorge L, and Joseph D. Vu. 1999. “Is It Good or Bad to Make the Cover of Business
Week?” 38 Quarterly Journal of Business and Economics 64-76. Walker, Tom. 2002. “CEOs Are Put Under the Microscope.” The Atlanta Journal-Constitution,
Tuesday Home Edition, September 17, 2D. Wilbert, Caroline. 2003. “Business TV in Slump, Too; Networks Try New Strategies to Widen
Appeal.” The Atlanta Journal-Constitution, March 23, 1F. Yermack, David. 1997. “Good Timing: CEO Stock Option Awards and Company News
Announcements,” 52 The Journal of Finance 449-476.

38
i. Quotations in this paragraph come from Lieberman (2000), Smille (1998), and Walker (2002).
ii. We interpret scandalous CEOs as acting against the interests of shareholders since their actions often involve the misuse of company resources or misreporting of company results. We do not analyze whether shareholders may have benefitted from some of the illegal actions pursued by these CEOs.
iii. For an analysis of the economic market for public affairs stories, see Hamilton, 2004.
iv. In 2000 CNBC, a cable channel focused during the daytime on business news, averaged according to Nielsen ratings 370,000 viewers on weekdays between 6 am and 6 pm. This figure fell to 279,000 in 2002. See Wilbert, 2003.
v. McLean and Elkind (2003, p.182) note how Ken Lay’s fame as CEO of Enron helped the company generate business:
Ken Lay himself helped EES [Enron Energy Services] rope in prominent corporations. His calendar is dotted with meetings and phone calls with top executives of other companies, opening doors for the division ... . Whenever the EES deal makers had trouble getting in to make their pitch to a prospect, they would call on Lay. ‘Ken can get us in,’ Pai [the head of EES] would say.
vi. See Cowen 2000 for a discussion of the economics of fame.
vii. Business books for corporate managers explicitly view media coverage as an essential part of reputation building. See, for example, the how- to- book by Gaines-Ross (2003) entitled CEO Capital: A Guide to Building CEO Reputation and Company Success. For a theoretical assessment of the social welfare effects of dissemination of economic information by the media, see Morris and Shin (2001).
viii. The year data refer to the year the sales were made rather than the year the Forbes list was published. Our list of the 80 largest U.S. firms by sales revenue for 1970, for example, was published by Forbes in spring 1971. If company name changed during the year, both names were searched. If the CEO listed for a firm differed from one listed in the prior year’s list, the previous year’s CEO was also added to the CEO search with an or indicator to capture coverage of the CEO office throughout the year. A CEO’s last name was used as the search term, except in the few cases where a first name was added to eliminate false positives. We analyze New York Times coverage up to 1999 because that was the last available year in the ProQuest archives.
ix. While coverage within the New York Times was not at historically high levels, it is the case that in the late 1990s the proliferation of cable channels and Internet sites had increased the number of outlets providing information about CEOs relative to coverage in the 1970s.

39
x. Farber and Hallock (1999) find that reductions in force (RIFs) at firms generate extensive media coverage. They collect information from the Wall Street Journal index on 3,878 announcements of RIFs between 1970-1997 and determine that stock market reaction to these firm announcements has over time become less negative.
xi. Assessing coverage of major-party presidential nominees in Time and Newsweek from 1960 to 1992, Patterson (1993) found that unfavorable references to the candidates grew from approximately 25% in 1960 to 60% in 1992.
xii. Stories about CEO scandals may also relate to demand for public policy information since the scandals were frequently mentioned in congressional debates about legislation dealing with accounting regulation and corporate disclosure requirements.
xiii. In this section we discuss differences and similarities in coverage across market niches. To determine whether differences were statistically significant, we conducted chi-square tests of whether a type of coverage was independent of market niche. For example, the chi-square value of 18.1 allows us to reject the hypothesis at the .01 level that soft news coverage in 1996 was independent of whether articles were in the three national papers (32% soft news) versus business and finance news outlets (16% soft news). In the text when we indicate coverage patterns are different this means the chi-square tests rejected the hypothesis (at the .1 level or better) that coverage was independent of niche. When we indicate that the content percentages are similar this means the chi-square tests failed to reject the independence hypothesis.
xiv. For 1995 total sales, the concentration figures were top 5 22.7%, top 20 45.2%, and top 40 61.6%. For 1996 shares were top 5 20.8%, top 20 41.7%, and top 40 57.9%, while for 1997 the concentration of sales was top 5 21.1%, top 20 43.7%, and top 40 61.0%.
xv. Data on firm return to shareholders came from the Compustat’s Executive Compensation (ExecuComp) database. Return to shareholders is based on the percentage difference in share price over the course of a firm’s fiscal year. Compustat adjusts the return to shareholders to take account of stock splits and the reinvestment of dividends. Note that the sample size for the calculation of returns declines as the time horizon increases from 1 year to 5 years; this in part is because firms may merge or be acquired. The relatively smaller number of firms in 1997 with 5 year returns may be because full information on company returns for fiscal year 2002 were not in the version of Compustat available at the time of the analysis. The sample for 1997 S&P companies was created by taking 200 randomly selected firms from the 1997 S&P list and matching them via ticker symbols with the ExecuComp data. While over 75% matched correctly with the ExecuComp data, further research was required to link up those firms whose 1997 ticker symbols did not match current data in ExecuComp. To avoid this problem the 1995 and 1996 samples were constructed by taking a larger randomly selected draw of firms from the S&P for each year and then taking the first 200 from these samples whose ticker symbols matched up with ExecuComp data. This means that the 1995 and 1996 sample data may be less likely to include firms that merged or were acquired than the 1997 data.

40
16. Note that since media counts and compensation are analyzed here for the same year, some of the articles may be generated by a focus on the levels of compensation for particular CEOs.
17.Norris (2003, p. 154) relates that Al Dunlap, fired in 1998 as CEO of Sunbeam amid fraud charges, had been fired in 1976 as president of Nitec and had been sued by the company for fraud. The company charged in part that Dunlap had used firm funds “to conduct a personal publicity and self-glorification campaign.”
18. Sample sizes for the analyses in Tables 7 and 9 will vary by year. Two scandal CEOs, Martha Stewart and Steve Madden, are dropped because of the difficulty of determining which articles about their firms contained mentions of the CEO because the firm names (Martha Stewart Living Omnimedia and Steve Madden Inc) contain the CEO names. This also dropped their comparison firms from analyses. Some scandalous firms were dropped from analyses in 2000 since their scandals were made public in that year. Note that while we focus on firms whose CEOs were indicted in 2001-2002 or resigned then, the illegal or unethical actions made by the CEOs could have transpired years prior to this. The set of scandal CEOs contained Dennis Kozlowski (Tyco), John Rigas (Adelphia Communications), Bernard Ebbers (WorldCom), Samuel Waksal (ImClone Systems), Gregory Earls (US Technologies), Joseph Nacchio (Qwest Communications), Clark McLeod (McLeodUSA), Yervent David Lepejian (HPL Technologies), Timothy Horne (Watts Industries), Bruce Bertman (WorldTeq Group), John Cassese (Computer Horizons), Richard Scrushy (HealthSouth), Lycourgos Kyprianou (AremisSoft Corporation), Michael Segal (Near North National Group), Kenneth Lay (Enron), Stuart Wolff (Homestore), Richard Jay Kogan (Schering-Plough), William Compton (Tropical Sportswear), Daniel Rabinowitz (Windsor Woodmont Black Hawk Resort), Chuck Conaway (Kmart Holding Corporation), Leandro Rizzuto (Conair), Steve Madden (Steve Madden Ltd), Michael Saylor (MicroStrategy), Richard Thoman (Xerox), Gholamrez Mikailli (Unify Corporation), Alan Anderson (Quintus), Thomas Hughes (Econnect), Kenneth Winger (Safety-Kleen), Ian Wilson (Aurora Foods), and Martha Stewart (Martha Stewart Living Omnimedia).
19. Note that we have constructed our sample so that the scandals associated with the CEOs in 2001 and 2002 had not been made public (in terms of coverage in major papers) in 1999.
20. For detailed discussions of media coverage of Enron, see Sherman, 2002, McLean and Elkind, 2003, and Smith and Emshwiller, 2003.
21. Patterson (2000) analyzes changes over time in soft news coverage and the negative tone in political coverage in newspapers, magazines, and network television.

Table 1 Firm and CEO Coverage Patterns Over Time in the New York Times, 1970-1999
A. Annual Sample Averages
(1)
Annual Average Stories Per Firm
(2)
Annual Average Stories Per CEO
(3)
Annual % of Firm Stories Mentioning CEO
Intercept
195.73***
(8.34)
12.70***
(0.60)
6.53*** (0.42)
# Mutual Fund Accounts (000s)
2.34e-4** (1.04e-4)
-1.14e-6 (7.14e-6)
-7.82e-6 (5.31e-6)
Annual % Change in Real GDP
-4.76***
(1.62)
-0.32** (0.14)
-3.97e-3 (0.08)
R2
.46
.24
.31
Durbin-Watson
1.77
1.78
1.66
N
30
30
30
B. Firm-level Coverage
(4)
Firm Stories
(5)
CEO Stories
(6)
% of Firm Stories Mentioning CEO
Intercept
225.95***
(32.44)
11.00***
(2.95)
5.41*** (1.20)
Firm Sales (1999$ mil)
7.68e-4*** (2.75e-4)
1.1e-5
(2.9e-5)
-2e-5*
(1.3e-5) # Mutual Fund Accounts (000s)
-2e-5
(8.0e-5)
-1e-5
(8.23e-6)
-8.99e-6** (3.57e-6)
Annual % Change in Real GDP
-4.05***
(0.74)
-0.29***
(0.10)
-6.84e-3 (0.05)
Log Likelihood
-13798.95
-8862.45
-7289.95
N
2370
2370
2370
Note: All regressions were run assuming an AR1 process; specifications (4)-(6) also included firm fixed effects. Standard errors are in parentheses. *** = statistically significant at the .01 level; ** = significant at the .05 level; * = significant at the .10 level.

Table 2
CEO Media Coverage By Month, 2000 - 2003
PR Newswire
New York Times Washington Post,
USA Today
(1)
# Profit Stories
(2)
# Soft Stories
(3)
# Negative Stories
(4)
# CEO Stories
(5)
# Profit Stories
Intercept
-3451***
(1218)
-1027*** (245.34)
103.99 (87.11)
445.54** (177.61)
169.28***
(54.32) Manufacturers’ Shipments ($M)
.01***
(4.34e-3)
3.33e-3*** (8.60e-4)
3.52e-4
(3.15e-4)
-8.91e-4 (5.93e-4)
-3.37e-4* (1.90e-4)
Dow Jones Index
.08
(.05)
.02*
(9.77e-3)
-7.90e-3** (3.60e-3)
1.80e-3 (6.10e-3)
-1.88e-3 (2.12e-3)
R2
.38
.48
.11
.06
.17
Durbin-Watson
1.56
1.82
1.99
1.95
1.95
N
47
47
47
47
47
New York Times Washington Post,
USA Today
(6)
# Soft Stories
(7)
# Negative Stories
(8)
Profit As % CEO Stories
(9)
Soft As % CEO Stories
(10)
Negative As % CEO Stories Intercept
57.93** (24.03)
193.10** (93.04)
.57*** (.17)
.14 (.15)
.85* (.46)
Manufacturers’ Shipments ($M)
-9.9e-5
(8.67e-5)
-3.68e-4 (3.05e-4)
-6.21e-7 (6.21e-7)
4.76e-8 (5.23e-7)
-1.10e-6 (1.53e-6)
Dow Jones Index
-1.74e-4 (9.87e-4)
-3.55e-3 (3.39e-3)
-1.3e-5* (6.99e-6)
-1.51e-6 (5.88e-6)
-2.8e-5* (1.67e-5)
R2
.06
.10
.22
1.8e-3
.12
Durbin-Watson
1.87
1.95
1.99
1.83
1.90
N
47
47
47
47
47
Note: All regressions were run assuming an AR3 process. Standard errors are in parentheses. *** = statistically significant at the .01 level; ** = significant at the .05 level; * = significant at the .10 level.

Table 3 Soft News and Negative News in CEO Headline Stories Over Time, By Market Outlets, 1996-2002
Major Papers
NY Times,
Washington Post, USA
Today
Knight Ridder/ Tribune Business
News
Business and
Finance News
Outlets
PR
Newswire
CNBC
CNNfn 1996
# Stories
894
106 123 3,172 835
% Soft News
21.3
32.1
24.4
16.4
20.7
% Soft News +
37.9
47.2
46.3
40.2
50.2
% Negative News
18.9
23.6
19.5
12.8
7.3
1998
# Stories
1,321
104 430 6,099 1,346
79 304
% Soft News
22.9
31.7
23.7
14.9
16.9
11.4
11.8
% Soft News +
39.9
51.9
41.9
38.6
52.6
30.4
35.2
% Negative News
21.3
28.8
24.0
11.9
8.2
8.9
10.5
2000
# Stories
1,751
165 1,127 16,878 3,066
517 1,629
% Soft News
21.1
35.8
23.9
12.0
14.3
5.8
11.7
% Soft News +
40.5
60.0
46.8
38.1
53.5
16.8
30.6
% Negative News
20.7
34.5
23.7
7.8
5.2
8.1
8.7
2002
# Stories
2,538
260 1,234 15,487 2,349
277 822
% Soft News
20.5
28.1
21.6
10.7
11.8
12.3
8.2
% Soft News +
40.7
49.6
42.0
29.5
49.1
32.5
22.6
% Negative News
36.8
64.6
35.3
17.9
8.3
44.0
15.3

Table 4 Percentage of Stories in Major Papers Accounted for by Top Firms and CEOs, 1995-1997
Firm
Stories
Firm Negative
Stories
CEO
Stories
CEO Negative
Stories
CEO Positive
Stories
CEO Soft News
Stories 1995
Top 5
23.2
28.2
47.8
50.0
47.3
52.6
Top 20
50.9
56.9
68.8
75.3
68.4
75.3
Top 40
70.0
74.2
80.4
87.0
79.9
86.1
1996
Top 5
28.9
26.6
38.7
44.7
38.4
42.0
Top 20
51.3
52.1
62.3
68.1
61.3
72.2
Top 40
68.5
70.2
77.5
83.2
76.9
86.4
1997
Top 5
28.7
28.7
41.4
45.7
41.1
51.9
Top 20
53.3
54.7
65.6
72.9
64.8
74.6
Top 40
70.6
73.3
79.6
86.1
78.6
87.5

Table 5 Firm-Level Determinants of Celebrity CEO Coverage, 1995-1997 1995 Firm Variable
Top 40,
Positive CEO Stories
Top 40,
Soft News CEO Stories
Top 40,
Negative CEO Stories Intercept
-2.25***
(.41)
-2.68***
(.41)
-2.50***
(.39) Sales ($M)
1.5e-5
(2.6e-5)
1.3e-5
(2.3e-5)
1.6e-5
(2.4e-5) % Sales Change
-0.03* (.01)
-0.01 (0.01)
-0.03* (0.02)
% Assets Change
0.03** (0.01)
0.01
(0.01)
0.03** (0.01)
Return on Assets (%)
-0.07 (0.04)
-4.46e-3
(.03)
-0.06 (0.04)
Annual Return for Shareholders (%)
1.46e-3
(7.35e-3)
0.01**
(6.57e-3)
0.01**
(6.28e-3) Employees (000s)
2.48e-3
(4.27e-3)
3.25e-3
(4.02e-3)
1.59e-3
(3.92e-3) Common Shares Outstanding (M)
3.73e-3*** (1.33e-3)
2.10e-3* (1.23e-3)
2.56e-3** (1.27e-3)
Log Likelihood
-77.9
-82.2
-78.9
N
196
196
196
1996 Firm Variable
Top 40,
Positive CEO Stories
Top 40,
Soft News CEO Stories
Top 40,
Negative CEO Stories Intercept
-3.02***
(0.44)
-2.73***
(0.40)
-2.72***
(0.40) Sales ($M)
6.7e-5** (3.4e-5)
1.4e-5
(2.4e-5)
3.4e-5
(2.5e-5) % Sales Change
0.02
(0.02)
0.01
(0.02)
0.03* (0.02)
% Assets Change
3.49e-3 (0.02)
7.66e-3 (0.02)
3.12e-3 (0.02)
Return on Assets (%)
-0.03 (0.04)
-0.03 (0.04)
-0.02 (0.04)
Annual Return for Shareholders (%)
4.27e-3
(5.09e-3)
5.16e-3
(4.93e-3)
2.86e-3
(4.86e-3)

Employees (000s)
4.19e-3
(5.11e-3)
9.62e-3* (4.93e-3)
5.93e-3
(4.51e-3) Common Shares Outstanding (M)
2.39e-3* (1.30e-3)
2.31e-3* (1.23e-3)
1.49e-3
(1.19e-3)
Log Likelihood
-72.9
-77.7
-78.2
N
191
191
191
1997 Firm Variable
Top 40,
Positive CEO Stories
Top 40,
Soft News CEO Stories
Top 40,
Negative CEO Stories Intercept
-2.35***
(0.38)
-2.64***
(0.40)
-2.58***
(0.40) Sales ($M)
9.23e-8 (3.1e-5)
-8.82e-6 (3.0e-5)
4.4e-5
(3.3e-5) % Sales Change
9.73e-3 (0.01)
3.16e-3 (0.01)
9.64e-3 (0.01)
% Assets Change
-8.55e-3 (0.01)
-7.02e-3 (9.20e-3)
-4.83e-3 (7.50e-3)
Return on Assets (%)
-0.03 (0.03)
-0.02 (0.03)
-0.03 (0.03)
Annual Return for Shareholders (%)
-0.02*** (8.22e-3)
-9.90e-3 (7.85e-3)
-9.44e-3 (7.69e-3)
Employees (000s)
0.01
(6.99e-3)
0.01*
(6.83e-3)
4.77e-3
(6.82e-3) Common Shares Outstanding (M)
3.40e-3*** (9.98e-4)
3.56e-3*** (9.76e-4)
2.36e-3*** (8.91e-4)
Log Likelihood
-69.4
-70.3
-71.4
N
193
193
193
Note: Dependent variable=1 in logit analysis if a firm had a celebrity CEO, defined as being among the top 40 CEOs in the 200 CEO sample based on counts of positive CEO stories, soft news CEO stories, or negative CEO stories in major papers. Values for sales, employees, and common shares outstanding are from the current year (e.g., sales in 1995 models refers to sales in 1995). Variables referring to percentage changes are calculated by comparing current year levels to those in the previous year. Standard errors are in parentheses. *** = statistically significant at the .01 level; ** = significant at the .05 level; * = significant at the .10 level.

Table 6
Short and Long-run Shareholder Returns For Firms of Celebrity CEOs
Top 40 CEOs By Positive Stories
Rest of Sample CEOs
Mean Annual Return (%)
N
Mean Annual Return (%)
N
1995 Sample
Year 1
18.3
39
20.3
159
Year 2
27.2
38
29.6
155
Year 3
33.9
38
9.8**
152
Year 4
37.9
35
12.9
144
Year 5
1.7
34
14.5
138
1996 Sample
Year 1
29.3
39
31.7
156
Year 2
38.3
37
11.0**
150
Year 3
32.8
36
13.1
146
Year 4
-3.6
35
17.0**
140
Year 5
-2.3
35
.2
133
1997 Sample
Year 1
25.7
36
6.8**
154
Year 2
8.7
31
5.9
141
Year 3
17.3
30
15.6
130
Year 4
-1.1
29
10.0*
124
Year 5
-15.2
29
-11.2
122
Note: In difference of means tests for mean annual returns of celebrity versus other firms, *** = statistically significant at the .01 level; ** = significant at the .05 level; * = significant at the .10 level.

Table 7 Media Coverage of Scandal (S) Versus Nonscandal (NS) Firms, 1999-2002
Major Papers
Business and Finance News
Outlets
PR Newswire
S
NS
S
NS
S
NS
1999
Average # Firm Articles
372.5
630.9
1210.3
1690.0
163.4
212.9
Average # Firm and CEO Articles
26.1
27.2
76.8
84.5
10.3
7.5
Average Firm Sales ($M): S = 8421.6, NS = 6839.5
Number of Firms: S=27, NS=27
Of Firm, Average % Negative
16.3 10.2 7.3 11.7
3.3 3.9
Of Firm, Average % Mention CEO
9.0
7.7
19.3
21.2
19.5
18.2
Of CEO, Average % Negative
22.7
5.4**
7.4
10.2
8.1
2.6
Of CEO, Average % Soft News
18.8
8.8*
9.0
4.7**
2.5
8.2
2000
Average # Firm Articles
598.5
910.2
1694.5
2561.1
245.0
381.2
Average # Firm and CEO Articles
43.9
33.4
107.7
90.5
13.1
9.5
Number of Firms: S=20, NS=20
Of Firm, Average % Negative
19.9 13.0* 12.3 8.2
10.0 3.9
Of Firm, Average % Mention CEO
14.3
5.8*
22.0
16.5
12.3
12.5
Of CEO, Average % Negative
25.0
7.3***
14.6
9.6
7.3
10.3
Of CEO, Average % Soft News
20.3
12.6
12.4
9.3
10.8
11.8
2001
Average # Firm Articles
617.6
677.0
1408.7
1665.7
194.0
231.3
Average # Firm and CEO Articles
54.8
38.1
114.6
86.6
14.0
7.4*
Number of Firms: S=28, NS=28
Of Firm, Average % Negative
25.6 18.8 14.6 8.7**
6.7 2.1***
Of Firm, Average % Mention
11.1
9.4
20.5
20.3
15.3
20.2

Table 7 Media Coverage of Scandal (S) Versus Nonscandal (NS) Firms, 1999-2002
Major Papers
Business and Finance News
Outlets
PR Newswire CEO
S
NS
S
NS
S
NS
Of CEO, Average % Negative
34.6
21.6
19.8
7.8***
17.3
1.6**
Of CEO, Average % Soft News
16.2
7.5**
10.5
6.7
4.2
11.3
2002
Average # Firm Articles
2564.2
642.0
4145.1
1578.4
201.7
210.4
Average # Firm and CEO Articles
407.6
30.1**
546.7
80.7**
15.4
9.1
Number of Firms: S=27, NS=27
Of Firm, Average % Negative
52.1 24.5*** 37.7 12.8***
15.0 5.9***
Of Firm, Average % Mention CEO
24.8
4.9***
24.8
17.5
21.4
17.0
Of CEO, Average % Negative
66.3
30.4***
50.9
15.5***
33.8
5.0***
Of CEO, Average % Soft News
17.8
19.6
11.9
7.7*
7.1
4.9
Note: In difference of means tests for variable means of scandal vs nonscandal firms, *** = statistically significant at the .01 level; ** = significant at the .05 level; * = significant at the .10 level.

Table 8
Media Coverage of Enron By Month, January 2001 - January 2002
Major Paper Story Counts
Month
Enron Lead
Stories
+ Profits
+ Soft News
+ Negative News
Stock Price At Month’s End
January, 2001
92
41
9
23
$80.00 February, 2001
89
33
7
10
$68.50 March, 2001
94
33
7
17
$58.10 April, 2001
227
53
12
19
$62.72 May, 2001
195
35
9
20
$52.91 June, 2001
199
56
11
57
$49.10 July, 2001
183
40
20
35
$45.35 August, 2001
272
70
19
49
$34.99 September, 2001
219
34
21
25
$27.23 October, 2001
382
88
32
61
$13.90 November, 2001
592
289
25
202
$ 0.26 December, 2001
1408
645
93
426
$ 0.60 January, 2002
3446
1277
397
2220
.
Business and Finance News Outlets Story Counts (without PR Newswire) Month
Enron Lead
Stories
+ Profits
+ Soft News
+Negative News
January, 2001
270
96
4
43
February, 2001
283
79
12
30
March, 2001
223
93
7
24
April, 2001
306
131
5
28
May, 2001
316
81
10
34
June, 2001
287
96
13
50
July, 2001
221
93
5
47
August, 2001
297
127
20
68
September, 2001
182
56
7
32
October, 2001
390
195
11
86
November, 2001
1423
754
39
354

December, 2001 2484 1250 118 649 January, 2002
2439
1940
347
2299
Table 9
Predicting Which CEOs Will Become Involved in Scandal in 2001 - 2002,
Based on 1999 Media Coverage
Variable
(1)
(2)
Intercept
.02
(.75)
Business and Finance News Outlets, 1999
# Firm Stories
-1.0e-4 (9.5e-5)
% Firm Stories Negative
-5.25 (4.57)
% Firm Stories Mentioning CEO
-0.75 (1.65)
% CEO Stories Containing Soft News
12.05** (5.93)
Firm Sales ($M)
7.49e-6 (2.4e-5)
Log Likelihood
-29.6
N
48
Intercept
.03
(.75) Business and Finance, without PR Newswire, 1999
# Firm Stories
-1.1e-4
(1.08e-4) % Firm Stories Negative
-3.82 (4.42)
% Firm Stories Mentioning CEO
-0.87 (1.57)
% CEO Stories Containing Soft News
11.94** (5.36)
Firm Sales ($M)
1.94e-6 (2.3e-5)
Log Likelihood
-27.2
N
46
Note: Dependent variable in logit analysis =1 if firm’s CEO was the subject of a scandal in 2001 or 2002. Standard errors are in parentheses. *** = statistically significant at the .01 level; ** = significant at the .05 level; * = significant at the .10 level.

Figure 1
A Market for CEO Coverage Demand Side Factors: Audience interests create demands for different types of coverage Demand Type Targeted By Impact on Tone As Business Indicators Drop Consumer (e.g., Investor) Business Media/Major Papers Decline in investor info demand Producer (e.g., Bus. Exec) Business Media Entertainment Major Papers More soft and negative Increase in negative news coverage
Increase in profits stories Increase in CEO stories
Voter Major Paper Supply Side Factors: Company PR, including CEO interviews, lowers information costs for reporters CEO Actions Impact on Tone As Business Indicators Drop CEO credit claiming/blame shifting CEO PR mentioning profits declines
CEO PR containing soft news declines CEO PR with negative news terms increases
CEOs grant interviews in search of fame More soft news coverage (on-the-job consumption), wages, or celebrity benefits for their firms

Figure 2: Average Number of New York Times Stories Per Firm By Year, 1970-19992
100
125
150
175
200
225
250
197019
7119
7219
7319
7419
7519
7619
7719
7819
7919
8019
8119
8219
8319
8419
8519
8619
8719
8819
8919
9019
9119
9219
9319
9419
9519
9619
9719
9819
99
Year
Ave
rage
Num
ber
of S
tori
es

Figure 3: Average Number of New York Times Stories Per CEO By Year, 1970-1999
8
9
10
11
12
13
14
15
16
197019
7119
7219
7319
7419
7519
7619
7719
7819
7919
8019
8119
8219
8319
8419
8519
8619
8719
8819
8919
9019
9119
9219
9319
9419
9519
9619
9719
9819
99
Year
Ave
rage
Num
ber
of S
tori
es

Figure 4: Percent of Firm Stories in New York Times Mentioning CEOs By Year, 1970-1999
4
4.5
5
5.5
6
6.5
7
7.5
8
8.5
9
197019
7119
7219
7319
7419
7519
7619
7719
7819
7919
8019
8119
8219
8319
8419
8519
8619
8719
8819
8919
9019
9119
9219
9319
9419
9519
9619
9719
9819
99
Year
Perc
ent

Figure 5: Total Number of New York Times CEO Stories By Type, By Year, 1970 - 1999
0
200
400
600
800
1000
1200
1400
1600
197019
7119
7219
7319
7419
7519
7619
7719
7819
7919
8019
8119
8219
8319
8419
8519
8619
8719
8819
8919
9019
9119
9219
9319
9419
9519
9619
9719
9819
99
Year
Tot
al N
umbe
r of
Sto
ries
CEOProfitNegativeSoft

Figure 6: Percent of Total New York Times CEO Stories By Type, By Year, 1970 - 1999
0%
10%
20%
30%
40%
50%
60%
197019
7119
7219
7319
7419
7519
7619
7719
7819
7919
8019
8119
8219
8319
8419
8519
8619
8719
8819
8919
9019
9119
9219
9319
9419
9519
9619
9719
9819
99
Percent
Yea
r ProfitNegativeSoft

Figure 7: Total Number of CEO Stories in PR Newswire By Type, By Month, 2000 - 2003
0
500
1000
1500
2000
2500
Jan-0
0Ma
r-00
May-0
0Jul-0
0Se
p-00
Nov-0
0Jan-0
1Ma
r-01
May-0
1Jul-0
1Se
p-01
Nov-0
1Jan-0
2Ma
r-02
May-0
2Jul-0
2Se
p-02
Nov-0
2Jan-0
3Ma
r-03
May-0
3Jul-0
3Se
p-03
Nov-0
3
Month
Tot
al N
umbe
r of
Sto
ries
ProfitSoft Neg

Figure 8: Total Number of CEO Stories in New York Times, Washington Post, and USA Today By Type, By Month, 2000 - 2003
0
50
100
150
200
Jan-0
0Ma
r-00
May-0
0Jul-0
0Se
p-00
Nov-0
0Jan-0
1Ma
r-01
May-0
1Jul-0
1Se
p-01
Nov-0
1Jan-0
2Ma
r-02
May-0
2Jul-0
2Se
p-02
Nov-0
2Jan-0
3Ma
r-03
May-0
3Jul-0
3Se
p-03
Nov-0
3
Month
Tot
al N
umbe
r of
Sto
ries
CEO& Profit& Soft& Negative