Mechanistic Analysis of Rigid Pavement for … from grain to grain to the lower layer as in the case...
18
IOSR Journal of Mechanical and Civil Engineering (IOSR-JMCE) e-ISSN: 2278-1684,p-ISSN: 2320-334X, Volume 11, Issue 2 Ver. VII (Mar- Apr. 2014), PP 90-107 www.iosrjournals.org www.iosrjournals.org 90 | Page “Mechanistic Analysis of Rigid Pavement for Temperature Stresses Using Ansys” Mohd. Imran Khan. Mohd. Abdul Qadeer, A. B. Harwalkar Civil Engineering Department,Technocrat Institute of Technology, Bhopal Pin Code, 462022, Madhya Pradesh, India Civil Engineering Department, Pooja Doddappa Appa College of Engineering, Gulbarga Pin Code 585102, Karnataka, India Abstract: Finite-element analysis is not new to the pavement design and research community. Two- dimensional finite-element programs have been in use for the past two decades to analyze rigid pavement response. In recent years three dimensional finite-element (3DFE) analyses emerged as a powerful tool capable of capturing pavement response. The study of the effect of temperature variation on concrete pavement using ANSYS software was presented. ANSYS is finite element method based software. Analysis for temperature stresses has been done using both linear and non-linear temperature gradient between top and bottom of pavement slab. The results obtained using the linear temperature gradient has shown reasonable agreement with the results obtained from the three other mechanistic models: given by software KENSLABS, ILLI-SLAB and JSLAB. The result also matches with the analytical solution proposed by Bradbury. The model was used to perform parametric studies involving effect of slab length and thickness on curling stresses. High curling stresses were not only observed for long slab but also for the short slab that has a thickness of 30cm. Frictional stress value obtained by ANSYS showed reasonable agreement with the stress value given by the software package ABAQUS, and but its value was less than that given by Westergaard’s solution. The temperature stresses obtained for non-linear temperature gradient were compared with the linear temperature distribution. Non-linear temperature distribution cause higher stresses as compared with the linear temperature distribution. I. Introduction In recent years, cement concrete pavements are being adopted in many new road projects in India in view of their longer services lives, lesser maintenance requirements and smoother riding surface. The current practice of constructing concrete pavement on Indian highways is to provide a granular sub-base over the sub- grade to be followed by a Dry lean concrete base with the concrete slab on top which is called rigid pavement. Rigid pavements are those which possess flexural strength & flexural rigidity. The stresses are not transferred from grain to grain to the lower layer as in the case of flexible pavement layers. The rigid pavement are made of Portland cement concrete either plain, reinforced or prestressed concrete. The plain cement concrete slabs are expected to take up about 40kg/cm 2 flexural stress. Tensile stress are developed due to the bending of the slab under wheel loads & temperature variation. The rigid pavement consists of three components a)soil sub- grade b)base course c)cement concrete slab as shown in figure 1.1. 1.1 Types of Rigid Pavement Rigid pavements are differentiated into three major categories by their means of crack control. Jointed Plain Concrete Pavement (JPCP): This is the must common type of rigid pavement. JPCP controls cracks by dividing the pavement up into individual slabs separated by contraction joint slabs are typically one lane wide and between 3.7 m and 6.1 m long JPCP does not use any reinforcing steel but does use dowel bars and tie bars. Jointed Reinforced Concrete Pavements (JRCP): As with JPCP, JRCP controls cracks by dividing the pavement up into individual slabs separated by contraction joints. However these slabs are much longer (as long as 15 m) than JPCP slabs, so JRCP uses reinforcing steel with in each slab to control with in slab cracking. This pavement type is no longer constructed due to some long term performance problems.
Transcript of Mechanistic Analysis of Rigid Pavement for … from grain to grain to the lower layer as in the case...

IOSR Journal of Mechanical and Civil Engineering (IOSR-JMCE)
e-ISSN: 2278-1684,p-ISSN: 2320-334X, Volume 11, Issue 2 Ver. VII (Mar- Apr. 2014), PP 90-107
www.iosrjournals.org
www.iosrjournals.org 90 | Page
“Mechanistic Analysis of Rigid Pavement for Temperature
Stresses Using Ansys”
Mohd. Imran Khan. Mohd. Abdul Qadeer, A. B. Harwalkar Civil Engineering Department,Technocrat Institute of Technology, Bhopal Pin Code, 462022, Madhya Pradesh,
India
Civil Engineering Department, Pooja Doddappa Appa College of Engineering, Gulbarga Pin Code 585102,
Karnataka, India
Abstract: Finite-element analysis is not new to the pavement design and research community. Two-
dimensional finite-element programs have been in use for the past two decades to analyze rigid pavement
response. In recent years three dimensional finite-element (3DFE) analyses emerged as a powerful tool
capable of capturing pavement response. The study of the effect of temperature variation on concrete pavement using ANSYS software was
presented. ANSYS is finite element method based software. Analysis for temperature stresses has been done
using both linear and non-linear temperature gradient between top and bottom of pavement slab. The results
obtained using the linear temperature gradient has shown reasonable agreement with the results obtained from
the three other mechanistic models: given by software KENSLABS, ILLI-SLAB and JSLAB. The result also
matches with the analytical solution proposed by Bradbury. The model was used to perform parametric studies
involving effect of slab length and thickness on curling stresses. High curling stresses were not only observed
for long slab but also for the short slab that has a thickness of 30cm. Frictional stress value obtained by ANSYS
showed reasonable agreement with the stress value given by the software package ABAQUS, and but its value
was less than that given by Westergaard’s solution.
The temperature stresses obtained for non-linear temperature gradient were compared with the linear
temperature distribution. Non-linear temperature distribution cause higher stresses as compared with the linear
temperature distribution.
I. Introduction In recent years, cement concrete pavements are being adopted in many new road projects in India in
view of their longer services lives, lesser maintenance requirements and smoother riding surface. The current
practice of constructing concrete pavement on Indian highways is to provide a granular sub-base over the sub-
grade to be followed by a Dry lean concrete base with the concrete slab on top which is called rigid pavement.
Rigid pavements are those which possess flexural strength & flexural rigidity. The stresses are not
transferred from grain to grain to the lower layer as in the case of flexible pavement layers. The rigid pavement
are made of Portland cement concrete either plain, reinforced or prestressed concrete. The plain cement concrete
slabs are expected to take up about 40kg/cm2 flexural stress. Tensile stress are developed due to the bending of
the slab under wheel loads & temperature variation. The rigid pavement consists of three components a)soil sub-
grade b)base course c)cement concrete slab as shown in figure 1.1.
1.1 Types of Rigid Pavement Rigid pavements are differentiated into three major categories by their means of crack control.
Jointed Plain Concrete Pavement (JPCP):
This is the must common type of rigid pavement. JPCP controls cracks by dividing the pavement up
into individual slabs separated by contraction joint slabs are typically one lane wide and between 3.7 m and 6.1
m long JPCP does not use any reinforcing steel but does use dowel bars and tie bars.
Jointed Reinforced Concrete Pavements (JRCP):
As with JPCP, JRCP controls cracks by dividing the pavement up into individual slabs separated by
contraction joints. However these slabs are much longer (as long as 15 m) than JPCP slabs, so JRCP uses
reinforcing steel with in each slab to control with in slab cracking. This pavement type is no longer constructed
due to some long term performance problems.

“Mechanistic Analysis Of Rigid Pavement For Temperature Stresses Using Ansys”
www.iosrjournals.org 91 | Page
Continuously Reinforced Concrete Pavements (CRCP)
This type of rigid pavement uses reinforcing steel rather than contraction joints for crack control.
Transverse cracks are allowed to form but are held tightly together with continuously reinforcing steel.
Research has shown that the maximum allowable design crack width is about 0.5mm.
1.2 Temperature Stresses
Temperature stresses in a portland cement concrete (PCC) pavement can be classified into two types –
curling stresses and thermal- expansion stresses. Curling stresses result from temperature differential between
the top and bottom of a PCC pavement. This tendency to curl induces stress in the pavement as the pavement is
restrained by its weight and support pressure from the sub-grade. Depending on the position of the externally
applied load and the time of the day, curling stresses can be sufficiently high causing failure of the slab (yoder
and witczak 1975). Temperature stresses can also occur in PCC pavements as a result of uniform temperature
changes that cause the slab to contract or expand.
Whenever the top & bottom surface of a concrete pavement simultaneously possess different
temperature, the slab tends to warp down ward or upward inducing warping stress as shown in fig. 1.2.
Due to uniform temp rise & fall in the cement concrete slab, there is an overall expansion &
contraction of the slab. Since the slab is in contact with soil sub grade or the sub- base, the slab movements are
restrained due to the friction between the bottom layer of the pavement & the soil layer. The frictional resistance
therefore tends to prevent the movement thereby inducing the frictional stress in the bottom fibre of the cement
concrete pavement. Stress in slabs resulting due to this phenomenon vary with slab length.
Westergaard‟s solution has been widely used in estimating thermal stresses in curled concrete
pavement. In recent days mechanistic approach is becoming more popular for analysing pavement stresses.
Finite element technique is the generally accepted mechanistic approach since it can handle complex loading
and geometric conditions.
1.2.1 Temperature differential
The temperature gradients in slabs of concrete pavements are generally non-linear and the peak
temperature difference occurs only for a short duration.
Field observation reveal that the maximum difference in temperature between the top surface mid depth
is about twice the difference between the mid depth and the bottom of slabs and the peak temperature
differential (PTD) during the night hours is about half of the daytime PTD. Axle load stress should be
computed for fatigue analysis when the slab is in a deformed state due to the temperature differential both
during the day as well as during the night hours.
IRC guidelines for computation of warping stresses use Bradbury‟s equation which are based on
assumptions such as (i) linear temperature variation through the depth of slab (ii) slab resting on winkler
foundation and (iii) full contact between the pavement slab and the subgrade. These equations give warping
stresses, which are too high for use in pavement design.
1.2.2 Westergaard’s Concept for Temperature Stresses
Temperature stresses are developed in cement concrete pavement due to variation in slab temperature.
The variation in temperature across the depth of the slab is caused by daily variation where as an overall
increase or decrease in slab temperature is caused by seasonal variation in temperature.
Temperature thus tends to produce two types of stress in a concrete pavement these are
Warping stress (curling stresses)
Frictional stress
Warping Stresses
Whenever the top & bottom surface of a concrete pavement simultaneously possess different
temperature, the slab tends to warp down ward or upward inducing warping stress.
By the time the top temperature increases to t1 degree, the bottom temperature may be only t2 degree
the difference between the top & bottom of the slab would be (t1-t2 ) = t °C.
Assuming straight line variation in temp across the pavement depth the temp at mid depth or average
temp of slab would be (t1+ t2) /2
If the slab has no restraint then the unit elongation of the top fibres & also unit contraction of the
bottom fibre due to relative temp condition, each would be equal to Et/2 where in the thermal coefficient of
concrete westergaards workedout the stress due to the warping of concrete slab Now introducing the effect of
poisson‟s ratio the stresses at the interior region in longitudinal & transverse directions as given by Bradbury are
expressed by the following equations.

“Mechanistic Analysis Of Rigid Pavement For Temperature Stresses Using Ansys”
www.iosrjournals.org 92 | Page
St(i) = 2
tE
2
yx
1
CC
here St(i) = warping stress at interior kg/ cm2
E = modulus of elasticity of concrete kg/ cm2
= thermal coefficient of concrete per oc
t = temp difference between the top & bottom of the slab in degree c
cx = coefficient based on lx /l in desired location
cy = coefficient based on ly /l in right angle to the above direction
= poisson‟s ratio (may be taken as 0.15)
Lx & ly are the dimensions of the slab considering along x & y directions along the length & width of slab.
The value of the warping stress coefficient cx & cy for cement concrete pavement are taken from the
chart developed by Bradbuy which is shown in fig. 1.3. The warping stress at the edge region is given by st (e)
= 2
tECx or
St (e) = 2
tEC y (whichever is higher)
For corner region, warping stress is given by
St (c) =
13
tE
l
a
Here, a is radius of contact & l is the radius of relative stiffness.
Frictional stress Due to uniform temperature rise and fall in the cement concrete slab, there is an overall expansion and
contraction of the slab.
Equating total force developed in the cross section of concrete pavement due to movement & frictional
resistance due to subgrade restraint in half the length of slab.
Sf* h B 100 = B 2
L
100
hwf
Sf = 4102x
wLf
Here Sf = Unit stress developed in cement concrete pavement kg/cm2
w = Unit weight of concrete kg/cm3 (about 2400 kg/ m
3 )
f = Coefficient of sub grade restraint ( max value is about 1.5)
L =Slab length, metre
B = Slab width, metre
1.2.3 Combination of stress It is necessary to consider the conditions under which the various stresses in cement concrete pavement
would combine to given the most critical combination.
The following conditions are considered to provide the critical combinations.
1. During summer:
Critical combination of stress = (load stress + warping stress – frictional stress) at edge region.
2. During winter
Critical combination of stress = ( load stress + warping stress + frictional stress) at edge region
3. At corner region
Critical combination of stress = (load stress + warping stress) at corner regions.

“Mechanistic Analysis Of Rigid Pavement For Temperature Stresses Using Ansys”
www.iosrjournals.org 93 | Page
Fig. 1.1: Rigid pavement Fig.
1.2: Warping of cement concrete pavement slab
Fig. 1.3: Warping Stress Coefficient
II. Literature Review Teller Sutherland et al [1]
The primitive approach used for temperature stress is that given by Westergaard. Westergaard‟s
equation is based on assumption of linear temperature gradient supported on Winkler foundation and concrete
slab being linear, isotropic. Based on Westergaards solution, Bradbury arrived at a solution for a slab with finite
dimension.
Teller and Sutherland reported the results of tests conducted on concrete pavements to study the effects
of temperature variations on pavement stresses. There results showed that temperature distribution throughout
the pavement thickness is highly non-linear.
Analytical solutions for the effect of temperature stresses was also introduced by different researchers.
Based on Westergaard‟s solution other analytical solutions were introduced to solve for pavement stresses.
However majority of current analysis including that give in IRC 58 – 2002 are still limited to linear temperature
distribution.
Dan et al.[2], have studied Mathematical model of temperature changes in concrete pavements. When
concrete pavement is subjected to a change in temperature, some time must elapse before a condition of
equilibrium is again reached. In the transient heating and cooling processes that take place in the interim, there
are three basic energy transfer modes: (1) Radiant; (2) Convective; and (3) Conductive heat transfer. As a
concrete pavement‟s thermal environment changes, the physical mechanisms that underlie the heat-transfer
modes cause fluctuating temporal zones to occur within the pavement slab. For instance, during a freeze-thaw
cycle the upper portion of the pavement may be subject to thawing and refreezing while the bottom portion of
the slab remains frozen. By using a finite-difference computer model coupled with field and laboratory
observations, they discuss how the rate and depth of temperature change can be accurately predicted. Freeze-
thaw cycles in which surface scaling occurred were used to illustrate one of the different kinds of exposure
conditions that can be accurately simulated.
Eyad et al[3], studied finite-element analysis of temperature effects on plain- jointed concrete
pavements. They developed three dimensional (3D) model for four slabs separated by longitudinal and
transverse joints. The interaction between the ground and the concrete slab along with interaction at the joints
were modeled using interface elements. These elements gave the model the capability to solve for partial
contact between curled slabs and the ground to investigate the effect of compressive stresses that may develop at
the joints during curling, and to study the influence of friction between slabs and the ground. The data obtained

“Mechanistic Analysis Of Rigid Pavement For Temperature Stresses Using Ansys”
www.iosrjournals.org 94 | Page
using the finite elements model has shown reasonable agreement with the results obtained from three computer
models: KENSLABS, ILLI-SLAB,JSLAB and the analytical solution proposed by Bradbury. The best
correlation was obtained with JSLAB. The model was used to perform parametric studies on curling and
thermal-expansion stresses to study the effect of superposition of both stresses and to address the effect of
uniform temperature changes on joint opening. Another simpler model using nine layers across the depth of a
pavement slab was used to introduce the effects of nonlinear temperature distribution. The arithmetic addition
of positive curling stresses and thermal – expansion stresses were less than those stresses obtained by
superposition. In some cases, the calculated joint openings were higher than the allowable joint opening.
Nonlinear temperature distribution caused higher tensile stresses than the linear distribution of temperature. The
difference in tensile stresses between the two distributions was approximately 3-13% of the modulus of rupture
of concrete.
Gergis et al[4], reported studies on 3D finite element analysis of temperature- induced stresses in dowel jointed
concrete pavements. A detailed 3D finite element (3DFE) model was developed to investigate the applicability
of Westergaard‟s curling stress equations to doweled jointed concrete pavements. The model does not rely on
any of Westergaard‟s assumption and is capable of handling nonlinear and/or time – dependent temperature
profiles. However, only linear gradient was applied to facilitate the comparison with Westergaard‟s results. The
transverse stress calculated using Westergaard‟s formula was found to be within 10% of that computed using
3DFE. Westergaad‟s longitudinal stress equation required a correction. The 3DFE results confirm
Westergaard‟s finding that the slab curling stresses are independent of slab length. Thus curling stress does not
explain the field-observed dependency of mid-slab cracking on the slab length. Through the examination of the
mechanism of dowel- concrete interaction, it was shown that uniform temperature changes play the major role in
mid- slab transverse cracking of relatively long slabs. Due to built-in slab curling as well as temperature or
moisture curling, the dowel bars bend restricting the slab from free contraction due to uniform temperature drop.
This gives rise to a large component of stress that has not been considered in previous investigations.
Application of a combined temperature gradient and uniform temperature drop to slabs of different lengths
revealed the dependency of mid- slab transverse cracking on slab length.
Samir et al[7], reported studies on validation of 3DFE model of jointed concrete pavement response to
temperature variations. The most appropriate method to validate the thermoplastic response of a 3D finite
element (3DFE) model of dowel jointed concrete pavements subjected to temperature variation is to compare its
results with field- measured data. However field –measured strains in a concrete slab are not only due to
temperature variation but they also include components due to construction curling, shrinkage and moisture.
Such nonlinear strain contributors are not simulated in concrete constitutive models currently used in 3DFE;
thus, field- measured strains cannot be directly used to validate the thermoplastic response of 3DFE models
before some data reduction. Author presented a data reduction technique, that renders strains suitable for 3DFE
model response validation. The field-measured data were obtained from an intensively instrumented pavement
section in West Virginia. Data sets of field measured strains together with the associated temperature profiles
were presented in this study. The data can be used by engineers and researchers to validate the thermoplastic
response of any 3DFE model of jointed concrete pavements.
Shoukry et al[8], studied the validation of 3DFE analysis of rigid pavement dynamic response to
moving traffic and nonlinear temperature gradient effects. The response of dowel jointed concrete pavements to
the combined effect of nonlinear thermal gradient and moving axle load was examined using three- dimensional
finite-element (3DFE) modeling. The 3DFE-computed response to moving axle load was field validated versus
measured concrete slab response to a fully loaded moving dump truck. The 3DFE predicted slab curling due to
nonlinear thermal gradient through the slab thickness was validated versus: (1) corner- dowel bar bending as
measured using instrumented dowel embedded in an instrumented rigid pavement section in West Virginia; and
(2) Westerg
arrd‟s closed –form solution. The effects of slab thickness, slab length, axle loading position, and axle type on
slab stresses were examined. It was shown that while a negative temperature gradient reduces the intensity of
traffic- induced stresses, positive temperature gradient increases it several fold. Formulas are developed for the
computation of the peak principal stresses due to the combined effect of tandem axle load and nonlinear thermal
gradients.
William [9] studied 3D finite elements study on load transfer at doweled joints in flat and curled rigid
pavements. This study examined load transfer across doweled joints in rigid pavements using 3D finite element
analysis. A recently developed dowel modeling strategy was employed that allows the efficient and rigorous
consideration of dowel/ slab interaction. Parametric studies on the response of a typical, dowel-retrofitted
pavement system subjected to axle loads and varying degrees of slab curling were conducted. To examine the
effect of slab support on pavement response, the studies considered two different foundation types: layered
elastic with an asphalt- treated base ( ATB) and a dense liquid foundation. The results of the studies were

“Mechanistic Analysis Of Rigid Pavement For Temperature Stresses Using Ansys”
www.iosrjournals.org 95 | Page
discussed with emphasis on the effect of slab curling and foundation type on joint load transfer and the potential
for joint distress. While there are significant difference in response for the ATB-supported slabs and the slabs
founded on a dense liquid, slab curling does generally increase dowel shears and dowel/slab bearing stresses.
However further examination of the parametric study result that accounts for compressive fatigue of the
concrete at the dowel/ slab interface indicates that slab curling may not significantly increase the potential for
damage to the slab concrete surrounding the dowels.
X. P. SHI et al[10], have studied Thick-plate model for warping stresses in concrete pavements. In this study, a
new analytical solution was derived for calculating the warping stresses in concrete pavement slab. In the
analysis, they considered the pavement slab as a rectangular thick plate resting on Pasternak foundation. The
effects of transverse shear deformation and the interlocking action of subgrade were considered in calculating
the warping stresses in concrete pavement slabs. The solutions to the fundamental equations of the problem
were obtained by superposing the solutions of two elemental slabs. Each of these elemental slabs had two
guided support edges and two free edges each acted upon by an unknown bending moment. Numerical examples
were presented to compare the solutions of the proposed model with finite element solutions and the Bradhury-
Westergaard solutions. The results suggest that for common highway slab dimensions and thickness, the thick-
plate model should be used to estimate thermal warping stresses in pavement slabs with a slab width of 3.5m.
However, the conventional thin-plate model could be used for slabs with a width of 7.0 m or more without
incurring significant errors.
III. Introduction To Ansys 3.1 Finite Element Analysis:
Finite Element Analysis (FEA) was first developed in 1943 by R. Courant, who utilized the Ritz
method of numerical analysis and variation calculus to obtain approximate solutions to vibration systems. The
finite element method is a numerical procedure that can be applied to obtain approximate solutions to a variety
of problems in engineering. Steady, transient, linear, or nonlinear problems in stress analysis, heat transfer, fluid
flow, and electromagnetism problems may be analyzed with the finite element method the idea of representing a
given domain as a collection of discrete parts is not unique to the finite element method. It was recorded that
ancient mathematicians estimated the value of π by noting that the perimeter of a polygon inscribed in the circle
approximates the circumference of the latter. They predicted the value of π to accuracies of almost 40 significant
digits by representing the circle as a polygon of a finitely large number of sides. FEA systems now have
powerful graphics capabilities, automated functionality, and advanced user interfaces that make the technology
considerably faster and easier to use. These improvements notwithstanding, however, full-blown advanced FEA
still requires considerable time and the expertise of a dedicated analyst with the knowledge necessary to apply
proper mesh densities, element types, and boundary conditions. These expert analysts also must know how to go
about translating CAD geometry into proper format for building the FEA model as well as correctly interpreting
plots and other output information.
.
IV. Finite Element Modeling 4.1 Model Description for Comparison of Curling Stress with Other Mechanistic Models
In this study, a 3-dimensional finite element model for concrete pavement system has been developed.
For this, the structural analysis package „ANSYS‟ (Version 10.0) has been used. A 3-D brick element SOLID
45, having 8 nodes with three degrees of freedom per node translations in the nodal x, y and z directions, were
used to model the concrete slab as well as the base.
For all models, it was assumed that the concrete slab is 6.1m long and 3.7m wide which has a modulus
of elasticity of 34.5 x 10³ N/mm
2, a poison‟s ratio of 0.2, a coefficient of thermal expansion of 9 x 10
-6/°C, a
positive temperature gradient of 0.66°C/cm and a negative temperature gradient of -0.33°C/cm. Three different
slab thickness of 20.32cm, 25.40cm & 35.56cm were used. The following properties were used for base: a
poisons ratio of 0.3 and modulus of elasticity 153 N/mm², 181 N/mm2 and 233 N/mm
2 for slab thickness of
20.32cm 25.40cm & 35.56cm respectively.
A comparison was conducted between the results obtained by the finite-element model developed in
the ANSYS and three different computer programs: KENSLABS (Huang 1993), ILLI-SLAB (Tabatabaie 1977),
JSLAB (Tayabji and Colley 1986) which are reported in the paper by Eyad et al.[2] and the analytical model
proposed by Bradbury (1938).
4.2 Model Description for Parametric Study
A parametric study has been conducted to study the effect of slab length and slab thickness on positive
curling stresses and negative curling stress.

“Mechanistic Analysis Of Rigid Pavement For Temperature Stresses Using Ansys”
www.iosrjournals.org 96 | Page
A 3-D brick element SOLID 45, having 8 nodes with three degrees of freedom per node translations in
the nodal x, y and z directions, are used to model the concrete slab as well as the base.
The various parameters used in the study were
Modulus of elasticity E = 15 x 10³ Mpa,
Slab length – L1 = 4m, L2 = 6m, & L3 = 8m
Slab width = 3.5m
Slab thickness – H1 = 18cm, H2 = 24cm, & H3 = 30 cm
Ground unit weight = 21 kN/m³
Positive curling temperature differential (temperature at the top of slab is higher than that at the bottom) T1 =
5.6°C, T2 = 8.3°C and T3 = 11.1°C.
Negative curling temperature differential (temperature at the bottom of slab is higher than that at the top) T1 =
2.8°C, T2 = 5.6°C and T3 = 8.3°C.
1. Concrete properties: Modulus of elasticity = 27.6 x10⁹ N/mm², poison‟s ratio = 0.15 and unit weight =
24 kN/m3
4.3 Model description for frictional stresses
A 3-D brick element SOLID 45, having 8 nodes with three degrees of freedom per node translations in
the nodal x, y and z directions, are used to model the concrete slab as well as the base.
The various parameters used in the study were
1. Modulus of elasticity E = 15 x 10³ Mpa,
2. Slab length – L = 4m
3. Slab width = 3.5m
4. Slab thickness – H = 24cm
5. Ground unit weight = 21 kN/m³
6. Friction factor = 3
7. Uniform temperature = 16.7°C
8. Concrete properties: Modulus of elasticity = 27.6 x10⁹ N/mm², poison‟s ratio = 0.15 and unit weight = 24
kN/m3
Comparison of frictional stress value was done between the result obtained by the finite element model
developed in the ANSYS and result of ABAQUS software[3].
4.4 Model Description for Effect of Non-Linear Temperature Distribution
To study the effect of non-linear temperature distribution a 3-D brick element solid 45, having 8 nodes
with 3 degree of freedom per node – translations in the nodal x, y & z directions were used to model the
concrete slab and slab is meshed for 4 layers .The base is modeled as a winkler foundation that consists of a bed
of closely spaced independent linear springs. Each spring deforms in response to the vertical load applied
directly to that spring and is independent of any shear force transmitted from adjacent areas in the foundations.
Spring element namely COMBIN 14 were used to represent the winkler foundation which had three degree of
freedom at each node translations in the nodal x, y, & z directions. The effective normal stiffness of the element
is taken from the IRC 58 – 2002.
The slab dimension and properties were 4.5m long and 3.7m wide and having thickness 150mm,
200mm, 250mm and 300mm Correspondingly temperature differentials values were 16.3, 19, 20.3 & 21°C,
modulus of elasticity of concrete – 30,000 N/mm², poison ratio 0.15, density – 24 kN/m³, thermal expansion =
10 x 10-6
per °C and modulus of sub-grade reaction k = 6 x 10⁷ N/m
3. The details of properties and load
application is shown in table 4.1.
4.5 Temperature Load
The temperature values are introduced to the model using the ANSYS software package. For solid
elements used in this model, only one temperature value is needed at each node. In the comparison of curling
stress and parametric study, linear temperature distribution was assumed through the slab depth to solve for
curling stresses.
To study the effect of non-linear temperature distribution, the data presented in IRC 58-2002 was used
to give top and bottom temperature. Then within the thickness of slab different temperature values have been
given assuming different temperature gradient for different layers.

“Mechanistic Analysis Of Rigid Pavement For Temperature Stresses Using Ansys”
www.iosrjournals.org 97 | Page
V. Results And Discussion 5.1 Comparison of Curling Stress with Other Mechanistic Models
Slab is analysed for both positive temperature gradient (temperature at, the top of slab is higher than
that at the bottom) and negative temperature (temperature at the bottom of slab is higher than that at the top).
For positive temperature gradient a value of 0.66°C/cm depth of slab and for negative temperature gradient a
value of 0.33°C/cm depth of slab was selected. The three slab thickness selected for analysis were 20.32 cm,
25.54cm & 35.56cm.
It assumed that the temperature varies linearly across the depth of slab. The slab deflects more at the
corner than at the interior. The deflected shape for this case of positive temperature gradient temperature is
shown in plate 5.4. Correspondingly the temperature distribution is shown in plate 5.4. The deflected shape for
negative temperature gradient is shown in plate 5.6 and correspondingly temperature distribution is shown in
plate 5.6.
Table 5.1 shows the comparison of curling stresses obtained by the finite element model developed in
the ANSYS and the other three different computer program: KENSLAB, (Huang 1993), ILLI- SLAB
(Tabatabaie 1977), JSLAB (Tayabji and Colley 1986) and the analytical model proposed by Bradbury (1938).
Plate 5.3 and 5.5 shows the contour of positive curling and negative curling stress. The ANSYS results shows
reasonable agreement with the results of other three computer programs.
5.2 Parametric study
5.2.1 Effect of slab length on curling stresses
Table 5.2 show the effect of slab length on positive curling stresses. From the table it was observed that as the
temperature increases the stress and deflection also increase but under a particular positive curling (temperature
at the top of a slab is higher than that at the bottom) as the slab length increase, the stress will remain
approximately constant. But the deflection of slab will increase. The stress, deflected shape and positive
temperature distribution is a shown in plate 5.8 and 5.9.
The maximum stress obtained for a slab length of 8m under a positive curling temperature of 11.1oC was
1.11N/mm2 and a deflection of about 3.868mm.
Table 5.3 show the effect of slab length on negative curling stresses, from the table it is observed that as the
temperature increases the stress and deflection also increase but under a particular negative curling (temperature
at the bottom of a slab is higher than that at the top) as the slab length increase, the stress will remain
approximately constant. But the deflection of slab will increase. The deflected shape and negative temperature
distribution is a shown in plate 5.10 and 5.11.
The maximum stress is obtained for a slab length of 8m under a negative curling temperature of 8.3oC is 0.825
N/mm2 and a deflection of about 2.84mm. The contour of stress for this case is show in plate 5.10
5.2.2 Effect of slab thickness on curling stresses
The effect of slab thickness on positive gradient is shown in table 5.4 from the table it can be observed
that, as the temperature gradient increase the stress and deflection also increase. On the other hand under a
particular temperature gradient as the slab thickness increases the stress and deflection also increases. The
deflected shape and positive gradient is show in plate 5.12 and 5.13.
The maximum positive curling stress is obtained for a slab thickness of 300mm under a positive temperature
gradient of 0.463oC/cm was 1.38 N/mm
2 and a deflection of 1.673mm. The contour of stress for this case is
show in plate 5.12.

“Mechanistic Analysis Of Rigid Pavement For Temperature Stresses Using Ansys”
www.iosrjournals.org 98 | Page
The effect of slab thickness when used negative gradient, is shown in table 5.5. From the table it can be
observed that as the temperature gradient increase the stress and deflection also increase on the other hand,
under a particular temperature gradient as the slab thickness increases the stress and deflection also increases.
The deflected shape and negative gradient is show in plate 5.14 and 5.15.
The maximum negative curling stress is obtained for a slab thickness of 300mm under a negative temperature
gradient of 0.346oC/cm was 1.03N/mm
2 and a deflection of 1.303mm. The contour of stress for this case is
shown in plate 5.14.
5.3 Frictional Stresses Due to Uniform Change in Temperature
Frictional stress was calculated for a typical case of slab of length 4m using ANSYS. The result was
compared with the value given by ABAQUS software [3] and with that given by westergaard‟s equation. The
comparison is shown in table 5.6. From the result it was observed that the value obtained from ANSYS closely
agrees with that given by ABAQUS, but westergaard‟s equation gives a much higher value. From the analysis it
was observed that the frictional stress value was dependent on the uniform temperature differential value used
and its value increases with the increase in uniform temperature change. But westergaard‟s equation is
independent of uniform temperature differential value. The contour of stress for uniform change in temperature
is shown in plate 5.15.
5.4 Curling stresses Due to Non-Linear Temperature Gradient
The comparison of stresses for linear temperature distribution and non-linear temperature distribution
is shown in table 5.6. It can be observed that for both linear and non- linear temperature distribution, as the
thickness of slab and temperature increases, stress also increases. It was observed from the results that non-
linear temperature gradient resulted in higher curling stresses than that given by linear temperature gradient. The
percentage difference in the stress values for two case varied between 18.95% and 23.65%.
The contour of stresses for linear temperature distribution, deflected shape and linear temperature distribution is
as shown in the plate 5.17 & 5.18. The contour of stresses for non-linear temperature distribution, deflected
shape and non-linear temperature distribution is as shown in the plate 5.19 and 5.20.
Table 5.2: Effect of slab length on positive curling stresses Slab
dimensions in
m
Positive curling
temperature °C
Stress in
N/mm²
Deflection in
mm
4 x 0.24 x 3.5 5.6 0.558 1.095
8.3 0.827 1.626
11.1 1.110 2.169
6 x 0.24 x 3.5 5.6 0.557 1.546
8.3 0.826 2.29
11.1 1.110 3.063

“Mechanistic Analysis Of Rigid Pavement For Temperature Stresses Using Ansys”
www.iosrjournals.org 99 | Page
8 x 0.24 x 3.5 5.6 0.556 1.951
8.3 0.824 2.892
11.1 1.110 3.868
Table 5.3: Effect of slab length on negative curling stresses Slab
dimensions in
m
Negative
curling
temperature °C
Stress in
N/mm²
Deflection in
mm
4 x 0.24 x 3.5 2.8 0.279 0.762
5.6 0.558 1.524
8.3 0.827 2.260
6 x 0.24 x 3.5 2.8 0.278 0.718
5.6 0.557 1.436
8.3 0.826 2.128
8 x 0.24 x 3.5 2.8 0.278 0.959
5.6 0.556 1.918
8.3 0.824 2.844
Table 5.5: Effect of slab thickness on Negative curling stresses Slab
dimensions in
m
Negative
gradient
°C/cm
Stress in
N/mm²
Deflection in
mm
4 x 0.18 x 3.5 0.117 0.209 1.197
0.233 0.418 2.386
0.346 0.620 3.551
4 x 0.24 x 3.5 0.117 0.278 0.718
0.233 0.558 1.524
0.346 0.827 2.26
4 x 0.3 x 3.5 0.117 0.349 0.441
0.233 0.696 0.877
0.346 1.03 1.303

“Mechanistic Analysis Of Rigid Pavement For Temperature Stresses Using Ansys”
www.iosrjournals.org 100 | Page
Table 5.6: Frictional stress due to uniform change in temperature Slab
dimension
in m
Uniform in
temperature
°C
Stress in N/mm²
ABAQUS
software* ANSYS
Westergaard’s
solution
4 x 0.24 x 3.5
16.7 0.022 0.0209 0.144
* Taken from the work of Eyad et al [3]
Table 5.7: Effect of non-linear temperature distribution on stresses
0
0.2
0.4
0.6
0.8
1
1.2
4 6 8Slab Length (m)
Ma
xim
um
Str
es
se
s (
N/m
m²)
Positive Curling Temp = 5.6°C Positive Curling Temp = 8.3°C
Positive Curling Temp =11.1°C
Fig. 5.1: Effect of slab length on positive curling stresses
0
0.1
0.2
0.3
0.4
0.5
0.6
0.7
0.8
0.9
4 6 8Slab Length (m)
Ma
xim
um
Str
es
se
s (
N/m
m²)
Negative Curling Temp = 2.8°C Negative Curling Temp = 5.6°C
Negative Curling Temp = 8.3°C
Fig. 5.2: Effect of slab length on negative curlingstresses
0
0.2
0.4
0.6
0.8
1
1.2
1.4
1.6
180 240 300
Slab thickness (mm)
Ma
xim
um
Str
es
se
s (
N/m
m²)
Positive Gradient = 0.233°C/cm Positive Gradient = 0.346°C/cm
Positive Gradient = 0.463°C/cm Fig. 5.3: Effect of slab thickness on positive curling stresses

“Mechanistic Analysis Of Rigid Pavement For Temperature Stresses Using Ansys”
www.iosrjournals.org 101 | Page
0
0.2
0.4
0.6
0.8
1
1.2
180 240 300
Slab thickness (mm)
Ma
xim
um
Str
es
se
s (
N/m
m²)
Negative Gradient = 0.117°C/cm Negative Gradient = 0.233°C/cm
Negative Gradient = 0.346°C/cm Fig. 5.4: Effect of slab thickness on negative curling stresses
0
0.2
0.4
0.6
0.8
1
1.2
1.4
150 200 250 300
Slab thickness in mm
Ma
xim
um
str
es
se
s (
N/m
m²)
Linear Temperature
Distribution
Non-Linear Temperature
Distribution
Fig. 5.5: Comparison of stresses of linear temperature distribution and non-linear
temperaturedistribution
PAVEMENT MODEL
Plate 5.1: Positive curling stresses pavement model of dimension 6.1 x 0.2032 x 3.7m
Plate 5.2: Pavement model after meshing

“Mechanistic Analysis Of Rigid Pavement For Temperature Stresses Using Ansys”
www.iosrjournals.org 102 | Page
Plate 5.3: Contour of positive curling stresses
Plate 5.4: Deflected shape and positive curling temperature distribution
Plate 5.5: Contour of negative curling stresses
Plate 5.6: Deflected shape and negative curling temperature distribution

“Mechanistic Analysis Of Rigid Pavement For Temperature Stresses Using Ansys”
www.iosrjournals.org 103 | Page
Plate 5.7: Contour of positive curling stresses of slab length 8m
Plate 5.8: Deflected shape and positive curling temperature distribution of slab length 8m
`
Plate 5.9: Contour of negative curling stresses of slab length 8m

“Mechanistic Analysis Of Rigid Pavement For Temperature Stresses Using Ansys”
www.iosrjournals.org 104 | Page
Plate 5.10: Deflected shape and negative curling temperature distribution of slab length 8m
Plate 5.11: Contour of positive curling stresses of slab thickness 300mm
Plate 5.12: Deflected shape and positive temperature distribution of slab thickness 300mm
Plate 5.13: Contour of negative curling stresses of slab thickness 300mm

“Mechanistic Analysis Of Rigid Pavement For Temperature Stresses Using Ansys”
www.iosrjournals.org 105 | Page
Plate 5.14: Deflected shape and negative temperature distribution of slab thickness 300mm
Plate 5.15: Contour of frictional stress due to uniform temperature
Plate 5.16: Pavement model of slab thickness 250mm for linear temperature and non-linear distribution
Plate 5.17: Contour of positive curling stresses of pavement model thickness 250mm for linear
temperature distribution
“Mechanistic Analysis Of Rigid Pavement For Temperature Stresses Using Ansys”
www.iosrjournals.org 106 | Page
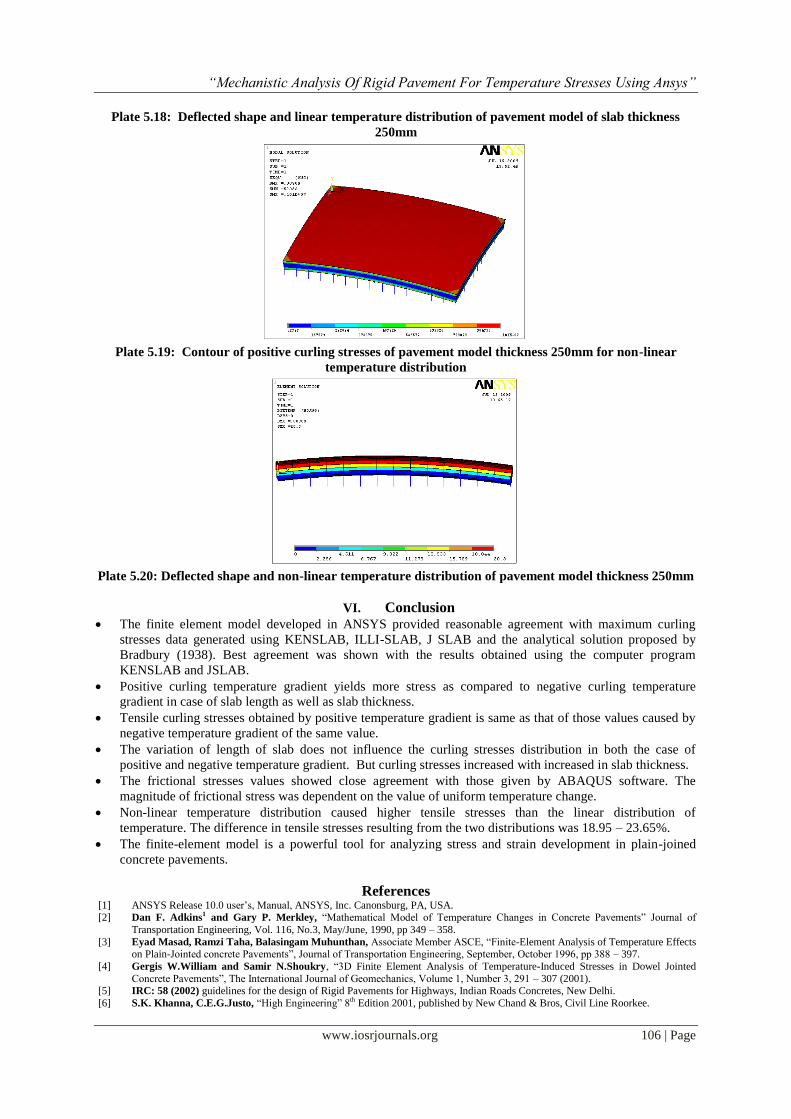
Plate 5.18: Deflected shape and linear temperature distribution of pavement model of slab thickness
250mm
Plate 5.19: Contour of positive curling stresses of pavement model thickness 250mm for non-linear
temperature distribution
Plate 5.20: Deflected shape and non-linear temperature distribution of pavement model thickness 250mm
VI. Conclusion
The finite element model developed in ANSYS provided reasonable agreement with maximum curling
stresses data generated using KENSLAB, ILLI-SLAB, J SLAB and the analytical solution proposed by
Bradbury (1938). Best agreement was shown with the results obtained using the computer program
KENSLAB and JSLAB.
Positive curling temperature gradient yields more stress as compared to negative curling temperature
gradient in case of slab length as well as slab thickness.
Tensile curling stresses obtained by positive temperature gradient is same as that of those values caused by
negative temperature gradient of the same value.
The variation of length of slab does not influence the curling stresses distribution in both the case of
positive and negative temperature gradient. But curling stresses increased with increased in slab thickness.
The frictional stresses values showed close agreement with those given by ABAQUS software. The
magnitude of frictional stress was dependent on the value of uniform temperature change.
Non-linear temperature distribution caused higher tensile stresses than the linear distribution of
temperature. The difference in tensile stresses resulting from the two distributions was 18.95 – 23.65%.
The finite-element model is a powerful tool for analyzing stress and strain development in plain-joined
concrete pavements.
References [1] ANSYS Release 10.0 user‟s, Manual, ANSYS, Inc. Canonsburg, PA, USA. [2] Dan F. Adkins1 and Gary P. Merkley, “Mathematical Model of Temperature Changes in Concrete Pavements” Journal of
Transportation Engineering, Vol. 116, No.3, May/June, 1990, pp 349 – 358.
[3] Eyad Masad, Ramzi Taha, Balasingam Muhunthan, Associate Member ASCE, “Finite-Element Analysis of Temperature Effects on Plain-Jointed concrete Pavements”, Journal of Transportation Engineering, September, October 1996, pp 388 – 397.
[4] Gergis W.William and Samir N.Shoukry, “3D Finite Element Analysis of Temperature-Induced Stresses in Dowel Jointed
Concrete Pavements”, The International Journal of Geomechanics, Volume 1, Number 3, 291 – 307 (2001). [5] IRC: 58 (2002) guidelines for the design of Rigid Pavements for Highways, Indian Roads Concretes, New Delhi.
[6] S.K. Khanna, C.E.G.Justo, “High Engineering” 8th Edition 2001, published by New Chand & Bros, Civil Line Roorkee.

“Mechanistic Analysis Of Rigid Pavement For Temperature Stresses Using Ansys”
www.iosrjournals.org 107 | Page
[7] Samir N.Shoukry, Gergis W.william and Mourad Y.Raid, “Validation of 3DFE Model of Jointed Concrete Pavement Response
to Temperature Variations”, the International Journal of Pavement Engineering, Vol. 5 (3) September 2004, pp 123 – 136. [8] S.N.Shoukry, M.Fahmy, J.Prucz, and G.William, “Validation of 3DFE Analysis of Rigid Pavement Dynamic Resposne to
Moving Traffic and Nonlinear Temperature Gradient Effects”, International Journal of Geomechanics © ASCE / January/February
2007, pp 16-24. [9] William G.Davids, “3D Finite Element Study on Load Transfer at Doweled Joints in Flat and Curled Rigid Pavements”, The
International Journal of Geomechanics, Vol. 1, Number 3, 309 – 323 (2001).
[10] X. P. Shi, T. F. Fwa, Y. Hu and J. Zhang, “Thick-Plate Model For Warping Stresses In Concrete Pavements”, International Journal Pavement Enginereing, 2000, Vol. 1 (2), pp 107 – 117.