Mechanics of airflow in the human nasal airways · Respiratory Physiology & Neurobiology 163...
11
Respiratory Physiology & Neurobiology 163 (2008) 100–110 Contents lists available at ScienceDirect Respiratory Physiology & Neurobiology journal homepage: www.elsevier.com/locate/resphysiol Mechanics of airflow in the human nasal airways D.J. Doorly a,∗ , D.J. Taylor a,b , R.C. Schroter b a Department of Aeronautics, Imperial College London, Exhibition Road, London SW7 2AZ, UK b Department of Bioengineering, Imperial College London, London SW7 2AZ, UK article info Article history: Accepted 30 July 2008 Keywords: Nasal airways Computational biomechanics Physiological flows Particle image velocimetry abstract The mechanics of airflow in the human nasal airways is reviewed, drawing on the findings of experimental and computational model studies. Modelling inevitably requires simplifications and assumptions, partic- ularly given the complexity of the nasal airways. The processes entailed in modelling the nasal airways (from defining the model, to its production and, finally, validating the results) is critically examined, both for physical models and for computational simulations. Uncertainty still surrounds the appropriateness of the various assumptions made in modelling, particularly with regard to the nature of flow. New results are presented in which high-speed particle image velocimetry (PIV) and direct numerical simulation are applied to investigate the development of flow instability in the nasal cavity. These illustrate some of the improved capabilities afforded by technological developments for future model studies. The need for further improvements in characterising airway geometry and flow together with promising new methods are briefly discussed. © 2008 Elsevier B.V. All rights reserved. 1. Introduction In all mammals, the upper airway is the portal to the respiratory system and all respired air passes through it on both inspiration and expiration. The upper airway is a complicated structure com- prising the mouth and nasal passages placed in parallel, with the nose itself containing two parallel pathways for airflow. Virtually all mammals are obligatory nose breathers; however, at other than relatively low respiratory flow rates, humans and other primates usually breathe preferentially via the mouth (Proctor, 1986). Ven- tilation is not only cyclical within the upper airway, but usually unequally divided between the two nasal cavities, with the bias of flow alternating between sides over a period of time – the nasal cycle (Eccles, 2000) – that is orders of magnitude larger than a sin- gle respiratory cycle. Within the passages of the airway, flow is thus time dependent on both long and short time scales. The gross architecture of the nasal cavities varies considerably between species (Negus, 1958) for many possible reasons, but par- ticularly to accommodate differing head and jaw shapes associated with eating demands. Consequently, the internal airflow conditions vary considerably between species and in order to understand the details of the airflow and transport properties in the human nose it is important to focus studies explicitly on the human. ∗ Corresponding author. Tel.: +44 207 594 5049. E-mail address: [email protected] (D.J. Doorly). The principal physiological function of the nose is to heat and humidify inhaled air (see review in this issue by Elad et al., 2008) and remove noxious materials from the air stream, protecting the delicate distal pulmonary structures. The nose also contains the olfactory apparatus to enable smelling of substances for benefi- cial or defence purposes (Proctor, 1977). Summary descriptions of the anatomy, physiology and function of the human nasal airways may be found in many works, see for example Mygind and Dahl (1998). The comprehensive text of Lang (1989) includes numerous images of dissections of the airways, compilations of the dimen- sions of notable anatomical features, and descriptions of variations in morphology. The technical challenges posed by the task of obtaining detailed, spatially resolved, in vivo measurements of the conditions within the nasal airways have yet to be overcome. This is due, not only, to the tortuous geometry of the passages, their narrowness and bio- logical responsiveness to touch, but because any inserted probe is likely to cause perturbations in the flow and introduce experimen- tal artefact. In vivo measurement of functional parameters, such as pressure drop, humidification or noxious gas uptake, is essen- tially restricted to global information based on measurements up- and down-stream of the airway. Internal details are interpreted from this data; however, the complexity of the conduit morphol- ogy means that such implied distributed information is based on surmise. To improve our understanding of nasal function, it is necessary to undertake model studies in which experimental exploration of distributed function can be made explicitly. However, modelling 1569-9048/$ – see front matter © 2008 Elsevier B.V. All rights reserved. doi:10.1016/j.resp.2008.07.027
Transcript of Mechanics of airflow in the human nasal airways · Respiratory Physiology & Neurobiology 163...

M
Da
b
a
A
KNCPP
1
sapnarutuflcgt
btwvdi
1d
Respiratory Physiology & Neurobiology 163 (2008) 100–110
Contents lists available at ScienceDirect
Respiratory Physiology & Neurobiology
journa l homepage: www.e lsev ier .com/ locate / resphys io l
echanics of airflow in the human nasal airways
.J. Doorlya,∗, D.J. Taylora,b, R.C. Schroterb
Department of Aeronautics, Imperial College London, Exhibition Road, London SW7 2AZ, UKDepartment of Bioengineering, Imperial College London, London SW7 2AZ, UK
r t i c l e i n f o
rticle history:Accepted 30 July 2008
eywords:asal airways
a b s t r a c t
The mechanics of airflow in the human nasal airways is reviewed, drawing on the findings of experimentaland computational model studies. Modelling inevitably requires simplifications and assumptions, partic-ularly given the complexity of the nasal airways. The processes entailed in modelling the nasal airways(from defining the model, to its production and, finally, validating the results) is critically examined, both
omputational biomechanicshysiological flowsarticle image velocimetry
for physical models and for computational simulations. Uncertainty still surrounds the appropriatenessof the various assumptions made in modelling, particularly with regard to the nature of flow. New resultsare presented in which high-speed particle image velocimetry (PIV) and direct numerical simulation areapplied to investigate the development of flow instability in the nasal cavity. These illustrate some ofthe improved capabilities afforded by technological developments for future model studies. The need forfurther improvements in characterising airway geometry and flow together with promising new methods
hadoctm(isi
sttllta
are briefly discussed.
. Introduction
In all mammals, the upper airway is the portal to the respiratoryystem and all respired air passes through it on both inspirationnd expiration. The upper airway is a complicated structure com-rising the mouth and nasal passages placed in parallel, with theose itself containing two parallel pathways for airflow. Virtuallyll mammals are obligatory nose breathers; however, at other thanelatively low respiratory flow rates, humans and other primatessually breathe preferentially via the mouth (Proctor, 1986). Ven-ilation is not only cyclical within the upper airway, but usuallynequally divided between the two nasal cavities, with the bias ofow alternating between sides over a period of time – the nasalycle (Eccles, 2000) – that is orders of magnitude larger than a sin-le respiratory cycle. Within the passages of the airway, flow is thusime dependent on both long and short time scales.
The gross architecture of the nasal cavities varies considerablyetween species (Negus, 1958) for many possible reasons, but par-icularly to accommodate differing head and jaw shapes associatedith eating demands. Consequently, the internal airflow conditions
ary considerably between species and in order to understand theetails of the airflow and transport properties in the human nose it
s important to focus studies explicitly on the human.
∗ Corresponding author. Tel.: +44 207 594 5049.E-mail address: [email protected] (D.J. Doorly).
tafos
td
569-9048/$ – see front matter © 2008 Elsevier B.V. All rights reserved.oi:10.1016/j.resp.2008.07.027
© 2008 Elsevier B.V. All rights reserved.
The principal physiological function of the nose is to heat andumidify inhaled air (see review in this issue by Elad et al., 2008)nd remove noxious materials from the air stream, protecting theelicate distal pulmonary structures. The nose also contains thelfactory apparatus to enable smelling of substances for benefi-ial or defence purposes (Proctor, 1977). Summary descriptions ofhe anatomy, physiology and function of the human nasal airways
ay be found in many works, see for example Mygind and Dahl1998). The comprehensive text of Lang (1989) includes numerousmages of dissections of the airways, compilations of the dimen-ions of notable anatomical features, and descriptions of variationsn morphology.
The technical challenges posed by the task of obtaining detailed,patially resolved, in vivo measurements of the conditions withinhe nasal airways have yet to be overcome. This is due, not only, tohe tortuous geometry of the passages, their narrowness and bio-ogical responsiveness to touch, but because any inserted probe isikely to cause perturbations in the flow and introduce experimen-al artefact. In vivo measurement of functional parameters, suchs pressure drop, humidification or noxious gas uptake, is essen-ially restricted to global information based on measurements up-nd down-stream of the airway. Internal details are interpretedrom this data; however, the complexity of the conduit morphol-
gy means that such implied distributed information is based onurmise.To improve our understanding of nasal function, it is necessaryo undertake model studies in which experimental exploration ofistributed function can be made explicitly. However, modelling

logy & Neurobiology 163 (2008) 100–110 101
iraei
iaccarotf
2
•
•
racbctwyt
etb–Csmsgtin2ia
(
Fig. 1. Models of the nasal airway, both of an anatomical replica (A) and intentionallysimplified (B). The distribution of wall shear stress (Pa) is depicted in the floodedcontours and the direction of near wall flow is indicated using surface streamlines.Beneath each model, slices through the computational domain depict the shape ofthe airways and distribution of velocity (m s−1) for a constant flow rate of 0.1 L s−1.(C) Depicts a 2D plot of the variation in cross-sectional area, CSA (cm2), with inter-cpn
(
(
faaOt(ncst
tinsphp
D.J. Doorly et al. / Respiratory Physio
ntroduces simplifications which may lead to uncertainty or inaccu-acy in translation of the findings back to real life. Both physiologistsnd modellers need to be fully aware of the shortcomings of mod-lling in order to make properly informed interpretations of thenformation obtained in such studies.
The aim of this review is to provide a critical evaluation ofssues involved in modelling airflow in the human nose. The naturend quality of experimental data obtained via model studies areonsidered, and the potential of newer techniques to improve spe-ific aspects of modelling are discussed. Rather than attemptingn exhaustive literature critique, references are made frequently toecently published papers containing useful, broad, critical reviewsf a particular topic, or which provide an account of the applica-ion of particular techniques, that may be used to explore the fieldurther.
. Model definition and production
Two generic groups of models are considered in this review:
Physical models – life size, or enlarged – (including: Proetz, 1951;Swift and Proctor, 1977; Girardin et al., 1983; Hornung et al.,1987; Hahn et al., 1993; Guilmette et al., 1998; Horschler et al.,2006; Hopkins et al., 2000; Weinhold and Mlynski, 2004; Kimand Chung, 2004; Kim et al., 2006; Taylor et al., 2005);Computational models—(including: Keyhani et al., 1995, 1997;Subramaniam et al., 1998; Horschler et al., 2003; Zhao et al., 2006;Kleven et al., 2005; Zhang and Kleinstreuer, 2004; Lindemannet al., 2004; Naftali et al., 1998; Wexler et al., 2005; Shi et al.,2006, 2007; Franke et al., 2005; Doorly et al., 2008b; Wen et al.,2008; models of pathological airways include Garcia et al., 2007;Lindemann et al., 2005a,b).
The creation of any model, either physical or computational,equires first the identification and definition of the airway bound-ry. In reality, the airway boundary is time varying, possiblyompliant at elevated flow rates and covered for the most party a thin film of mucus. Furthermore, structures outside the nasalavity itself affect the flow dynamics within it; during inspiration,he shape of the external nose influences flow entering the nares,hilst during expiration, the airway geometry below the nasophar-
nx is impressed on the exhaled flow. No model has yet attemptedo incorporate fully all these features.
Moreover a wide variety of nasal morphologies exists, so thatven an individual perfectly realistic model can only provide par-ial information. A good example of such variability is the transitionetween the nasal vestibule and the nasal cavity – the nasal valvewhich normally corresponds to a minimum (sometimes denotedSA-min) in the curve of cross-sectional area (CSA) variation ver-us flow path length (Fig. 1). The degree and the location of theaximal restriction are not fixed (c.f. Cole, 2000) as erectile tis-
ues are found on both turbinates, and the septum, allowing theeometry to vary due to mucosal engorgement. The degree of con-raction imposed on the flow at the nasal valve is known to be anmportant determining factor of both overall resistance and theature of the cavity flow (c.f. Schreck et al., 1993; Taylor et al.,008a), and should therefore be quoted in all model studies. Typ-
cal in vivo values and ranges of the valve area in healthy adultsre:
a) Numminem (2003) – quoting Márquez Dorsch et al. (1996) –using acoustic rhinometry (AR) on Caucasian subjects, give anon-decongested mean area of 0.68 cm2 (range 0.44–1.17 cm2),versus a decongested mean of 0.78 cm2 (range 0.46–1.23 cm2);
rravfl
entroid distance, X (cm), for both geometries. Note: the locations of the slicinglanes are indicated for later reference; slices 1 and 5 denote the location of theasal valve and opening to the nasopharynx, respectively.
b) Cakmak et al. (2003), compared nasal valve areas evaluated byAR and by CT in 25 adults, decongested prior to examination;using AR they found the minimum area to range from 0.46 cm2
to 1.13 cm2, whilst with CT, the range was 0.54–1.21 cm2;c) Shaida and Kenyon (2000), using AR quote a mean valve area of
0.63 cm2, and a mean location as approximately 2.3 cm from theexternal naris, along the acoustic (effectively mean flow) path.
Both inter-population and inter-subject variations have beenound. For instance, adaptation to climate is widely regarded to because of underlying differences in nasal form between individu-
ls of differing ancestral origin (e.g. Carey and Steegmann, 1981).hki et al. (1991) compared measurements of nasal airway resis-
ance in different racial groups and more recently Suzina et al.2003) reported corresponding measurements in a cohort of 85on-Caucasian (Malay) subjects. Churchill et al. (2004) observedonsiderable random variations in morphology (such as relativeize of the nasal valve, naris orientation and degree of projection ofhe turbinates) in a limited study of 10 Caucasian individuals.
The variations in three-dimensional morphology resulting fromhe nasal cycle have yet to be mapped. Furthermore, in addition tontra-individual temporal variations between left and right sidedoses due to the nasal cycle (Eccles, 2000; Hanif et al., 2000), tran-ient variations in nasal airway morphology, which might influencehysiological mechanics, may also occur due to flow limitation atigher inspiratory rates. Using acoustic rhinometry coupled withosterior rhinomanometry, Fodil et al. (2005) reported transient,egionally averaged variations in passage area at high inspiratory
ates. Aside from the obvious external alar collapse, they drawttention to collapse deeper within the airways; differences in fixedersus compliant airway geometries were less than 20% at lowerow rates (inspiratory pressure drops of less than 30 Pa).
1 logy &
adbcwcSS
msbos(ummfl
bidMnu
apefigh1t
bpeecaCetsdi
aagwofpp
vmbsr
rKma(amsrcfliuaf
tfiiaiiesnt2et
mcSftchtiiimtmbG
Tatataspocu
p
02 D.J. Doorly et al. / Respiratory Physio
Even with the assumption of a rigid airway, the tasks of definingnd reproducing a reasonable constant geometry are challengingue to the anatomical complexity. A straightforward route followedy previous studies either used cadaveric noses directly, or involvedasting of cadaver noses; the casts were then used as a master uponhich to mould a replica of the original structure. Internal flow
onditions were studied using a range of techniques (Proetz, 1951;wift and Proctor, 1977; Girardin et al., 1983; Hornung et al., 1987;immen et al., 1999; Churchill et al., 2004).
Whilst cadaver-based models are relatively easy to create, post-ortem specimens suffer inevitably from uncontrollable tissue
hrinkage which renders the airways excessively patent, and possi-ly distorted. Plastination (von Hagens et al., 1987) is a newer formf preservation in which the dehydration procedure (freeze sub-titution in acetone) is claimed to result in less than 10% shrinkagefrom plastination of brain tissue, Schwab and v Hagens, 1981). Thisnverifiable estimate is relied on by Croce et al. (2006) to predictucosal shrinkage for a plastinated specimen. Furthermore, suchodels are frequently opaque and their 1:1 scale hampers detailed
ow measurement.Rather than relying on such ex vivo models, geometry definition
ased on in vivo information is preferable and presently most stud-es, be they computational or using physical models, are based onata derived from in vivo images. Currently, CT, and to some extentR, imaging of the head to create digital slice images of a subject’s
asal topology are the preferred modalities. These slices are thensed to delineate the airway boundaries.
Automated procedures for translating image-derived data to anirway boundary for subsequent use in computational modelling orhysical model manufacture are now widely applied and detailedlsewhere (e.g. Hopkins et al., 2000). However, it is impossible toully automate the key process of image segmentation, and signif-cant manual user intervention is required. Reviewing the airwayeometry in both axial and coronal reconstructions by an expertelps in the manual decision-taking process (e.g. Schreck et al.,993), but the effects of intra- and inter-operator variability needo be considered (Doorly et al., 2008b; Taylor et al., 2008b).
Importantly, the discrete data set of successive sliced nasal walloundaries produces an ill determined, stepped boundary in alllanes. The significance of this loss of resolution must be consid-red carefully in the context of the experimental objectives (Klevent al., 2005; Gambaruto, 2007; Gambaruto et al., 2008). Moreover toonstruct a smooth-walled model, data points must be linked usingn arbitrary smoothing algorithm to create a continuous surface.onventional smoothing (e.g. Kobbelt et al., 1998) is known to gen-rate volume shrinkage, particularly in regions of high curvaturehat are commonplace within the nose; local curvature-adaptedmoothing is therefore advantageous (Gambaruto et al., 2008). Theeparture of the smoothed boundary from the original data should
n any case be monitored.Further errors are likely to occur in the production process of
ny physical model (e.g. by rapid prototyping) and need to be fullyssessed. Large-scale errors are manifested as distortions of theeometry, for example by under- or over-penetration of the air-ay boundary during the cast preparation or filling, or distortionf the mould. At the small-scale, artefactual irregularity of the sur-ace depends on the finish achieved during production. Imaging thehysical model by CT at a higher resolution than the original datarovides a useful assessment of fidelity (Doorly et al., 2008a).
Physical and computational models have, to-date, almost uni-
ersally restricted the boundary of the flow domain. Variousodifications to the physiological geometry near the outflowoundary are common, ranging from truncation before the pas-ageway curves into the nasopharynx (Hahn et al., 1993), to audimentary nasopharynx (e.g. Naftali et al., 2005), or a semi-
idsfu
Neurobiology 163 (2008) 100–110
ealistic merging of the bilateral streams in the nasopharynx (e.g.im and Chung, 2004). Manufactured models are generally theore restricted, for instance to just the bilateral airways (Kim et
l., 2006), or to a unilateral airway with some form of tube inlete.g. Kelly et al., 2004a,b; Weinhold and Mlynski, 2004; Taylor etl., 2005). The septum is frequently falsely extended in unilateralodels (e.g. Schreck et al., 1993; Hopkins et al., 2000); but, visuali-
ation studies employing both split and full-width nasopharyngealegions for a unilateral airway definition have not revealed signifi-ant differences in flow behaviour in the main cavity for inspiratoryow (Doorly et al., 2008a). However, the mixing and pressure loss
n the nasopharyngeal region cannot be accurately representedsing such an artificial boundary, and in general, the effects ofny boundary condition modifications need to be considered care-ully.
For inspiratory modelling, it is important to consider whethero apply either a blunt, or a fully developed tube, velocity pro-le at the naris, or, if the external nose and the face should be
ncluded (Taylor et al., 2008a). Incorporating the external nose andt least a local portion of the face not only replicates the physiolog-cal situation, but for computational studies furnishes additionalnformation, for example the spatial origin of inspired air. The mostxtensive domain used to date is probably that in the plastinatedpecimen of Croce et al. (2006), which encompassed the bilateralasal airways and part of the face. Non-physiological inflow condi-ions (with a few exceptions such as Croce et al., 2006; Doorly et al.,008b) have been applied to all physical and computational mod-ls, using typically a developed pipe flow (of varying orientation athe naris), or a plug flow.
Having defined the extent of the modelled domain, the choiceay be made to investigate flow in either an accurately repli-
ated ‘person-specific’ anatomy, or an idealised configuration.uch idealisations of the nasal architecture may be necessary toacilitate model construction and experimentation or for compu-ational convenience (e.g. smooth or structured multiblock meshreation—Horschler et al., 2003). Other studies (e.g. Elad et al., 2006)ave taken an objective rational approach to simplification leadingo far greater degrees of idealisation. Gross features of the nasal cav-ty and turbinates are represented by relatively primitive structuresntended to simulate reality. The flow characteristics determinedn such geometries are then compared with limited studies in
ore realistic anatomical geometries (Naftali et al., 2005) to iden-ify the principal properties of the flow. Intentional simplification
oreover allows the sensitivity of flow to geometry definition toe studied in a systematic and rational way (Gambaruto, 2007;ambaruto et al., 2008; Taylor et al., 2008b).
An illustration of intentional simplification is shown in Fig. 1.he right nasal airspace is shown faithfully reconstructed (Fig. 1A)nd in simplified form (Fig. 1B). The viewpoint is inwards fromhe septal wall, with that wall removed to reveal the turbinatesnd surface streamlines at a steady inspiratory flow at 0.1 L s−1. Inhe simplified model (Fig. 1B) the bounding contours have beenltered whilst maintaining the original variation in passage cross-ectional area of the faithful model along an assumed mean flowath (Fig. 1C). In the lower panels of Fig. 1A and B, the local in-pathr effectively axial velocity distributions within the nasal conduitsan be seen at each of the coronal cross-sections identified in thepper panels.
When deciding on the appropriate definition and form of anyhysical or computational model, whether replica or idealised, the
mplications of all real variations in geometry should be carefullyistinguished from the uncertainties associated with replicating apecific anatomy. Moreover, regarding simplified models, until theunctional relationships between architecture and flow are betternderstood, it is necessary to acknowledge that the introduction

logy & Neurobiology 163 (2008) 100–110 103
oa
maaa
((
(
n2
3
3
petuig
pdeeedbt
aottaow
umv2vtiv
umcit(
o
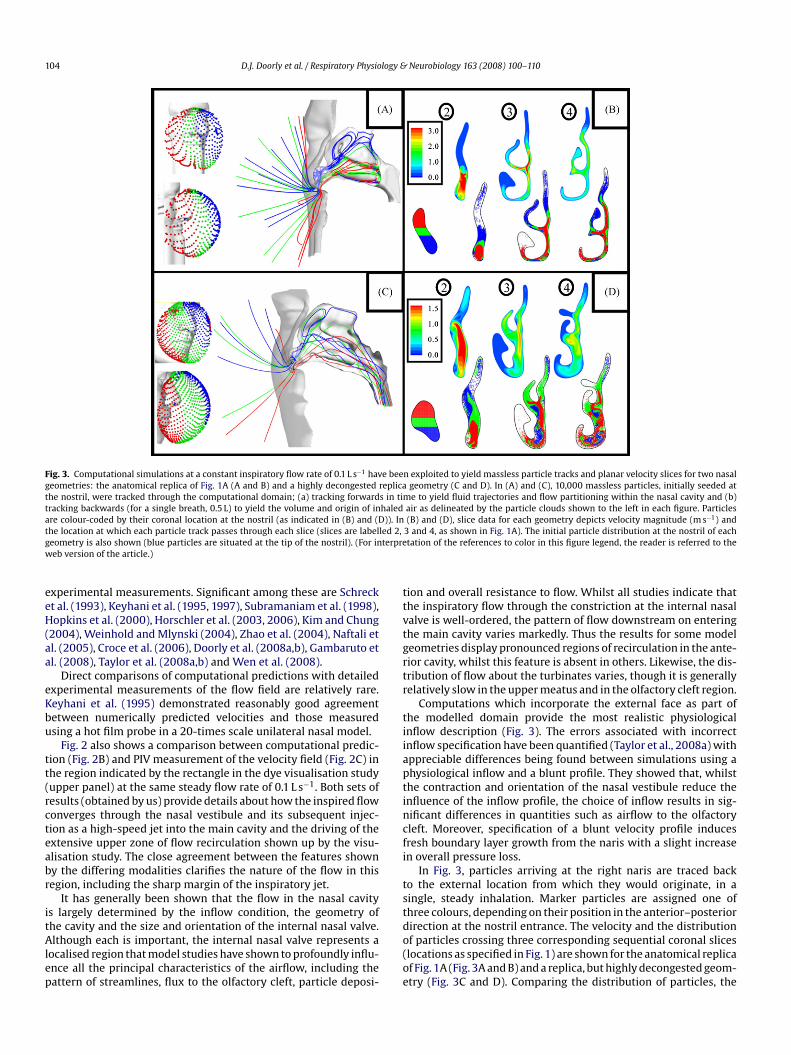
Fig. 2. Comparison of experimental and computational simulations at a constantinspiratory flow rate of 0.1 L s−1 obtained in the anatomical replica model shown inFig. 1A. (A) Depicts neutrally buoyant dye filaments, metered into the flow (upstreamof the model nostril to the bottom left of the figure) which highlight the gross flowpatterns and steadiness as well as the large anterior recirculation region (identifiedusing a dashed arrow). (B) and (C) From a mid-sagittal slice through the anterior partof the nasal airway, corresponding to the region in the box demarcated in (A). Theyshow a comparison between computational prediction (B) and PIV measurement ofttcr
gmrb2paeptsowltom
nspgw
efl
D.J. Doorly et al. / Respiratory Physio
f simplifying changes may introduce unintended, but significant,rtefactual effects.
Currently there is no agreed rational process by which individualodels can be described or different models compared. Systematic
nalysis and comparisons of different model studies would providemore informed evaluation of the relationship between structurend function. To accomplish this, it would be helpful in future if:
a) models could be described in a compact hierarchical manner;b) methods are established to characterise and compare different
anatomies;c) rational methods are established to extract key geometrical fea-
tures.
A possible way forward to achieve this would be to use alter-ative means to define and characterise geometry (e.g. Gambaruto,007).
. Airflow studies
.1. General flow properties
The patterns of airflow within the nose can be determined, inrinciple, by both experimental and computational methods. How-ver, the two approaches have differing strengths and weaknesseshat lead to their being strongly complementary, and in order tonderstand the more detailed and time varying processes, it is
nvaluable to compare results of the two approaches in similareometries.
Visualisation, though not quantitative, potentially provides aowerful, rapid and flexible means to investigate nasal airflowynamics. Both smoke particles in air-filled models (e.g. Simment al., 1999), and dye filaments in water or other liquid-filled mod-ls have been employed (e.g. Weinhold and Mlynski, 2004; Taylort al., 2005). The disadvantage of smoke is not only that it is veryifficult to image, but the effective slowing down of the dynamicsy an order of magnitude gained with a liquid allows even rapidransient dynamics to be captured photographically.
Fig. 2A shows the application of dye visualisation to reveal over-ll patterns of flow in the nasal cavity at a steady inspiratory ratef 0.1 L s−1. Readily identifiable features include the large recircula-ion in the upper anterior cavity, the deflection of flow impacting onhe middle turbinate, and the turning and mixing of the air streams it exits into the nasopharynx. The laminar character of the flow isbvious, though dye filaments passing close to a surface can becomeidely dispersed.
Experimental measurements of velocity have been obtainedsing (point-wise) hot-wire anemometry (Hahn et al., 1993), andore recently with (planar whole field) digital particle image
elocimetry (PIV) techniques (e.g. Hopkins et al., 2000; Kelly et al.,004a,b; Kim and Chung, 2004; Doorly et al., 2008a,b). PIV pro-ides a rapid, convenient means to achieve whole field data, ando assess the accuracy of computational predictions—the use of PIVn the nose is covered extensively in the companion review in thisolume (Chung and Kim, 2008).
Whilst direct measurements of velocity in life sized, and scaledp, models of the nose are useful, there are many associated experi-ental difficulties which have contributed to the attraction of using
omputational modelling methods. A general overview of some
ssues in applying computational fluid dynamics (CFD) techniqueso modelling nasal airflow is given in the review of Bailie et al.2006).Although both finite element and finite volume solution meth-ds for the governing flow equations are well-developed, mesh
oaatm
he velocity field (C). Flooded contours and uniformly sized vectors depict, respec-ively the in-plane velocity (m s−1) and direction, and indicate the structure of flowonverging through the nasal vestibule, which forms a high-speed jet, driving theecirculation shown in (A).
eneration in the narrow and complex nasal passages still posesajor difficulties. The density of the mesh should be sufficient to
esolve sharp gradients and although block-structured meshes haveeen used in some cases (Keyhani et al., 1995; Horschler et al., 2003,006), it is very difficult to refine such meshes in the complex nasalassages, and this has largely precluded their use in anatomicallyccurate models. Hybrid meshes with multi-layered prismatic walllements are now common (e.g. Zhao et al., 2004), with the firstrism layer located a small fraction of the passage width away fromhe wall (e.g. Doorly et al., 2008b). Overly rapid transitions in meshize can degrade the solution, and assuring continuous, smooth res-lution of flow everywhere leads to large numbers of elements,ith associated computational time and cost. For example, simu-
ating the development of flow unsteadiness in regions away fromhe wall, such as the margins of the inspiratory jet, require fine res-lution, with at least 4 million elements required for a half-nasalodel (Taylor et al., 2008b).An active and promising research area is the development of
umerical procedures which avoid the difficult mesh generationtage. Few such studies relating to the nasal airways have yet beenerformed, though Finck et al. (2007) have computed flow in theeometry of Horschler et al. (2003), and obtained close agreementith the earlier results.
Wolf et al. (2004) provide a concise review of the findings ofarlier mechanics studies of the patterns and distribution of air-ow in the nasal cavity, including sketches of mean flow path lines
r the velocity field during inspiration and expiration, which theydapted from the studies of Proetz (1951), Proctor (1986), Hahn etl. (1993) and Brucker and Park (1999). Many other works illustratehe velocity field and/or pathline patterns in various nasal airwayodels, using images derived from visualisation, computation or
104 D.J. Doorly et al. / Respiratory Physiology & Neurobiology 163 (2008) 100–110
Fig. 3. Computational simulations at a constant inspiratory flow rate of 0.1 L s−1 have been exploited to yield massless particle tracks and planar velocity slices for two nasalgeometries: the anatomical replica of Fig. 1A (A and B) and a highly decongested replica geometry (C and D). In (A) and (C), 10,000 massless particles, initially seeded atthe nostril, were tracked through the computational domain; (a) tracking forwards in time to yield fluid trajectories and flow partitioning within the nasal cavity and (b)tracking backwards (for a single breath, 0.5 L) to yield the volume and origin of inhaled air as delineated by the particle clouds shown to the left in each figure. Particlesare colour-coded by their coronal location at the nostril (as indicated in (B) and (D)). In (B) and (D), slice data for each geometry depicts velocity magnitude (m s−1) andt led 2,g terprew
eeH(aa
eKbu
tt(rcteabr
itAlep
ttvtgrtr
tiiaptincfi
tst
he location at which each particle track passes through each slice (slices are labeleometry is also shown (blue particles are situated at the tip of the nostril). (For ineb version of the article.)
xperimental measurements. Significant among these are Schreckt al. (1993), Keyhani et al. (1995, 1997), Subramaniam et al. (1998),opkins et al. (2000), Horschler et al. (2003, 2006), Kim and Chung
2004), Weinhold and Mlynski (2004), Zhao et al. (2004), Naftali etl. (2005), Croce et al. (2006), Doorly et al. (2008a,b), Gambaruto etl. (2008), Taylor et al. (2008a,b) and Wen et al. (2008).
Direct comparisons of computational predictions with detailedxperimental measurements of the flow field are relatively rare.eyhani et al. (1995) demonstrated reasonably good agreementetween numerically predicted velocities and those measuredsing a hot film probe in a 20-times scale unilateral nasal model.
Fig. 2 also shows a comparison between computational predic-ion (Fig. 2B) and PIV measurement of the velocity field (Fig. 2C) inhe region indicated by the rectangle in the dye visualisation studyupper panel) at the same steady flow rate of 0.1 L s−1. Both sets ofesults (obtained by us) provide details about how the inspired flowonverges through the nasal vestibule and its subsequent injec-ion as a high-speed jet into the main cavity and the driving of thextensive upper zone of flow recirculation shown up by the visu-lisation study. The close agreement between the features showny the differing modalities clarifies the nature of the flow in thisegion, including the sharp margin of the inspiratory jet.
It has generally been shown that the flow in the nasal cavitys largely determined by the inflow condition, the geometry of
he cavity and the size and orientation of the internal nasal valve.lthough each is important, the internal nasal valve represents aocalised region that model studies have shown to profoundly influ-nce all the principal characteristics of the airflow, including theattern of streamlines, flux to the olfactory cleft, particle deposi-
do(oe
3 and 4, as shown in Fig. 1A). The initial particle distribution at the nostril of eachtation of the references to color in this figure legend, the reader is referred to the
ion and overall resistance to flow. Whilst all studies indicate thathe inspiratory flow through the constriction at the internal nasalalve is well-ordered, the pattern of flow downstream on enteringhe main cavity varies markedly. Thus the results for some modeleometries display pronounced regions of recirculation in the ante-ior cavity, whilst this feature is absent in others. Likewise, the dis-ribution of flow about the turbinates varies, though it is generallyelatively slow in the upper meatus and in the olfactory cleft region.
Computations which incorporate the external face as part ofhe modelled domain provide the most realistic physiologicalnflow description (Fig. 3). The errors associated with incorrectnflow specification have been quantified (Taylor et al., 2008a) withppreciable differences being found between simulations using ahysiological inflow and a blunt profile. They showed that, whilsthe contraction and orientation of the nasal vestibule reduce thenfluence of the inflow profile, the choice of inflow results in sig-ificant differences in quantities such as airflow to the olfactoryleft. Moreover, specification of a blunt velocity profile inducesresh boundary layer growth from the naris with a slight increasen overall pressure loss.
In Fig. 3, particles arriving at the right naris are traced backo the external location from which they would originate, in aingle, steady inhalation. Marker particles are assigned one ofhree colours, depending on their position in the anterior–posterior
irection at the nostril entrance. The velocity and the distributionf particles crossing three corresponding sequential coronal sliceslocations as specified in Fig. 1) are shown for the anatomical replicaf Fig. 1A (Fig. 3A and B) and a replica, but highly decongested geom-try (Fig. 3C and D). Comparing the distribution of particles, the
logy &
rpflaeun
rstttml
omsionawladmi
3
pfbm
rfloqquCmqp
3
((bn
S
(rvtoca
taatd2oslSodwfp
stsomd13pthe inspiratory period given by Elad et al. (2008) appears symmetricabout the point of maximal flow. Therefore at least for quiet breath-ing, it seems reasonable to disregard hysteresis; however, this maynot hold for other regimes such as rapid sniffing.
Fig. 4. High-speed dye visualisation and PIV reveals the onset of instability at anincreased, effectively unsteady flow rate (∼0.2 L s−1) in the simplified geometryof Fig. 1B. (A) (together with the magnified image of the demarcated box in (B))provides a striking illustration of the shear layer instability at the margin of theinspiratory jet entering the nasal cavity. Flow remains laminar across most of thenasal airspace, though the upper margin of the jet undergoes instability approach-ing the middle turbinate. Slow motion review of image sequences (captured at anin vivo frame rate of ∼3000 fps) reveals small amplitude fluctuations in filaments(arrowed in (B)) approaching the stagnation of the inflow jet on the middle turbinatethat leads to amplified dispersion; this may give a misleading impression of distur-bance amplitude of flow in the upper region of the cavity. The spatial scaling of
D.J. Doorly et al. / Respiratory Physio
elative lack of ‘mixing’ (strictly stirring, since diffusion is not incor-orated) within the cavity is evident. The colour coding shows thatow reaching the upper cavity predominantly passes through thenterior part of the nasal vestibule, as reported previously (Keyhanit al., 1995; Zhao et al., 2004). Fig. 3A and C also shows that thepper cavity flow streams originate from directly in front of theose, rather than from the lateral or vertical margins.
Both the velocity of the airflow, and its spatial and tempo-al variations, very near the wall and the related shear rate, orhear stress (WSS), at the wall are important quantities in rela-ion to many physiological processes, for example pressure drophrough the nose, particle deposition and exchange processes athe wall. Wall shear has also been identified as a putative agent for
echano-transduction between the airflow and the nasal epithe-ium as discussed by Elad et al. (2006).
Computational modelling enables the WSS, and other physi-logically related parameters that are difficult or impossible toeasure directly, to be deduced. The upper panels of Fig. 1A and B
how the distribution of WSS on the exposed lateral wall. Colour-ng, indicating the magnitude of WSS at an inspiratory flow ratef 0.1 L s−1, reveals zones of high wall shear in the vicinity of theasal valve where flow is squeezed through the narrowed space,nd the anterior portions of the middle and inferior turbinateshere impingement of the airstream on the fronts of the turbinates
eads to fresh boundary layer development; lower values of WSSre found in the region of the olfactory cleft (below the ‘w’-shapedepression in the roof of the cavity). The notable marked inho-ogeneity in WSS reveals that the complexity of nasal airflow is
ntimately associated with the geometric complexity.
.2. Unsteadiness of the flow
The type of flow regime that exists over the breathing cycle,articularly through the inspiratory phase, significantly affectsunction—from the overall pressure losses, to the transport of airorne species and even possibly the stimuli transmitted to the nasalucosa and epithelium.Despite extensive earlier work, there is still uncertainty with
egard to two basic questions in modelling nasal airflow. Can theow be modelled as steady and is the flow laminar, transitionalr turbulent? Previous studies suggest that the answers to theseuestions are not clear cut. The type of breathing (e.g. steady anduiet slow breathing vs. rapid sniffing) is important, with a partic-lar anatomy tending either to increase or decrease flow stability.learly the real flow is not steady, so the question is whetherodelling the mean flow as a steady process, or as a series of
uasi-steady flows is sufficient to characterise the airflow and thehysiological functional performance of the nose.
.2.1. Phase related variationsFor quiet breathing at a frequency (f) of 15 breaths per minute
using characteristic scales for (i) time ∼ equivalent to airway lengthL) divided by mean velocity (U), and (ii) the passage radial cali-re [d/2] = 3 mm) values of the Strouhal (St) and Womersley (Wo)umbers
t = 2�f L
U, Wo = d
2
(2�f
�
)1/2
where � = kinematic viscosity of air) are less than 0.25 and 3,espectively. This suggests that the quasi-steady approximation is
alid, and this view is reinforced by computations which modelhe inspiratory period as a flow waveform. For example, the resultsf Shi et al. (2006) reveal only minor differences in the velocityontours at a given flow rate between the accelerating and deceler-ting portions of the flow waveform. Most studies have gone furthertcmidF
Neurobiology 163 (2008) 100–110 105
han this and assume a steady flow as representative of the ‘aver-ge’ conditions over the entire inspiratory period (e.g. Keyhani etl., 1997; Wen et al., 2008). However, a steady mean flow assump-ion is not suitable for modelling accumulative processes such aseposition (Shi et al., 2006), odorant transfer (Zhao et al., 2004,006) or heat transfer (Naftali et al., 2005; Ishikawa et al., 2006)ver the cycle. Nor is it suitable when determining how mechanicaltimuli, such as surface traction, are transmitted to the nasal epithe-ium by varying airflow (Elad et al., 2006). The approach taken byhi et al. (2006) to reduce the computationally demanding costf fully modelling the inspiratory waveform is interesting; theyetermined an ‘equivalent’ steady flow as 0.5(Umean + Umaximum)hich effectively reproduced the deposition results obtained by
ull simulation. However, the effectiveness of such an approach isroblem-dependent, and requires validation in each case.
Where hysteresis is manifested over the inspiratory period, ateady state model is certainly inappropriate. In principle, such hys-eresis could arise due to fluid dynamic effects (e.g. via unsteadyeparation in the flow in the nose), or for structural reasons (e.g.scillation or displacement of any of the airway walls). Measure-ents of the pressure-flow relation given by Fodil et al. (2005)
isplay hysteresis, but in that study, very high pressures (300 Pa,0 cm H2O) were sustained. They reported that below pressures of0 Pa, there was little difference in flow predicted by rigid or com-liant models. Likewise, the temporal variation of wall shear over
he disturbance in (B) is directly comparable with that depicted in (C), which showsorresponding PIV measurements of velocity (m s−1), providing a quantitative deter-ination of the sharp interface between the high-speed inspiratory jet (with peak
n-plane velocities reaching 5 m s−1) and the slow anterior recirculation region. Theemarcated box provides the reference location for the measurements shown inig. 5.

1 logy &
3
cnonolt
ntttswaiddm
tt
rqftip1f
imwttbEmie
Fiir
06 D.J. Doorly et al. / Respiratory Physio
.2.2. Laminar v turbulent flowWhilst a detailed consideration of mixing and transport pro-
esses in the nose, such as delivery of odorants to the region of theasal cleft and conditioning of inspired air, are beyond the scopef this review, their characteristics depend fundamentally on theature of the airflow within the nasal cavity, both within the bulkf the airstream and very near the walls. Whether the flow is trulyaminar, but possibly disturbed, or turbulent is ultimately key tohe understanding of these processes.
At sufficiently low flow rates, airflow is laminar throughout theasal airways. However, there is uncertainty both as to when depar-ure from laminar behaviour can be expected and how the state ofhe flow develops from fully laminar to fully turbulent—if indeedhe latter stage is ever fully attained. The state is unlikely to changeuddenly from laminar to turbulent. Instead, a transition processill occur in which semi-regular, self-sustained oscillatory features
ppear as disturbances to laminar flow; with progressive increasesn flow rate, random, small scale disturbances will develop. Evi-ence regarding the nature of flow in the nasal cavity has been
erived by inference from pressure loss, and directly via hot wireeasurements and visualisation in models.Attempts to determine the flow state in the nose indirectly fromhe overall pressure loss are hampered by the intricate geometry ofhe cavity where the opportunity for complex zones of recirculation
mp
aa
ig. 5. Time-resolved PIV for a flow rate of ∼0.2 L s−1 in the simplified geometry of Fig.n Fig. 4C. Flooded contours of in-plane velocity magnitude (U, m s−1), and vorticity (ωnstantaneous vorticity fields show the evolution and periodic nature of the instability (Celative to the broken grid.
Neurobiology 163 (2008) 100–110
enders direct comparison with classical correlations for pipe flowuestionable. The dimensionless pressure loss coefficient has beenound to vary approximately inversely with Reynolds number (Re,he classical indicator of transition from laminar to turbulent flown a given geometry) at low flow rates—reducing to an inverse thirdower law (Croce et al., 2006) or a constant value (Schreck et al.,993) at higher flow rates, thus confirming an eventual transitionrom a fully laminar to turbulent state.
Using hot wire anemometry, Hahn et al. (1993) measured thentensity of velocity fluctuation (ratio of velocity fluctuation to local
ean velocity). They concluded that flow in their half nasal modelas ‘disturbed laminar’ at a flow rate of 0.18 L s−1, and turbulent at
he higher flow rates studied. However, hot wire studies are difficulto conduct in nose models—in larger models the flow velocities canecome very small, whilst access is very difficult in smaller models.mploying conventional PIV methods, Kim and Chung (2004) deter-ined the root mean square (rms) intensity of velocity fluctuations
n the nasal cavity, observing high levels where the inspiratory jetntered the cavity from the valve. However, snapshot measure-
ents using conventional PIV techniques are not well-suited torobe the interesting and important unsteady dynamics.Visualisation has been used frequently to decide whether nasal
irflow is laminar or turbulent (e.g. Simmen et al., 1999; Churchill etl., 2004). Although the technique illustrates well overall features
1B. The magnified location and orientation of the PIV measurements is indicated, s−1) at an instant (t0) are shown in (A) and (B). Successive (0.58 ms time lapse)and D). The movement of the features can be seen by observing their displacement

logy &
sidmtt
i0osirmtdttstshtttTt
4
tbOooa
4
aTuiwbaa
atm2pWDatrGtvttepjPb
Fp(
D.J. Doorly et al. / Respiratory Physio
uch as zones of recirculation, it can be misleading. Even minor lam-nar flow disturbances in complex configurations can induce rapidispersion which may be confused with turbulent mixing. Assess-ent of the flow state needs to be based on visualisation techniques
hat are capable of revealing the complexity of the dynamics ando distinguish early instability from fully developed turbulence.
Dye visualisation images showing the development of flownstability are given by Doorly et al. (2008a,b) at flow rates up to.17 L s−1. Fig. 4A (together with the magnified image in Fig. 4Bf the highlighted region) provides a striking illustration of thehear layer instability at the margin of the inspiratory jet enter-ng the nasal cavity at a slightly higher flow rate of 0.2 L s−1. Theoll up and shedding of periodic structures in the vicinity of theiddle meatus can be clearly seen. It is particularly noteworthy
hat the third dye filament from the top, which bypasses the mid-le turbinate, remains largely unaffected by the shear instability;his indicates relatively undisturbed laminar flow within much ofhe cavity. Fig. 4C shows an instantaneous snapshot of PIV mea-urements of velocity, providing a quantitative determination ofhe sharp interface between the high-speed inspiratory jet and thelow anterior recirculation region. In Fig. 5, a series of time-resolvedigh-speed PIV images (landmarked in Fig. 4C) focus on the edge ofhe shear layer. The in-plane velocity (U, m s−1) and in-plane vor-icity (ω, s−1), shown in Fig. 5A and B at an arbitrary time denoted0 after the establishment of a steady inspiratory flow of 0.2 L s−1.he images in Fig. 5C and D chart the oscillation and break up ofhe concentrated vorticity into discrete structures.
. New research directions
The numerous model studies performed to-date have con-ributed greatly to our understanding of how the nose functions,
ut it is also clear that there are significant gaps in this knowledge.utlined briefly in this review is some recent progress in the areasf: (i) definition of the model airway, (ii) the effect of flow instabilityn wall shear stress and (iii) sniffing, which it is anticipated will playsignificant role in future developments of nasal airway modelling.oarp
ig. 6. Computational simulation during inspiration of normalised WSS* distributions inressure 0.5�U2
m – where � and Um are respectively the fluid density and mean velocity atB) and (C), showing two successive snapshots separated by 0.5 ms, are for the effectively
Neurobiology 163 (2008) 100–110 107
.1. Definition of the model airway
The issues of defining airway geometry and its variations have,s yet, scarcely been addressed in a rational way in model studies.he important causes of variability are twofold. First is the issue ofncertainty where, for example, different operator choices in the
mage segmentation process lead to variation in the delineated air-ay geometry. The second reflects ‘genuine’ physical variability,oth intra- and inter-individually. For both reasons, compact, hier-rchical descriptions of the complex geometry of the nasal airwaysre needed to characterise how form and function are related.
Various alternative techniques for the representation of nasalirway geometry have recently been introduced including skele-onisation, Fourier descriptor contour representation and harmonic
apping (Gambaruto, 2007). The technique of skeletonisation inD was introduced by Blum (1967) and is commonly used in imagerocessing and machine vision, e.g. Sonka (1995), Jain (1988), andeeks (1996). In nasal airway skeletonisation (summarised by
oorly et al., 2008b), the surface of the lumen is decomposed intostack of branched ‘skeleton’ curves, and associated thickness dis-
ribution; the decomposition is reversible, with the airway surfaceecoverable via implicit function reconstruction techniques (e.g.ambaruto et al., 2008). Given that the underlying structure of
he nasal airways is for the most part axially invariant, regionalariations in passage calibre (simulating different states of conges-ion, or even temporal variations) can be applied without alteringhe airway ‘skeleton’. The process of airway skeletonisation alsonables meaningful averaging of topological form and regionalassage calibre variation from data corresponding to different sub-
ects. Characteristic topological features could be extracted viaroper Orthogonal Decomposition techniques which are describedy Doorly et al. (2008b).
Many alternative representations of the airway geometry, basedn a direct, hierarchical description of the lumen boundaryre possible, for example using Fourier descriptors for contourepresentation (Gambaruto, 2007). As with skeletonisation, thisrovides a means to compare and characterise geometry, and
the region of the anterior middle turbinate (WSS is normalised by the dynamicthe nasal valve – 2.15 m s−1 at a flow rate of 0.1 L s−1). (A) For a flow rate of 0.1 L s−1;unsteady flow rate of 0.2 L s−1.

1 logy & Neurobiology 163 (2008) 100–110
httlwr
4
iFFf1nfflo
ctnnutd
lcm(tt(rdas
lbdfaf
Fig. 7. Distribution of normalised WSS* along the perimeter of the wall for compu-tational simulations described in Fig. 6. The shape of the extracted wall boundaryslice is shown, colour-coded by normalised perimeter distance in (A). For reference,the boundary of this slice is also shown in situ in Fig. 6A and demarcated by thecoloured diamonds. (B) A 2D plot of WSS* distribution extracted from a slice includ-ing the stagnation point of flow on the middle turbinate. The black and red linesrepresent the first and second instantaneous distributions (0.5 ms apart), respec-tively, at a flow rate of 0.2 L s−1. The blue symbols represent the comparable sliceat a flow rate of 0.1 L s−1. The horizontal axis represents normalised perimeter loca-tion; shown beneath the 2D plot are the symbols of the unwound perimeter location,ctii
4
itoievrlnhw
c(b
Fip
08 D.J. Doorly et al. / Respiratory Physio
as been applied to investigate the sensitivity of model geome-ry to small perturbations (Gambaruto et al., 2008). Other generalechniques for morphometric analysis may be useful; particu-arly promising is the formulation developed by Cotter (2008)
hich is based on variational methods, and to which the reader iseferred.
.2. Effect of flow instability on wall shear stress
The effects of flow instability at the higher flow rates on thempact of the inspiratory jet on the middle turbinate is shown inig. 6 where the steady (0.1 L s−1, Fig. 6A) and unsteady (0.2 L s−1,ig. 6B) flow rates are compared. The relatively high values of theriction coefficient (WSS normalised by the dynamic pressure –/2�U2
m – calculated at the nasal valve) in the region of the stag-ation of the jet on the middle turbinate reflect the growth of
resh boundary layers. The surface streamlines indicate how theow, deflected about the leading edge of the turbinate, changes inrientation under the different conditions (Fig. 6A and B).
Comparing the two sequential plots (Fig. 6B and C) of frictionoefficient at the naturally unsteady, higher flow rate, with that athe lower steady flow rate (Fig. 6A) reveals some interesting phe-omena. Firstly, the near equivalence of levels and distribution oformalised WSS, despite doubling of the flow. Secondly, althoughnsteady shear layer break-up occurs at the margins of the inspira-ory jet, the stagnation point of the jet on the turbinate shows littleisplacement with increasing flow rate.
The small alterations in normalised WSS are quantified in theine plot (Fig. 7B) round the wall on a slice extracted through theomputational wall mesh. Colour coded diamond symbols, nor-alised by perimeter distance, show the shape of the extracted slice
Fig. 7A) and the coloured lined in Fig. 7B indicates position roundhe contour of the wall. The location of the slice is also shown usinghe same colour coded diamond symbols in Fig. 6A. The solid linesred and black represent two instantaneous measurements, sepa-ated by 0.5 ms, at the flow rate of 0.2 L s−1 and show little notableifference. The blue circular symbols represent the same slice forflow rate of 0.1 L s−1, these show the same general qualitative
tructure and patterns of those at 0.2 L s−1.In contrast, there are striking alterations in surface stream-
ine pattern for the flow being deflected upwards and anteriorly
y the anterior head of the middle turbinate. The change in WSSue to a gross increase in flow (a doubling) may represent a low-requency, quasi-steady alteration, whilst the shear layer instability,s indicated by the changing streamline behaviour, leads to a highrequency variation.dvttt
ig. 8. Computational simulation, in a mid-sagittal slice, of a transient (0.1 ms duration) pn-plane vorticity (s−1) and planar streamlines (indicating flow direction) for an establishseudo-sniff (linear ramp from 0 L s−1 to 0.2 L s−1 over 0.1 s) for an instant in time at 0.04
orresponding to (A). (Because the peak WSS is nearly an order of magnitude largerhan the mean, the peak has been removed and is shown within the blue circlednset.) (For interpretation of the references to colour in this figure legend, the readers referred to the web version of the article.)
.3. Sniffing
The dynamics of airflow and transport in sniffing are ofncreasing interest, particularly from a diagnostic and therapeu-ic viewpoint. Mild sniffing comprises short sequential burstsf increased inspiratory airflow rate (>0.5 L s−1). The resultantncreased pressure drop induces some degree of collapse of thexternal nose, and probably affects flow transiting the nasalestibule. Deep sniffing, involving relatively high transient flowates (probably >1.0 L s−1), produces a marked degree of alar col-apse. The time taken to initiate significant airflow velocities in theose can be very short; our own preliminary investigations usingot wire anemometry indicated that flow can rise significantly wellithin 40 ms.
Fig. 8A depicts a slice (the same as that of Fig. 4C) through theomputational domain showing the in-plane vorticity magnitudes−1) for an established flow rate of 0.2 L s−1. The amplified insta-ility can be observed in the shear layer, with planar streamlines
enoting velocity direction. The formation and rollup of the startingortex was analysed for a transient linear ramp of flow from 0 L s−1o 0.2 L s−1 in 0.1 s—a time scale consistent with a gentle sniff. Athe beginning of this sniff, fluid velocities are low and separation ofhe inspired jet is relatively weak (Fig. 8B). This allows inspired air
seudo-sniff inspiration for the simplified geometry of Fig. 1B. Flooded contours ofed flow at 0.2 L s−1 depict the onset of flow instability (A). The starting vortex for as can be seen in (B).

logy &
tt(rtioca
5
mlofospaEPp
cgaoyct
(eetZtdpc
sagrpmpc
Trtaaiidbigd
tcpuaotid
bbgwaqbcoedoI
A
RBLaofmtf
R
B
B
B
C
C
C
C
CC
C
D
D.J. Doorly et al. / Respiratory Physio
o be drawn into the anterior part of the cavity as demonstrated byhe streamlines. The growing starting vortex will eventually formin a time of the order of 0.1–0.2 s) the large anterior recirculationegion previously described (Figs. 5 and 8A). The gradual growth ofhe vortex entrains and mixes inspired air before it is re-releasednto the jet and convected to the roof of the nasal passageway forlfaction. This pattern of behaviour could possibly play a signifi-ant role in olfaction by mixing air-streams from different originsround the external face before they reach the olfactory cleft.
. Conclusions
The ultimate goal of modelling studies in the field of nasalechanics must be to shed more light on the underlying physio-
ogical processes in health and disease, or to improve the provisionf interventional actions from the delivery of aerosolised drugs tounctionally based surgical planning. This review of the mechanicsf nasal airflow has considered information deduced from modeltudies in the context of a critical examination of the bases andotential capability of the various model types and experimentalpproaches. It is intended to be complementary to the reviews oflad et al. on nasal air conditioning, Chung and Kim on the use ofIV to study nasal airflow and Kleinstreuer et al. on airflow andarticle transport processes in this issue.
Advances in imaging capabilities, model production methods,omputing power and measurement techniques are all leading pro-ressively to a better understanding of the underlying mechanicsnd there is strong evidence of translation of advances in other areasf mechanics and modelling to the topic. However, the field has notet advanced to the point where detailed mechanistic comparisonsan be achieved between the model and real environments in wayshat fully exploit the technical possibilities.
Exploratory studies of potential applications in drug deliverye.g. Kimbell et al., 2007; Inthavong et al., 2006, 2008; Schroetert al., 2006), understanding of pathological conditions (e.g. Garciat al., 2007) and investigation of surgical consequences or objec-ive quantification of surgical outcome (Lindemann et al., 2005b;hao et al., 2006) indicate the significance, and some of the poten-ial benefits, of more realistic nasal airflow modelling. In all cases,eficiencies in the current state of modelling, such as unknownarameters and over-simplifying assumptions, are recognised toause significant limitations in interpretation.
Furthermore, there is a paucity of detailed direct in vivo mea-urements with which model predictions can be compared directlynd tested for validity. Such validation of predictions, for instancelobally by rhinomanometry, but preferably with distributed,egional measurements of other quantities, such as temperature orarticle deposition, would be invaluable. It is appreciated that sucheasurements pose considerable challenges to the experimental
hysiologist, but without detailed comparisons, physical model andomputational studies are left ungrounded.
Much effort is concerned with improving model definition.here is, however, considerable work to be done in the area ofational geometry characterisation, which should aim to providehe ability to describe both model and real, subject-specific, normalnd pathological geometries objectively and comparatively. It couldlso facilitate the task of introducing architectural simplificationsnto models that can assist in elucidating the underlying mechan-cs. Considerable effort is still involved in the translation of in vivo
ata to a model, and progress in automating this process woulde of great benefit. Non-invasive rapid and high-resolution imag-ng could be applied to determine regional variation in passagewayeometry over the time course of the nasal cycle, and possibly inue course, other more rapid dynamic geometry changes.
D
E
Neurobiology 163 (2008) 100–110 109
Dynamic flow modelling and coupling to the rest of the respira-ory tract (which has not been considered directly in this review) islearly an important area to explore in depth for many reasons. Inarticular, future flow modelling needs to assess the significance ofnsteadiness within the structure of the flow with regard to mixingnd transport processes within the nose, as well as the details ofvertly transient processes such as sniffing. The cyclical nature ofhe inspiratory–expiratory process will influence the definition ofnput conditions in the region and appropriate boundary conditionserived from modelling of the distal regions are needed.
Modelling studies, particularly computational ones, are capa-le of generating vast amounts of experimental data that canecome confusing, or at best hard to assimilate. In order to makeood use of such data, it is important to decide very carefullyhat is desired of the model being studied, and what is the least
mount of data required to answer carefully posed, mechanisticuestions that are appropriate to the physiologically based topiceing investigated. Therefore, it would be helpful if investigatorsould develop rational methods of data presentation that enablebjective, preferably quantitative, comparison with studies by oth-rs. This need brings together the matter of rational geometryescription with improved focus and discipline in the generationf functional mechanical and physiologically related data outputs.t will provide a significant challenge to modellers in the future.
cknowledgements
We are indebted to the Biotechnology and Biological Sciencesesearch Council (BBSRC) who funded this research (E18557 andB/E02344/1), and to the EPSRC equipment loan pool, Oxfordasers, the HPCx national computing resource and Fluent Ltd. fordditional support. We are grateful for the advice of Mr. N. Tolleyf the ENT department of St. Mary’s Hospital in Paddington, andor the assistance in model segmentation of Dr. R. Almeyda, for-
erly of the same ENT department. We also express our thanks tohe Radiology Department at that hospital for CT validation of theabrication process used to create replica models.
eferences
ailie, N., Hanna, B., Watterson, J., Gallagher, G., 2006. An overview of numericalmodelling of nasal airflow. Rhinology 44 (1), 53–57.
lum, H., 1967. A transformation for extracting new descriptors of shape. In: Modelsfor the Perception of Speech and Visual Form. M.I.T. Press, pp. 362–380.
rucker, C., Park, K., 1999. Experimental study of velocity fields in a model of humannasal cavity by DPIV. In: Banerjee, S., Eaton, K. (Eds.), Proceedings 1st Inter-national Symposium on Turbulence and Shear Phenomena. September, 12–15,Begell House, Santa Barbara, California, pp. 831–836.
akmak, O., Coskun, M., Celik, H., Buyuklu, F., Ozluoglu, L.N., 2003. Value of acousticrhinometry for measuring nasal valve area. Laryngoscope 113, 295–302.
arey, J.W., Steegmann, A.T.J., 1981. Human nasal protrusion, latitude, and climate.Am. J. Phys. Anthropol. 56, 313–319.
hung, S.K., Kim, S.K., 2008. Digital particle image velocimetry studies of nasal air-flow. Respir. Physiol. Neurobiol..
hurchill, S.E., Shackelford, L.L., Georgi, J.N., Black, M.T., 2004. Morphological varia-tion and airflow dynamics in the human nose. Am. J. Hum. Biol. 16, 625–638.
ole, P., 2000. Biophysics of nasal airflow: a review. Am. J. Rhinol., 245–249.otter, C.J., 2008. The variational particle-mesh method for matching curves. J. Phys.
A. 41 344003 (18 pp.) doi:10.1088/1751-8113/41/34/344003.roce, C., Fodil, R., Durand, M., Sbirlea-Apiou, G., Caillibotte, G., Papon, J.F., Blondeau,
J.R., Coste, A., Isabey, D., Louis, B., 2006. In vitro experiments and numericalsimulations of airflow in realistic nasal airway geometry. Ann. Biomed. Eng. 34,997–1007.
oorly, D.J., Taylor, D.J., Franke, P., Schroter, R.C., 2008a. Experimental investiga-tion of nasal airflow. Proc. Inst. Mech. Eng. H: J. Eng. Med. 222, 439–453,
doi:10.1243/09544119jeim330.oorly, D.J., Taylor, D.J., Gambaruto, A.M., Schroter, R.C., Tolley, N., 2008b.Nasal architecture: form and flow. Philos. Trans. R. Soc. A 366, 3225–3246,doi:10.1098/rsta.2008.0083.
ccles, R., 2000. Nasal airflow in health and disease. Acta Otolaryngol. 120 (5),580–595.

1 logy &
E
E
F
F
F
G
G
G
G
G
H
H
H
H
H
H
I
I
I
J
K
K
K
K
K
K
K
K
K
L
L
L
L
M
M
N
N
N
N
O
P
P
P
S
S
S
S
S
S
S
S
S
S
S
T
T
T
v
W
W
W
W
W
Z
Zhao, Z., Scherer, P.W., Hajiloo, S.A., Dalton, P., 2004. Effect of anatomy on human
10 D.J. Doorly et al. / Respiratory Physio
lad, D., Naftali, S., Rosenfeld, M., Wolf, M., 2006. Physical stresses at the air-wallinterface of the human nasal cavity during breathing. J. Appl. Physiol. 100,1003–1010.
lad, D., Wolf, M., Keck, T., 2008. Air-conditioning in the human nasal cavity. Respir.Physiol. Neurobiol..
inck, M., Hanel, D., Wlokas, I., 2007. Simulation of nasal flow by lattice Boltzmannmethods. Comput. Biol. Med. 37, 739–749.
odil, R., Brugel-Ribere, L., Croce, C., Sbirlea-Apiou, G., Larger, C., Papon, J.F., Delclaux,C., Coste, A., Isabey, D., Louis, B., 2005. Inspiratory flow in the nose: a modelcoupling flow and vasoerectile tissue distensibility. J. Appl. Physiol. 98, 288–295.
ranke, V.E., Franke, P.T., Doorly, D.J., Schroter, R.C., Giordana, S., Almeyda, R., 2005.Computational modelling of flow in the nasal cavities. In: Proceedings of theASME SBC05 Summer Bioengineering Meeting, June 22–26, 2005, Colorado, USA.
ambaruto, A.M., 2007. Form and flow in anatomical conduits: bypass graft andnasal cavity. Ph.D. Thesis, Department of Aeronautics, Imperial College London.
ambaruto, A.M., Taylor, D.J., Doorly, D.J., 2008. Modelling nasal airflow using aFourier descriptor representation of geometry. Int. J. Numer. Methods Fluids,doi:10.1002/fld.1866.
arcia, G.J.M., Bailie, N., Martins, D.A., Kimbell, J.S., 2007. Atrophic rhinitis: a CFDstudy of air conditioning in the nasal cavity. J. Appl. Physiol. 103, 1082–1092.
irardin, M., Bilgen, E., Arbour, P., 1983. Experimental study of velocity fields ina human nasal fossa by laser anemometry. Ann. Otol. Rhinol. Laryngol. 92,231–236.
uilmette, R.A., Birchall, A., Jarvis, N.S., 1998. Effect of uncertainty in nasal airwaydeposition of radioactive particles on effective dose. Radiat. Prot. Dosim. 79(1–4), 245–248.
ahn, I., Scherer, P.W., Mozell, M.M., 1993. Velocity profiles measured for airflowthrough a large-scale model of the human nasal cavity. Model. Physiol. 75,2273–2287.
anif, J., Jawad, S.S.M., Eccles, R., 2000. The nasal cycle in health and disease. Clin.Otolaryngol. 25 (6), 461–467.
opkins, L.M., Kelly, J.T., Wexler, A.S., Prasad, A.K., 2000. Particle image velocimetrymeasurements in complex geometries. Exp. Fluids 29 (1), 91–95.
ornung, D.E., Leopold, D.A., Youngentob, S.L., Sheehe, P.R., Gagne, G.M., Thomas, F.D.,Mozell, M.M., 1987. Airflow patterns in a human nasal model. Arch. Otolaryngol.Head Neck Surg. 113, 169–172.
orschler, I., Brucker, C., Schroder, W., Meinke, M., 2006. Investigation of the impactof the geometry on the nose flow. Eur. J. Mech. Fluids 25, 471–490.
orschler, I., Meinke, M., Schroder, W., 2003. Numerical simulation of the flow fieldin a model of the nasal cavity. Comput. Fluids 32, 39–45.
nthavong, K., Tian, Z., Li, H., Tu, J., Yang, W., Xue, C., Li, C., 2006. A numerical study ofspray particle deposition in a human nasal cavity. Aerosol Sci. Technol. 40 (11),1034–1045.
nthavong, K., Tiana, Z.F., Tua, J.Y., Yangb, W., Xuec, C., 2008. Optimising nasal sprayparameters for efficient drug delivery using computational fluid dynamics. Com-put. Biol. Med. 38 (6), 713–726.
shikawa, S., Nakayama, T., Watanabe, M., Matsuzawa, T., 2006. Visualization of flowresistance in physiological nasal respiration. Arch. Otolaryngol. Head Neck Surg.132, 1203–1209.
ain, A.K., 1988. Fundamentals of Digital Image Processing. Prentice-Hall Interna-tional Editions, pp. 370–374, 382–383.
elly, J.T., Asgharian, B., Kimbell, J., Wong, B.A., 2004a. Particle deposition in humannasal airway replicas manufactured by different methods. Part I. Inertial regimeparticles. Aerosol Sci. Technol. 38, 1072–1079.
elly, J.T., Asgharian, B., Kimbell, J., Wong, B.A., 2004b. Particle deposition in humannasal airway replicas manufactured by different methods. Part II. Ultrafine par-ticles. Aerosol Sci. Technol. 38, 1072–1079.
eyhani, K., Scherer, P.W., Mozell, M.M., 1995. Numerical simulation of airflow in thehuman nasal cavity. J. Biomech. Eng. 117, 429–441.
eyhani, K., Scherer, P.W., Mozell, M.M., 1997. A numerical model of nasal odoranttransport for the analysis of human olfaction. J. Theor. Biol. 186 (3), 279–301.
im, J.K., Yoon, J.H., Kim, C.H., Nam, T.W., Shim, D.B., Shin, H.A., 2006. Particle imagevelocimetry measurements for the study of nasal airflow. Acta Otolaryngol. 126(3), 282–287.
im, S.K., Chung, S.K., 2004. An investigation on airflow in disordered nasal cavityand its corrected models by tomographic PIV. Meas. Sci. Technol. 15, 1090–1096.
imbell, J.S., Segal, R., Asgharian, B., Wong, B.A., Schroeter, J.D., Southall, J.P., Dick-ens, C.J., Brace, G., Miller, F.J., 2007. Characterization of deposition from nasalspray devices using a computational fluid dynamics model of the human nasalpassages. J. Aerosol Med. 20, 59–74.
leven, M., MeLaaen, M.C., Reimers, M., Rotnes, J.S., Aurdal, L., Djupesland, P.G., 2005.Using Computational Fluid Dynamics (CFD) to improve the bi-directional nasaldrug delivery concept. Food Bioprod. Process. 83 (C2), 107–117.
obbelt, L., Campagna, S., Vorsatz, J., Seidel, P.H., 1998. Interactive multi-resolutionmodeling on arbitrary meshes. In: Proceedings of the International Conferenceon Computer Graphics and Interactive Techniques, pp. 105–114.
ang, J., 1989. Clinical Anatomy of the Nose, Nasal Cavity and Paranasal Sinuses.George Thieme Verlag, New York.
indemann, J., Keck, T., Wiesmiller, K.M., Rettinger, G., Brambs, H.J., Pless, D., 2005a.
Numerical simulation of intranasal air flow and temperature after resection ofthe turbinates. Rhinology 43, 24–28.indemann, J., Brambs, H.J., Keck, T., Wiesmiller, K.M., Rettinger, G., Pless, D., 2005b.Numerical simulation of intranasal airflow after radical sinus surgery. Am. J.Otolaryngol. 26 (3), 175–180.
Z
Neurobiology 163 (2008) 100–110
indemann, J., Keck, T., Wiesmiller, K., Sander, B., Brambs, H.J., Rettinger, G., Pless, D.,2004. A numerical simulation of intranasal air temperature during inspiration.Laryngoscope 114, 1037–1041.
árquez Dorsch, F., Cenjor Espanol, C., Gutiérrez Fonseca, R., 1996. Acoustic rhinom-etry in a normal population. Acta Otorrinolaringol. Esp. 47 (2), 121–124.
ygind, N., Dahl, R., 1998. Anatomy, physiology and function of the nasal cavities inhealth and disease. Adv. Drug Deliv. Rev. 29 (1/2), 3–12.
aftali, S., Rosenfeld, M., Wolf, M., Elad, D., 2005. The air-conditioning capacity ofthe human nose. Ann. Biomed. Eng. 33, 545–553.
aftali, S., Schroter, R.C., Shiner, R.J., Elad, D., 1998. Transport phenomena in thehuman nasal cavity: a computational model. Ann. Biomed. Eng. 26, 831–839.
egus, V., 1958. Comparative Anatomy and Physiology of the Nose and ParanasalSinuses. F. and S. Livingstone Ltd., Edinburgh/London.
umminem, J., 2003. Clinical Validation of Rhinometric Measurements, AcademicDissertation. University of Tampere, Tampere, Finland.
hki, M., Naito, K., Cole, P., 1991. Dimension and resistance of the human nose: racialdifferences. Laryngoscope 101, 276–278.
roctor, D.F., 1977. The upper airways: nasal physiology and defense of the lungs.Am. Rev. Respir. Dis. 115, 97–129.
roctor, D.F., 1986. Form and function in the upper airways and larynx (Chapter 6).In: Fishman, A.P. (Ed.), The Handbook of Physiology Section 3: The RespiratorySystem Volume III. Mechanics of Breathing, Part 1. The American PhysiologicalSociety, Maryland, pp. 63–73.
roetz, A.W., 1951. Air currents in the upper respiratory tract and their clinicalimportance. Ann. Otol. Rhinol. Laryngol. 60, 439–467.
chreck, S., Sullivan, K.J., Ho, C.M., Chang, H.K., 1993. Correlations between flowresistance and geometry in a model of the human nose. J. Appl. Physiol. 75,1767–1775.
chroeter, J.D., Kimbell, J.S., Asgharian, B., 2006. Analysis of particle deposition inthe turbinate and olfactory regions using a human nasal computational fluiddynamics model. J. Aerosol Med.—Deposition Clearance and Effects in the Lung19 (3), 301–313.
chwab, K.H., v Hagens, G., 1981. Freeze substitution of macroscopic specimens forplastination. Abstract: Sixth European Anatomical Congress. Acta Anat. 111 (12),399.
haida, A.M., Kenyon, G.S., 2000. The nasal valves: changes in anatomy and physiol-ogy in normal subjects. Rhinology 38, 7–12.
hi, H., Kleinstreuer, C., Zhang, Z., 2006. Laminar airflow and nanoparticle or vapordeposition in a human nasal cavity model. ASME J. Biomech. Eng. 128, 697–706.
hi, H., Kleinstreuer, C., Zhang, Z., 2007. Modeling of inertial particle transportand deposition in human nasal cavities with wall roughness. J. Aerosol Sci. 38,398–419.
immen, D., Scherrer, J.L., Moe, K., Heinz, H., 1999. A dynamic and direct visualizationmodel for the study of nasal airflow. Arch. Otolaryngol. Head Neck Surg. 125,1015–1021.
onka, M., 1995. Image Processing, Analysis and Machine Vision. Chapman and HallComputing, pp. 422–442, 192–242.
ubramaniam, R.P., Richardson, R.B., Morgan, K.T., Kimbell, J.S., 1998. Computa-tional fluid dynamics simulations of inspiratory airflow in the human nose andnasopharynx. Inhal. Toxicol. 10 (2), 91–120.
uzina, A.H., Hamzah, M., Samsudin, A.R., 2003. Active anterior rhinomanometryanalysis in normal adult Malays. J. Laryngol. Otol. 117, 605–608.
wift, D.L., Proctor, D.F., 1977. Access of air to the respiratory tract. Respir. DefenseMech., 63–91.
aylor, D.J., Franke, V.E., Doorly, D.J., Schroter, R.C., 2005. Airflow in the human nasalcavity. In: Proceedings of the ASME SBC05 Summer Bioengineering Meeting,June 22–26, 2005, Colorado, USA.
aylor, D.J., Doorly, D.J., Schroter, R.C., 2008a. Inflow boundary profile effects onnumerical simulations of nasal airflow, Imperial College Aeronautics Report IC08-01. Extended account also to be published.
aylor, D.J., Gambaruto, A.M., Tebutt, G., Doorly, D.J., Schroter, R.C., 2008. Computa-tional simulation of nasal airflow: convergence and sensitivity. To be published.
on Hagens, G., Tiedemann, K., Kriz, W., 1987. The current potential of plastination.Anat. Embryol. 175, 41–421.
eeks Jr., A.R., 1996. Fundamentals of Electronic Image Processing. SPIE/IEEE Serieson Image Science and Engineering, pp. 333–359, 452–470.
einhold, I., Mlynski, G., 2004. Numerical simulation of airflow in the human nose.Eur. Arch. Otorhinolaryngol. 261, 452–455.
en, J., Inthavong, K., Tu, J., Wang, S., 2008. Numerical simulations for detailedairflow dynamics in a human nasal cavity. Respir. Physiol. Neurobiol. 161 (2),125–135.
exler, D., Segal, R., Kimbell, J., 2005. Aerodynamic effects of inferior turbinatereduction computational fluid dynamics simulation. Arch. Otolaryngol. HeadNeck Surg. 131, 1102–1107.
olf, M., Naftali, S., Schroter, R.C., Elad, D., 2004. Air-conditioning characteristics ofthe human nose. J. Laryngol. Otol. 118, 87–92.
hang, Z., Kleinstreuer, C., 2004. Airflow structures and nano-particle deposition ina human upper airway model. J. Comput. Phys. 198, 178–210.
nasal air flow and odorant transport patterns: implications for olfaction. Chem.Senses 29, 365–379.
hao, K., Dalton, P., Yang, G.C., Scherer, P.W., 2006. Numerical modeling of turbulentand laminar airflow and odorant transport during sniffing in the human and ratnose. Chem. Senses 31 (2), 107–118.