Mechanical Stability Diagrams for Thermal Barrier Coating ...
14
PEER REVIEWED Mechanical Stability Diagrams for Thermal Barrier Coating Systems Mario Rudolphi 1 • Mathias Christian Galetz 1 • Michael Schu ¨tze 1 Submitted: 22 July 2020 / in revised form: 17 December 2020 / Accepted: 11 January 2021 / Published online: 9 February 2021 Ó The Author(s) 2021 Abstract Loss of mechanical integrity due to thermal aging and subsequent spallation of the ceramic top layer is one of the dominant failure mechanisms in thermal barrier coating systems. In order to predict and avoid such mechanical failure, a strain-based lifetime assessment model is presented for a novel double-layer thermal barrier system. The investigated ceramic system consists of a gadolinium zirconate layer on top of a layer of yttria-sta- bilized zirconia prepared by atmospheric plasma spraying. The mechanical stability diagrams generated by the model delineate areas of safe operation from areas where mechanical damage of the thermal barrier coating becomes imminent. Intensive ceramographic inspection is used to investigate the defect growth kinetics in the ceramic top coat after isothermal exposure. Four-point bending exper- iments with in situ acoustic emission measurement are utilized to determine the critical strain to failure. The results are then used to generate mechanical stability dia- grams for the thermal barrier coatings. From these dia- grams, it becomes evident that the gadolinium zirconate layer has significantly lower strain tolerance than the yttria- stabilized zirconia. However, the underlying yttria-stabi- lized zirconia layer will provide some thermal protection even when the gadolinium zirconate layer has failed. Keywords acoustic emission measurement critical strain defect growth four-point bending mechanical failure mechanical stability diagram thermal barrier coating Introduction Thermal barrier coating (TBC) systems are a vital part of state-of-the-art turbine engines providing a thermal gradi- ent between the combustion gas environment and base metal of the structural component. TBC systems usually consist of a ceramic top coat and a metallic bond coat layer on Ni-base superalloy material. While the ceramic top coat provides low thermal conductivity, the metallic bond coat ensures good oxidation resistance and improved bonding to the substrate. The benefit of such coatings is a reduced cooling effort and lower metal temperatures and thus longer component lifetime and increased efficiency (Ref 1- 3). Over the last decades, yttria-stabilized zirconia (YSZ) has been established as the standard material for the cera- mic top coat, due to its low thermal conductivity, relatively high coefficient of thermal expansion and high strain tol- erance. However, increased sintering and phase transfor- mations limit the use of YSZ for long-term operation to temperatures below 1200 °C (Ref 3-5). For further improvement of turbine efficiency and component lifetime, it is therefore necessary to evaluate new materials with better phase stability up to very high temperatures and ideally even lower thermal conductivity. Gadolinium zir- conate (GZO) is one material among a list of possible candidates that satisfies these requirements (Ref 6), how- ever, it also exhibits a reduced fracture toughness com- pared with YSZ (Ref 7). To benefit from the excellent phase stability and low thermal conductivity of GZO and also from the superior mechanical stability of YSZ, a double-layer concept was proposed (Ref 8, 9). In this work, a double-layer system prepared by atmospheric plasma spraying (APS) was investigated. In recent years, the protective capability of thermal barrier coatings has been incorporated into the design of & Mario Rudolphi [email protected] 1 DECHEMA-Forschungsinstitut, Theodor-Heuss-Allee 25, 60486 Frankfurt am Main, Germany 123 J Therm Spray Tech (2021) 30:694–707 https://doi.org/10.1007/s11666-021-01163-5
Transcript of Mechanical Stability Diagrams for Thermal Barrier Coating ...
PEER REVIEWED
Mechanical Stability Diagrams for Thermal Barrier CoatingSystems
Mario Rudolphi1 • Mathias Christian Galetz1 • Michael Schutze1
Submitted: 22 July 2020 / in revised form: 17 December 2020 / Accepted: 11 January 2021 / Published online: 9 February 2021
� The Author(s) 2021
Abstract Loss of mechanical integrity due to thermal
aging and subsequent spallation of the ceramic top layer is
one of the dominant failure mechanisms in thermal barrier
coating systems. In order to predict and avoid such
mechanical failure, a strain-based lifetime assessment
model is presented for a novel double-layer thermal barrier
system. The investigated ceramic system consists of a
gadolinium zirconate layer on top of a layer of yttria-sta-
bilized zirconia prepared by atmospheric plasma spraying.
The mechanical stability diagrams generated by the model
delineate areas of safe operation from areas where
mechanical damage of the thermal barrier coating becomes
imminent. Intensive ceramographic inspection is used to
investigate the defect growth kinetics in the ceramic top
coat after isothermal exposure. Four-point bending exper-
iments with in situ acoustic emission measurement are
utilized to determine the critical strain to failure. The
results are then used to generate mechanical stability dia-
grams for the thermal barrier coatings. From these dia-
grams, it becomes evident that the gadolinium zirconate
layer has significantly lower strain tolerance than the yttria-
stabilized zirconia. However, the underlying yttria-stabi-
lized zirconia layer will provide some thermal protection
even when the gadolinium zirconate layer has failed.
Keywords acoustic emission measurement � criticalstrain � defect growth � four-point bending � mechanical
failure � mechanical stability diagram � thermal barrier
coating
Introduction
Thermal barrier coating (TBC) systems are a vital part of
state-of-the-art turbine engines providing a thermal gradi-
ent between the combustion gas environment and base
metal of the structural component. TBC systems usually
consist of a ceramic top coat and a metallic bond coat layer
on Ni-base superalloy material. While the ceramic top coat
provides low thermal conductivity, the metallic bond coat
ensures good oxidation resistance and improved bonding to
the substrate. The benefit of such coatings is a reduced
cooling effort and lower metal temperatures and thus
longer component lifetime and increased efficiency (Ref 1-
3). Over the last decades, yttria-stabilized zirconia (YSZ)
has been established as the standard material for the cera-
mic top coat, due to its low thermal conductivity, relatively
high coefficient of thermal expansion and high strain tol-
erance. However, increased sintering and phase transfor-
mations limit the use of YSZ for long-term operation to
temperatures below 1200 �C (Ref 3-5). For further
improvement of turbine efficiency and component lifetime,
it is therefore necessary to evaluate new materials with
better phase stability up to very high temperatures and
ideally even lower thermal conductivity. Gadolinium zir-
conate (GZO) is one material among a list of possible
candidates that satisfies these requirements (Ref 6), how-
ever, it also exhibits a reduced fracture toughness com-
pared with YSZ (Ref 7). To benefit from the excellent
phase stability and low thermal conductivity of GZO and
also from the superior mechanical stability of YSZ, a
double-layer concept was proposed (Ref 8, 9). In this work,
a double-layer system prepared by atmospheric plasma
spraying (APS) was investigated.
In recent years, the protective capability of thermal
barrier coatings has been incorporated into the design of
& Mario Rudolphi
1 DECHEMA-Forschungsinstitut, Theodor-Heuss-Allee 25,
60486 Frankfurt am Main, Germany
123
J Therm Spray Tech (2021) 30:694–707
https://doi.org/10.1007/s11666-021-01163-5

gas turbines and thus the loss of the ceramic coating has
significant negative impact on the remaining lifetime of
e.g., turbine blades, vanes or heat shield plates. Conse-
quently, lifetime assessment of thermal barrier coating
systems is an important necessity (Ref 10). High-temper-
ature exposure of ceramic materials induces sintering and
an increase in stiffness with prolonged exposure. Further-
more, in the case of thermal barrier coatings, oxidation of
the bond coat leads to the formation of an alumina inter-
layer (thermally grown oxide, TGO) between the metallic
bond coat and the ceramic top coat, which induces growth
stresses into the system (Ref 11, 12). Upon cooling to room
temperature the thermal mismatch stresses in combination
with those two effects will result in an increase of damage
that is introduced into the ceramic top coat with prolonged
exposure. As a consequence, the length of cracks and
defects in the ceramic is increasing. According to Griffith’s
theory of brittle failure (Ref 13), the critical stress to failure
of ceramic (brittle) materials is inversely proportional to
the square root of the size of the largest defect present in
the ceramic system. Hence, the mechanical properties of a
ceramic coating can be representative of the degradation
state of the ceramic material, in terms of microcrack for-
mation and previous works have shown that four-point
bending can be a suitable tool to investigate the mechanical
degradation of TBC materials (Ref 14). The objective of
this work was therefore to assess the strain tolerance of the
ceramic top coatings when subjected to bending load (i.e.,
their critical strain values) and from these results to
develop a novel fracture mechanics-based model for life-
time assessment of thermal barrier coatings. An intensive
analysis of the microcrack network and defect structure of
the coatings was carried out in combination with four-point
bending experiments to investigate the aging effect on
crack growth and the mechanical properties of the ceramic
top coat. The results were combined with physical property
data (Ref 15) from our project partners to establish
mechanical stability diagrams that allow identification of
areas of safe operation and of areas where mechanical
failure is impending.
Experimental
Sample Preparation and Isothermal Oxidation
Single crystal nickel-based superalloy PWA 1483 was used
as substrate material. Bending bars (80 9 10 9 5 mm3)
were cut by electrical discharge machining (EDM) from
the material so that the \100[ orientation is along the
length of the bending specimen. A 2 mm deep notch of
20 mm width was machined into the bottom side of the
specimen to intentionally weaken the bending bar in an
area between the inner loading points. This is to avoid that
damage of the ceramic top coat during the bending test
originates from the loading points. After preparation of
individual bending bars from the substrate material, the
thermal barrier coatings were applied by an industrial
partner. Two coating systems were investigated in this
study, each with two levels of porosity. The first system S1
is a standard TBC with a single-layer ceramic coating
consisting of a 500 lm thick 8 wt.% yttria-stabilized zir-
conia (8YSZ) layer prepared by atmospheric plasma
spraying (APS) on top of a 330 lm thick bond coat layer of
NiCoCrAlY (LCO22) prepared by vacuum plasma spray-
ing (VPS). The second system S2 consisted of an identical
bond coat and a double-layer ceramic approach, compris-
ing a 400 lm thick layer of gadolinium zirconate (Gd2-Zr2O7, GZO) on top of a 100 lm thick layer of 8YSZ. To
investigate the effect of porosity on defect/crack growth
and mechanical stability, the ceramic top coats were pro-
duced with two different porosity levels: (1) a lower
porosity level of nominal 5-9%, labelled LP, and (2) a
higher level of nominal 16-20%, labelled HP. Both double-
layer coatings were produced using a low-porosity (LP)
YSZ bottom layer and varying only the porosity of the
GZO top layer. The coating porosity was verified in the as-
sprayed state using cross-sectional SEM images and image
analytical methods and mercury intrusion (Ref 15). Fig-
ure 3 shows SEM images of the four different coating
variants in the as-sprayed state to illustrate the coating
microstructure after processing.
Different levels of damage were introduced into the
coating system by isothermal oxidation of the specimens in
a box furnace at 1050 �C for durations up to 1500 h in
laboratory air. A second set of samples was oxidized at
1100 �C for durations up to 500 h. An overview of the
sample nomenclature and oxidation conditions is given in
Table 1. Micrographs of the coating systems after oxidation
are given in Fig. 4. Several cracks are marked in the
micrographs with red ellipses.
Mechanical Testing
Four-point bending was performed on a universal testing
machine (Hegewald & Peschke, InspectTable50) using a
self-designed bending setup. Acoustic emission measure-
ment was utilized for in situ detection of microcracking
within the ceramic top layer during the bending test.
Acoustic signals were recorded using a Physical Acoustics
PCI card with amplifiers of type 20/40/60 and WD sensors.
A setup with two sensors was used to eliminate unwanted
noise signals and to discriminate the inner region of the
sample with the linear location technique. Due to the size
limitation within the bending setup, the sensors were
attached to the specimen via wave-guide wires by spot
J Therm Spray Tech (2021) 30:694–707 695
123

welding. Figure 1 illustrates the setup of the bending
experiment and a typical result data set. The bending
geometry used for the current investigation was 64 mm
distance between the outer load points and 36 mm between
the inner load points. Load point displacement was mea-
sured using a linear variable differential transformer
(LVDT). The displacement data were converted into strain
data by a solution of the Euler–Bernoulli beam equation
assuming linear elastic behavior of the materials. The beam
equation was set up for a composite bending bar with three
layers (substrate, bond coating and ceramic top coating)
and it accounts for the individual Young’s modulus and
thickness of each layer. Please note that, the ceramic top
coating was not subdivided in the analysis of the GZO/YSZ
double-layer system. A shape change of the metallic sub-
strate (i.e., deformation) is also not considered by the beam
equation. Since the strain in a beam under bending is a
function of the distance to the neutral fiber (geometrical
position in the bending bar where there is no stress or strain
upon bending) and the observed failure modes originate at
different height in the beam, the strain was evaluated at
different positions for each failure mode. Table 2 lists the
possible failure modes and the position within the bending
beam at which the corresponding experimental strain value
was calculated. The critical strain to coating failure ec wasdefined as the first significant increase in acoustic emission
(see Fig. 1b). It should be noted that due to limitations in
sample numbers no statistical evaluation of critical strain
values was performed. The resolution of the measurement
setup is \ 0.005% strain, and hence individual measure-
ment results are given with two digits after the decimal
point. However, the statistical variation is believed to be
around ± 0.05% strain.
Microstructural Investigation
After the bending test, the samples were vacuum-embed-
ded in epoxy resin for ceramographic inspection. Cross
sections of the unstrained part of the specimens were pre-
pared to study the microstructure of the ceramic coating
after oxidation and to investigate the crack and/or defect
growth. Up to six SEM overlapping images were taken side
by side at moderate magnification of 100x to cover a length
of about 4 mm for crack/defect analysis. The images were
subsequently stitched to a panoramic image and length and
orientation of defects/cracks were analyzed. Since no
Table 1 Sample nomenclature and oxidation conditions.
Nomenclature Type Top coating Porosity level Bond coating Oxidation
S1 HP Single-layer TBC 8YSZ, 500 lm 16-20% NiCoCrAlY, 330 lm 1050 �C: 100 h, 500 h, 1500 h
1100 �C: 100 h, 300 h, 500 hS1 LP 5-9%
S2 HP Double-layer TBC GZO, 100 lm
8YSZ, 400 lm
GZO: 16-20%
YSZ: 5-9%
1050 �C: 100 h, 500 h, 1000 h
1100 �C: 100 h, 300 h, 500 h
S2 LP GZO: 5-9%
YSZ: 5-9%
Fig. 1 Schematic illustration of four-point bending setup with in situ acoustic emission measurement (a), and typical result data set (b) with
acoustic signals (red bars) and stress-strain curve (line). The onset of significant acoustic emission is used to define the critical strain ec.
696 J Therm Spray Tech (2021) 30:694–707
123

robust method for software-automated crack detection
could be found, manual marking of the cracks was per-
formed on the stitched SEM image using the software
package FIJI (Ref 16). Figure 2 provides a schematic
representation of the analysis strategy. Please note that,
when cracks or pores are located in close neighborhood
they may start to interact. As a consequence, the effective
length of the total crack/pore-field has to be considered in
fracture mechanical considerations. A summary of crack
interaction rules is given in (Ref 17). These rules were
applied in the context of the crack analysis. In the fol-
lowing, the term crack will also be used as a synonym for
the effective length of a crack field. The marked cracks
were analyzed in terms of their orientation with respect to
the ceramic/bond coat interface and length, resulting in six
different categories of cracks. Firstly, cracks were catego-
rized according to the failure mode they will most likely
trigger. Cracks which are almost parallel to the interface
(0� � a� 30�, where a is the angle between the bond coat/
ceramic-interface and the crack) were categorized as ‘‘de-
lamination’’, cracks that lie around 45� (30�\a\60�)
were categorized as ‘‘shear’’, and cracks which run mostly
orthogonal to the interface (60� � a� 90�) were catego-
rized as ‘‘segmentation’’. Secondly, a distinction with
regards to their position in the ceramic was made, splitting
the above categories into two parts, depending on whether
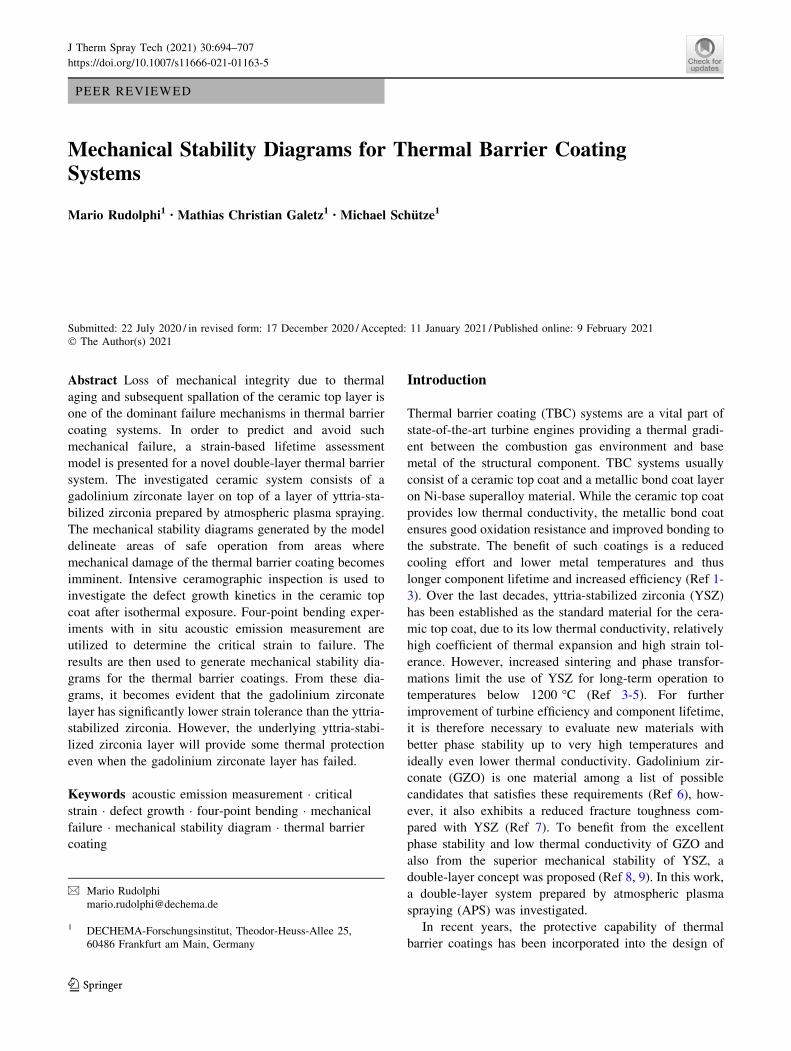
they mostly lie within the YSZ or GZO layer. Figure 3
gives a graphical representation of the statistics observed
on GZO/YSZ coatings after crack detection. Fig-
ure 3(a) and (c) shows the histogram data for the individual
crack categories, while Fig. 3(b) and (d) summarizes the
data in the form of box-plots. As can be seen from the
figure, the limited number of cracks obtained by the
manual analysis and the successive categorization result in
only few categories with a reasonable number of data
points. Hence, an automated and verified approach for
crack detection should be strived for, especially when
usage of the presented model is planned in industrial
applications. For the aims of this work, a number of
100-150 cracks were identified and analyzed in the stitched
SEM image of each specimen.
Segmenta�onnormal to interface
( 60° < α < 90° )
Sheardiagonal
(30° < α < 60°)
Delamina�onparallel to interface
(0° < α < 30°)
α YSZ/BCinterface
Fig. 2 Categorization of
defects/cracks with respect to
the three corresponding failure
modes and SEM image
illustrating the different defect
orientations.
Table 2 Mechanical failure
types for the investigated single-
layer and double-layer TBC
systems under bending
conditions
Failure type Loading Experimental strain evaluated at Modelling equation
GZO segmentation Tension GZO top surface 3.4
YSZ segmentation Tension GZO/YSZ interface(a)/YSZ top surface 3.4
GZO delamination Tension GZO/YSZ interface 3.2
YSZ delamination Tension YSZ/BC interface 3.2
GZO delamination failure Compression GZO/YSZ interface (not observed) 3.3 (not used)
YSZ delamination failure Compression YSZ/BC interface (not observed) 3.3 (not used)
GZO shear failure Compression GZO top surface 3.5
YSZ shear failure Compression YSZ top surface 3.5
(a)Indistinguishable from GZO segmentation in double-layer TBCs, thus not evaluated for double-layer
TBCs
J Therm Spray Tech (2021) 30:694–707 697
123

Modelling Approach
A fracture mechanics approach was used to evaluate the
remaining lifetime of the thermal barrier coating systems.
The approach is based on the theory of brittle failure by
Griffith and subsequent modifications by Irwin (Ref
13, 18). According to their work, the failure stress rc is
inversely proportional to the square root of the size of the
physical defect c which causes failure. The proportionality
constant Kc is the fracture toughness and is a material
property.
rc ¼ ec � E / Kcffiffiffiffiffi
pcp ðEq 3:1Þ
where ec is the critical elastic strain and E the Young’s
modulus of the brittle material. The fracture toughness
value is dependent on the fracture mode. Either KIc or KIIc
are used for mode I (tensile crack opening) or mode II
(shear failure). Not many experimental KIIc data is avail-
able in literature and usually it is expected that KIc �KIIc,
therefore using KIc is at least a conservative approximation
(Ref 19). For the different failure modes that can occur in a
three-dimensional body, Eq (3.1) can be modified to yield
(Ref 19):
With d the thickness of the ceramic coating, r the
ceramic/bond coat interface roughness and m the Poisson’s
ratio of the ceramic. The factor f is a geometry parameter
that depends on the shape and the orientation of the defect.
Usually, values between 0.63 and 1.12 are considered
corresponding to a semicircular surface notch of radius c
and a surface notch of infinite length (Ref 19-21), respec-
tively. For this work, the combined expression Kc/f was
derived from the experimental data, since the shape factor f
is unknown in systems with microcrack networks. The
fracture toughness can nevertheless be estimated by pick-
ing a certain value for f or just assuming unity.
A delamination in compressive loading was not
observed for the studied thermal barrier coatings, indicat-
ing a good adhesion between bond coat and ceramic top
coat. When adhesion between both layers is good, simul-
taneous shear-failure and delamination may occur. The set
of Eq (3.2) to (3.5) can be used for all brittle ceramic
layers.
Results and Discussion
Defect Analysis/Crack Growth Kinetics
Microstructures of the investigated coatings are given in
Figs. 4 and 5 for the as-sprayed state and after oxidation at
1050 �C, respectively. This is to illustrate the pore structureof the coatings as well as the development of cracks in the
coating during oxidation. From a fracture mechanical
standpoint, the largest crack is most likely to initiate failure
of a brittle material. Hence, the maximum effective crack
length (while applying the crack interaction rules) was used
in the modeling approach. Figure 6 shows the maximum
detected crack length in the YSZ single-layer TBCs for the
three different categories segmentation, shear and delami-
nation as a function of exposure time at 1050 �C. The datafrom the low-porosity coating are plotted with closed
symbols; the data for the high-porosity coating are plotted
using open symbols. As can be seen, the high-porosity
coatings exhibit higher crack length values for the cate-
gories delamination and shear. Only the segmentation
cracks oriented orthogonal to the coating surface show
little difference between the high- and the low-porosity
variant of the YSZ coating. This can be attributed to the
microstructure of APS coatings, where the boundaries
between the individual splats are mostly parallel to the
bond coat/YSZ interface or are rather slightly tilted with
respect to that interface. The intersplat boundaries can—to
some extent—be viewed as weak points in terms of
mechanical strength of the ceramic material and may
provide a template for crack propagation. Consequently,
the microstructure of APS coatings is promoting crack
growth in the two categories delamination and shear.
Segmentation cracks originating from the TBC top surface
have no intersplat boundaries to follow and will often be
deflected into other orientations rather than growing at high
rates. Note, there is also a technical limit in the length of
segmentation and shear cracks due to the finite thickness of
the ceramic coating and the way the crack categories are
defined. A segmentation crack in a 500 lm ceramic layer
can be up to 577 lm long when complying with the cate-
gorization rules above.
The maximum defect size detected in the double-layer
GZO/YSZ coatings is depicted in Fig. 7 for the low-
porosity variant (a) and for the high-porosity coating (b),
Tension Compression
Delamination edelþc ¼ 2Kc
f �ETBC �ffiffiffiffi
pcp (3.2) edel�c ¼ � Kc
f �ffiffiffiffi
pcp � 1þr=dð Þ 1þmð Þ
2ETBC
(3.3)
Through esegþc ¼ Kc
f �ETBC �ffiffiffiffi
pcp (3.4) esh�c ¼ � 2Kc
f �ETBC �ffiffiffiffi
pcp (3.5)
698 J Therm Spray Tech (2021) 30:694–707
123
respectively. The cracks categorized as delamination have
the highest magnitude and growth rates, as was observed
for the single-layer YSZ coatings. All categories show a
more or less increasing trend with prolonged oxidation
time. The strongest increase is observed for the delami-
nation cracks, while the segmentation cracks show a rather
stagnant behavior with only very little increase. The
delamination cracks in the low-porosity coating seem to
grow faster and to higher values than in the high-porosity
coatings. It seems that the high-porosity coating is able to
accommodate stresses better, possibly by diluting stress
amplitudes in the microcrack network and around pores.
Mechanical Testing
A typical test result obtained from a four-point bending test
of a GZO/YSZ double-layer coating under compressive
loading is given in Fig. 8. Two distinct peaks arise in the
acoustic emission signal (red bars) mostly coincident with
a drop in the stress-strain curve (black line), Fig. 8(a). The
two peaks labelled ‘‘1.’’ and ‘‘2.’’ correspond to failure of
the GZO top ceramic layer and failure of the underlying
YSZ ceramic layer, respectively. Photographs of the sam-
ple during the test at the individual time points (Fig. 8b)
show that at point ‘‘1.’’ the top GZO layer has developed
shear cracks and is delaminating from the underlying YSZ
layer. At point ‘‘2.’’ the YSZ layer is also cracked and is
delaminating from the metallic compound (i.e., bond coat
and superalloy). As mentioned above, the sudden increase
in the acoustic emission signal was used to define the
critical strain to failure of the GZO top layer and the YSZ
bottom layer. In a very similar manner, segmentation
failure and delamination failure can be distinguished from
the acoustic emission signals under tensile loading of the
four-point bending specimen.
Fig. 3 Statistic representation of the categorized crack/defect length measurements of GZO/YSZ thermal barrier coatings in the as-sprayed state
(a) and (b) and after 1000 h of oxidation at 1050 �C (c) and (d).
J Therm Spray Tech (2021) 30:694–707 699
123

Figure 9 summarizes the results of the four-point
bending tests on the single-layered YSZ coatings with high
and low porosity after oxidation at 1050 �C (Fig. 9a) and
1100 �C (Fig. 9b). Open symbols are used in the plot for
the high-porosity variant YSZ-HP of the coating, whereas
closed symbols are used for the low-porosity variant YSZ-
LP of the coating. Only one failure mode was observed
under compressive loading conditions: all samples devel-
oped a large shear crack traversing diagonally through the
ceramic layer. This was instantaneously followed by
delamination of the YSZ ceramic along the ceramic/bond
coat interface. No distinction between shear failure and
200 μm200 μm
200 μm200 μm
S1 – LP, as-sprayed S1 – HP, as-sprayed
S2 – HP, as-sprayedS2 – LP, as-sprayed
YSZ (LP)
BC
YSZ (HP)
BC
GZO (HP)
BC
YSZ (LP)
GZO (LP)
BC
YSZ (LP)
(a) (b)
(c) (d)
Fig. 4 SEM images (BSE
mode) of the investigated
coatings in the as-sprayed state.
(a) system S1-LP, (b) system
S1-HP, (c) system S2.LP and
(d) system S2-HP.
(a) (b)
(c) (d)
200 μm
200 μm
200 μm
200 μm
YSZ (LP)
BC
YSZ (HP)
BC
GZO (HP)
BC
GZO (LP)
BC
YSZ (LP)
S1 – LP, 1050°C, 1500 h S1 – HP, 1050°C, 1500 h
S2 – HP, 1050°C, 1000 hS2 – LP, 1050°C, 1000 h
YSZ (LP)
Fig. 5 SEM images (BSE
mode) of the investigated
coatings after oxidation at
1050 �C for 1500 h (system S1)
and 1000 h (system S2).
(a) system S1-LP, (b) system
S1-HP, (c) system S2.LP and
(d) system S2-HP. Some cracks
are marked with red ellipses.
700 J Therm Spray Tech (2021) 30:694–707
123

delamination failure in compression was possible neither
from the acoustic emission nor the stress-strain curve.
Possibly, the interface adhesion to the bond coat is strong
enough to suppress the delamination failure mode in
compression. The critical strain values for YSZ shear
failure drop slightly with longer exposure time from about
- 1.8% (as-sprayed) to about - 1.4% (1500 h at 1050 �C)and - 1.3% (500 h at 1100 �C), respectively. No signifi-
cant difference is observed between the two porosity levels.
Tensile loading in the four-point bending configuration
results in two distinct failure modes and consequently in
two critical strain values for each exposure duration. At
first, segmentation cracks start to develop at the top YSZ
surface growing towards the bottom of the ceramic layer.
When the segmentation cracks hit the ceramic/bond coat
interface they get deflected and progress in the ceramic
parallel to the interface. This leads to delamination of the
ceramic top coat. The decrease in strain tolerance with
prolonged isothermal oxidation is higher for the tensile
failure modes, reducing from around 1.8% strain (as-
sprayed) to around 0.3% strain (1500 h at 1050 �C) for
segmentation failure and 1.9% (as-sprayed) to around 1.0%
(1500 h at 1050 �C) for delamination failure, respectively.
The decrease of the critical tensile strain values is also
higher when oxidized at higher temperatures. The values
drop to around 0.3% (500 h at 1100 �C) for segmentation
failure and to around 1.1% (500 h at 1100 �C), respec-tively. Again, there is no significant difference observed
between the two porosity levels. The decrease in critical
strain with prolonged exposure can be attributed mainly to
microstructural changes. In the initial stages of high-tem-
perature exposure, rapid sintering of microporosity is
observed leading to an increase in stiffness (Ref 15) and
thus in a decrease of the critical strain values according to
Eq 3.2 to 3.5. With further high-temperature exposure bond
coat oxidation and thus growth of the alumina TGO layer
will introduce stresses at the YSZ/bond coat interface
region. The highest impact on mechanical degradation in
the later stages of oxidation is, however, attributed to the
crack formation upon cooling to room temperature (in
combination with sintering of the ceramic during high-
temperature exposure) due to the thermal expansion mis-
match stresses between metallic substrate and ceramic top
layer. It should be noted that, even though porosity may
have a significant impact on TBC lifetime, the effect of
porosity on critical strain observed in this work was rela-
tively low in the case of the single-layer YSZ TBCs. The
authors believe that this is due to the fact that the
Fig. 6 Maximum defect size for the three categories delamination,
shear and segmentation, determined from SEM images of YSZ
(single-layer) coatings after isothermal oxidation at 1050 �C (HP =
higher porosity coating, open symbols; LP = lower porosity coating,
closed symbols).
Fig. 7 Maximum defect size for the three categories delamination, shear and segmentation, determined from SEM images of GZO/YSZ (double-
layer) coatings after isothermal oxidation at 1050 �C (HP = higher porosity coating, open symbols; LP = lower porosity coating, closed symbols).
J Therm Spray Tech (2021) 30:694–707 701
123

investigated oxidation durations are not long enough to
lead to significant interaction of individual cracks, and that,
with prolonged exposure the difference in physical defect
size and critical strain will increase.
The behavior of the double-layer TBCs is depicted in
Fig. 10. The critical strain to failure of the low-porosity
and high-porosity variant of the coating is shown in (a) and
(b), respectively. Note, the underlying YSZ coating is the
low-porosity variant in both cases, only the top GZO layer
was sprayed in two porosity levels. While in compressive
loading two clearly separated peaks in the acoustic emis-
sion signal enabled us to distinguish the shear failure of
GZO and YSZ, the acoustic signals recorded in tensile
loading were overlapping for the different failure modes
and impeded the data analysis. Nevertheless, data for GZO
segmentation (from where the cracks continue to grow into
the YSZ without significant change in the acoustic signal)
as well as for GZO and YSZ delamination could be gained.
As can be seen from the figure, the GZO top ceramic layer
fails prior to the underlying YSZ layer and even at lower
strain levels than the YSZ layer in the single-layer coating
(cf. Fig. 9). This demonstrates the lower intrinsic fracture
strength of GZO compared with YSZ as the failure strain
was evaluated with taking the distance to the neutral fiber
into account (c.f. Table 2). Under tensile load, the outer
GZO layer is prone to segmentation-crack formation at
similar values as the YSZ single-layer coating (e.g., 0.33%
and 0.38% strain, respectively, for the LP variant after
500 h at 1050 �C). However, delamination cracks start to
form at 1.43% strain in the YSZ-LP coating but at only
1.
GZO shear failure
2.
YSZ shear failure0.0 -0.5 -1.0 -1.5 -2.0 -2.5 -3.0
0
2000
4000
6000
8000
10000
12000
14000F591_054S2 - LP500h @ 1050°C
AE E
nerg
y
Outer fiber strain [%]
-0.83
-1.61
0
-100
-200
-300
-400
-500
-600
-700
-800
-900
-1000
Stre
ss [M
Pa]1. 2.
GZO-LP/YSZ-LP500h
1050°C
(a) (b)
Fig. 8 Stress-strain-curve and acoustic emission signals obtained during four-point bending test of a GZO/YSZ double-layer TBC specimen (a),
and optical observation of coating failure (b).
Fig. 9 Critical strain to failure of the ceramic YSZ top coat (single-
layer system S1) determined by four-point bending as a function of
isothermal oxidation at 1050 �C and 1100 �C, respectively (open
symbols = higher porosity coating, HP; closed symbols = lower
porosity coating, LP).
702 J Therm Spray Tech (2021) 30:694–707
123

0.61% strain in the GZO-LP coating. The strain tolerance
of the GZO-LP layer under compressive loading is also
significantly lower than that of the YSZ-LP coating (e.g.,
- 0.81% and - 1.74%, respectively, after 500 h at
1050 �C). The YSZ layer of the double-layer coating,
however, remains only little affected by the failure of the
top GZO layer, so that the failure of this bottom layer
occurs at slightly lower strain levels (e.g., 1.03% versus
1.43% strain for tensile shear failure and - 1.25% versus
- 1.74% strain for compressive shear failure, after 500 h
at 1050 �C). The double-layer coating will hence preserve
its protective function to some extent, after a loss of the
GZO top layer. Comparing the two porosity levels of the
GZO layer, it becomes evident that the high-porosity
variant of the GZO coating exhibits lower mechanical
strength, especially when considering the compressive
shear failure. This is in accordance with the expected crack
growth mechanism involving the interaction and coales-
cence of cracks, which should be accelerated when more
pores and defects are present. And it is also in agreement
with Griffith theory of brittle fracture with larger defects
leading to lower fracture strain levels.
The overall lower strain tolerance of the GZO layer is
attributed to the lower intrinsic fracture toughness of GZO
but may also be affected by less experience in coating
processing.
Mechanical Stability Diagrams
The equations given in Section 3 can be used to assess the
theoretical critical strain values and to set up mechanical
stability diagrams that describe the mechanical capability
of a brittle material. This approach has been used in a very
similar way to describe the failure of thermally grown
oxide scales (Ref 22, 23). The dominant parameters gov-
erning the evolution of the observed macroscopic
mechanical strength are the Young’s modulus E and the
micro-defect structure (i.e., size c of the defect causing
failure) in the ceramic coating. As a consequence of this,
the presented approach should also implicitly cover further
mechanisms that will generate microstructural damage in
the ceramic coating, such as growth of the TGO layer. The
fracture toughness Kc is a material constant in the context
of Griffith’s theory of brittle failure. It should be men-
tioned, however, that Kc (or rather a Kc value accessible by
measurement as opposed to an atomistic single crystal
value) is influenced by microstructural material character-
istics such as grain structure (i.e., size and orientations),
vacancy and dislocation concentrations and submicron
defects and may thus vary over time. Nevertheless, the
change in modulus and defect size observed in thermal
barrier coatings will greatly dominate the evolution of the
critical strain and hence modelling is focused on those two
parameters, while treating the Kc as a constant. Since the
shape factor f in such a complex microcrack network is
unknown, the combined factor Kc=f is used as fitting
parameter. The defect growth kinetics presented in Fig. 6
and 7 reveal a mostly linear trend for the maximum defect
size in the categories delamination and shear, whereas the
segmentation cracks appear rather stagnant. Hence, a linear
fit to the maximum crack length was used for each category
to produce the data for c in the model. The in-plane stiff-
ness for modelling was generated in a similar manner by
exponential fitting of the experimental data measured by
our project partners at TU Darmstadt on freestanding
coatings (Ref 15). The equations used in the model for
crack and stiffness evolution are given in Table 3, together
with the resulting fitting parameter Kc=f . By using separate
Fig. 10 Critical strain to failure of GZO/YSZ double-layer thermal
barrier coatings determined by four-point bending as a function of
isothermal oxidation at 1050 �C, (a) low-porosity variant, (b) high-
porosity variant. Note, only the GZO top layer was sprayed with two
porosity levels [indicated as GZO (LP) and GZO (HP)], while the
bottom YSZ layer was the low-porosity variant in both systems [YSZ
(LP)].
J Therm Spray Tech (2021) 30:694–707 703
123

equations for each individual coating layer, it is possible to
capture the evolution of each system in a quite accurate
way. It is worth noting that the values for Kc are in rea-
sonable agreement with other experimental data by Dwi-
vedi et al., where KIc-values of about 4.0 to 4.5 MPa/m1/2
for sintered YSZ and around 1.5 MPa/m1/2 for GZO are
reported (Ref 7). Assuming a shape factor f for the tensile
segmentation (mode I) failure of 0.64 (corresponding to a
semicircular surface notch), the resulting values of this
work for KIc are 4.95 MPa/m1/2 and 3.19 MPa/m1/2 for
YSZ-LP and YSZ-HP, respectively and 2.72 MPa/m1/2 for
the GZO-HP.
Figure 11 shows the modelled curves in comparison to
the experimental critical strain values for the single-layer
YSZ coating. The low-porosity variant of the single-layer
YSZ coating is presented in subfigure (a), while the high-
porosity variant is given in (b). The areas where no coating
failure is expected (safe operation) are colored in green,
whereas areas in which damage is to be expected are col-
ored in yellow (segmentation failure) and red (delamina-
tion or shear failure). In the early stages of oxidation
Table 3 Equations for defect size c and stiffness E of the ceramic layers used for modelling the critical strain to failure and derived fitting
parameter Kc/f for the different failure modes.
TBC system Failure mode Ceramic layer Kc/f, MPa*m1/2 2*c, lm E, GPa
YSZ-LP Tension segmentation YSZ-LP 3.15 132.10 ? 0.087*t 49.64 - 16.29*exp(- (1/41.82)*t)
Tension delamination YSZ-LP 8.41 143.63 ? 0.092*t 49.64 - 16.29*exp(- (1/41.82)*t)
Compression shear YSZ-LP 7.38 186.04 ? 0.266*t 49.64 - 16.29*exp(- (1/41.82)*t)
YSZ-HP Tension segmentation YSZ-HP 2.03 149.90 ? 0.031*t 33.50 - 9.12* exp(- (1/20)*t)
Tension delamination YSZ-HP 7.58 450.06 ? 0.303*t 33.50 - 9.12* exp(- (1/20)*t)
Compression shear YSZ-HP 6.11 250.54 ? 0.117*t 33.50 - 9.12* exp(- (1/20)*t)
GZO/YSZ-LP Tension segmentation GZO-LP 3.80 146.56 ? 0.130*t 68.8 - 42.9* exp(- (1/99.1)*t)
YSZ-LP … 98.18 ? 0.0*t 49.64 - 16.29* exp(- (1/41.82)*t)
Tension delamination GZO-LP 5.77 314.34 ? 0.103*t 68.8 - 42.9* exp(- (1/99.1)*t)
YSZ-LP 5.40 177.77 ? 0.370*t 49.64 - 16.29* exp(- (1/41.82)*t)
Compression shear GZO-LP 4.36 197.42 ? 0.0*t 68.8 - 42.9* exp(- (1/99.1)*t)
YSZ-LP 4.40 106.30 ? 0.052*t 49.64 - 16.29* exp(- (1/41.82)*t)
GZO/YSZ-HP Tension segmentation GZO-HP 1.73 144.28 ? 0.014*t 60.7 - 38.1* exp(- (1/641.)*t)
YSZ-LP … 111.82 ? 0.031*t 49.64 - 16.29* exp(- (1/41.82)*t)
Tension delamination GZO-HP 4.14 305.84 ? 0.141*t 60.7 - 38.1* exp(- (1/641.)*t)
YSZ-LP 4.74 225.79 ? 0.211*t 49.64 - 16.29* exp(- (1/41.82)*t)
Compression shear GZO-HP 2.28 271.21 ? 0.053*t 60.7 - 38.1* exp(- (1/641.)*t)
YSZ-LP 4.90 166.22 ? 0.007*t 49.64 - 16.29* exp(- (1/41.82)*t)
Fig. 11 Mechanical stability diagrams for the investigated YSZ thermal barrier coatings. The failure curves delineate areas of safe operation
from areas where failure becomes imminent. Data points are results from four-point bending test.
704 J Therm Spray Tech (2021) 30:694–707
123

(\ 500 h), the agreement of the model with the experi-
mental data is limited. This is probably due to differences
in the evolution of the coating stiffness between the four-
point bending specimens (constrained sintering) and the
freestanding TBC samples (free sintering) used to generate
the stiffness data. The results for the double-layer system
are given in Fig. 12 demonstrating the lower strain toler-
ance of the investigated GZO layer by a much smaller
green area of ‘‘safe operation’’ (Fig. 12a and b). The suc-
cessive failure of the underlying YSZ layer is represented
by the subfigures Fig. 12c and d. The YSZ layer remains
intact upon failure of the GZO top layer and can withstand
higher strain levels than the GZO. In a similar way as the
single-layer system, the agreement between modelled
curves and experimental data in the very early stages is
limited. Nevertheless, the model demonstrates how indi-
vidual properties influence the mechanical capability of
multilayered coating systems and how the mechanical
behavior of complex ceramic systems can be modelled
based on fracture mechanics. The mechanical capability of
the GZO/YSZ double-layer is lower than that of the YSZ
single-layer. This may partly be due to the lower intrinsic
fracture toughness of gadolinium zirconate, but also due to
the fact that there is significantly less experience in spray
processing GZO coatings compared to decades of coating
experience with YSZ coatings. Apparently, spray pro-
cessing can have significant impact on properties and
lifetime of GZO coatings (Ref 24, 25).
Conclusions
Mechanical four-point bend testing with acoustic emission
measurement was used to investigate the strain tolerance of
novel double-layer GZO/YSZ thermal barrier coatings in
comparison with state-of-the-art single-layer YSZ coatings.
The investigated GZO/YSZ double-layer coating exhibits
lower mechanical strength than the benchmark single-layer
YSZ coating. The lower observed failure strain is partly
due to the fact that the intrinsic fracture toughness of GZO
is lower than that of YSZ, but may also have a contribution
from less experience with processing of GZO coatings,
Fig. 12 Mechanical stability diagrams for the investigated GZO/YSZ double-layer coatings. The failure curves delineate areas of safe operation
from areas where failure becomes imminent. Data points are results from four-point bending test.
J Therm Spray Tech (2021) 30:694–707 705
123

since optimization of spray parameters was shown to play a
critical role in the performance of GZO coatings. The two
investigated porosity levels of the ceramic coatings
exhibited different levels of mechanical strength, with the
lower porosity variant resulting in higher critical strain
values, which is in accordance with Griffith’s theory of
brittle fracture.
In combination with physical property data, the critical
strain measurements enable the determination of novel
mechanical stability diagrams for thermal barrier coatings.
The mechanical stability diagrams can serve to distinguish
fields of save operation from operational conditions where
mechanical failure may occur for each individual coating
layer.
With these diagrams, it is thus possible to assess and
define operational limits (in terms of strain) and to estimate
the mechanical lifetime of thermal barrier coatings. How-
ever, precise knowledge of the defect growth kinetics is
required for adequate extrapolation and the database of the
investigated systems is still too limited for such task.
Hence, if the presented model were to be used for industrial
lifetime assessment, a more detailed investigation of the
defect growth is advised and longer exposure durations
should be investigated.
Acknowledgments This work was funded by the German Research
Foundation (Deutsche Forschungsgemeinschaft, DFG, Grant No.
SCHU 729/25) and the German Research Association for Combustion
Engines (Forschungsvereinigung Verbrennungskraftmaschinen e.V.,
FVV, Grant No. 1108) which is gratefully acknowledged. We also
thank the German working group ‘‘Thermal Barrier Coatings’’ of the
FVV under chairmanship of Dr. Werner Stamm, Siemens AG, for
their guidance and scientific discussion. Additional financial support
for coating processing and substrate material was provided by Sie-
mens AG, ALSTOM (Switzerland) Ltd., MAN Turbo & Diesel SE,
Rolls-Royce Deutschland Ltd. & Co. KG and MTU Aero Engines
GmbH, which is also gratefully acknowledged. Special thanks go to
our project partners Dr. Martin Frommherz, IfW, TU Darmstadt and
Dr. Emine Bakan, IEK-1, FZ Julich for sharing stiffness data and
porosity data, respectively.
Funding Open Access funding enabled and organized by Projekt
DEAL.
Open Access This article is licensed under a Creative Commons
Attribution 4.0 International License, which permits use, sharing,
adaptation, distribution and reproduction in any medium or format, as
long as you give appropriate credit to the original author(s) and the
source, provide a link to the Creative Commons licence, and indicate
if changes were made. The images or other third party material in this
article are included in the article’s Creative Commons licence, unless
indicated otherwise in a credit line to the material. If material is not
included in the article’s Creative Commons licence and your intended
use is not permitted by statutory regulation or exceeds the permitted
use, you will need to obtain permission directly from the copyright
holder. To view a copy of this licence, visit http://creativecommons.
org/licenses/by/4.0/.
References
1. T.E. Strangman, Thermal Barrier Coatings for Turbine Airfoils,
Thin Solid Films, 1985, 127(1–2), p 93–106.
2. S.M. Meier, D.K. Gupta and K.D. Sheffler, Ceramic Thermal
Barrier Coatings For Commercial Gas Turbine Engines, JOM,
1991, 43(3), p 50–53.
3. D.R. Clarke, M. Oechsner and N.P. Padture, Thermal-Barrier
Coatings for More Efficient Gas-Turbine Engines, MRS Bull.,2012, 37(10), p 891–898.
4. R.A. Miller, J.L. Smialek, and R.G. Garlick, Phase Stability in
Plasma-Sprayed, Partially Stabilized Zirconia-Yttria, Science and
Technology of Zirconia, The American Ceramic Society, 1981,
p 241–253.
5. G. Witz, V. Shklover, W. Steurer, S. Bachegowda and H.-P.
Bossmann, Phase Evolution in Yttria-Stabilized Zirconia Ther-
mal Barrier Coatings Studied By Rietveld Refinement of X-Ray
Powder Diffraction Patterns, J. Am. Ceram. Soc., 2007, 90(9),p 2935–2940.
6. R. Vassen, X. Cao, F. Tietz, D. Basu and D. Stover, Zirconates as
New Materials for Thermal Barrier Coatings, J. Am. Ceram. Soc.,2000, 83(8), p 2023–2028.
7. G. Dwivedi, V. Viswanathan, S. Sampath, A. Shyam and E. Lara-
Curzio, Fracture Toughness of Plasma-Sprayed Thermal Barrier
Ceramics: Influence of Processing, Microstructure, and Thermal
Aging, J. Am. Ceram. Soc., 2014, 97, p 2736–2744.
8. R. Vassen, A. Stuke and D. Stover, Recent Developments in the
Field of Thermal Barrier Coatings, J. Therm. Spray Technol.,2009, 18(2), p 181–186.
9. D. Stover, G. Pracht, H. Lehmann, M. Dietrich, J.-E. Doring and
R. Vaßen, New Material Concepts for the Next Generation of
Plasma-Sprayed Thermal Barrier Coatings, J. Therm. SprayTechnol., 2004, 13(1), p 76–83.
10. D.P. Renusch, H. Echsler and M. Schutze, The Role that Inter-
acting Failure Mechanisms Have on the Lifetime of APS-TBC
Under Oxidizing Conditions, Mater. Sci. Forum, 2004, 461–464,p 729–736.
11. D.P. Renusch, H. Echsler and M. Schutze, Progress in Life Time
Modeling of APS-TBC Part I: Residual, Thermal and Growth
Stresses Including the Role of Thermal Fatigue, Mater. HighTemp., 2004, 21(2), p 65–76.
12. H. Echsler, D.P. Renusch and M. Schutze, Bond Coat Oxidation
and Its Significance for Life Expectancy of Thermal Barrier
Coating Systems, Mater. Sci. Technol., 2004, 20, p 307–318.
13. A.A. Griffith, The Phenomena of Rupture and Flow in Solids,
Philos. Trans. R. Soc. Lond. A, 1921, 221(1), p 163–198.
14. D.P. Renusch, H. Echsler and M. Schutze, Progress in Life Time
Modeling of APS-TBC Part II: Critical Strains, Macro-Cracking,
and Thermal Fatigue, Mater. High Temp., 2004, 21(2), p 1–13.
15. M. Frommherz, A. Scholz, M. Oechsner, E. Bakan and R. Vaßen,
Gadolinium Zirconate/Ysz Thermal Barrier Coatings: Mixed-
Mode Interfacial Fracture Toughness and Sintering Behavior,
Surf. Coat. Technol., 2016, 286, p 119–128.
16. J. Schindelin, I. Arganda-Carreras, E. Frise, V. Kaynig, M.
Longair, T. Pietzsch, S. Preibisch, C. Rueden, S. Saalfeld, B.
Schmid, J.Y. Tinevez, D.J. White, V. Hartenstein, K. Eliceiri, P.
Tomancak and A. Cardona, Fiji: An Open-Source Platform for
Biological-Image Analysis, Nat. Methods, 2012, 9, p 676.
17. P. Hancock and J.R. Nicholls, Application of Fracture Mechanics
to Failure of Surface Oxide Scales, Mater. Sci. Technol., 1988,4(5), p 398–406.
18. G.R. Irwin, Analysis of Stresses and Strains Near the End of a
Crack Traversing a Plate, J. Appl. Mech., 1957, 1957(24),p 361–364.
706 J Therm Spray Tech (2021) 30:694–707
123

19. M. Schutze, D.R. Holmes and R.B. Waterhouse, Protective OxideScales and Their Breakdown, Wiley, Chichester, 1997.
20. G.E. Dieter, Mechanical Metallurgy, 2nd ed. McGraw-Hill, New
York, 1976.
21. R.A. Sack, Extension of Griffith’s Theory of Rupture to Three
Dimensions, Proc. Phys. Soc., 1946, 58(6), p 729.
22. M. Rudolphi and M. Schutze, Investigations for the Validation of
the Defect Based Scale Failure Diagrams—Part I: Nickel Oxide,
Oxid. Met., 2013, 79(3–4), p 167–177.
23. M. Rudolphi and M. Schutze, Investigations for the Validation of
the Defect Based Scale Failure Diagrams—Part II: Extension of
the Concept and Application to Nickel Oxide, Titanium Oxide
and Iron Oxide, Oxid. Met., 2015, 84(1–2), p 45–60.
24. E. Bakan, D.E. Mack, G. Mauer and R. Vaßen, Gadolinium
Zirconate/Ysz Thermal Barrier Coatings: Plasma Spraying,
Microstructure, and Thermal Cycling Behavior, J. Am. Ceram.Soc., 2014, 97(12), p 4045–4051.
25. E. Bakan, D.E. Mack, G. Mauer, R. Mucke and R. Vaßen,
Porosity-Property Relationships of Plasma-Sprayed Gd2Zr2O7/
Ysz Thermal Barrier Coatings, J. Am. Ceram. Soc., 2015, 98(8),p 2647–2654.
Publisher’s Note Springer Nature remains neutral with regard to
jurisdictional claims in published maps and institutional affiliations.
J Therm Spray Tech (2021) 30:694–707 707
123