Risk Communications Barrier Diagrams and Web-sitespsc.tamu.edu/files/symposia/2009/presentations/1...
18
Risk Communications Barrier Diagrams and Web-sites Mary Kay O’Connor Process Safety Conference College Station TX Oct 27-28, 2009 Robin Pitblado, DNV Houston Ravi Tahilramani, DNV Abu Dhabi
Transcript of Risk Communications Barrier Diagrams and Web-sitespsc.tamu.edu/files/symposia/2009/presentations/1...

Risk Communications Barrier Diagrams and Web-sites
Mary Kay O’Connor Process Safety ConferenceCollege Station TX Oct 27-28, 2009
Robin Pitblado, DNV HoustonRavi Tahilramani, DNV Abu Dhabi

Version Slide 230 November 2009
Process Safety is NOT yet a solved problem
Major accident statistics
US RMP plants no measurable improvement (EPA RMP-Star database – Wharton analysis)
US Chemical Safety Board incident list (presented at CCPS Meeting 2009)
EU Safety case no significant improvement (EU MARS database)
but
North Sea – No recent major disasters (although pre-cursors occur), HSE HCRD leak statistics lower
0.00
5.00
10.00
15.00
20.00
25.00
30.00
1964
1966
1968
1970
1972
1974
1976
1978
1980
1982
1984
1986
1988
1990
1992
1994
1996
1998
2000
Dam
age
$/10
00 b
bl re
finer
y pr
oduc
tion
at 2
000
pric
es
Raw data
5-year average
Linear (5-yearaverage)
Occupational Safety Trend Insurance Claim Trend

Version Slide 330 November 2009
Authoritative Advice
Baker panel recommendations well known- Reinvigorate PSM and Safety Culture programs
John Murphy (ex-Dow, CSB, now CCPS)- Sharing knowledge is vital- Persuade management of value (the business case for Process Safety)- PS needs to be deployed globally- Complacency is a key challenge
DNV view- Adopting this + similar advice requires some new activities- Just “trying harder” is unlikely to succeed- (same as with human error – “be more careful” does not work)

Version Slide 430 November 2009
Barrier Approach does Work for Major Hazards
The North Sea suffered two major disasters in 1980’s- Alexander Kjelland in 1982 (123f)
- structural failure, most safety systems failed- Piper Alpha in 1988 (167f)
- Both prevention and mitigation barriers failed after survivable initiating event
Both UK and Norway adopted solutions with some common elements- Both use full risk assessment and barrier analysis
- UK sector – Safety Case + Safety Critical Elements / Performance Standards / Written Schemes- Norway – Z-013 standard + TTS (Technical Safety Condition)
Version Slide 530 November 2009
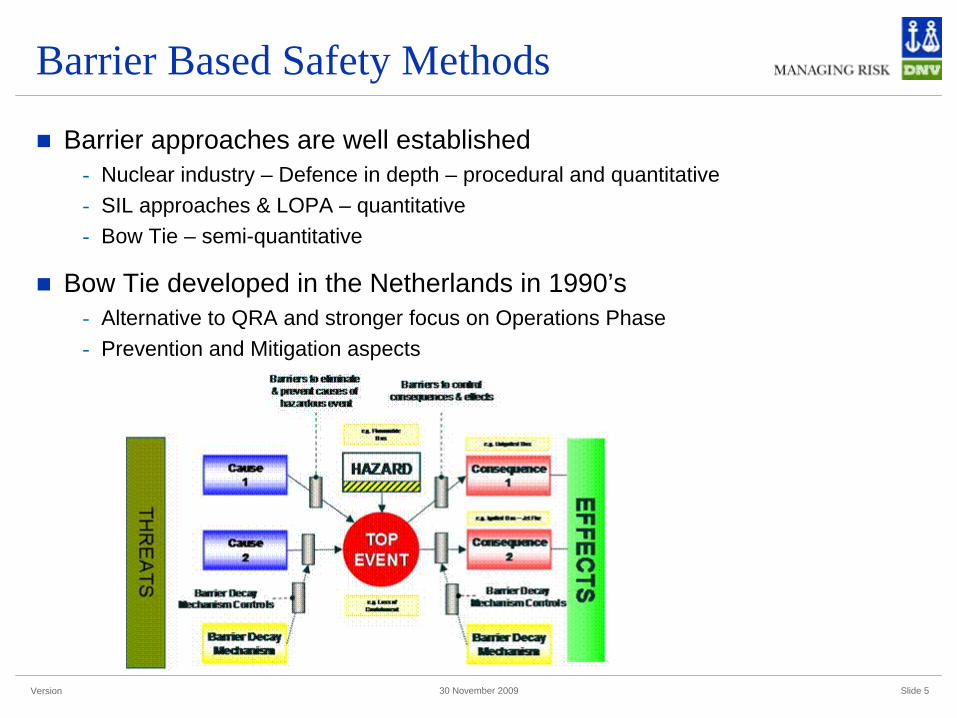
Barrier Based Safety Methods
Barrier approaches are well established- Nuclear industry – Defence in depth – procedural and quantitative- SIL approaches & LOPA – quantitative- Bow Tie – semi-quantitative
Bow Tie developed in the Netherlands in 1990’s- Alternative to QRA and stronger focus on Operations Phase- Prevention and Mitigation aspects

Version Slide 630 November 2009
What are Barriers
Snorre Sklet (BORA method – Norway) suggests:- “Safety barriers are physical and/or non-physical means planned to prevent,
control, or mitigate undesired events or accidents”.
A barrier in a Bow Tie :
A barrier is a slice of swiss cheese in the Reason model and its effectiveness is the size of the holes
A barrier is an AND gate with two inputs a demand and control fails. This can be built out further – termed an Escalation factor or Barrier Decay Mechanism

Version Slide 730 November 2009
Real Bow ties can be large
Prevention example- 10 threats- 40 controls
But many duplicates- Not as many controls
as might be evident
Real facility- 100 – 200 key controls- Mixture prevention and
mitigation- All have owners and
are linked to site management system

Version Slide 830 November 2009
Comparison Bow Ties to traditional risk tools
Positives- Bow ties are graphical not numerical
- Can be displayed on training room or control room walls- No hard-to-understand numbers (e.g. 5.3 x 10⁻⁷) or log-log FN graphs- Much easier to understand than 500pg QRA or LOPA reports
- Bow ties link to known threats- Corrosion, mechanical impacts, operational upset, human error- Not “generic” leaks
- Bow ties diagrams can convey extra information relevant to individuals- Barriers can be color coded by Dept or job (Operations, Maintenance, Inspection)- Barriers can show relative effectiveness (+ or -, or size of barrier = strength)
- Provides qualitative indication of sufficiency of controls- Barriers can be scored and counted on each side (Threat and Outcome)- Bow ties integrate straight into a site’s PHA program- They re-invigorate tired programs and lead to new thinking on controls sufficiency
Negatives- Does not provide quantitative results – required separation distances, SIL level, etc

Version Slide 930 November 2009
How to Communicate Risk using Bow Ties
Large format drawings are a powerful tool for training and awareness- Good for combining routine controls (used daily) with barriers that mainly serve a role in
less frequent process safety events
But - Eventually large drawings must be filed and no longer easy to inspect- Bow ties are dynamic – controls effectiveness steadily change with time
- Remedial action programs enhance or add to existing controls- Incidents / near misses show controls that are failed or degraded- Audits / MI programs also affect controls status
- Thus large format drawings become inaccurate over 1-2 years
Solution- Use IT to maintain and share Bow Tie information- Microsoft SharePoint is a key tool for corporate knowledge sharing- The new versions have enhanced its efficiency

Version Slide 1030 November 2009
SharePoint – What is it?
SharePoint was introduced in 2001- Various names changes and some early confusion
Initial focus was document library with search - SharePoint 2003 – Explorer style interface
- User-unfriendly, but good for document sharing
Newer versions 2007 (and soon 2010)- Web Portal interface
- More graphics, point and click, external feeds, RSS, wiki’s, blogs, community of practice support
- Enhanced Search – with triggers for notifications- Full integration with MS Office
- Databases in Excel, Access and SQL- Documents in Word, pdf, ppt- Outlook integration – reminders / meetings etc- Document protection and access controls
- Much more powerful- Many “out-of-the-box” features that previously needed IT
support- Can integrate with SAP etc – with IT support
- Push and Pull functionality for users- Personal Dashboards, KPI’s, customized views

Version Slide 1130 November 2009
Application of SharePoint to Bow Ties
Microsoft SharePoint allows for multiple benefits on communicating bow ties
- Anyone can access the bow ties over organization’s secured intranet/internet network- From Management staff at Corporate to Operators at site level to Contractors- Not only the person who has the 500pg report and A1 size drawings
- The bow tie Access database is incorporated (SharePoint seamlessly supports)
- Users can access, print or save- The overall bow tie drawings – plus any updates- Controls owned by them – and their status- Controls owned by others – and their status- Shortfalls & Remedial action plans to improve controls
- Built-in project management tools can show progress on controls improvements - Plug-ins allow sharing & collaboration of MS Project files (normally hard to share)
- Other Process Safety, risk and general safety information can be included

Version Slide 1230 November 2009
SharePoint – “Pull” Version
Web interface offers access to all barrier information
But the user must look for it using tools provided
Version Slide 1330 November 2009
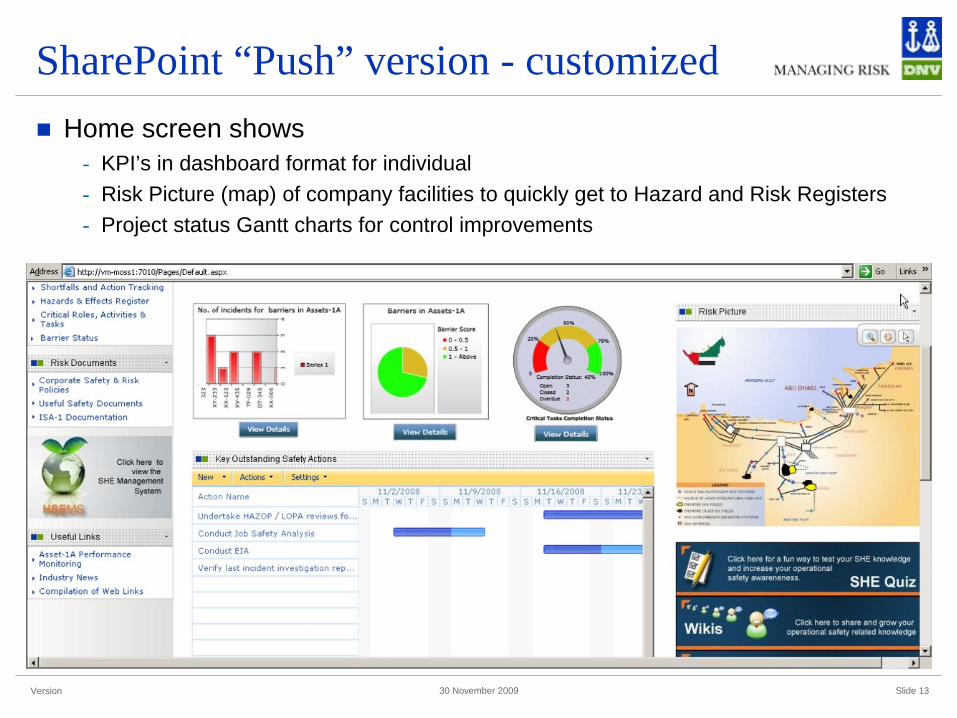
SharePoint “Push” version - customized
Home screen shows- KPI’s in dashboard format for individual- Risk Picture (map) of company facilities to quickly get to Hazard and Risk Registers- Project status Gantt charts for control improvements

Version Slide 1430 November 2009
Barrier Access Database
In the “Pull version” – users can select the parts of the plants and the types or risk relevant to them

Version Slide 1530 November 2009
Barriers Status
Hazards & Effects Register generated within seconds from real-time data

Version Slide 1630 November 2009
PROCESSManagement Systems, Audits
My Risks Page
People - Process - Plant - Performance - Perspective
5 P’s for Communicating Process Safety
Design, Risk Assessment
PLANT
Trai
ning
, cul
ture
, ope
ratio
nal d
isci
plin
e
PEOP
LE
Any Employee or Contractor
People
Plant
Process
Perspective
Performance

Version Slide 1730 November 2009
Sample SharePoint Video