MEASURING THE ''WORLD'' REAL INTEREST RATE … · Measuring the “World” Real Interest Rate....
25
NBER WORKING PAPER SERIES MEASURING THE ''WORLD'' REAL INTEREST RATE Mervyn King David Low Working Paper 19887 http://www.nber.org/papers/w19887 NATIONAL BUREAU OF ECONOMIC RESEARCH 1050 Massachusetts Avenue Cambridge, MA 02138 February 2014 The authors thank Iain de Weymarn, Andrew Hauser, and David Backus for many insightful comments that greatly enhanced this paper. We also gratefully acknowledge research support from the Stern School of Business at New York University. The views expressed herein are those of the authors and do not necessarily reflect the views of the National Bureau of Economic Research. NBER working papers are circulated for discussion and comment purposes. They have not been peer- reviewed or been subject to the review by the NBER Board of Directors that accompanies official NBER publications. © 2014 by Mervyn King and David Low. All rights reserved. Short sections of text, not to exceed two paragraphs, may be quoted without explicit permission provided that full credit, including © notice, is given to the source.
Transcript of MEASURING THE ''WORLD'' REAL INTEREST RATE … · Measuring the “World” Real Interest Rate....

NBER WORKING PAPER SERIES
MEASURING THE ''WORLD'' REAL INTEREST RATE
Mervyn KingDavid Low
Working Paper 19887http://www.nber.org/papers/w19887
NATIONAL BUREAU OF ECONOMIC RESEARCH1050 Massachusetts Avenue
Cambridge, MA 02138February 2014
The authors thank Iain de Weymarn, Andrew Hauser, and David Backus for many insightful commentsthat greatly enhanced this paper. We also gratefully acknowledge research support from the SternSchool of Business at New York University. The views expressed herein are those of the authors anddo not necessarily reflect the views of the National Bureau of Economic Research.
NBER working papers are circulated for discussion and comment purposes. They have not been peer-reviewed or been subject to the review by the NBER Board of Directors that accompanies officialNBER publications.
© 2014 by Mervyn King and David Low. All rights reserved. Short sections of text, not to exceedtwo paragraphs, may be quoted without explicit permission provided that full credit, including © notice,is given to the source.

Measuring the ''World'' Real Interest RateMervyn King and David LowNBER Working Paper No. 19887February 2014JEL No. E4,E43,G12
ABSTRACT
Over the past couple of decades, and especially since the financial crisis in 2008-09, real interest rateshave collapsed. For much of the past two years they have been negative, but they have been trendingdown for some while. But how far have real rates fallen? This note computes a measure of the “world”real interest rate and, where possible, a measure of the implied future real rate. It also makes publicour estimates of the “world” real interest rate so they can be used by other researchers.
Mervyn KingHouse of LordsLondonSW1A 0PWUnited Kingdomand [email protected]
David LowDepartment of EconomicsNew York University19 W. 4th St.NY NY [email protected]
An online appendix is available at:http://www.nber.org/data-appendix/w19887

Measuring the “World” Real Interest Rate
Mervyn King and David Low, Stern School of Business, NYU
Over the past couple of decades, and especially since the financial crisis in 2008-09, real
interest rates have collapsed. For much of the past two years they have been negative. But
they have been trending down for some while. In part, this is the result of the creation of a
global capital market as countries such as China and members of the former Soviet Union
have participated in a growing transfer of saving from the emerging economies to the
advanced economies.1 It also reflects the impact of demographic changes on household
savings.2 And in part it reflects deliberate policy choices by central banks in advanced
economies. But how far have real rates fallen?
This note tries to compute a measure of the “world” real interest rate and, where possible, a
measure of the implied future real rate. It makes no attempt to explain the fall in real rates,
but it asks how we might try to measure real interest rates in a global capital market. It also
makes public our estimates of the “world” real interest rate so they can be used by other
researchers.
The “real rate” requires careful definition. For most purposes the relevant concept is an ex
ante rate which subtracts from the actual nominal rate the expected rate of inflation. Reliable
quantitative measures of inflation expectations are notoriously hard to come by and refer only
to expectations over time horizons too short to be useful for analysing saving and investment.
So in this note we use measures of real rates on government bonds that are issued with
inflation protection. Such ex ante measures of real rates are much less volatile than ex post
rates when there are significant and unexpected changes in inflation, as in the 1970s and
1980s, or in equilibrium real rates, as seen more recently.
Following the inflation surge in the 1970s, governments in the advanced economies wanted
to back their own determination to reduce inflation by offering bonds that offered complete
insurance against inflation in order to avoid paying a risk premium for investors’ uncertainty
about the course of inflation. Such inflation-indexed bonds had been used in inflation-prone
countries such as Brazil and Israel, but have now become common among the major
1 The “savings glut” hypothesis put forward by Bernanke (2005).
2 Backus et.al. (2013).
2
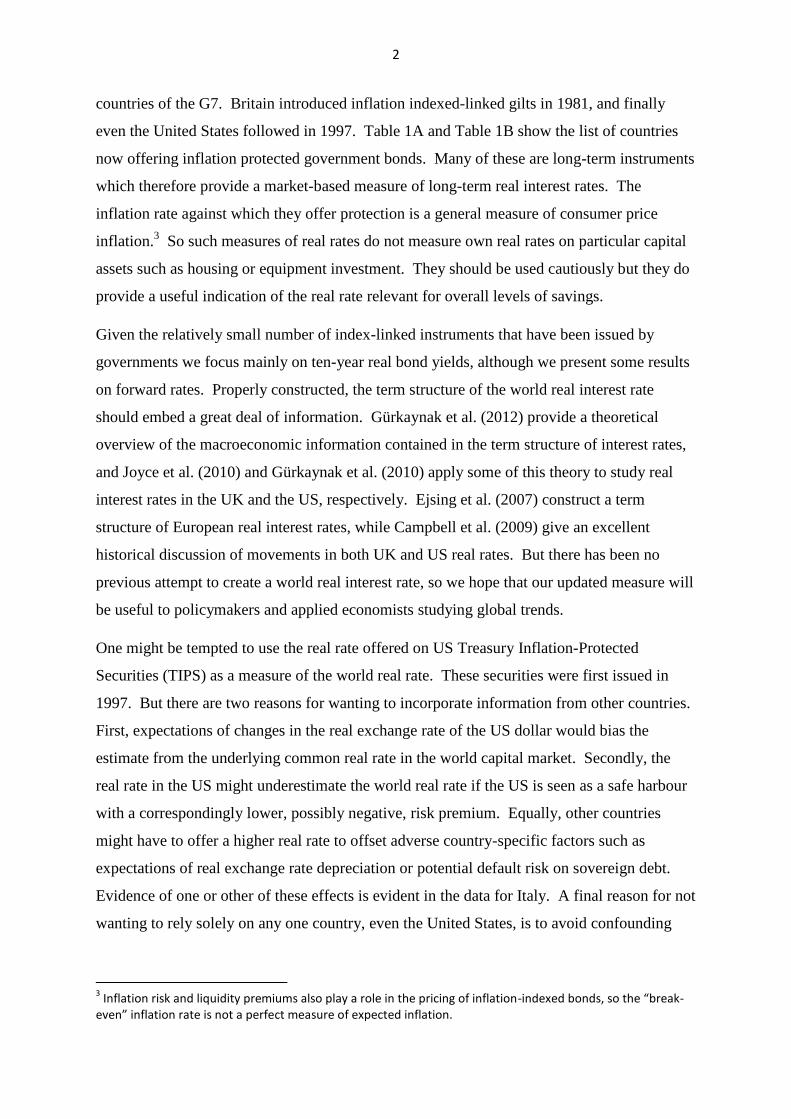
countries of the G7. Britain introduced inflation indexed-linked gilts in 1981, and finally
even the United States followed in 1997. Table 1A and Table 1B show the list of countries
now offering inflation protected government bonds. Many of these are long-term instruments
which therefore provide a market-based measure of long-term real interest rates. The
inflation rate against which they offer protection is a general measure of consumer price
inflation.3 So such measures of real rates do not measure own real rates on particular capital
assets such as housing or equipment investment. They should be used cautiously but they do
provide a useful indication of the real rate relevant for overall levels of savings.
Given the relatively small number of index-linked instruments that have been issued by
governments we focus mainly on ten-year real bond yields, although we present some results
on forward rates. Properly constructed, the term structure of the world real interest rate
should embed a great deal of information. Gürkaynak et al. (2012) provide a theoretical
overview of the macroeconomic information contained in the term structure of interest rates,
and Joyce et al. (2010) and Gürkaynak et al. (2010) apply some of this theory to study real
interest rates in the UK and the US, respectively. Ejsing et al. (2007) construct a term
structure of European real interest rates, while Campbell et al. (2009) give an excellent
historical discussion of movements in both UK and US real rates. But there has been no
previous attempt to create a world real interest rate, so we hope that our updated measure will
be useful to policymakers and applied economists studying global trends.
One might be tempted to use the real rate offered on US Treasury Inflation-Protected
Securities (TIPS) as a measure of the world real rate. These securities were first issued in
1997. But there are two reasons for wanting to incorporate information from other countries.
First, expectations of changes in the real exchange rate of the US dollar would bias the
estimate from the underlying common real rate in the world capital market. Secondly, the
real rate in the US might underestimate the world real rate if the US is seen as a safe harbour
with a correspondingly lower, possibly negative, risk premium. Equally, other countries
might have to offer a higher real rate to offset adverse country-specific factors such as
expectations of real exchange rate depreciation or potential default risk on sovereign debt.
Evidence of one or other of these effects is evident in the data for Italy. A final reason for not
wanting to rely solely on any one country, even the United States, is to avoid confounding
3 Inflation risk and liquidity premiums also play a role in the pricing of inflation-indexed bonds, so the “break-
even” inflation rate is not a perfect measure of expected inflation.

3
idiosyncratic with underlying economic factors. For example, there was a large liquidity
premium in the early months after the issue of US TIPS.
We start with the arbitrage relationship implying that the nominal (in terms of dollars) rate of
return on bonds in country j, ij, equals that on dollar bonds, i$, adjusted for two factors. The
first is that the nominal exchange rate of country j in terms of US dollars, ej$, may be
expected to fall, and so a higher return on assets denominated in country j’s currency will be
required to satisfy investors. Second, because dollar assets may have a safe haven value, and
so be a better hedge against the future consumption of global investors, assets in country j
will have to offer an additional premium, πj, to compensate investors for the risk.
In some cases that risk premium may reflect a concern about default by the government of
country j. That would be a justifiable concern for countries that borrow in currencies other
than their own, as was true for some Latin American countries before their 1980s debt crisis
and is now for some members of the European Monetary Union. But where governments are
able to borrow in their own currency the main risk for overseas investors is a depreciation of
the currency – reflected in the second term on the right hand side of the above equation.
Large and persistent movements in expected exchange rates often are compensation for
differences in inflation across countries. So differences in nominal interest rates might be
expected to be larger than differences in real rates, and for much of the post-war period that
was evident.
For a given maturity, the arbitrage relationship of the first equation can be expressed as an
equivalent relationship for real interest rates, denoted by r, and real exchange rates, denoted
by E.
To obtain an estimate of “the” world real rate, an average of real rates across countries would
eliminate the effect of expected changes in real exchange rates since across countries that
effect must average zero. Moreover, since the arbitrage relationship is expressed in terms of
rates of return, a simple unweighted average would be the right method to choose. That,
however, leaves to one side the risk premium. In dollar terms, that premium is zero. In
trying to measure world real interest rates it might be more sensible to recognise that the risk
premium on dollar assets is, at times, artificially depressed because of a dollar safe haven

4
effect. In other words, the dollar risk premium is negative. That implies incorporating into a
measure of world real rates some average of risk premia over all countries which would mean
averaging real rates across countries. But in this case the danger of using an unweighted
average is that small countries with high risk premia could have a disproportionate impact on
the estimate of the world real rate. Possible weights would be the shares of countries’ issues
of indexed-linked bonds in the total stock of such assets, shares in total consumption, or
shares in total GDP. For the sake of simplicity, and without great damage to the results, we
have chosen to use GDP weights.
We present below estimates of the average ten-year real rate for the G7 countries excluding
Italy. The reason for the exclusion is that recent movements in the real rate in Italy have been
dominated by changes in the implicit risk premium associated with the possibility of default
or exit from the European Monetary Union. In the spring of 2011, ten-year real rates in Italy
were around 2 ½%. By the end of the year they had more than doubled to almost 6%. They
remained high through much of 2012 before falling back significantly in 2013. But they
remained well above the levels of either the US or UK. Changes in the risk premium
associated with Italian membership of monetary union would contaminate an estimate of the
world real rate.
Averaging across countries should also remove most of the effect of expected changes in real
exchange rates. In the results below we present both weighted and unweighted estimates of
ten-year real rates and implied forward ten-year real rates (that is the real rate expected to
prevail between year 10 and year 20).
Another reason for differences among countries relates to the inflation index used to define
the degree of inflation protection. In the US the measure is the CPI inflation rate; in the UK
it is the retail price index (RPI) which overstates the CPI inflation measure by as much as
around 1 percentage point on average over the period as a whole, thereby depressing the
apparent real yield on indexed bonds. Miller (2011) shows that the ex post wedge between
RPI and CPI inflation in the UK was rather volatile. But the relevant concept for our
purposes is the ex ante expected wedge. From 2004 the Treasury Panel of Economists
published the average private forecaster’s expectation of the RPI-CPI wedge over the
following five years. Since expected changes in relative prices should have largely passed
through by around five years these are reasonable estimates of the ex ante wedge over the
following decade. Broadly speaking, the wedge was around 0.5 percentage points until 2008
5
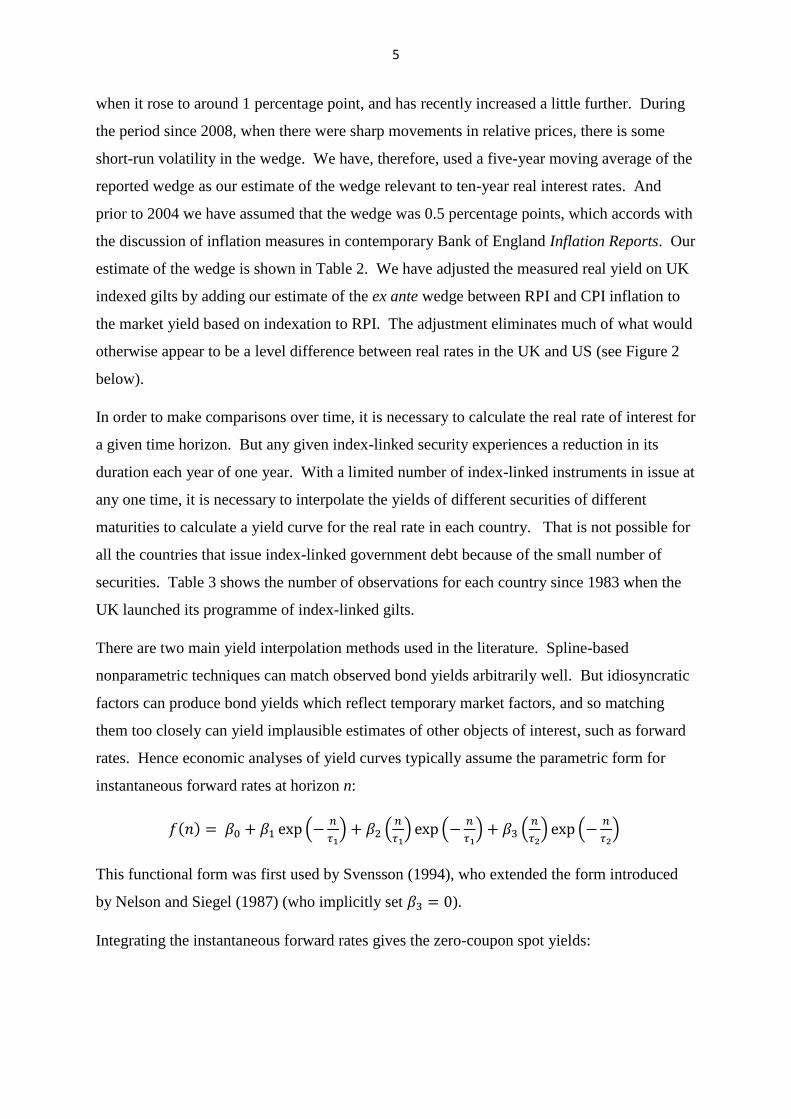
when it rose to around 1 percentage point, and has recently increased a little further. During
the period since 2008, when there were sharp movements in relative prices, there is some
short-run volatility in the wedge. We have, therefore, used a five-year moving average of the
reported wedge as our estimate of the wedge relevant to ten-year real interest rates. And
prior to 2004 we have assumed that the wedge was 0.5 percentage points, which accords with
the discussion of inflation measures in contemporary Bank of England Inflation Reports. Our
estimate of the wedge is shown in Table 2. We have adjusted the measured real yield on UK
indexed gilts by adding our estimate of the ex ante wedge between RPI and CPI inflation to
the market yield based on indexation to RPI. The adjustment eliminates much of what would
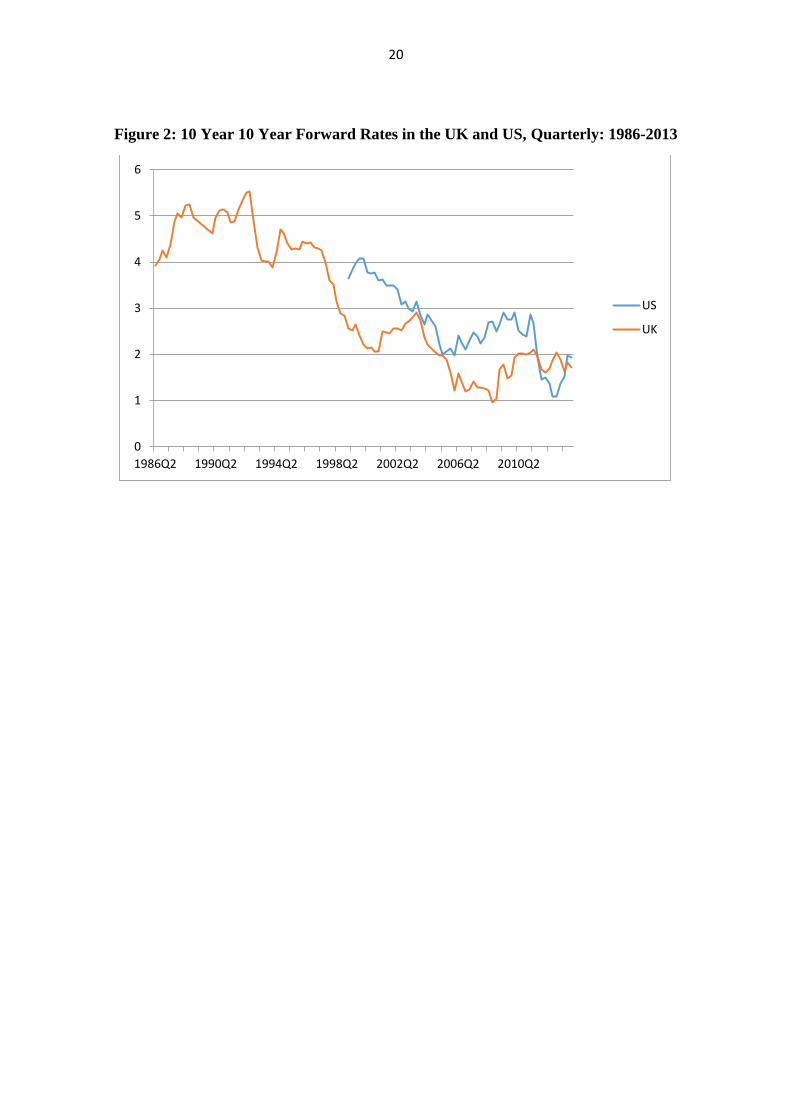
otherwise appear to be a level difference between real rates in the UK and US (see Figure 2
below).
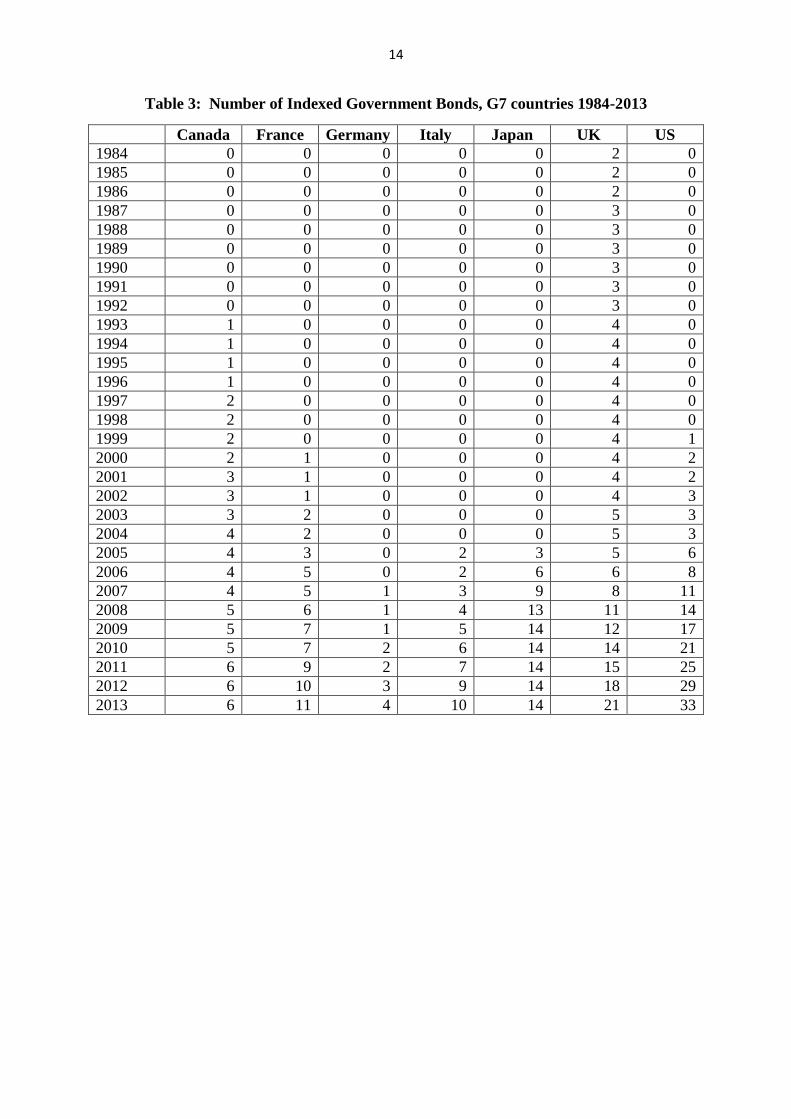
In order to make comparisons over time, it is necessary to calculate the real rate of interest for
a given time horizon. But any given index-linked security experiences a reduction in its
duration each year of one year. With a limited number of index-linked instruments in issue at
any one time, it is necessary to interpolate the yields of different securities of different
maturities to calculate a yield curve for the real rate in each country. That is not possible for
all the countries that issue index-linked government debt because of the small number of
securities. Table 3 shows the number of observations for each country since 1983 when the
UK launched its programme of index-linked gilts.
There are two main yield interpolation methods used in the literature. Spline-based
nonparametric techniques can match observed bond yields arbitrarily well. But idiosyncratic
factors can produce bond yields which reflect temporary market factors, and so matching
them too closely can yield implausible estimates of other objects of interest, such as forward
rates. Hence economic analyses of yield curves typically assume the parametric form for
instantaneous forward rates at horizon n:
This functional form was first used by Svensson (1994), who extended the form introduced
by Nelson and Siegel (1987) (who implicitly set ).
Integrating the instantaneous forward rates gives the zero-coupon spot yields:
6
Given a set of observed yields, minimizing the squared deviations between the predicted and
the observed yields will generate estimates of the parameters. This is the methodology used
by the Federal Reserve and many other central banks to estimate bond yield curves.
Weighting bonds by the inverse of duration, as Gürkaynak et al. (2010) suggest, tends to
improve estimator performance. Moreover, because bonds are typically indexed with a lag,
and are not seasonally adjusted, bonds of extremely short duration – around two years or less
– should not be used in the estimation.
Note that strong identification of all six parameters requires, at a minimum, observing yields
at several different maturities – including some long-term bonds, preferably of maturities of
at least 10 years. If sample size is an issue, the more parsimonious specification of Nelson
and Siegel (1987) may be preferable.
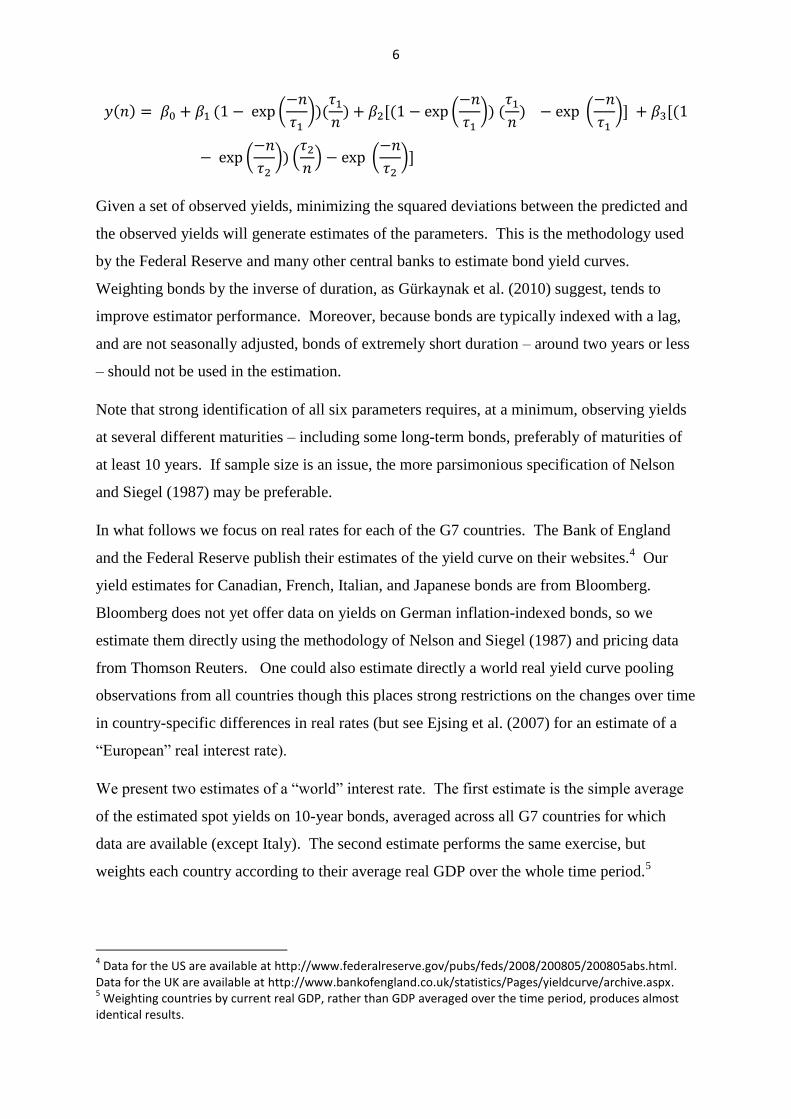
In what follows we focus on real rates for each of the G7 countries. The Bank of England
and the Federal Reserve publish their estimates of the yield curve on their websites.4 Our
yield estimates for Canadian, French, Italian, and Japanese bonds are from Bloomberg.
Bloomberg does not yet offer data on yields on German inflation-indexed bonds, so we
estimate them directly using the methodology of Nelson and Siegel (1987) and pricing data
from Thomson Reuters. One could also estimate directly a world real yield curve pooling
observations from all countries though this places strong restrictions on the changes over time
in country-specific differences in real rates (but see Ejsing et al. (2007) for an estimate of a
“European” real interest rate).
We present two estimates of a “world” interest rate. The first estimate is the simple average
of the estimated spot yields on 10-year bonds, averaged across all G7 countries for which
data are available (except Italy). The second estimate performs the same exercise, but
weights each country according to their average real GDP over the whole time period.5
4 Data for the US are available at http://www.federalreserve.gov/pubs/feds/2008/200805/200805abs.html.
Data for the UK are available at http://www.bankofengland.co.uk/statistics/Pages/yieldcurve/archive.aspx. 5 Weighting countries by current real GDP, rather than GDP averaged over the time period, produces almost
identical results.
7
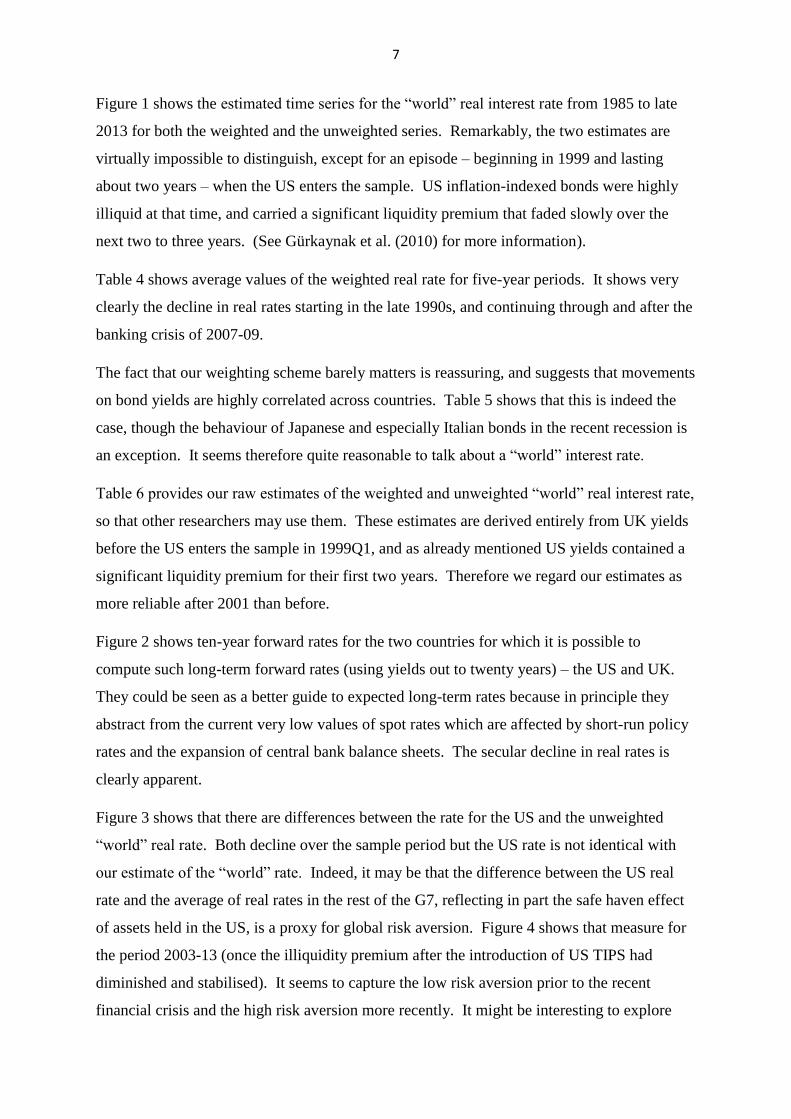
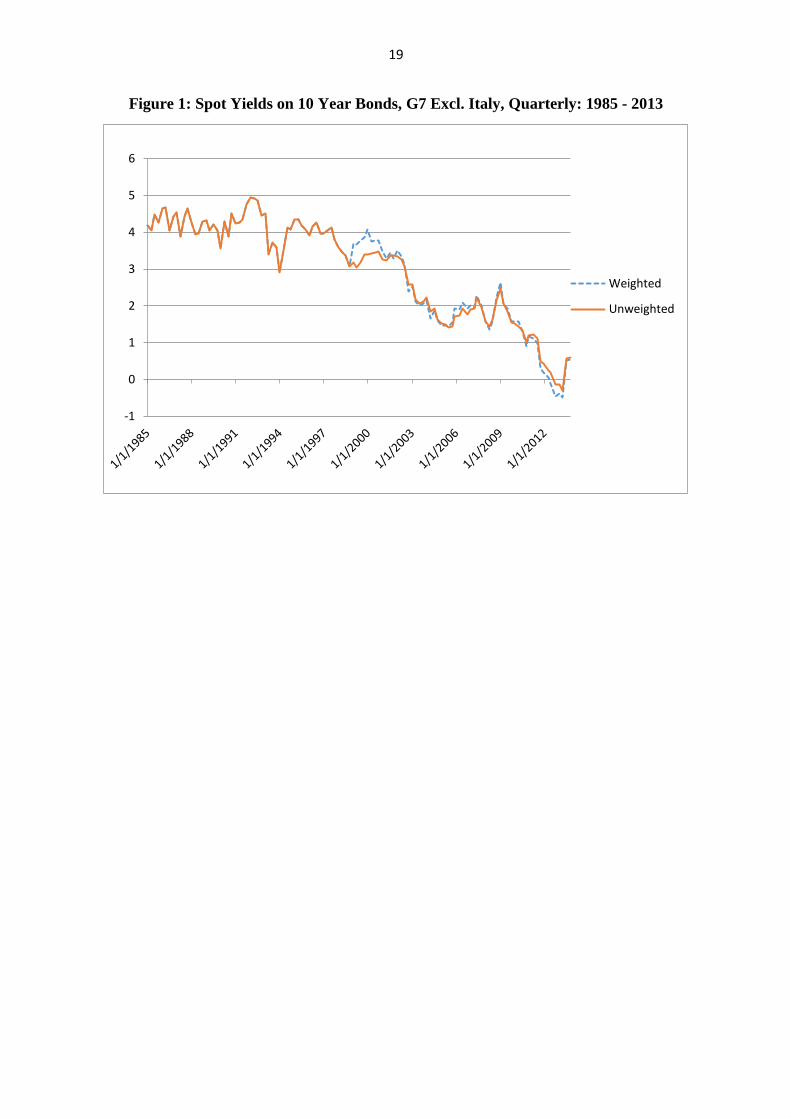
Figure 1 shows the estimated time series for the “world” real interest rate from 1985 to late
2013 for both the weighted and the unweighted series. Remarkably, the two estimates are
virtually impossible to distinguish, except for an episode – beginning in 1999 and lasting
about two years – when the US enters the sample. US inflation-indexed bonds were highly
illiquid at that time, and carried a significant liquidity premium that faded slowly over the
next two to three years. (See Gürkaynak et al. (2010) for more information).
Table 4 shows average values of the weighted real rate for five-year periods. It shows very
clearly the decline in real rates starting in the late 1990s, and continuing through and after the
banking crisis of 2007-09.
The fact that our weighting scheme barely matters is reassuring, and suggests that movements
on bond yields are highly correlated across countries. Table 5 shows that this is indeed the
case, though the behaviour of Japanese and especially Italian bonds in the recent recession is
an exception. It seems therefore quite reasonable to talk about a “world” interest rate.
Table 6 provides our raw estimates of the weighted and unweighted “world” real interest rate,
so that other researchers may use them. These estimates are derived entirely from UK yields
before the US enters the sample in 1999Q1, and as already mentioned US yields contained a
significant liquidity premium for their first two years. Therefore we regard our estimates as
more reliable after 2001 than before.
Figure 2 shows ten-year forward rates for the two countries for which it is possible to
compute such long-term forward rates (using yields out to twenty years) – the US and UK.
They could be seen as a better guide to expected long-term rates because in principle they
abstract from the current very low values of spot rates which are affected by short-run policy
rates and the expansion of central bank balance sheets. The secular decline in real rates is
clearly apparent.
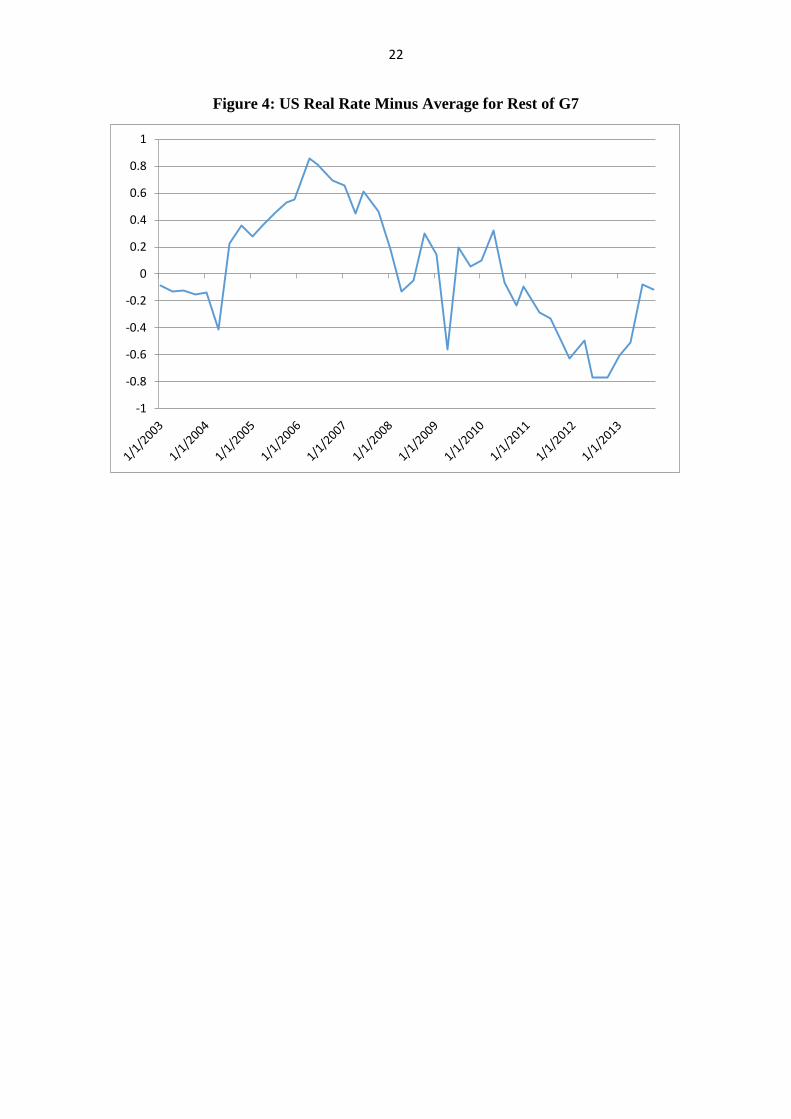
Figure 3 shows that there are differences between the rate for the US and the unweighted
“world” real rate. Both decline over the sample period but the US rate is not identical with
our estimate of the “world” rate. Indeed, it may be that the difference between the US real
rate and the average of real rates in the rest of the G7, reflecting in part the safe haven effect
of assets held in the US, is a proxy for global risk aversion. Figure 4 shows that measure for
the period 2003-13 (once the illiquidity premium after the introduction of US TIPS had
diminished and stabilised). It seems to capture the low risk aversion prior to the recent
financial crisis and the high risk aversion more recently. It might be interesting to explore
8
whether this measure contains information useful as a measure of global risk aversion and so
for macro-prudential policy.6 In future it might be possible to incorporate data from countries
beyond the G7 to examine alternative measures of global risk aversion. The gap between real
rates in the US and the rest of the G7 is a rather conservative indicator of risk.
Figure 5A shows a more high-frequency plot of daily real rates in the UK and US during
2013. The two series move closely together. The sharp rise in the middle of 2013 reflects the
market speculation about the timing of withdrawal of monetary stimulus that accompanied
the signs of recovery in the real economy in both countries and the attempts by the Federal
Reserve and the Bank of England to manage expectations about the pace of that withdrawal.
Figure 5B shows a similar figure for 10 year 10 year forward rates. Those forward rates still
show a marked rise in the US, although much less so in the UK. The sharp fall in the real
rate in the UK at the beginning of 2013 reflects the unexpected announcement by the Office
for National Statistics that reforms to the measurement of RPI inflation (to bring it closer to
CPI) that would have reduced the wedge between RPI and CPI inflation would not be
implemented. Yields fell 33 basis points on the announcement, the third largest daily change
ever. Equally, rates in late 2012 were boosted by expectations of the change.7 Such large
and idiosyncratic movements in a market as established as the UK provide yet another
warning against relying too heavily on yields from any one country as a proxy for a world
interest rate.
Interestingly, there was little reaction of real rates to the US debt deal on 17 October 2013.
The larger influence was changing expectations about monetary policy the timing of
withdrawal of monetary stimulus.
Overall, the broad shape of the decline in real rates since the late 1990s is clear from both the
series for US TIPS alone and our estimate of the “world” real rate. But the differences may
reveal useful information about expected changes in real exchange rates and a measure of
global risk aversion.
6 This idea was suggested to us by Iain de Weymarn at the Bank of England.
7 These idiosyncratic movements in British yields at the end of the sample are responsible for the fact that,
while US yields are highly correlated with both British and German yields, the correlation between British and German yields is fairly low (.49). See Table 5.

9
References
Barclay’s, 2012. “Global Inflation-Linked Products: A User’s Guide.”
Backus, David, Thomas Cooley, and Espen Henriksen, 2013. "Demography and Low-
Frequency Capital Flows.” Draft for the International Seminar on Macroeconomics, Rome,
June 2013.
Barro, Robert J. and Xavier Sala-i-Martin, 1990. “World Real Interest Rates,” NBER
Macroeconomics Annual Vol. 5, p. 15-74.
Bernanke, Ben, March 10, 2005. “The Global Saving Glut and the U.S. Current Account
Deficit”, Sandridge Lecture, Virginia Association of Economists, Richmond VA.
Blanchard, Olivier J., Lawrence H. Summers, Alan S. Blinder, and William D. Nordhaus,
1984. “Perspectives on High World Real Interest Rates”, Brookings Papers on Economic
Activity, 1984(2), p. 273-334.
Campbell, John Y., Robert J. Shiller and Luis M. Viceira, 2009. “Understanding Inflation-
Indexed Bond Markets”, Brookings Papers on Economic Activity, 40(1), p. 79-138.
Dooley, Michael, David Folkerts-Landau and Peter Garber, 2009. “Bretton Woods II Still
Defines the International Monetary System”, Pacific Economic Review, 14(3), p. 297-311.
Ejsing, Jacob, Juan Angel García, and Thomas Werner, 2007. “The Term Structure of Euro
Area Break-Even Inflation Rates: The Impact of Seasonality” . ECB Working Paper Series
No. 830.
Gürkaynak, Refet, Brian Sack, and Jonathan H. Wright, 2010. “The TIPS Yield Curve and
Inflation Compensation,” American Economic Journal: Macroeconomics, (2:1), p. 70-92.
Gürkaynak, Refet and Jonathan H. Wright, 2012. “Macroeconomics and the Term Structure”,
Journal of Economic Literature, (50:2), p. 331–367.
Howe, Howard and Charles Pigott, 1991. “Determinants of Long-Term Interest Rates: An
Empirical Study of Several Industrial Countries,” Federal Reserve Bank of New York
Quarterly Review, Winter.
Joyce, Michael A.S., Peter Lildholdt, and Steffen Sorensen, 2010. “Extracting Inflation
Expectations and Inflation Risk Premia from the Term Structure: A Joint Model of the UK
Nominal and Real Yield Curves”, Journal of Banking and Finance 34, p. 281-294.
Nelson, Charles R., and Andrew F. Siegel. 1987. “Parsimonious Modeling of Yield Curves.”
Journalof Business, 60(4): 473–89
Miller, Ruth, 2011. “The Long-Run Difference Between RPI and CPI Inflation”, Office for
Budget Responsibility, Working Paper No. 2.
Orr, Adrian, Malcolm Edey, and Michael Kennedy. 1995. “The Determinants of Real Long-
Term Interest Rates: 17 Country Pooled Time-Series Evidence,” OECD Economics
Department Working Papers, No. 155.
Price, Robert, 1997. “The Rationale and Design of Inflation-Indexed Bonds,” IMF Working
Paper.

10
Shiller, Robert J, 2005. “The Invention of Inflation-Indexed Bonds in Early America”,
published in Goetzmann, William N. and Geert K. Rouwenhorst (eds.) The Origins of Value:
The Financial Innovations that Created Modern Capital Markets. Oxford: Oxford University
Press.
Svensson, Lars E. O. 1994. “Estimating and Interpreting Forward Interest Rates: Sweden
1992–1994.” National Bureau of Economic Research Working Paper 4871.

11
Table 1A: G7 Countries with Index-Linked Government Bonds in 2013
Country Year First
issued
Inflation
Measure
Maximum
Maturity
(Years)
Bonds
Outstanding on
10/29/13
United States 1997 CPI 30 37
Canada 1992 CPI 34 6
France 1998 CPI/HICP 33 12
Germany 2006 HICP 11 4
Italy 2004 CPI 32 11
Japan 2004 CPI 10 15
United Kingdom 1981 RPI 55 23
HICP refers to the European Harmonized Index of Consumer Prices, excluding tobacco.

12
Table 1B: Non-G7 Countries with Index-Linked Government Bonds in 2012
Country Year First
issued
Inflation
Measure
Maximum
Maturity
(Years)
Bonds
Outstanding
in May 2012
Australia 1985* CPI 24 5
Brazil 1964* IPCA 45 15
Chile 1956 UF (CPI) 30 47
Colombia 1967 CPI N/A N/A
Denmark 2012 CPI 11 1
Greece 1997* HICP 50 3
Hong Kong 2011 CPI 3 1
Iceland 1964 CPI 21 3
Israel 2001 CPI 31 6
Mexico 1983* CPI 30 11
Poland 2004 CPI 11 2
South Africa 2000 CPI 21 6
South Korea 2007 CPI 10 3
Sweden 1994 CPI 30 7
Thailand 2011 CPI 10 1
Turkey 2007 CPI 10 10
Uruguay 2002 CPI 13 N/A
Source: Thomson Reuters and Barclays (2012). Some countries have issued indexed-linked bonds in the past but
no longer have a substantial index-linked bond market, including Argentina, Finland, and Hungary. Globally,
the market is growing quickly; for example, New Zealand first issued linkers in 2012, while India followed in
2013. * indicates that there has been a significant pause between bond issuances; N/A denotes information that
was not available to the authors at the time of writing.

13
Table 2: Estimated Wedge in Expected RPI and CPI Inflation in the UK, 1985-2013
Year Percentage Points
1985-2000 0.50
2001 0.50
2002 0.51
2003 0.52
2004 0.51
2005 0.52
2006 0.54
2007 0.56
2008 0.64
2009 0.76
2010 0.90
2011 1.03
2012 1.18
2013 1.26
14
Table 3: Number of Indexed Government Bonds, G7 countries 1984-2013
Canada France Germany Italy Japan UK US
1984 0 0 0 0 0 2 0
1985 0 0 0 0 0 2 0
1986 0 0 0 0 0 2 0
1987 0 0 0 0 0 3 0
1988 0 0 0 0 0 3 0
1989 0 0 0 0 0 3 0
1990 0 0 0 0 0 3 0
1991 0 0 0 0 0 3 0
1992 0 0 0 0 0 3 0
1993 1 0 0 0 0 4 0
1994 1 0 0 0 0 4 0
1995 1 0 0 0 0 4 0
1996 1 0 0 0 0 4 0
1997 2 0 0 0 0 4 0
1998 2 0 0 0 0 4 0
1999 2 0 0 0 0 4 1
2000 2 1 0 0 0 4 2
2001 3 1 0 0 0 4 2
2002 3 1 0 0 0 4 3
2003 3 2 0 0 0 5 3
2004 4 2 0 0 0 5 3
2005 4 3 0 2 3 5 6
2006 4 5 0 2 6 6 8
2007 4 5 1 3 9 8 11
2008 5 6 1 4 13 11 14
2009 5 7 1 5 14 12 17
2010 5 7 2 6 14 14 21
2011 6 9 2 7 14 15 25
2012 6 10 3 9 14 18 29
2013 6 11 4 10 14 21 33

15
Table 4: 5 Year Average of Yields on 10 Year Bonds
1985-1989 4.27
1990-1994 4.15
1995-1999 3.88
2000-2004 2.86
2005-2009 1.85
2010-2013 0.48
Table 5: Correlation Matrix of Spot Yields on 10 Year Bonds, Full Sample
Canada France Germany Italy Japan UK US
Canada 1.00
France .84 1.00
Germany .86 .69 1.00
Italy -.61 -.25 -.05 1.00
Japan .61 .59 N/A .71 1.00
UK .95 .84 .49 -.63 -.22 1.00
US .99 .91 .94 -.64 .19 .89 1.00 Note that, because yields are available at different times for different countries, correlations are not directly
comparable between countries.

16
Table 6: Estimates of the Weighted and Unweighted World Real Interest Rate
Quarter Weighted Real Rate Unweighted Real Rate
2013Q4 0.539 0.605
2013Q3 0.524 0.571
2013Q2 -0.483 -0.286
2013Q1 -0.391 -0.139
2012Q4 -0.457 -0.140
2012Q3 -0.101 0.203
2012Q2 0.054 0.254
2011Q1 0.193 0.437
2011Q4 0.297 0.499
2011Q3 0.976 1.104
2011Q2 1.124 1.233
2010Q1 1.166 1.193
2010Q4 0.911 1.014
2010Q3 1.295 1.322
2010Q2 1.588 1.439
2010Q1 1.570 1.519
2009Q4 1.574 1.554
2009Q3 1.933 1.837
2009Q2 2.027 2.056
2009Q1 2.627 2.468
2008Q4 2.216 2.144
2008Q3 1.569 1.639
2008Q2 1.365 1.434
2008Q1 1.569 1.585
2007Q4 2.013 1.965
2007Q3 2.291 2.236
2007Q2 1.965 1.934
2007Q1 2.019 1.897
2006Q4 1.918 1.765
2006Q3 2.093 1.932
2006Q2 1.906 1.730
2005Q1 1.945 1.719
2005Q4 1.542 1.450
2005Q3 1.449 1.413
2005Q2 1.456 1.491
2005Q1 1.479 1.514
2004Q4 1.610 1.631
2004Q3 1.882 1.918
2004Q2 1.662 1.840
2004Q1 2.155 2.215
2003Q4 2.057 2.124
2003Q3 2.021 2.075
2003Q2 2.121 2.178
2003Q1 2.535 2.573
2002Q4 2.402 2.587

17
2002Q3 3.120 3.083
2002Q2 3.341 3.276
2002Q1 3.498 3.350
2001Q4 3.289 3.375
2001Q3 3.447 3.368
2001Q2 3.290 3.234
2001Q1 3.469 3.247
2000Q4 3.774 3.483
2000Q3 3.791 3.437
2000Q2 3.761 3.422
2000Q1 4.062 3.402
1999Q4 3.870 3.411
1999Q3 3.764 3.191
1999Q2 3.661 3.055
1999Q1 3.694 3.189
1998Q4 3.066 3.066
1998Q3 3.360 3.360
1998Q2 3.465 3.465
1998Q1 3.592 3.592
1997Q4 3.795 3.795
1997Q3 4.123 4.123
1997Q2 4.058 4.058
1997Q1 3.979 3.979
1996Q4 3.960 3.960
1996Q3 4.255 4.255
1996Q2 4.147 4.147
1996Q1 3.905 3.905
1995Q4 4.069 4.069
1995Q3 4.172 4.172
1995Q2 4.340 4.340
1995Q1 4.339 4.339
1994Q4 4.063 4.063
1994Q3 4.129 4.129
1994Q2 3.500 3.500
1994Q1 2.908 2.908
1993Q4 3.599 3.599
1993Q3 3.728 3.728
1993Q2 3.410 3.410
1993Q1 4.510 4.510
1992Q4 4.465 4.465
1992Q3 4.876 4.876
1992Q2 4.927 4.927
1992Q1 4.934 4.934
1991Q4 4.745 4.745

18
1991Q3 4.357 4.357
1991Q2 4.274 4.274
1991Q1 4.231 4.231
1990Q4 4.520 4.520
1990Q3 3.884 3.884
1990Q2 4.285 4.285
1990Q1 3.558 3.558
1989Q4 4.049 4.049
1989Q3 4.219 4.219
1989Q2 4.059 4.059
1989Q1 4.315 4.315
1988Q4 4.292 4.292
1988Q3 3.978 3.978
1988Q2 3.943 3.943
1988Q1 4.282 4.282
1987Q4 4.638 4.638
1987Q3 4.440 4.440
1987Q2 3.890 3.890
1987Q1 4.540 4.540
1986Q4 4.430 4.430
1986Q3 4.041 4.041
1986Q2 4.667 4.667
1986Q1 4.651 4.651
1985Q4 4.262 4.262
1985Q3 4.498 4.498
1985Q2 4.056 4.056
1985Q1 4.191 4.191
19
Figure 1: Spot Yields on 10 Year Bonds, G7 Excl. Italy, Quarterly: 1985 - 2013
-1
0
1
2
3
4
5
6
Weighted
Unweighted
20
Figure 2: 10 Year 10 Year Forward Rates in the UK and US, Quarterly: 1986-2013
0
1
2
3
4
5
6
1986Q2 1990Q2 1994Q2 1998Q2 2002Q2 2006Q2 2010Q2
US
UK

21
Figure 3: Unweighted “World” Real Interest Rate vs. Yields on US TIPS
-2
-1
0
1
2
3
4
5
6
Unweighted
US TIPS
22
Figure 4: US Real Rate Minus Average for Rest of G7
-1
-0.8
-0.6
-0.4
-0.2
0
0.2
0.4
0.6
0.8
1

23
Figure 5A: Spot Yields on 10 Year Bonds, US and UK, 2013
Figure 5B: 10 Year 10 Year Forward Rates, US and UK, 2013
-1
-0.5
0
0.5
1
1.5
US
UK
0
0.5
1
1.5
2
2.5
US
UK