Measuring the Flexibility of Information Technology ... · Quality Management. ... Some even have...
42
MEASURING THE FLEXIBILITY OF INFORMATION TECHNOLOGY INFRASTRUCTURE 167 Journal of Management Information Systems / Summer 2000, Vol. 17, No. 1, pp. 167–208. © 2000 M.E. Sharpe, Inc. 0742–1222 / 2000 $9.50 + 0.00. Measuring the Flexibility of Information Technology Infrastructure: Exploratory Analysis of a Construct TERRY ANTHONY BYRD AND DOUGLAS E. TURNER TERRY ANTHONY BYRD is Associate Professor of MIS in the Department of Manage- ment at the College of Business, Auburn University. He holds a B.S. in Electrical Engineering from the University of Massachusetts at Amherst and a Ph.D. in Man- agement Information Systems from the University of South Carolina. His research has appeared in Journal of Management Information Systems, MIS Quarterly, Deci- sion Sciences, OMEGA, Interfaces, and other leading journals. His current research interests include the strategic management of information technology, information technology architecture and infrastructure, software development management, and information technology implementation. DOUGLAS E. TURNER is Assistant Professor in Management and Business Systems at the State University of West Georgia. He received a master’s degree in Operations Management and a Ph.D. in Management Information Systems from Auburn Univer- sity. He has over 10 years of industrial experience in the areas of Engineering and Quality Management. His current research focuses on information infrastructures and competitive advantage. ABSTRACT: Researchers and practitioners alike have taken note of the potential value of an organization’s IT infrastructure. IT infrastructure expenditures account for over 58 percent of an organization’s IT budget and the percentage is growing at 11 percent a year. Some even have called IT infrastructure the new competitive weapon and see it as being crucial in developing a sustained competitive advantage. Unique charac- teristics of an IT infrastructure determine the value of that infrastructure to an organi- zation. One characteristic, IT infrastructure flexibility, has captured the attention of researchers and practitioners. In fact, in most recent surveys featuring issues of most importance to IT executives, the development of a flexible and responsive IT infra- structure and related topics are always at or near the top of the responses. Although the importance of IT infrastructure flexibility has been established, the development of a valid, reliable instrument to measure this construct has not been reported in the literature. The purpose of this paper is to better define the IT infrastructure flexibility construct and to develop a valid, reliable measurement instrument for this construct. In addition to the definition and operationalization of the IT infrastructure flexibility construct, this study explores the instrument’s predictive validity with possible ante- cedent and consequent variables.
-
Upload
nguyenhanh -
Category
Documents
-
view
213 -
download
0
Transcript of Measuring the Flexibility of Information Technology ... · Quality Management. ... Some even have...

MEASURING THE FLEXIBILITY OF INFORMATION TECHNOLOGY INFRASTRUCTURE 167
Journal of Management Information Systems Summer 2000 Vol 17 No 1 pp 167ndash208
copy 2000 ME Sharpe Inc
0742ndash1222 2000 $950 + 000
Measuring the Flexibility of InformationTechnology Infrastructure ExploratoryAnalysis of a Construct
TERRY ANTHONY BYRD AND DOUGLAS E TURNER
TERRY ANTHONY BYRD is Associate Professor of MIS in the Department of Manage-ment at the College of Business Auburn University He holds a BS in ElectricalEngineering from the University of Massachusetts at Amherst and a PhD in Man-agement Information Systems from the University of South Carolina His researchhas appeared in Journal of Management Information Systems MIS Quarterly Deci-sion Sciences OMEGA Interfaces and other leading journals His current researchinterests include the strategic management of information technology informationtechnology architecture and infrastructure software development management andinformation technology implementation
DOUGLAS E TURNER is Assistant Professor in Management and Business Systems atthe State University of West Georgia He received a masterrsquos degree in OperationsManagement and a PhD in Management Information Systems from Auburn Univer-sity He has over 10 years of industrial experience in the areas of Engineering andQuality Management His current research focuses on information infrastructures andcompetitive advantage
ABSTRACT Researchers and practitioners alike have taken note of the potential valueof an organizationrsquos IT infrastructure IT infrastructure expenditures account for over58 percent of an organizationrsquos IT budget and the percentage is growing at 11 percenta year Some even have called IT infrastructure the new competitive weapon and seeit as being crucial in developing a sustained competitive advantage Unique charac-teristics of an IT infrastructure determine the value of that infrastructure to an organi-zation One characteristic IT infrastructure flexibility has captured the attention ofresearchers and practitioners In fact in most recent surveys featuring issues of mostimportance to IT executives the development of a flexible and responsive IT infra-structure and related topics are always at or near the top of the responses Althoughthe importance of IT infrastructure flexibility has been established the developmentof a valid reliable instrument to measure this construct has not been reported in theliterature The purpose of this paper is to better define the IT infrastructure flexibilityconstruct and to develop a valid reliable measurement instrument for this constructIn addition to the definition and operationalization of the IT infrastructure flexibilityconstruct this study explores the instrumentrsquos predictive validity with possible ante-cedent and consequent variables
168 BYRD AND TURNER
KEY WORDS AND PHRASES flexibility of information systems information architec-ture information technology infrastructure information technology personnel
THE VALUE OF INFORMATION TECHNOLOGY (IT) INFRASTRUCTURE in todayrsquos orga-nizations is by most indications growing in importance Many companies haveplaced the development of an effective IT infrastructure among the top concerns oftheir overall IT management In the most recent Society for Information Management(SIM) Delphi study [14] senior IT executives responded that the building and devel-opment of a flexible and responsive IT infrastructure was the most important issue ofIT management In an even more recent survey the trade journal InformationWeekreported that creating a strong and flexible IT infrastructure emerged as the numberone priority among the 150 IT managers it surveyed [39] Over 77 percent of therespondents mentioned that the development of such an infrastructure was a toppriority in IT management particularly in integrating old legacy applications newin-house-developed software applications and packaged software applications Simi-lar results to these two studies have been found in other past investigations into thevalue of IT infrastructure [13 49 59] Additionally Broadbent and Weill [15] found thatexpenditures on IT infrastructures accounted for an average of about 58 percent oforganizational IT budgets and have increased at about 11 percent a year in recent years
IT infrastructure is a multifaceted concept that seems to include two related butdistinct components Broadbent and Weill [15] and Henderson and Venkatraman [36]probably characterized these two components best by separating the concept into (1)a technical IT infrastructure and (2) a human IT infrastructure The technical infra-structure is the choices pertaining to applications data and technology configura-tions The human infrastructure is the choices pertaining to the knowledge andcapabilities required to manage effectively the IT resources within the organizationHenderson and Venkatraman [36] noted that human infrastructure included the expe-rience competencies commitments values and norms of the IT personnel deliver-ing the IT products and services This is the way the concept is used in this paper
Unique characteristics of an IT infrastructure appear to determine the value of thatinfrastructure to an organization Duncan [26] wrote ldquoOne firmrsquos infrastructure maymake strategic innovations in business process feasible while the characteristics ofcompetitorsrsquo infrastructure may likewise cause their inability to imitate the innova-tion rapidly enough to mitigate the first moverrsquos advantage This set of characteristicshas been loosely described as infrastructure lsquoflexibilityrsquordquo (p 38) It is this character-istic of IT infrastructure that has captured much of the attention of researchers andpractitioners [3 14 22 31 39 65 79]
Although the importance of the IT infrastructure flexibility construct has beenstrongly suggested through the writings of practitioners and researchers [3 14 1516 17 22 31 39 65 79] the development of a valid reliable instrument to measurethis construct has not been reported in the literature The purpose of this paper is tobetter explain the IT infrastructure flexibility construct and to begin the process of
MEASURING THE FLEXIBILITY OF INFORMATION TECHNOLOGY INFRASTRUCTURE 169
developing a measurement instrument for this construct This exploratory study isseen only as a first step in the development of such an instrument The expectation isthat the instrument developed in this study will be further refined in future studieswith the resulting instrument used to examine the value of IT infrastructure flexibilityto organizations
Background of the IT Infrastructure Flexibility Construct
AS WAS STATED EARLIER IN THIS PAPER THE IT INFRASTRUCTURE CONCEPT can bedivided into two relatedmdashbut distinct componentsmdasha technical IT infrastructure anda human IT infrastructure (see [15 16 36]) Since this paper is taking the view oftreating each one of these components separately in the development of the measure-ment instrument the components will be discussed separately in this backgroundreview Examination of previous studies reinforces this perspective because in manycases past research has explored these components individually (eg [45 65])
The technical IT infrastructure is oftentimes what is being alluded to when practitio-ners and researchers discuss IT infrastructure McKay and Brockway [54] called thetechnical infrastructure the enabling foundation of shared IT capabilities upon whichthe entire business depends Davenport and Linder [22] referred to technical IT infra-structure as that part of the organizationrsquos information capacity intended to be sharedThey concluded that a technical IT infrastructure is a firmrsquos institutionalized IT prac-ticemdashthe consistent foundation on which the specific business activities and computerapplications are built Congruent with these other researchers Duncan [26] describedthe technical infrastructure as a set of shared tangible IT resources forming a founda-tion for business applications In her study platform technology (hardware and oper-ating systems) network and telecommunications technologies data and core softwareapplications composed the tangible IT resources of the IT infrastructure [26]
Rockart et al [65] reflected the ideal goals of a technical IT infrastructure in stating
a ldquotechnical IT infrastructurerdquo of telecommunications computers softwareand data is integrated and interconnected so that all type of information canbe expeditiouslymdashand effortlessly from the users viewpointmdashrouted throughthe network and redesigned processes Because it involves fewer manual orcomplex computer-based interventions a ldquoseamlessrdquo infrastructure is cheaperto operate than independent divisional infrastructures In addition an effec-tive infrastructure is a prerequisite for doing business globally where thesharing of information and knowledge throughout the organization is increas-ingly vital (p 49)
The human IT infrastructure includes human and organizational skills expertisecompetencies knowledge commitments values norms and organizational struc-tures [15 16 17 35 36 45] Weill [78] stated that two firms investing the sameamount in IT and with the same management directions will most likely have differ-ent organizational results from the IT He further stated that it was the effectiveness of
170 BYRD AND TURNER
the human IT infrastructure that influenced the way IT is converted into productiveoutputs This effectiveness can be measured in the magnitude and quality of the knowl-edge skills and experience of the human IT infrastructure in developing and imple-menting major IT applications and the technical IT infrastructure
Lee et al [45] developed a framework from empirical evidence that found that thehuman IT infrastructure needed four types of knowledge and skills to be effectiveThey were identified as (1) technology management knowledge and skills (2) busi-ness functional knowledge and skills (3) interpersonal and management skills and(4) technical knowledge and skills Technology management knowledge and skillsinclude an understanding of where and how to deploy IT effectively and profitably bymeeting the strategic goals and objectives of an organization Business functionalknowledge and skills refer to the ability to interpret business problems and developappropriate technical solutions Interpersonal and management knowledge and skillsinclude abilities like planning organizing writing teaching and leading To be ef-fective IT personnel must be able to plan organize and lead projects plan organizeand write clear concise effective memos reports and documentation be sensitive toorganizational culture and politics and execute work in a collaborative environmentTechnical specialty knowledge and skills involve knowhow and skills in technicalareas such as computer operating systems relational databases telecommunicationsand other such areas
IT Infrastructure Flexibility
Flexibility is emerging as a key competitive priority in many organizational activitiessuch as manufacturing [33 64] high-technology maneuvers [27] automation [2]finance [52] and IT [22 26] Researchers also have heralded the competitive benefitsof overall organizational flexibility [1 23 43] Flexibility in the management litera-ture is defined as the degree to which an organization possesses a variety of actual andpotential procedures and the rapidity with which it can implement these proceduresto increase the control capability of the management and improve the controllabilityof the organization over its environment [23] Flexibility therefore gives an organiza-tion the ability to control outside environments effectively For example high flex-ibility corresponds with a high control of the organization with respect to theenvironment [23] The more control an organization has over its competitive environ-ment the better its potential for a favorable competitive position
Davenport and Linder [22] stated that IT infrastructure flexibility should be viewedas an organizational core competency suggesting that a ldquogoodrdquo infrastructure is quan-tified by its flexibility and robustness to enable change Weill [79] suggested that ITinfrastructure flexibility must be able to handle increased customer demands withoutincreased costs Venkatraman [77] stated that IT infrastructure should mainly focus onspeed of implementation and flexibility Allen and Boynton [3] noted that efficiencyand flexibility are the two most critical factors in selecting any IT application or systemwith flexibility the more important of the two According to these authors IT infra-structure flexibility allows organizations to respond to new market conditions while
MEASURING THE FLEXIBILITY OF INFORMATION TECHNOLOGY INFRASTRUCTURE 171
providing for future integration These perspectives indicate that the issue of flexibil-ity may be viewed as a critical component of IT infrastructure because many organiza-tions are faced with an ever increasing rate of change in their business environments
Duncan [26] offered an empirical investigation of the technical aspects of the ITinfrastructure flexibility construct She demonstrated that one way to describe techni-cal IT infrastructure flexibility more precisely was through the qualities of connectiv-ity compatibility and modularity Connectivity is the ability of any technologycomponent to attach to any of the other components inside and outside the organiza-tional environment Compatibility is the ability to share any type of information acrossany technology component At one extreme only simple text messages can be sharedwhile at the other extreme any document process service video image text audioor a combination of these can be used by any other system regardless of manufac-turer make or type Modularity is the ability to add modify and remove any soft-ware hardware or data components of the infrastructure with ease and with no majoroverall effect Modularity also relates to the degree to which IT software hardwareand data can be either seamlessly or effortlessly diffused into the infrastructure oreasily supported by the infrastructure According to Duncan an organization withhigh connectivity compatibility and modularity is viewed as a having high technicalIT infrastructure flexibility
Flexibility in the human IT infrastructure is related to the depth and breadth of thefour types of knowledge and skills outlined earlier Todd et al [75] reported that notonly were technical knowledge and skills important but more in-depth technical skillsin more areas were desirable For example an IT professional involved in microcom-puter support for end users would probably also need to be knowledgeable aboutlocal area networks and very possibly the Internet and its related technologies Flex-ibility among technology management skills is valuable because the realignment ofIT resources seems to be increasingly necessary to rapidly respond to changing busi-ness needs [31] Henderson and Venkatraman [35] suggested that business functionalknowledge and skills contribute to infrastructure flexibility by affecting the ITorganizationrsquos ability to plan effectively Flexibility in interpersonal and managementskills is needed because IT applications have become more horizontal as opposed tothe traditional hierarchical This necessitates a new type of adaptable employee whocan easily handle IT coordination and boundary issues
Development of the IT Infrastructure Flexibility Construct
A CONSTRUCT IS AN ABSTRACT REPRESENTATION OF A PHENOMENON OF interest toresearchers IT infrastructure flexibility is the construct of interest in this study Themethodology for this study follows the recommendations for construct measurementoutlined by Churchill [20] Stage 1 of Churchillrsquos paradigm defines the domain of theIT infrastructure flexibility construct Stage 2 operationalizes the construct by devel-oping a measurement instrument Stage 3 contains the statistical analyses of the datagathered from administering the instrument Churchillrsquos methodology has been usedpreviously for construct development in the IT field of study (see eg [44 46 69])
172 BYRD AND TURNER
Domain of the IT Infrastructure Flexibility Construct (Definition)
The domain of a construct is essentially a definition of the concept In the previousdiscussion in this paper several authorsrsquo views of the IT infrastructure and IT infra-structure flexibility are presented These views are synthesized into the followingdefinition and are characterized by Figure 1 [16]
IT infrastructure is the shared IT resources consisting of a technical physicalbase of hardware software communications technologies data and core ap-plications and a human component of skills expertise competencies commit-ments values norms and knowledge that combine to create IT services thatare typically unique to an organization These IT services provide a foundationfor communications interchange across the entire organization and for the de-velopment and implementation of present and future business applications
Combining this definition with the concept of flexibility yields
IT infrastructure flexibility is the ability to easily and readily diffuse or sup-port a wide variety of hardware software communications technologies datacore applications skills and competencies commitments and values withinthe technical physical base and the human component of the existing IT infra-structure
Content Analysis of the IT Infrastructure Flexibility Construct
In reviewing the IT literature five IT infrastructure models were discovered that havedimensions underlying the IT infrastructure flexibility construct The models are shownin Table 1 They were proposed by Broadbent et al [16] Davenport and Linder [22]Duncan [26] Gibson [31] and Lee et al [45] The resulting dimensions taken fromcombining these models are (1) IT connectivity (2) application functionality (3) ITcompatibility (4) data transparency (5) technology management (6) business knowl-edge (7) management knowledge and (8) technical skills The first four are elementsof the physical base or the technical IT infrastructure and the last four dimensions areelements of the human component or human IT infrastructure
Compatibility and connectivity are defined as found in Duncan [26] and as givenearlier in this paper Application functionality relates to the ability to add modifyand remove the modules of software applications with little or no widespread effecton the applications collectively Data transparency is defined as the free retrieval andflow of data between authorized personnel in an organization or between organiza-tions regardless of location [31 41] Technology management pertains to theorganizationrsquos ability to deploy IT in the most effective possible manner in supportof the business strategies [19 45 53 72] Business skills relate to the ability of ITpersonnel to understand the business processes they are to support and to apply theappropriate technical solution to a given business problem [45] Management knowl-
MEASURING THE FLEXIBILITY OF INFORMATION TECHNOLOGY INFRASTRUCTURE 173
edge and skills refer to the importance of IT personnel having skills and knowledgeto assume roles outside their area of training or original competencies [28 45 48]These may include areas like project management and business process supportLastly technical skills are a set of measures of technical capabilities such as pro-gramming understanding software development processes and knowledge of oper-ating systems [45]
Using these dimensions a content analysis of the IT literature was employed re-sulting in a pool of items that were used in the development of the initial instrumentThe content analysis utilized IT peer-reviewed periodicals professional periodicalsbooks and monographs The original pool of items contained 181 items relevant tothe dimensions found in Table 1 Similar items are consolidated into a single itemresulting in an initial pool of 132 items with at least six items in each dimension Eachitem is presented on a five-point Likert scale
The questionnaire was pretested with eight IT managersmdashfour in higher educationand four in the private sector Each manager was briefed on the purpose of the study andasked to critique the items for completeness understandability terminology and ambi-guity This pretest resulted in the instrument being reduced from 132 items to 97 items
The resulting questionnaire was then pilot-tested by IT personnel in three differenttypes of firms a textile manufacturer a mass retailer and a financial institution Ateach location a senior IT manager was asked to distribute a copy of the questionnaireto other high-level IT executives Each participant was asked to complete the ques-tionnaire and to offer any suggestions for improvement The pilot study resulted in areduction from 97 items to 74 items for the IT infrastructure flexibility constructSeveral other items were modified according to the suggestions of the IT executivesThe 74 items are given in Tables 2 and 3 with the original source reference(s)
The complete questionnaire is shown in Appendix A
Figure 1 Model Depicting Technical and Human Components of IT Infrastructure (adaptedfrom [15])
174 BY
RD
AN
D T
UR
NE
R
Table 1 Derivation of IT Dimensions From Existing IT Infrastructure Frameworks
InformationTechnologyInfrastructure
Davenport and FlexibilityGibson [31] Linder [22] Broadbent et al [16] Duncan [26] Lee et al [45] Dimensions
Communications Flexibility Communications NetworkConnectivity Technologies Management Telecom IT Connectivity
Application Business Application Applications ApplicationsFunctionality Applications Management Functionality
Computer Technical Standards PlatformCompatibility Functionality Management IT Compatibility
Data Business Data Data DataTransparency Information Management Transparency
IT Organization Business Process IT Technology Technologyand Control Support RampD Management Management
Services Business BusinessManagement Functional Skills Knowledge
Interpersonal Skills ManagementKnowledge
Core Education Technical Technical SkillsTechnologies Management Specialty Skills
MEASURING THE FLEXIBILITY OF INFORMATION TECHNOLOGY INFRASTRUCTURE 175
Data Collection
The final version of the questionnaire was mailed to senior IT managers in mainlylarge Fortune 1000 companies Their titles included Chief Information Officer VicePresident of Information Services Director of MIS and Database AdministrationDirectors These top IT executives were targeted because of their knowledge of cor-porate IT management To identify IT managers for the target audience the Direc-tory of Top Computer Executives was used The Directory lists thousands of ITexecutives with their companies and addresses for many public and private USorganizations The directory is updated annually and the 1998 release was utilizedfor this study One thousand executives in eight private sector industries were ran-domly selected for this final distribution stage A total of 207 questionnaires werereturned for a respectable 207 response rate This is in line with the response ratefor studies using senior IT executives in large organizations (eg [32 63 66 70])and other studies targeting senior executives (eg [55 67]) The demographic re-sults are given in Tables 4 5 6 and 7
Nonresponse bias is investigated by comparing the industry distribution of the re-turned questionnaires to the population industry distribution using a chi-square one-sample test Because the sample size is sufficiently large and only two frequencies areless than fivemdashwith both of these above onemdashthe chi-square is appropriate for use[58] The computed chi-square statistic testing the sample industry distribution againstthe population distribution is 1404 with 7 degrees of freedom and therefore notsignificant at the 005 level This suggests that the distribution of firms in the sampledid not significantly differ from the distribution of firms in the population thus indi-cating little or no response bias
Table 2 Distribution of Returned Questionnaire
Industry Type Mailed Returned Percentage
Manufacturing 493 119 241Insurance 120 10 83Health Services 91 16 176Retail 76 18 237Utilities 67 11 164Diversified Financial 60 15 250Banks 57 10 175Transportation 25 6 240Others (not specified) 11 2 182
Table 3 Management Level of Respondents
Classification Frequency Percentage
Executive 56 270Upper Middle Management 110 531Professional 41 198
176 BYRD AND TURNER
Table 5 Revenue Distribution of Companies in Survey
Revenues of Company(in millions) Frequency Percentage
$50ndash250 18 87$251ndash1000 87 420$1001ndash5000 89 430Over $5000 13 63
Table 4 Organization Size
Employees in Company Frequency Percentage
50ndash250 17 82251ndash1000 38 1841001ndash5000 104 502Over 5000 48 232
Instrument Assessment (Validity and Reliability)
Each of the sets of items in Tables 2 and 3 for the technical IT infrastructure and thehuman IT infrastructure respectively represents a dimension of an a priori measure-ment model of the theoretical IT infrastructure flexibility construct The verificationof this model is through the use of confirmatory factor analysis [40] In utilizing thistechnique in confirming factors for strategic IT planning Segars and Grover [68]wrote ldquothe analytical framework of confirmatory factor analysis provides an appro-priate means of assessing the efficacy of measurement among scale items and theconsistency of a pre-specified structural equation model with its associated networkof theoretical conceptsrdquo (p 148) In similar fashion in this study the items given inTables 2 and 3 are hypothesized to uniquely measure the associated factor and thesystem of factors to determine an overarching construct called IT infrastructure flex-ibility In this confirmation the two components of IT infrastructuremdashthe technicalIT infrastructure and the human IT infrastructuremdashare examined in separate analysesbecause of their distinct albeit related nature
In evaluating the confirmatory factor models a step-by-step process suggested byHair et al [34] is used This process incorporates general procedures recommendedby Joreskog [40] and Anderson [4] A similar mechanism was followed by Segars andGrover [68] in their strategic IT planning study by Smith et al [71] in their informa-tion privacy study and Sethi and King [70] in their strategic IT application studyFollowing their examples the factors are evaluated in isolation then in pairs andthen as a collective network This procedure according to Segars and Grover ldquopro-vides the fullest evidence of measurement efficacy and also reduces the likelihood ofconfounds in full structural equation modeling which may arise due to excessiveerror in measurementrdquo ([68] p 148 [4 40]) In view of these guidelines the EQS forWindows program (Version 57a) for structural equation modeling is used as the ana-lytical program for testing statistical assumptions and for estimating the confirmatory
MEASURING THE FLEXIBILITY OF INFORMATION TECHNOLOGY INFRASTRUCTURE 177
Table 6 Initial Item Measures for Technical IT Infrastructure
Item Measures of IT Connectivity(Five-Point Scale Anchored by ldquoStrongly Disagreerdquo and ldquoStrongly Agreerdquo)
CN1 Compared to rivals within our industry our organization has the foremost inavailable IT systems and connections (eg ADSL VDSL ATM SDV) [26]
CN2 Flexible electronic links exist between our organization and external entities (egvendor customers) [12]
CN3 Our organization has formally addressed the issue of data security with access toa number of protocol (eg Kerberos V5 MIME PGP S-HTTP) [26]
CN4 All remote branch and mobile offices are connected to the central office [26 41]CN5 Our organization utilizes open systems network mechanisms to boost connectivity
[26 41]CN6 There are very few identifiable communications bottlenecks within our organiza-
tion [26]CN7 Our organization utilizes a virtual network or VLAN to connect to end users [12]CN8 New locations or acquisitions are quickly assimilated into our IT infrastructure [12]
Items Measures of Applications Functionality(Five-Point Scale Anchored by ldquoStrongly Disagreerdquo and ldquoStrongly Agreerdquo)
AF1 The applications used in our organization are designed to be reusable [12 16 26]AF2 Reusable software modules are widely used in new systems development [12 16
26]AF3 End users utilize object-oriented tools to create their own applications [56]AF4 IT personnel utilize object-oriented technologies to minimize the development time
for new applications [56]AF5 Legacy systems within our organization restrict the development of new applica-
tions [26 29]AF6 Data processing (eg batch job key entry time etc) does NOT restrict normal
business operations or functions [47]AF7 We have a backlog of IT design work for new applications [12]AF8 Our organization uses enterprise-wide application software [12 26]
Item Measures for IT Compatibility(Five-Point Scale Anchored by ldquoStrongly Disagreerdquo and ldquoStrongly Agreerdquo)
CM1 Remote branch and mobile offices do not have to perform any additional steps orprocedures to access data from home or central office [26]
CM2 End users throughout the organization utilize a common operating system (egUNIX OS2) [47]
CM3 Software applications can be easily transported and used across multipleplatforms [26]
CM4 Our organization offers a wide variety of types of information to end users (egmultimedia) [26]
CM5 Our user interfaces provide transparent access to all platforms and applications[26]
CM6 Data received by our organization from electronic links (eg EDI EFT) are easilyinterpretable [26]
CM7 The rapidity of IT change (eg revision level release) in our organization is high [12]
Continued
178 BYRD AND TURNER
Table 6 Initial Item Measures for Technical IT Infrastructure (Continued)
CM8 Information is shared seamlessly across our organization regardless of thelocation [12 26 41]
CM9 Our organization provides multiple interfaces or entry points (eg Web access)for external end users [26 29]
Item Measures for Data Transparency(Five-Point Scale Anchored by ldquoStrongly Disagreerdquo and ldquoStrongly Agreerdquo)
DT1 Our organization utilizes online analytical processing (OLAP) [31]DT2 Our corporate database is able to communicate through many different protocols
(eg SQL ODBC) [21 47]DT3 Mobile users have ready access to the same data used at desktops [26]DT4 A common view of our organizationrsquos customer is available to everyone in the
organization [26 56]DT5 Our organization easily adapts to various vendorsrsquo database management
systems protocols and standards [12]DT6 Data captured in one part of our organization are immediately available to
everyone in the organization [26 29]DT7 Our IT organization handles variances in corporate data formats and standards [26]DT8 Data rules and relations (eg tax regulations) are hard-coded into applications
[26 56]
and structural equation models developed in this study One advantage of using EQSover other structural equation modeling programs like LISREL is that EQS placesless stringent assumptions on the multivariate normality of the data Despite the ro-bustness of EQS in this area tests of skewness and kurtosis are examined and do notshow major departures from normality or excessive kurtosis
Other statistical considerations of the process of Hair et al [34] included samplesize and identification of the structural model In accessing the proper sample sizemaximum likelihood estimation (MLE) usually requires a sample size of at least 100However as the sample size gets large say 400 or more the MLE becomes too sen-sitive and almost any difference is detected making goodness-of-fit measures indi-cate poor fit [18 50 73] Although there is no ideal sample size a general consensusseems to have developed that around 200 is a ldquogood sample sizerdquo [34]
Identification is the ability of the proposed model to generate unique estimates Aprimary consideration is that one must have more equations than unknowns [34]Unfortunately as the complexity of structural equation models has risen there is noguaranteed approach for ensuring that these more complex models are identifiedVirtually all of the structural equation modeling packages including EQS will per-form simple tests for identification during the estimation process There was no iden-tification error message from EQS in any of the runs of the models in this study InEQS if there is no identification error associated with any parameters it will print outthe message ldquoPARAMETER ESTIMATES APPEAR IN ORDER NO SPECIALPROBLEMS WERE ENCOUNTERED DURING OPTIMIZATIONrdquo This messagewas found on all computer runs used in this study However the identification test in
MEASURING THE FLEXIBILITY OF INFORMATION TECHNOLOGY INFRASTRUCTURE 179
Table 7 Initial Item Measures for Human IT Infrastructure
Item Measures for Technology Management(Five-Point Scale Anchored by ldquoStrongly Disagreerdquo and ldquoStrongly Agreerdquo)
TM1 Our IT personnel are knowledgeable about the key success factors that must goright if our organization is to succeed [56]
TM2 Our IT provides unique channels to suppliers or customers that are difficult forcompetitors to replicate [56]
TM3 Our IT personnel are encouraged to learn new technologies [45]TM4 Our IT personnel closely follow the trends in current technologies [45 56]TM5 Very little backlog of work exists for IT personnel [12]TM6 Investments in IT are best described as long-term and consistent [22]TM7 Our organization often uses IT as a component for an information-based
innovation [56]TM8 The strategies of the IT group and our organizationrsquos strategies are well aligned
[22 56]
Item Measures for Business Knowledge(Five-Point Scale Anchored by ldquoStrongly Disagreerdquo and ldquoStrongly Agreerdquo)
BK1 Our IT personnel understand our organizationrsquos policies and plans [22 56]BK2 Our IT personnel understand the business environments they support [16 22
56]BK3 Our IT personnel are encouraged to learn about business functions [56]BK4 Our IT personnel are able to interpret business problems and develop appropri-
ate technical solutions [56 79]BK5 Our IT personnel are knowledgeable about business functions [56]BK6 Our IT personnel are knowledgeable about the environmental constraints within
which the organization operates (eg government regulation competition) [16 56]BK7 Our IT personnel are free to assist end users as they deem necessary [16 22 56]BK8 Our IT personnel are knowledgeable about our organizationrsquos product delivery
logistics system methodology (eg KANBAN JIT continuous operation) [56]BK9 Problem resolution between IT and business units is identified as a specific job
task in our organization [45]
Item Measures for Management Knowledge(Five-Point Scale Anchored by ldquoStrongly Disagreerdquo and ldquoStrongly Agreerdquo)
MK1 Our IT personnel are self-directed and proactive [45]MK2 Our IT personnel are very capable in teaching others [45]MK3 Our IT personnel have the ability to plan organize and lead projects [12 26 45]MK4 Our IT personnel have the ability to plan and execute work in a collective
environment [16 56]MK5 Our IT personnel have the ability to accomplish multiple assignments [45]MK6 Our IT personnel work well in cross-functional teams addressing business
problems [45]MK7 Our IT personnel have the ability to work cooperatively in a project team
environment [45]MK8 Our IT personnel have the ability to work closely with clients and customers [16
45]
Continued
180 BYRD AND TURNER
Table 7 Initial Item Measures for Human IT Infrastructure (Continued)
MK9 Our IT personnel have the ability to write clear concise and effective memosreports and documentation [45]
MK10 Our IT personnel have the ability to develop and deliver informative and persua-sive presentations [45]
MK11 Our IT personnel are cross-trained to support other IT services outside theirprimary knowledge domain (eg programmers trained to support telecommuni-cations) [45]
Item Measures for Technical Knowledge(Five-Point Scale Anchored by ldquoStrongly Disagreerdquo and ldquoStrongly Agreerdquo)
TK1 Our IT personnel are skilled in multiple programming languages [16 22 45]TK2 Our IT personnel are skilled in multiple types of databases (eg network
relational object-oriented) [12 45]TK3 Our IT personnel are skilled in multiple structured programming CASE methods
or tools [22]TK4 Our IT personnel are skilled in multiple mainframe computer operating systems
[12 16 45]TK5 Our IT personnel are skilled in multiple microcomputer operating systems [12
16 45]TK6 Our IT personnel are skilled in expert systems or artificial intelligence [12 16 45
56]TK7 Our IT personnel are skilled in decision support systems [12 16 45]TK8 Our IT personnel are competent in managing the development of life cycle of
projects [12 16 45]TK9 Our IT personnel are skilled in distributed processing or distributed computing
[12 16 45]TK10 Our IT personnel are skilled in network management and maintenance [12 16 45]TK11 Our IT personnel are skilled in developing Web-based applications [12 16 45]TK12 Our IT personnel are skilled in hardware diagnosis and maintenance [12 16 45]TK13 Our IT personnel are skilled in data warehousing mining or marts [12 16 45]
EQS is fairly simplemdashlike those in other packages such as LISREL and CALISmdashandmay overlook identification problems in some models [40] Hair et al [34] suggestthat the identification problem can be tested by reestimating the model several timeseach time with different starting values EQS can automatically create a start value foreach coefficient or the user can input a start value for each one In this study the startvalues for the coefficients were changed and the models were run several times to testfor identification problems The results converged at about the same point each timeand thus gave evidence again of no identification problem
From a theoretical standpoint the measurement properties of a construct are evalu-ated using a variety of techniques These include internal and external validity theo-retical meaningfulness internal consistency of operationalization convergentvalidity discriminant validity and nomological validity [6 70] However taking anoperational point of view the following minimal subset is considered important [7076] unidimensionality and convergent validity reliability discriminant validityand nomological (ie predictive) validity These last four are assessed in this study
MEASURING THE FLEXIBILITY OF INFORMATION TECHNOLOGY INFRASTRUCTURE 181
Assessment of Convergent Validity and Unidimensionality
Unidimensionality (and convergent validity) has been defined as the existence of onelatent trait or construct underlying a set of measures [5] Unidimensionality in confir-matory factor analysis is usually assessed by the values obtained in a set of measure-ment indicators in a series of factor program (in this case EQS) runs Due to theexploratory nature of this research loadings of items on a factor above a cutoff of 030are kept in the analysis Items with loadings below this cutoff were dropped fromfurther consideration The items that satisfy the convergent validity and unidimen-sionality criteria for each factor are shown in Table 8 for the technical IT infrastructureand Table 9 for human IT infrastructure with fit indicators from the analyses In as-sessing the fit of the remaining items on their respective factors the indications arethat each set of items measuring each factor may very well define one latent trait of ITinfrastructure flexibility The goodness-of-fit indicator (GFI) is above the recommendedcutoff of 09 for unidimensionality for each set of items [34] and the adjusted chi-square is below an accepted five [4 11 30] The Root Mean Square Residual (RSMR)is at or below an acceptable 009 in every case [34] with the reliabilities at or abovethe cutoff of 05 that is normally acceptable for exploratory studies [60] Overall thefit indicators seem to suggest that each scale was capturing a significant amount ofvariation in the latent dimensions of the IT infrastructure flexibility construct
Assessment of Discriminant Validity
Discriminant validity is inferred when measures of each factor converge on their re-spective score that are unique from the scores of other factors [20] Following Bagozziet al [11] and Venkatraman [76] discriminant validity for the factors of the IT infra-structure flexibility construct is assessed by testing whether correlations between pairsof factors in each component set (technical IT infrastructure and human IT infrastruc-ture) were significantly different from unity The evidence for this comparison can beobtained from the estimates of an unconstrained model that free the correlation be-tween the factor pair and a constrained model that sets this correlation to unity Thedifference between the chi-square values with degrees of freedom equal to one is alsoa chi-square variate A significant difference in this chi-square variate indicates thatthe unconstrained model is a better fit than the constrained model Such a result im-plies the presence of discriminant validity between the pair of factors [4 10 68 7076] This test was performed on all possible pairs of factors in each component setTables 10 and 11 report the results of the six pairwise tests of the factors for eachcomponent set The significant results of all chi-square tests attest to strong discrimi-nant validity between any two factors in the models
Nomological Validity
Sethi and King [70] noted that ldquothe conceptual meaning of a construct is determinednot only by its definition and operationalization [7] but also by its relationship to
182 BYRD AND TURNER
Table 8 Final Measurement Properties of Technical IT Infrastructure
IT Connectivity
StandardItem Mean Deviation ML Estimate t-value p-level
CN1 329 100 0588 469 p lt 001CN3 290 110 0537 467 p lt 001CN4 419 083 0305 306 p lt 001CN5 360 099 0537 465 p lt 001CN6 356 105 0527 466 p lt 001CN7 279 122 0380 364 p lt 001
Measures of Model Fit
Dropped Because ML Estimate lt 030 CN2 CN8Adjusted Chi-Square lt 2Goodness-of-Fit = 0987Root Mean Square Residual = 0032Factor Reliability = 061
Applications Functionality
Item Mean Standard Deviation ML Estimate t-value p-level
AF2 305 106 0667 285 p lt 001AF3 227 097 0312 286 p lt 001AF4 282 103 0478 291 p lt 001AF5 293 100 0400 204 p lt 001
Measures of Model Fit
Dropped Because ML Estimate lt 030 AF1 AF6 AF7 AF8Adjusted Chi-Square lt 3Goodness-of-Fit = 0973Root Mean Square Residual = 009Factor Reliability = 050
IT Compatibility
Item Mean Standard Deviation ML Estimate t-value p-level
CM1 359 096 0300 383 p lt 001CM2 368 118 0510 383 p lt 001CM3 256 106 0700 324 p lt 001CM4 284 113 0596 320 p lt 001CM5 258 102 0416 294 p lt 001CM9 311 103 0502 300 p lt 001
Measures of Model Fit
Dropped Because ML Estimate lt 030 CM6 CM7 CM8Adjusted Chi-Square lt 4
MEASURING THE FLEXIBILITY OF INFORMATION TECHNOLOGY INFRASTRUCTURE 183
Goodness-of-Fit = 0969Root Mean Square Residual = 005Factor Reliability = 064
Data Transparency
Item Mean Std Deviation ML Estimate t-value p-level
DT2 324 100 0414 416 p lt 001DT3 330 109 0507 416 p lt 001DT5 271 098 0700 458 p lt 001DT6 274 105 0682 454 p lt 001
Measures of Model Fit
Dropped Because ML Estimate lt 030 DT1 DT4 DT7 DT8Adjusted Chi-Square lt 4Goodness-of-Fit = 0981Root Mean Square Residual = 004Factor Reliability = 062
antecedents and consequentsrdquo ([9] p 1613) Included in the instrument with theitems for the factors associated with IT infrastructure flexibility were items that hypo-thetically measure IT investment and items that hypothetically measure the competi-tive advantage provided by IT
The IT investment measures are ldquoinvestment in IT technologiesrdquo and ldquoinvestmentin IT personnelrdquo A confirmatory model of the two measures yields acceptable good-ness-of-fit indicators (see Appendix B) The factor to measure IT investment in ITtechnologies is composed of three items that asked specifically about the organizationrsquoslevel of investment in applications data and technical components The factor tomeasure IT investment in IT personnel is composed of four items that asked specifi-cally about the organizationrsquos level of investment in developing technology manage-ment skills business functional knowledge management skills and technicalknowledge and skills (see Appendix B for items)
Duimering et al [25] and Nemetz and Fry [57] argued that flexibility is not free andhas a cost associated with it An obvious cost according to Duimering et al [25] isthe greater financial investment required to purchase flexible technologies as com-pared to more traditional less flexible equipment and products Duimering et al alsopointed out that an increased level of technological complexity is associated with theimplementation of more flexible technologies Advanced technologies require moreadvanced technical management and support staff that is more costly [25] This beingthe case there should be a positive relationship between the factors of IT infrastruc-ture flexibility and IT investment Table 12 gives the results of t-tests between thefactors developed in this study that make up IT infrastructure flexibility and invest-ments in IT Eleven of the sixteen relationships are statistically significant althoughsome of the magnitudes of the relationships are low Nevertheless these results dosupport nomological validity for the developed factors of IT infrastructure flexibility
184 BYRD AND TURNER
Table 9 Final Measurement Properties of Human IT Infrastructure
Technology Management
StandardItem Mean Deviation ML Estimate t-value p-level
TM1 367 086 0652 757 p lt 001TM3 394 101 0662 754 p lt 001TM4 350 104 0530 632 p lt 001TM6 372 112 0738 810 p lt 001TM7 326 107 0626 723 p lt 001TM8 362 113 0545 647 p lt 001
Measures of Model Fit
Dropped Because ML Estimate lt 030 TM2 TM5Adjusted Chi-Square lt 2Goodness-of-Fit = 0974Root Mean Square Residual = 004Factor Reliability = 075
Business Knowledge
StandardItem Mean Deviation ML Estimate t-value p-level
BK1 387 098 0676 817 p lt 001BK3 420 089 0706 816 p lt 001BK4 374 110 0826 784 p lt 001BK5 387 110 0708 778 p lt 001BK6 358 095 0731 839 p lt 001BK7 373 111 0528 709 p lt 001BK8 344 097 0505 684 p lt 001BK9 329 118 0498 675 p lt 001
Measures of Model Fit
Dropped Because ML Estimate lt 030 BK2Adjusted Chi-Square lt 5Goodness-of-Fit = 0925Root Mean Square Residual = 007Factor Reliability = 082
Management Knowledge
StandardItem Mean Deviation ML Estimate t-value p-level
MK2 380 084 0645 504 p lt 001MK3 363 099 0419 504 p lt 001MK4 376 094 0688 977 p lt 001MK5 409 078 0609 718 p lt 001
MEASURING THE FLEXIBILITY OF INFORMATION TECHNOLOGY INFRASTRUCTURE 185
MK6 407 085 0722 814 p lt 001MK7 399 086 0668 773 p lt 001MK8 376 100 0500 611 p lt 001MK9 331 084 0592 703 p lt 001MK11 270 096 0552 665 p lt 001
Measures of Model Fit
Dropped Because ML Estimate lt 030 MK1 MK10Adjusted Chi-Square lt 3Goodness-of-Fit = 0932Root Mean Square Residual = 005Factor Reliability = 080
Technical Knowledge
StandardItem Mean Deviation ML Estimate t-value p-level
TK1 362 093 0443 451 p lt 001TK3 254 093 0423 405 p lt 001TK5 300 125 0558 532 p lt 001TK6 222 101 0477 429 p lt 001TK7 269 117 0481 431 p lt 001TK8 345 105 0461 405 p lt 001TK9 346 107 0586 423 p lt 001TK10 383 111 0596 417 p lt 001TK11 305 099 0566 461 p lt 001TK13 284 112 0451 419 p lt 001
Measures of Model Fit
Dropped Because ML Estimate lt 030 TK2 TK4 TK12Adjusted Chi-Square lt 3Goodness-of-Fit = 0927Root Mean Square Residual = 007Factor Reliability = 075
There were four measures for the competitive advantage provided by IT Theseresulted from a confirmatory factor analysis of items from the CAPITA (CompetitiveAdvantage Provided by an Information Technology Application) construct of Sethiand King [70] (see Appendix B for results of analysis) CAPITA ldquorefers to benefitsaccruing to a firm in terms of changes in the firmrsquos competitive position that arecaused by a single applicationrdquo ([70] p 1604) The items from this measure weremodified to apply to IT in general instead of to a single application The four resultingfactors that are extracted from the analysis are ldquosupport activity efficiencyrdquo ldquoprimaryactivity efficiencyrdquo ldquoresource management functionalityrdquo and ldquothreatrdquo [70] (see Ap-pendix B for items) The support activity efficiency is comprised of the impact of theIT on the cost of human resource management general management and coordina-tion The primary activity efficiency refers to those processes that involve the ldquophysi-
186 BY
RD
AN
D T
UR
NE
RTable 10 Results of Discriminant Validity Tests Technical IT Infrastructure
Chi-square(df)
Constrained Unconstrained Chi-squareTest ML Estimate t-value Chi-square Chi-square Difference
IT Connectivity withApplications Functionality 0082 178 19748(33) 10646(32) 9102IT Compatibility 0124 348 22512(51) 13542(50) 8970Data Transparency 0157 369 14019(33) 6612(32) 7407
Applications Functionality withIT Compatibility 0004 0140 25499(35) 14907(34) 10592Data Transparency 0228 411 10966(20) 5423(19) 5543
IT Compatibility withData Transparency 0066 275 25177(35) 14962(34) 10215
Significant at the p lt 001 level
ME
ASU
RIN
G T
HE
FLE
XIB
ILIT
Y O
F IN
FO
RM
AT
ION
TE
CH
NO
LO
GY
INFR
AST
RU
CT
UR
E 187
Table 11 Results of Discriminant Validity Tests Human IT Infrastructure
Chi-square(df)
Constrained Unconstrained Chi-squareTest ML Estimate t-value Chi-square Chi-square Difference
Technology Management withBusiness Knowledge 0391 669 54299(77) 50257(76) 4042Management Knowledge 0233 560 44584(87) 36755(86) 7829Technical Knowledge 0141 385 50925(95) 40947(94) 9978
Business Knowledge withManagement Knowledge 0297 616 54825(111) 48840(110) 5985Technical Knowledge 0191 433 54000(122) 46199(121) 7801
Management Knowledge withTechnical Knowledge 0149 427 66250(141) 56354(140) 9896
Significant at the p lt 001 level
188 BYRD AND TURNER
cal creation of the product and its sale and transfer to the buyer as well as after-saleservice [62] Resource management functionality measures how well IT assists itsprimary users in meeting the following needs related to a resource monitor utiliza-tion upgrade transfer or dispose and account for Threat consists of the impact of ITon things such as switching costs a corporationrsquos ability to move backward or for-ward in the value chain and the ability of a corporation to evaluate alternative cus-tomers or suppliers
Table 13 gives the results of t-tests between the factors of IT infrastructure flexibil-ity and the measures of competitive advantage from IT Note that IT infrastructureflexibility has almost no relationship to support activity efficiency This is reasonableas researchers and practitioners have emphasized the impact of IT on value chainactivities not on the support activities [61 62] However on the other measures ofthe competitive advantage from IT the table shows that IT infrastructure flexibilityfactors are significantly related in 19 of the 24 remaining possible relationships Theserelationships are consistent with the findings from past literature of studies of IT andits relationship to competitive advantage [22 37 38 42 74] Again these resultssupport the nomological validity of the IT infrastructure factors These factors appearto be significantly related to measures (IT investment and competitive advantage)that they have been linked with in past research These results add to the credibility ofthe factors and should give researchers more confidence in the measures as they seekto either improve them or utilize them in future studies
IT Infrastructure Flexibility Confirmatory Models
The confirmatory stage for the full model is done in two analyses reflecting the dis-tinct nature of the component set of IT infrastructure One confirmatory analysis isdone using the factors developed for the technical IT infrastructure whereas the sec-ond confirmatory analysis uses the factors developed for the human IT infrastructureEach component set has four factors Tables 14 and 15 give the goodness-of-fit sum-mary for the two models shown in Figure 2 (technical IT infrastructure) and Figure 3
Table 12 T-Test Results of Factors of IT Infrastructure and IT Investment
IT Investment in IT Investment inFactorsVariable Technology Human Skills
IT Connectivity 0063 0272Applications Functionality 0162 0103IT Compatibility 0034 0034Data Transparency 0276 0073Technology Management 0164 0560Business Knowledge 0056 0575Management Knowledge 0100 0463Technical Knowledge 0157 0511
Significant at p lt 001 Significant at p lt 005
MEASURING THE FLEXIBILITY OF INFORMATION TECHNOLOGY INFRASTRUCTURE 189
(human IT infrastructure) respectively The GFI for the technical flexibility compo-nent is 086 which is close to the recommended 09 The GFI for the human flexibil-ity component is 080 which is a little below the ideal cutoff of 09 However neitherof these is out of line with other exploratory studies developing measures for complexorganizational phenomena For example Sethi and King [70] reported a GFI of 076for their CAPITA construct The RMSR was about 009 for the technical componentand 008 for the human component A viewing of the distribution of the standardizedresiduals shows them to be symmetrical and centered around zero Therefore in bothcases the indicators were in satisfactory ranges and the models are at least reasonablefits for the data
Comparative Test for Second-Order Factors
The comparative methodology contrasts a baseline model with a model featuring asecond-order construction The baseline models for the two component sets are seenin Figures 2 and 3 with the fit indicators given in Tables 14 and 15 The alternativemodels are shown in Figures 4 and 5 respectively with goodness-of-fit indicatorspresented in Tables 16 and 17 Note that in these models the correlations between thefactors are now denoted by second-order factorsmdashtwo for technical IT infrastructureflexibility and one for human IT infrastructure flexibility The effect of these changesis to explain the covariation in the models in a more parsimonious mannermdashthat isone that requires fewer degrees of freedom Consequently the fit for the second-ordermodels will never be as good as the fit of what are called the baseline models Accord-ingly the baseline models can be thought of as the optimum model of fit for thesecond-order models Marsh and Hocevar [51] advised that the second-order modelbe assessed through the ratio of adjusted chi-squares of the baseline to the second-order model This ratio should approach 10 if the second-order model sufficientlycaptures the relationships among the factors in the model
Table 13 T-Test Results of Factors of IT Infrastructure and Factors of CompetitiveAdvantage from IT
Support Primary ResourceActivity Activity Management
FactorsVariable Efficiency Efficiency Functionality Threat
IT Connectivity 0036 0350 0055 0135Applications Functionality 0134 0335 0278 0159IT Compatibility 0060 0104 0223 0179Data Transparency 0156 0369 0349 0247Technology Management 0135 0417 0265 0045Business Knowledge 0014 0493 0254 0099Management Knowledge 0016 0198 0231 0032Technical Knowledge 0055 0465 0341 0293
Significant at p lt 001 Significant at p lt 005
190 BYRD AND TURNER
Table 15 Goodness-of-Fit Indices for Full Technical IT Infrastructure Second-Order Confirmatory Model
Number of Latent Variables 6Total Number of Items 20Degrees of Freedom 149Chi-Square Statistic 355p-Value 000Chi-SquareDegrees of Freedom (Adjusted Chi-Square) 238Goodness-of-Fit Index 086Root Mean Square Residual 009
Table 14 Goodness-of-Fit Indices for Full Technical IT Infrastructure Confirma-tory Model
Number of Latent Variables 4Total Number of Items 20Degrees of Freedom 153Chi-Square Statistic 355p-Value 000Chi-SquareDegrees of Freedom (Adjusted Chi-Square) 232Goodness-of-Fit Index 086Root Mean Square Residual 009
Figure 2 Confirmatory Model for First-Order Technical IT Infrastructure
In both instances the ratios of adjusted chi-square indicators of the first-orderconfirmatory models to the second-order confirmatory models approach 10 Segarsand Grover [68] pronounced that in such cases the second-order model is a ldquotruerrdquorepresentation of the model structure (four paths in contrast to six correlations) andthat it be accepted over the baseline model Therefore in both the technical IT
MEASURING THE FLEXIBILITY OF INFORMATION TECHNOLOGY INFRASTRUCTURE 191
infrastructure and the human IT infrastructure cases the second-order models areaccepted as the more accurate representation of the underlying data The resultingsecond-order factors for the technical IT infrastructure are labeled ldquointegrationrdquo (whichconsists of the ldquoIT connectivityrdquo and ldquoIT compatibilityrdquo) and ldquomodularityrdquo (whichconsists of the ldquoapplication functionalityrdquo and ldquodata transparencyrdquo) The resultingsecond-order factor for the human IT infrastructure is simply labeled ldquoIT personnelflexibilityrdquo and consists of all four of the factors found in the confirmatory analysis
Figure 3 Confirmatory Model for First-Order Human IT Infrastructure
Figure 4 Confirmatory Model for Second-Order Technical IT Infrastructure
192 BYRD AND TURNER
Table 17 Goodness of Fit Indices for Full Human IT Infrastructure Second-OrderConfirmatory Model
Number of Latent Variables 5Total Number of Items 33Degrees of Freedom 241Chi-Square Statistic 868p-Value 000Chi-SquareDegrees of Freedom (Adjusted Chi-Square) 360Goodness-of-Fit Index 079Root Mean Square Residual 008
Table 16 Goodness-of-Fit Indices for Full Human IT Infrastructure ConfirmatoryModel
Number of Latent Variables 4Total Number of Items 33Degrees of Freedom 246Chi-Square Statistic 868p-Value 000Chi-SquareDegrees of Freedom (Adjusted Chi-Square) 353Goodness-of-Fit Index 079Root Mean Square Residual 008
Figure 5 Confirmatory Model for Second-Order Human Infrastructure
Discussion
ACCORDING TO WISEMAN [80] THE ADVANCEMENT OF THE IT FIELD depends ongiving priority to measurement This is because theory construction and a cumula-tive tradition the ultimate objectives of a research field are inseparable from mea-
MEASURING THE FLEXIBILITY OF INFORMATION TECHNOLOGY INFRASTRUCTURE 193
surement [8] Thus to move from anecdotes and case studies to testable models andhypotheses it is critical to link theoretical concepts such as IT infrastructure flexibil-ity to empirical indicants [70] DeLone and McLean [24] also called upon the ITresearch community to develop validated measures that are closely tied to the effec-tiveness of IT in organizations Validated IT infrastructure measures can help ITmanagers better gauge the characteristics of this asset which studies have shownthese practitioners feel is so valuable to their organizations IT researchers can buildupon the models developed in this study through further examination of the factorsthat are discovered
The initial hypothesis for this research was that IT infrastructure flexibility consistsof eight dimensionsmdashfour in the technical base and four in the human componentThe findings in this study are extremely encouraging The instrumentation developedhere for IT infrastructure flexibility was subjected to examinations of unidimension-ality and convergent validity reliability discriminant validity and nomological valid-ity The results of these validity and reliability checks provide evidence that the initialhypothesis had some legitimacy The hypothesized eight dimensions are legitimizedthrough the use of these statistical tests Because of the importance of IT infrastruc-ture flexibility to practitioners researchers should continue to develop the items fac-tors and construct uncovered in this study A single study in any area is only onepiece of a puzzle to unlock the knowledge contained in that area The construct devel-oped here should be seen as a building block in the process to develop and deploy ameasure of IT infrastructure flexibility Researchers must continue to improve uponthis instrument by further validation across industries and within specific industriesThe instrument must be tested also with a different set of respondents maybe evenwith non-IT personnel It is in this way that the IT infrastructure flexibility constructwill evolve and move to maturity
In addition to the solid results of convergent validity and discriminant validity ofthe factors in this study the nomological or predictive validity of all the IT infrastruc-ture flexibility factors was promising The real value of developing a measurementinstrument comes in its use in studying relevant relationships to antecedent and con-sequent variables According to the results in the investigation of the nomologicalvalidity of the factors the resulting instrument looks encouraging The relationshipsbetween the factors of IT infrastructure flexibility and the IT investment measureswere solid although not spectacular Additionally the relationships of the infrastruc-ture factors with the measures of competitive advantage from IT were especially goodon three of the four measures The measure that did not show a strong relationshipwith the infrastructure factors was one that measures the support activity efficiencyAs pointed out earlier IT managers have not focused as much attention on gettingproductivity gains for support areasmdashsuch as human resources managementmdashfromIT as they have on activities associated with the value chain
An especially interesting aspect of this study is the discovery of second-order fac-tors associated with the dimensions of both the technical IT infrastructure flexibilityand the human IT infrastructure flexibility The initial hypothesis for the research isthat IT infrastructure flexibility consists of eight dimensionsmdashfour in the technical
194 BYRD AND TURNER
base and four in the human component However the findings of second-order analy-ses in this study reveal that these dimensions can be expressed in three factorsmdashtwofor technical infrastructure and one for human infrastructure These three are labeledldquointegrationrdquo ldquomodularityrdquo and ldquoIT personnel flexibilityrdquo respectively
The integration factor suggests that the respondents considered that transparentaccess into all organizational platforms contributes to the flexibility of the IT infra-structure This factor is a merger of the dimensions of IT connectivity and IT compat-ibility In a way it is not difficult to see why these two dimensions could ultimately bemerged in a more parsimonious model as one factor Modern telecommunicationstechnologies can typically support the transmission and distribution of all types ofinformation including voice image and video Even simple telephone lines supportthe transmission and distribution of all of these types Therefore typically wherethere are connections any type of information can be disseminated
The modularity factor is also a combination of two dimensions of the technical ITinfrastructure These two dimensions are application functionality and database trans-parency Both of these dimensions are associated with hardware software and datain the organization Additionally software applications and data typically work to-gether in a manner that it is not easy to separate one from the other The items of themodularity factor suggest that the survey respondents acknowledge the trend towardfaster application development (eg reusable software modules object-oriented tech-nologies) This second-order factor also implies that access control (eg transpar-ency) is important as modern organizations must be capable of disseminating datafaster and to a wider range of users
The four dimensions of the human infrastructure all loaded on one factor in itssecond-order analysis In a way this was surprising because it indicates that all fourhuman infrastructure dimensions can be viewed as a single item The implication ofthis is that senior IT management believes that IT personnel should have a myriad ofskills competencies and knowledge bases as the norm No longer are just technicalskills enough to satisfy IT management The evidence of this second-order analysisdivulges that IT personnel within a firm should be well-rounded with technologymanagement business knowledge management knowledge and technical skills
Future Research
IN ADDITION TO THE NEED TO FURTHER REFINE THE FACTORS DISCOVERED in thisstudy future research could focus more on the relationship between the factors of ITinfrastructure flexibility and other constructs such as competitive advantage Thepurpose of the relationship analyses in this study is simply to demonstrate the nomo-logical validity of the factors Much more rigorous studies must be completed tosubstantiate antecedent and consequent relationships among all the variables Muchmore sophisticated theoretical arguments and statistical tools are required to furtherexamine these relationships The IT infrastructure flexibility factors developed hereare a good start but only a start Questions about the contribution of each infrastruc-ture factor to sustained competitive advantage should be answered Is the integration
MEASURING THE FLEXIBILITY OF INFORMATION TECHNOLOGY INFRASTRUCTURE 195
factor equal to the modularity factor in its contribution to competitive advantageWhat is the role of IT personnel in utilizing the flexibility of the technical base of theIT infrastructure Are all three second-order factors needed to maximize sustainedcompetitive advantage in an organization Does integration cost more than modular-ity These and similar questions demand to be answered if the understanding of howa flexible IT infrastructure contributes to sustained competitive advantage is expectedto increase
Another interesting set of questions surrounds the cost of investment to develop aflexible infrastructure and the benefits that accrue from this type of infrastructure Dothe costs outweigh the benefits If benefits do accrue how long does it take beforethese benefits pay back the costs Are the benefits tangible or intangible Do thebenefits include such tangibles as return on investment increase in market share andincreased profits Is a flexible infrastructure simply becoming the cost of competingin many industries These questions desperately need answering because of the as-sumed value of IT infrastructure today
Conclusion
THIS STUDY HAS TAKEN THE FIRST STEP TOWARD creating a valid and reliable instru-ment for the IT infrastructure flexibility construct The construct was defined andoperationalized It was also validated and deemed reliable through fairly rigorousstatistical processes of confirmatory factor analysis and t-tests The hypothesized di-mensions fit well with the first-order factors of the confirmatory factor analysis How-ever second-order confirmatory factor analyses reduced the number of factors fromeight to three The more parsimonious structure is typically easier to work with indeveloping theoretical cause-and-effect models because the smaller number of con-structs reduces confusion in explaining relationships
The study also insinuates that a flexible IT infrastructure is positively related to anincrease in costs and competitive advantage for adopting organizations These resultspoint to the need for further study of the relationships between IT infrastructure flex-ibility and the costs and benefits of this flexibility It is suggested that IT researchersemploy the results of this study to develop new more rigorous studies to furtherclarify these issues
REFERENCES
1 Aaker DA and Mascarenhas B The need for strategic flexibility Journal of BusinessStrategy 5 2 (1984) 74ndash82
2 Adler PS Managing flexible automation California Management Review 30 3 (1988)34ndash56
3 Allen BR and Boynton AC Information architecture in search of efficient flexibil-ity MIS Quarterly 15 4 (1991) 435ndash445
4 Anderson JC An approach for confirmatory measurement and structural equation mod-eling of organizational properties Management Science 33 4 (1987) 525ndash541
196 BYRD AND TURNER
5 Anderson JC Gerbing DW and Hunter JE On the assessment of unidimensionalmeasurement internal and external consistency and overall consistency criteria Journal ofMarketing Research 24 (1987) 432ndash437
6 Bagozzi BP Casual Models in Marketing New York John Wiley amp Sons 19807 Bagozzi BP An examination of the validity of two models of attitude Multivariate
Behavioral Research 16 (1981) 323ndash3598 Bagozzi BP The role of measurement in theory construction and hypothesis testing
towards a holistic model In C Fornell (ed) A Second Generation of Multivariate Analysis 2New York Praeger 1982 pp 5ndash23
9 Bagozzi BP and Fornell C Theoretical concepts measurements and meaning In CFornell (ed) A Second Generation of Multivariate Analysis 2 New York Praeger 1982 pp 24ndash38
10 Bagozzi BP and Phillips W Representing and testing organizational theories a holis-tic construal Administrative Science Quarterly 27 September (1982) 459ndash489
11 Bagozzi BP Yi Y and Phillips W Assessing construct validity in organizationalresearch Administrative Science Quarterly 36 (1991) 421ndash458
12 Boar B Cost Effective Strategies for ClientServer Systems New York John Wiley ampSons 1996
13 Boar B Strategic Thinking for Information Technology How to Build the IT Organiza-tion for the Information Age New York John Wiley amp Sons Inc 1997
14 Brancheau JC Janz BD and Wetherbe JC Key issues in information systems man-agement 1994ndash95 SIM Delphi results MIS Quarterly 20 2 (1996) 225ndash242
15 Broadbent M and Weill P Management by maxim how business and IT managers cancreate IT infrastructures Sloan Management Review 38 3 (1997) 77ndash92
16 Broadbent M Weill P OrsquoBrien T and Neo BS Firm context and patterns of ITinfrastructure capability Proceedings of the Seventeenth International Conference on Infor-mation Systems 1996 pp 174ndash194
17 Broadbent M Weill P and St Clair D The implications of information technologyinfrastructure for business process redesign MIS Quarterly 23 2 (1999) 159ndash182
18 Carmines E and McIver J Analyzing models with unobserved variables analysis ofcovariance structures In G Bohrnstedt and E Borgotta (eds) Social Measurement CurrentIssues Beverly Hills CA Sage 1981 pp 65ndash115
19 Cash JI and Konsynski BR IS redraws competitive boundaries Harvard BusinessReview 63 2 (1985) 78ndash91
20 Churchill GA A paradigm for developing better measures of marketing constructsJournal of Marketing Research 16 1 (February 1979) 64ndash73
21 Conner DR Managing the Speed of Change New York Villard Books 199322 Davenport TH and Linder J Information management infrastructure the new com-
petitive weapon Proceedings of the 27th Annual Hawaii International Conference on SystemsSciences IEEE 1994 pp 885ndash899
23 De Leeuw ACJ and Volberda HW On the concept of flexibility a dual control per-spective Omega 24 2 (1996) 121ndash139
24 DeLone WH and McLean ER Information systems success the quest for the depen-dent variable Information Systems Research 3 1 (1992) 60ndash95
25 Duimering PR Safayeni F and Purdy L Integrated manufacturing redesign the or-ganization before implementing flexible technology Sloan Management Review 34 4 (1993)47ndash56
26 Duncan NB Capturing flexibility of information technology infrastructure a study ofresource characteristics and their measure Journal of Management Information Systems 12 2(1995) 37ndash57
27 Evans JS Strategic flexibility for high technology manoeuvres a conceptual frame-work Journal of Management Studies 28 1 (1991) 69ndash89
28 Farwell D Kuramoto L Lee DMS Trauth E and Winslow C A new paradigm forMIS implications for IS professionals Information Systems Management 9 2 (1992) 7ndash14
29 Fenny DF and Ives B In search of sustainability reaping long term advantage frominvestments in information technology Journal of Management Information Systems 7 1 (1990)27ndash46
MEASURING THE FLEXIBILITY OF INFORMATION TECHNOLOGY INFRASTRUCTURE 197
30 Gerbing D and Anderson JC An updated paradigm for scale development incorporatingunidimensionality and its assessment Journal of Marketing Research 25 (1988) 186ndash192
31 Gibson R Global information technology architectures Journal of Global InformationManagement 4 (1993) 28ndash38
32 Grover V An empirically derived model for the adoption of customer-basedinterorganizational systems Decision Sciences 24 3 (1993) 603ndash640
33 Gupta YP and Somers TM The measurement of manufacturing flexibility EuropeanJournal of Operational Research 60 (1992) 166ndash182
34 Hair JF Anderson RE Tatham RL and Black WC Multivariate Data Analysis (4thed) Englewood Cliffs NJ Prentice-Hall 1995
35 Henderson JC and Venkatraman N Strategic alignment leveraging information tech-nology for transforming organizations IBM Systems Journal 32 1 (1993) 4ndash16
36 Henderson JC and Venkatraman N Strategic alignment a model for organizationaltransformation via information technology In TJ Allen and MS Scott Morton (eds) Infor-mation Technology and the Corporation of the 1990rsquos Oxford UK Oxford University Press1994 pp 202ndash220
37 Huber GP A nature and design of post-industrial organizations Management Science30 (1984) 928ndash951
38 Huber GP A theory of the effects of advanced information technologies on organiza-tional design intelligence and decision making Academy of Management Review 15 1 (1991)88ndash115
39 InformationWeek Bond the new and the old enterprise architecture January 11 1999pp 108ndash109
40 Joreskog KG Testing structural equation models In KA Bollen and LS Lond (eds)Testing Structural Equation Models Newbury Park CA Sage Publications 1993 pp 294ndash316
41 Keen P Shaping the Future Business Design Through Information Technology BostonMA Harvard School Press 1991
42 Kettinger WJ Grover V Subashish G and Segars AH Strategic information sys-tems revisited a study in sustainability and performance MIS Quarterly 18 1 (1994) 31ndash58
43 Krijnen HG The flexible firm Long Range Planning 12 (1979) 63ndash7544 Lederer AL and Sethi V Root causes of strategic information systems planning
implementation problems Journal of Management Information Systems 9 1 (Summer1992) 25ndash45
45 Lee DMS Trauth E and Farwell D Critical skills and knowledge requirements ofIS professionals a joint academicindustry investigation MIS Quarterly 19 3 (1995) 313ndash340
46 Lewis BR Snyder CA and Rainer RK An empirical assessment of the informationresource management construct Journal of Management Information Systems 12 1 (1995)199ndash223
47 Libutti LR Systems Application Architecture The IBM SAA Strategy Blue Ridge Sum-mit PA Tab Books 1990
48 Maglitta J Hard skills for hard times Computerworld 27 51 (1983) 3549 Markus ML and Soh C Measuring the organizational impact of information technol-
ogy investment an exploratory study Journal of Management Information Systems 10 1(1993) 97ndash122
50 Marsh HW Balla JR and McDonald RP Goodness-of-fit indices in confirmatoryfactor analysis the effect of sample size Psychological Bulletin 103 (1988) 391ndash410
51 Marsh HW and Hocevar D Application of confirmatory factor analysis to the study ofself-concept first and higher order factor models and their invariance across groups Psycho-logical Bulletin 97 3 (1985) 562ndash582
52 Mason SP Valuing financial flexibility In BM Friedman (ed) Financing CorporateCapital Formation Chicago University of Chicago 1986 91ndash106
53 McFarlan F Information technology changes the way you compete Harvard BusinessReview 62 3 (1984) 98ndash103
54 McKay DT and Brockway DW Building IT infrastructure for the 1990s Stage byStage 9 3 (1989) 1ndash11
198 BYRD AND TURNER
55 Nayyar PR Stock market reactions to related diversification moves by service firmsseeking benefits from information asymmetry and economics of scope Strategic ManagementJournal 14 8 (1993) 569ndash591
56 Nelson R Educational needs as perceived by IS and end user personnel a survey ofknowledge and skill requirements MIS Quarterly 15 4 (1991) 503ndash525
57 Nemetz PL and Fry LW Flexible manufacturing organizations implications for strate-gic formulation and organizational design Academy of Management Review 13 (1988) 627ndash638
58 Neter J Kutner MH Nachtsheim CJ and Wasserman W Applied Linear StatisticalModels Chicago Irwin 1996
59 Niederman F Brancheau JC and Wetherbe JC Information systems managementissues in the 1990s MIS Quarterly 15 4 (1991) 474ndash499
60 Nunnally J Psychometric Theory New York McGraw-Hill 196761 Porter M Competitive Strategy New York Free Press 198062 Porter M Competitive Advantage New York Free Press 198563 Powell TC and Dent-Micallef A Information technology as competitive advantage the
role of human business and technology resources Strategic Management Journal 18 5 (1997)375ndash405
64 Ramasesh R and Jayakumar M Measurement of manufacturing flexibility a value-based approach Journal of Operations Management 10 4 (1991) 446ndash468
65 Rockart JF Earl MJ and Ross JW Eight imperatives for the new IT organizationSloan Management Review 38 1 (1996) 43ndash54
66 Sabherwal R and King WR An empirical taxonomy of the decision-making processesconcerning strategic applications of information systems Journal of Management InformationSystems 11 4 (1995) 177ndash214
67 Sambharya RB Foreign experience of top management teams and international diversifi-cation strategies of US multinational corporations Strategic Management Journal 17 9 (1996)739ndash746
68 Segars AH and Grover V Strategic information systems planning success an investiga-tion of the construct and its measurement MIS Quarterly 22 2 (1998) 139ndash163
69 Sethi V and King WR Construct measurement in information systems research anillustration in strategic systems Decision Sciences 22 4 (JulyndashAugust 1991) 455ndash472
70 Sethi V and King WR Development of measures to assess the extent to which aninformation technology application provides competitive advantage Management Science 40 12(December 1994) 1601ndash1627
71 Smith HJ Milberg SJ and Burke SJ Information privacy Measuring individualsrsquoconcerns about organizational practices MIS Quarterly 20 2 (June 1996) 167ndash196
72 Swanson EB Information systems innovation among organizations Management Sci-ence 40 9 (1994) 1069ndash1092
73 Tanaka J How big is enough Sample size and goodness-of-fit in structural equationmodels with latent variabales Child Development 58 (1987) 134ndash146
74 Tapscott D and Caston A Paradigm Shift The New Promise of Information TechnologyNew York McGraw-Hill 1993
75 Todd PA McKeen JD and Gallupe RB The evolution of IS job skills a contentanalysis of IS job advertisements from 1970ndash1990 MIS Quarterly 19 1 (1995) 1ndash27
76 Venkatraman N Strategic orientation of business enterprise the construct dimensionalityand measurement Management Science 35 8 (1989)
77 Venkatraman N IT-enabled business transformation from automation to business scoperedefinition Sloan Management Review (1994) 73ndash87
78 Weill P The relationship between investment in information technology and firm perfor-mance a study of valve manufacturing sector Information Systems Research 3 4(1992) 307ndash333
79 Weill P The role and value of information technology infrastructure Some empiricalobservations In R Banker R Kauffman and MA Mahmood (eds) Strategic InformationTechnology Management Perspectives on Organizational Growth and Competitive AdvantageMiddleton PA Idea Group 1993 pp 547ndash572
80 Wiseman C Strategic Information Systems Homewood IL Irwin 1988
MEASURING THE FLEXIBILITY OF INFORMATION TECHNOLOGY INFRASTRUCTURE 199
Appendix A Complete Questionnaire for the Information TechnologyFlexibility Survey
The purpose of this survey is to assess Information Technology (IT) InfrastructureFlexibility within your organization Please complete all sections by selecting thebest response for each question based on your view of your organization Thank youin advance for your participation
PLEASE RANK THE STATEMENTS BELOW FROM (1) STRONGLYDISAGREE TO (5) STRONGLY AGREEThe questions below relate to IT CONNECTIVITY within your organization
STRONGLY STRONGLYDISAGREE AGREE
szlig szligCompared to rivals within our industry our organization
has the foremost in available IT systems andconnections (eg ADSL VDSL ATM SDV) 1 2 3 4 5
Flexible electronic links exist between our organizationand external entities (eg vendor customers)1 2 3 4 5
Our organization has formally addressed the issue ofdata security with access to a number of protocols(eg Kerberos V5 MIME PGP S-HTTP) 1 2 3 4 5
All remote branch and mobile offices are connectedto the central office 1 2 3 4 5
Our organization utilizes open systems networkmechanisms to boost connectivity(eg ATM FDDI) 1 2 3 4 5
There are very few identifiable communicationsbottlenecks within our organization1 2 3 4 5
Our organization utilizes a virtual network or VLANto connect end users 1 2 3 4 5
New locations or acquisitions are quickly assimilatedinto our IT infrastructure 1 2 3 4 5
The questions below relate to the FUNCTIONALITY OF APPLICATIONSwithin your organization STRONGLY STRONGLY
DISAGREE AGREEszlig szlig
The applications used in our organization are designedto be reusable 1 2 3 4 5
Reusable software modules are widely used in newsystems development 1 2 3 4 5
End users utilize object-oriented tools to create theirown applications 1 2 3 4 5
200 BYRD AND TURNER
IT personnel utilize object-oriented technologies tominimize the development time for new applications 1 2 3 4 5
Legacy systems within our organization restrict thedevelopment of new applications1 2 3 4 5
Data processing (eg batch job key entry time etc)does NOT restrict normal business operationsor functions 1 2 3 4 5
We have a backlog of IT design work for newapplications 1 2 3 4 5
Our organization uses enterprise-wide applicationsoftware 1 2 3 4 5
The questions below relate to IT COMPATIBILITY within your organizationSTRONGLY STRONGLYDISAGREE AGREE
szlig szligRemote branch and mobile offices do not have to
perform any additional steps or procedures toaccess data from the home or central office 1 2 3 4 5
End users throughout the organization utilize acommon operating system (eg UNIX OS2) 1 2 3 4 5
Software applications can be easily transported andused across multiple platforms 1 2 3 4 5
Our organization offers a wide variety of types ofinformation to end users (eg multimedia)1 2 3 4 5
Our user interfaces provide transparent access to allplatforms and applications 1 2 3 4 5
Data received by our organization from electroniclinks (eg EDI EFT) are easily interpretable 1 2 3 4 5
The rapidity of IT change (eg revision level release)in our organization is high 1 2 3 4 5
Information is shared seamlessly across ourorganization regardless of the location 1 2 3 4 5
Our organization provides multiple interfaces or entrypoints (eg Web access) for external end users 1 2 3 4 5
The questions below relate to the DATA MANAGEMENT within yourorganization STRONGLY STRONGLY
DISAGREE AGREEszlig szlig
Our organization utilizes online analyticalprocessing (OLAP) 1 2 3 4 5
Our corporate database is able to communicatethrough many different protocols (eg SQL ODB) 1 2 3 4 5
MEASURING THE FLEXIBILITY OF INFORMATION TECHNOLOGY INFRASTRUCTURE 201
Mobile users have ready access to the same data usedat desktops1 2 3 4 5
A common view of our organizationrsquos customer isavailable to everyone in the organization 1 2 3 4 5
Our organization easily adapts to various vendorsrsquo data-base management systems protocols and standards 1 2 3 4 5
Data captured in one part of our organization areimmediately available to everyone in theorganization1 2 3 4 5
Our IT organization handles variances in corporatedata formats and standards 1 2 3 4 5
Data rules and relations (eg tax regulations) are hardcoded into applications 1 2 3 4 5
The questions below relate to the IT PERSONNEL within your organizationSTRONGLY STRONGLYDISAGREE AGREE
szlig szligOur IT personnel are knowledgeable about the key
success factors that must go right if ourorganization is to succeed 1 2 3 4 5
Our IT provides unique channels to suppliers orcustomers that are difficult for competitors toreplicate 1 2 3 4 5
Our IT personnel are encouraged to learn newtechnologies 1 2 3 4 5
Our IT personnel closely follow the trends in currenttechnologies 1 2 3 4 5
Very little backlog of work exists for IT personnel 1 2 3 4 5Investments in IT are best described as long term and
consistent 1 2 3 4 5Our organization often uses IT as a component for an
information-based innovation 1 2 3 4 5The strategies of the IT group and our organizationrsquos
strategies are well aligned 1 2 3 4 5Our IT personnel understand our organizationrsquos
polices and plans 1 2 3 4 5Our IT personnel understand the business
environments they support 1 2 3 4 5Our IT personnel are encouraged to learn about
business functions 1 2 3 4 5Our IT personnel are able to interpret business
problems and develop appropriate technicalsolutions 1 2 3 4 5
202 BYRD AND TURNER
Our IT personnel are knowledgeable about businessfunctions1 2 3 4 5
Our IT personnel are knowledgeable about theenvironmental constraints within which theorganization operates (eg government regulationcompetition) 1 2 3 4 5
Our IT personnel are free to assist end users as theydeem necessary 1 2 3 4 5
Our IT personnel are knowledgeable about ourorganizationrsquos product deliverylogistics systemmethodology (eg KANBAN JIT continuousoperation) 1 2 3 4 5
Problem resolution between IT and business units isidentified as a specific job task in our organization1 2 3 4 5
Our IT personnel are self-directed and proactive 1 2 3 4 5Our IT personnel are very capable in teaching others 1 2 3 4 5Our IT personnel have the ability to plan organize
and lead projects 1 2 3 4 5Our IT personnel have the ability to plan and execute
work in a collective environment 1 2 3 4 5Our IT personnel have the ability to accomplish
multiple assignments 1 2 3 4 5Our IT personnel work well in cross-functional teams
addressing business problems 1 2 3 4 5Our IT personnel have the ability to work cooperatively
in a project team environment1 2 3 4 5Our IT personnel have the ability to work closely
with clients and customers 1 2 3 4 5Our IT personnel have the ability to write clear concise
and effective memos reports and documentation 1 2 3 4 5Our IT personnel have the ability to develop and deliver
informative and persuasive presentations 1 2 3 4 5Our IT personnel are cross-trained to support other
IT services outside their primary knowledge domain(eg programmers trained to supporttelecommunications) 1 2 3 4 5
Our IT personnel are skilled in multiple programminglanguages 1 2 3 4 5
Our IT personnel are skilled in multiple types ofdatabases (eg network relational object-oriented) 1 2 3 4 5
Our IT personnel are skilled in multiple-structuredprogramming CASE methods or tools 1 2 3 4 5
Our IT personnel are skilled in multiple mainframecomputer operating systems 1 2 3 4 5
MEASURING THE FLEXIBILITY OF INFORMATION TECHNOLOGY INFRASTRUCTURE 203
Our IT personnel are skilled in multiplemicrocomputer operating systems 1 2 3 4 5
Our IT personnel are skilled in expert systems orartificial intelligence 1 2 3 4 5
Our IT personnel are skilled in decision supportsystems 1 2 3 4 5
Our IT personnel are competent in managing thedevelopment life cycle of projects 1 2 3 4 5
Our IT personnel are skilled in distributed processingor distributed computing 1 2 3 4 5
Our IT personnel are skilled in network managementand maintenance 1 2 3 4 5
Our IT personnel are skilled in developingWeb-based applications 1 2 3 4 5
Our IT personnel are skilled in hardware diagnosisand maintenance 1 2 3 4 5
Our IT personnel are skilled in data warehousingmining or marts 1 2 3 4 5
The questions below relate to the COMPETITIVE STATUS of yourorganization STRONGLY STRONGLY
DISAGREE AGREEszlig szlig
In our organization IT reduces the cost oftransforming material inputs into customerdeliverable outputs (eg manufacturingtechnologies) 1 2 3 4 5
In our organization IT reduces the cost of receivingand warehousing product inputs(eg material handling)1 2 3 4 5
In our organization IT reduces the cost of collectingstoring and distributing products(eg order processing scheduling) 1 2 3 4 5
In our organization IT reduces the cost of providingservice to maintain or enhance the valueof the product 1 2 3 4 5
In our organization IT applications assist in reducingthe cost of recruiting hiring and trainingorganizational personnel 1 2 3 4 5
In our organization IT reduces the cost of generalmanagement activities (eg planningaccounting finance) 1 2 3 4 5
In our organization IT reduces the cost of coordinatingactivities (eg purchasing marketing sales) 1 2 3 4 5
204 BYRD AND TURNER
In our organization IT assists the activity of monitoringthe use of resources (eg tracking power utilization) 1 2 3 4 5
In our organization IT assists the activity of upgradinga resource (eg adding an additional production) 1 2 3 4 5
In our organization IT assists the activity of transferringor disposing of a resource 1 2 3 4 5
In our organization IT assists the activity of evaluatingthe overall effectiveness or usefulness of a resource 1 2 3 4 5
In our organization IT applications assist in theordering or request process for a resource 1 2 3 4 5
In our organization IT applications assist in thephysical acquisition of a resource(eg remote power switching) 1 2 3 4 5
In our organization IT applications assist in verifyingthat the resource meets specifications(eg error control) 1 2 3 4 5
Our organization would incur significant cost increasesif we changed to alternate suppliers 1 2 3 4 5
IT assists our organizationrsquos ability to threatensuppliers and customers with vertical integration(eg assimilate external functions) 1 2 3 4 5
IT assists in our organizationrsquos ability to evaluatevarious suppliers and select the mostappropriate supplier 1 2 3 4 5
IT assists in our organizationrsquos ability to evaluate andchoose the most appropriate customers 1 2 3 4 5
Our customers would incur significant cost increasesif they were to change to alternate suppliers1 2 3 4 5
Our customers would incur significant costs in locatingalternate suppliers 1 2 3 4 5
Our organizationrsquos market position is such thatcompetitors are forced to adopt less favorablepostures 1 2 3 4 5
Our organization is protected from imitation byinstitutional barriers (eg patents copyrights) 1 2 3 4 5
Our organization has influenced the development oftechnical standards and practices in the industry 1 2 3 4 5
The strategies of our IT group are well aligned withour organizationrsquos marketing policies and practices 1 2 3 4 5
Our top management is involved in and supports theIT system and applications 1 2 3 4 5
Our organization has the ability to continuouslyinnovate and enhance IT applications 1 2 3 4 5
Our organization is driven by IT innovations1 2 3 4 5
MEASURING THE FLEXIBILITY OF INFORMATION TECHNOLOGY INFRASTRUCTURE 205
Our organization ignores the enabling impact offeredby IT innovations 1 2 3 4 5
Our IT planning is most always driven bylocal department requirements 1 2 3 4 5
Our IT planning is most always driven byshort-term functional request 1 2 3 4 5
The level of information intensity found within ourorganization is extremely low 1 2 3 4 5
Our organization utilizes IT to widen the array ofproducts without increasing costs 1 2 3 4 5
The IT infrastructure in the organization would bedifficult and expensive for rivals to duplicate 1 2 3 4 5
The questions below relate to the LEVEL OF INVESTMENT within yourorganization when compared to competitors
MUCH MUCHLOWER HIGHER
szlig szligOur organizationrsquos level of investment in
data management 1 2 3 4 5Our organizationrsquos level of investment in
IT compatibility 1 2 3 4 5Our organizationrsquos level of investment in
IT application functionality 1 2 3 4 5Our organizationrsquos level of investment in
IT connectivity 1 2 3 4 5Our organizationrsquos level of investment in
IT personnel technical skills 1 2 3 4 5Our organizationrsquos level of investment in
IT personnel management skills 1 2 3 4 5Our organizationrsquos level of investment in
IT personnel interpersonal skills 1 2 3 4 5Our organizationrsquos level of investment in IT personnel
business functional knowledge 1 2 3 4 5Our organizationrsquos level of investment in the
technology management skills of IT personnel 1 2 3 4 5
DEMOGRAPHICS (Please tell us a little about yourself and yourbackground)Your job title is THORN ________________
At what level THORN Executive___ Middle Management___ Professional___
Your years experience in this job THORN ____ Your years with this organization THORN ____
Your years experience in this field THORN ____
206 BYRD AND TURNER
Number of employees in your company THORN
Less than 50___ 50ndash250___ 251ndash1000___ 1001ndash5000___ Over 5000 ___
Company gross revenue last fiscal year (in millions) THORN
under $50___ $50ndash$250___ $251ndash$1000___ $1001ndash$5000___ Over $5000___
To whom does the top information services executive report THORN
Administrative Vice President___ Controller Finance VP___
President General Manager___ (other)_________________
PLEASE CHECK THE PRIMARY BUSINESS ACTIVITY OFszlig YOUR COMPANY BELOW szlig
__ agriculture __ banking __ business services __ communications__ construction __ education __ finance __ government__ health services __ insurance __ investment __ legal__ manufacturing __ mining __ real estate __ retail__ transportation __ utilities __ wholesale (other)__________
THANK YOU FOR YOUR PARTICIPATIONPLEASE RETURN IN THE PRE-PAID ENVELOPE
Appendix B Confirmatory Factor Results for Competitive Advantage
Items for the factors for Investment in Information Technology
The questions below relate to the Level of Investment within your organization com-pared to competitors (anchored on a five-point Likert scale of ldquomuch lowerrdquo andldquomuch higherrdquo)
Technology(1) Our organizationrsquos level of investment in data management(2) Our organizationrsquos level of investment in IT compatibility(3) Our organizationrsquos level of investment in application functionality
Personnel(1) Our organizationrsquos level of investment in IT personnel management skills(2) Our organizationrsquos level of investment in IT personnel interpersonal skills(3) Our organizationrsquos level of investment in IT personnel business functional
knowledge(4) Our organizationrsquos level of investment in the technology management skills of
IT personnel
MEASURING THE FLEXIBILITY OF INFORMATION TECHNOLOGY INFRASTRUCTURE 207
Goodness-of-Fit Indicators for the two factors for Level of InvestmentDegrees of Freedom 10Chi-Square Statistic 49p-Value 000Adjusted Chi-Square 49Goodness-of-Fit Indicator 094RMSR 006Note All the CAPITA items were measured on a five-point Likert scale anchored
with ldquostrongly disagreerdquo and ldquostrongly agreerdquo
Items for the CAPITA factor Support Activity Efficiency(1) In our organization IT applications assist in reducing the cost of recruiting
hiring and training organizational personnel(2) In our organization IT reduces the cost of general management activities (eg
planning accounting finance)(3) In our organization IT reduces the cost of coordinating activities (eg
purchasing marketing sales)
Goodness-of-Fit Indicators for CAPITA factor Support Activity EfficiencyDegrees of Freedom 8Chi-Square Statistic 2p-Value 000Adjusted Chi-Square 4Goodness-of-Fit Indicator 098RMSR 005
Items for the CAPITA factor Primary Activity Efficiency(1) In our organization IT reduces the cost of transforming material inputs into
customer deliverable outputs (eg manufacturing technologies)(2) In our organization IT reduces the cost of collecting storing and distributing
products (eg material handling)(3) In our organization IT reduces the cost of collecting storing and distributing
products (eg order processing scheduling)(4) In our organization IT application reduces the cost of providing service to
maintain or enhance the value of the product
Goodness-of-Fit Indicators for CAPITA factor Primary Activity EfficiencyDegrees of Freedom 13Chi-Square Statistic 2p-Value 000Adjusted Chi-Square 65Goodness-of-Fit Indicator 097RMSR 006
208 BYRD AND TURNER
Items for the CAPITA factor Resource Management Functionality(1) In our organization IT assists the activity of monitoring the use of resources
(eg tracking power utilization)(2) In our organization IT assists the activity of upgrading a resource(3) In our organization IT assists the activity of transferring or disposing of a
resource
Goodness-of-Fit Indicators for CAPITA factor Resource ManagementFunctionality
Degrees of Freedom 8Chi-Square Statistic 2p-Value 000Adjusted Chi-Square 4Goodness-of-Fit Indicator 098RMSR 005
Items for the CAPITA factor Threat(1) In our organization IT applications assist in verifying that the resource meets
specifications (eg error control)(2) Our organization would incur significant cost increases if we changed to
alternative suppliers(3) IT assists in our organizationrsquos ability to threaten suppliers and customers with
vertical integration (eg assimilate external functions)(4) IT assists in our organizationrsquos ability to evaluate and choose the most
appropriate customers
Goodness-of-Fit Indicators for CAPITA factor ThreatDegrees of Freedom 9Chi-Square Statistic 2p-Value 000Adjusted Chi-Square 45Goodness-of-Fit Indicator 098RMSR 005
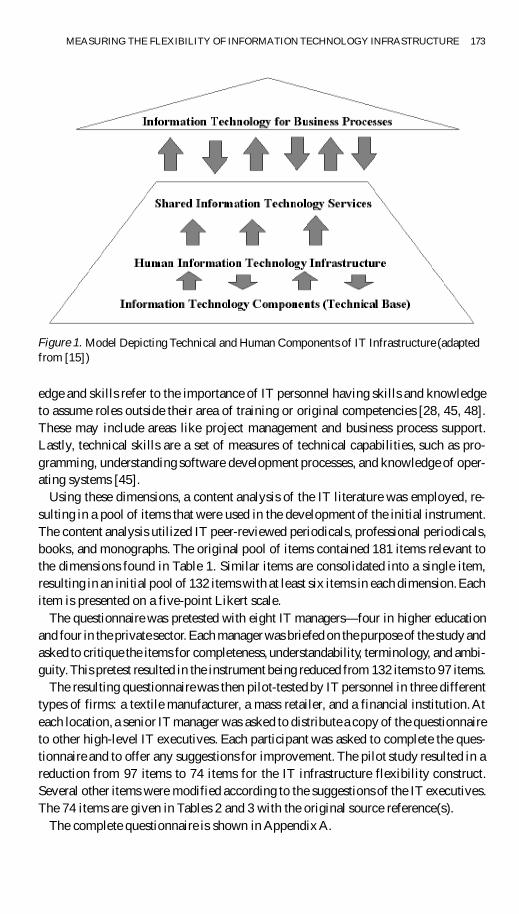
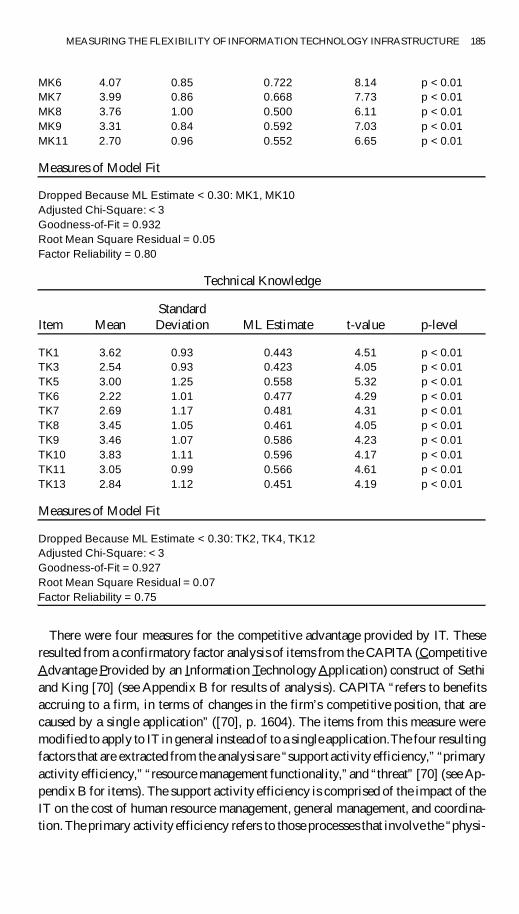
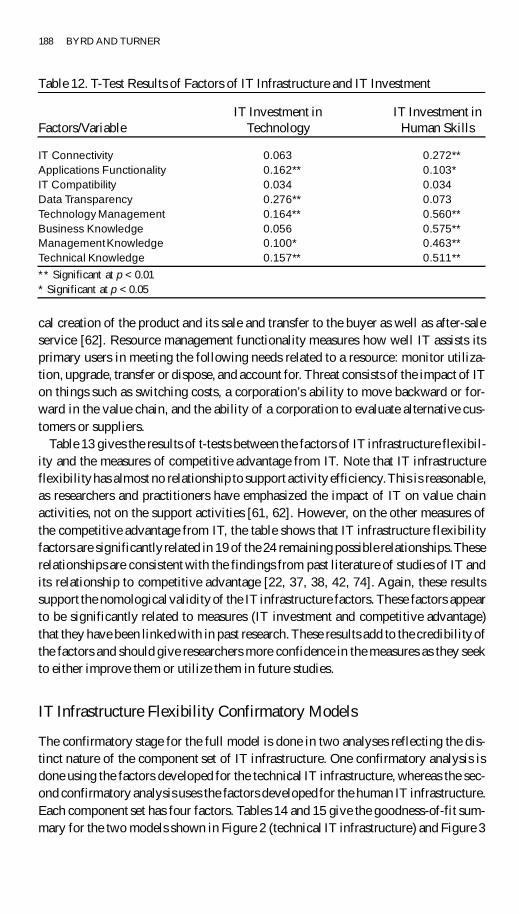
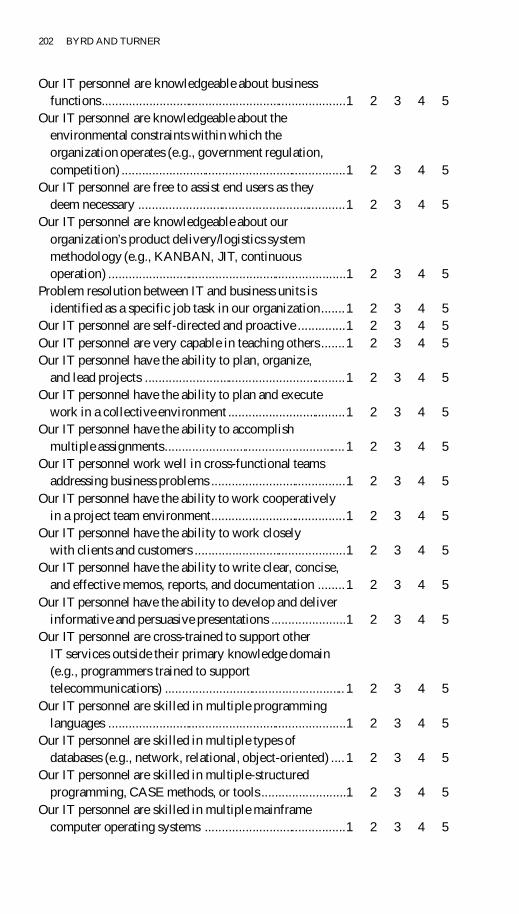