Measuring Storage Performance in the Cloud - USENIX · Measuring Storage Performance in the Cloud...
23
27 th Large Installation System Administration Conference November 3–8, 2013 • Washington, D.C. Measuring Storage Performance in the Cloud Jeff Darcy GlusterFS & Red Hat
Transcript of Measuring Storage Performance in the Cloud - USENIX · Measuring Storage Performance in the Cloud...

27th Large Installation System Administration Conference
November 3–8, 2013 • Washington, D.C.
Measuring Storage Performance in the Cloud
Jeff Darcy
GlusterFS & Red Hat

27th Large Installation System Administration Conference
November 3–8, 2013 • Washington, D.C.
Overview
Performance
Cloud
Storage
Cloud Storage Performance 2

27th Large Installation System Administration Conference
November 3–8, 2013 • Washington, D.C.
Cloud Storage Performance 3
Performance

27th Large Installation System Administration Conference
November 3–8, 2013 • Washington, D.C.
Types of Performance
Bandwidth Throughput Latency Latency Variation
Network Gb/second PPS Milliseconds (average)
99th percentile
Storage GB/second IOPS Milliseconds (average)
99th percentile
Often improves with thread count
Often deteriorates with thread count
Cloud Storage Performance 4

27th Large Installation System Administration Conference
November 3–8, 2013 • Washington, D.C.
Tail at Scale = Fail
• If a request hits ten systems, with 10x latency 1% of the time, average latency doubles
Cloud Storage Performance 5
wasted time

27th Large Installation System Administration Conference
November 3–8, 2013 • Washington, D.C.
Aggregating Data
Global start/end = 200MB/s = WRONG
Additive = 183MB/s = WRONG
Cloud Storage Performance 6

27th Large Installation System Administration Conference
November 3–8, 2013 • Washington, D.C.
Aggregating Data
Stonewalling = 243MB/s = REALLY WRONG
Cloud Storage Performance 7
27th Large Installation System Administration Conference
November 3–8, 2013 • Washington, D.C.
Aggregating Data
• If your data is “X per second” then measure per second
0
2000
4000
6000
8000
10000
12000
14000
1 2 3 4 5 6 7 8 9 10 11 12 13 14 15 16 17 18 19 20
client9
client8
client7
client6
client5
client4
client3
client2
client1
client0
Staircase
Stragglers
Cloud Storage Performance 8

27th Large Installation System Administration Conference
November 3–8, 2013 • Washington, D.C.
Performance Storage
Cloud Storage Performance 9

27th Large Installation System Administration Conference
November 3–8, 2013 • Washington, D.C.
Storage Performance Factors
Small requests vs.
large requests
Data vs.
metadata
Cached/buffered vs.
synchronous
Read vs.
write
Cloud Storage Performance 10

27th Large Installation System Administration Conference
November 3–8, 2013 • Washington, D.C.
Data Testing: iozone • Can test block and file storage
• Data only
– Sequential/random, O_SYNC/O_DIRECT, AIO, …
– Could be better w.r.t. spatial distribution
– Limited support for cluster testing
• “Stonewalling” by default
• Zillions of command-line options
• fio is very similar Cloud Storage Performance 11

27th Large Installation System Administration Conference
November 3–8, 2013 • Washington, D.C.
iozone options -c include close -e include fsync
-o use O_SYNC -O report ops/second
-r record size -s file size
-l thread count -C show child stats
-i 0 sequential write
-i 1 sequential read
-I 9 random pwrite
+ 67 more
Cloud Storage Performance 12

27th Large Installation System Administration Conference
November 3–8, 2013 • Washington, D.C.
Sample iozone output
Children see throughput for 4 rewriters = 49124.63 ops/sec Parent sees throughput for 4 rewriters = 47810.32 ops/sec Min throughput per process = 10874.55 ops/sec Max throughput per process = 13628.46 ops/sec Avg throughput per process = 12281.16 ops/sec Min xfer = 831.00 ops Child[0] xfer count = 1024.00 ops, Throughput = 13628.46 ops/sec Child[1] xfer count = 950.00 ops, Throughput = 12620.25 ops/sec Child[2] xfer count = 920.00 ops, Throughput = 12001.36ops/sec Child[3] xfer count = 831.00 ops, Throughput = 10874.55 ops/sec
Cloud Storage Performance 13
27th Large Installation System Administration Conference
November 3–8, 2013 • Washington, D.C.
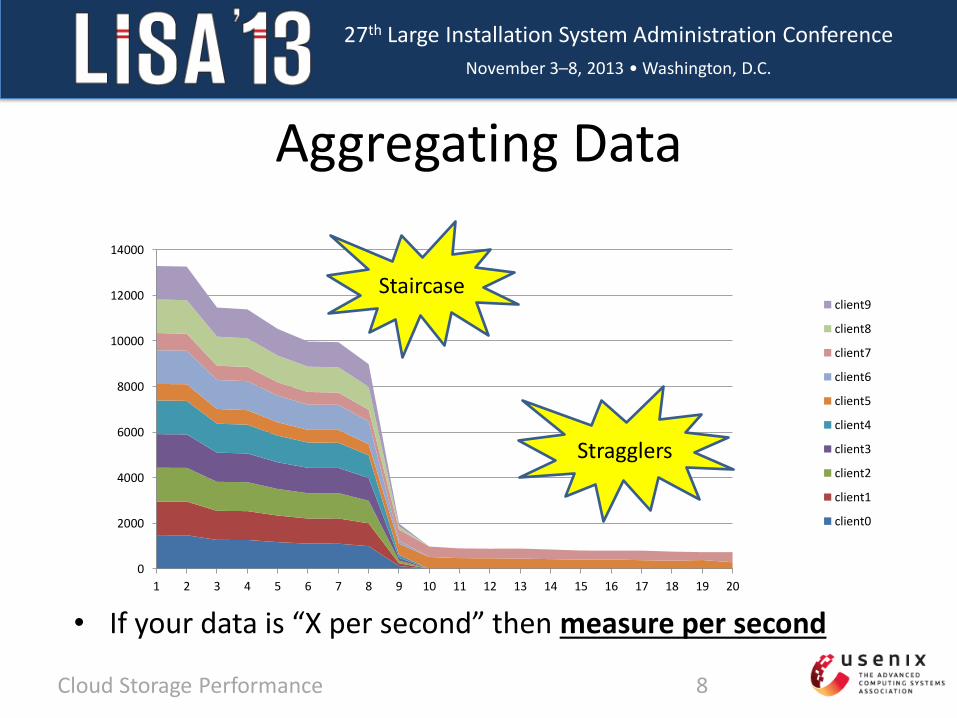
Metadata Testing
• Filebench
– Workload Model Language
– both data and synchronization
• Dbench
– trace replay
• Somebody really needs to do better!
Cloud Storage Performance 14

27th Large Installation System Administration Conference
November 3–8, 2013 • Washington, D.C.
Object Testing
• COSBench
– Object read, write, delete
– Java + XML(ish) + Windows-style .ini files
– Parallel and even distributed
– still…
• Somebody needs to do much better!
Cloud Storage Performance 15

27th Large Installation System Administration Conference
November 3–8, 2013 • Washington, D.C.
Performance
Cloud
Storage
Cloud Storage Performance 16

27th Large Installation System Administration Conference
November 3–8, 2013 • Washington, D.C.
Noisy Neighbors
0
2000
4000
6000
8000
10000
12000
14000
16000
18000
IOPS
Cloud Storage Performance 17

27th Large Installation System Administration Conference
November 3–8, 2013 • Washington, D.C.
Performance Distributions
0
2000
4000
6000
8000
10000
12000
14000
16000
18000
1 4 7
10 13 16 19 22 25 28 31 34 37 40 43 46 49 52 55 58 61 64 67 70 73 76 79 82 85 88 91 94 97
100
Amazon
Rackspace
Host Virtual
Cloud Storage Performance 18
27th Large Installation System Administration Conference
November 3–8, 2013 • Washington, D.C.
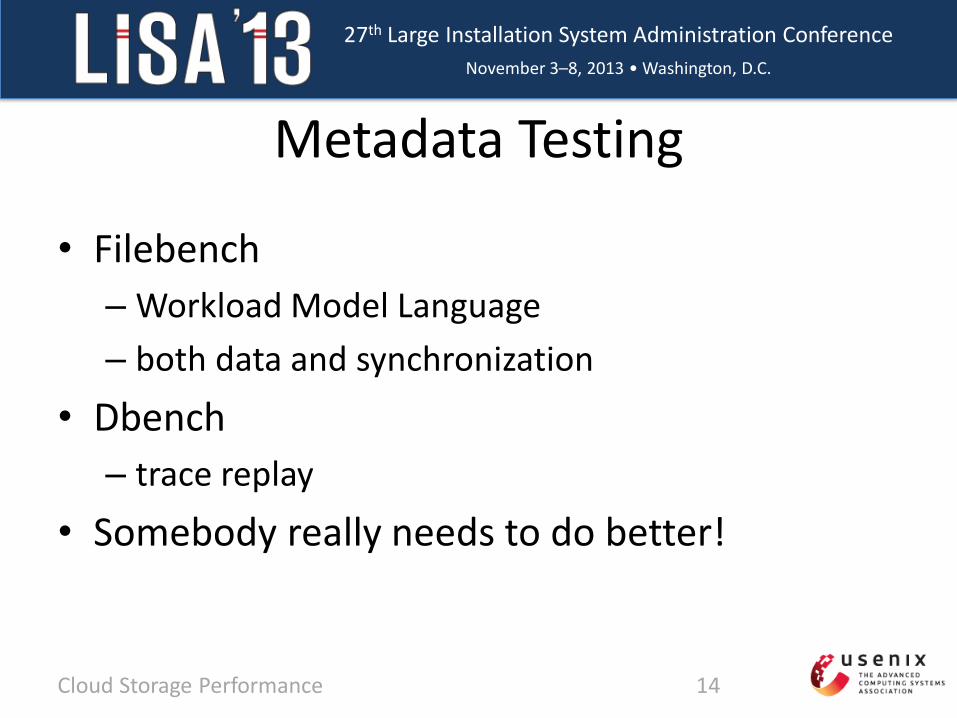
Performance Ratios
0
50
100
150
200
250
0 500 1000 1500 2000 2500 3000 3500 4000 4500 5000
Ne
two
rk (
MB
/s)
Disk (4KB writes/s)
Chart Title
Amazon
Rackspace
Cloud Storage Performance 19
27th Large Installation System Administration Conference
November 3–8, 2013 • Washington, D.C.
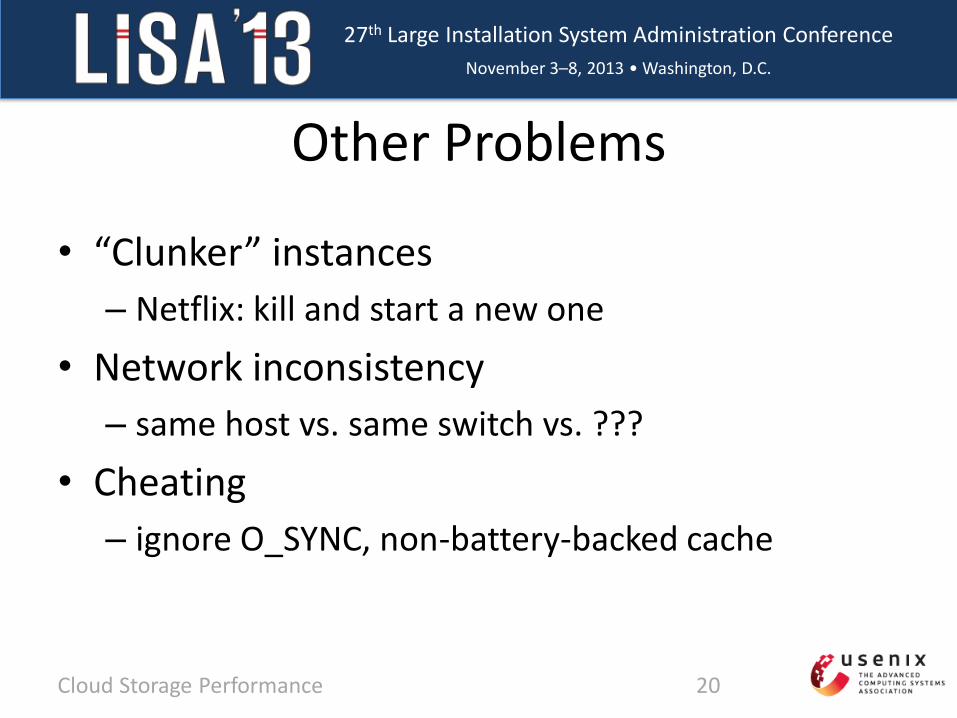
Other Problems
• “Clunker” instances
– Netflix: kill and start a new one
• Network inconsistency
– same host vs. same switch vs. ???
• Cheating
– ignore O_SYNC, non-battery-backed cache
Cloud Storage Performance 20

27th Large Installation System Administration Conference
November 3–8, 2013 • Washington, D.C.
Conclusions
• Massive variability is what makes this hard
– test many types, many instances, many times
– reduce other variables (e.g. workloads)
– automate, automate, automate
• Think in terms of probabilities instead of averages
• Use mathematical models or simulation to determine appropriate “insurance level”
Cloud Storage Performance 21

27th Large Installation System Administration Conference
November 3–8, 2013 • Washington, D.C.
Modeling Example
• Goal: 99% probability of 100K IOPS
• Same data as above
Provider Ideal From Model Ratio
Amazon 7 13 1.86
Rackspace 14 28 2.00
Host Virtual 8 11 1.38
http://hekafs.org/index.php/2013/05/performance-variation-in-the-cloud/
Cloud Storage Performance 22
27th Large Installation System Administration Conference
November 3–8, 2013 • Washington, D.C.
Thank You!