Measuring Protein-DNA interactions ... - DTU … · Measuring Protein-DNA interactions using...
43
Measuring Protein-DNA interactions using Chromatin Immunoprecipitation and NGS (ChIP-Seq)
Transcript of Measuring Protein-DNA interactions ... - DTU … · Measuring Protein-DNA interactions using...

Measuring Protein-DNA interactions using Chromatin Immunoprecipitation and NGS (ChIP-Seq)

2 Introduction to Systems Biology
How is Biological Complexity Achieved?
Mediated by Transcription Factors (TFs)
3 Introduction to Systems Biology
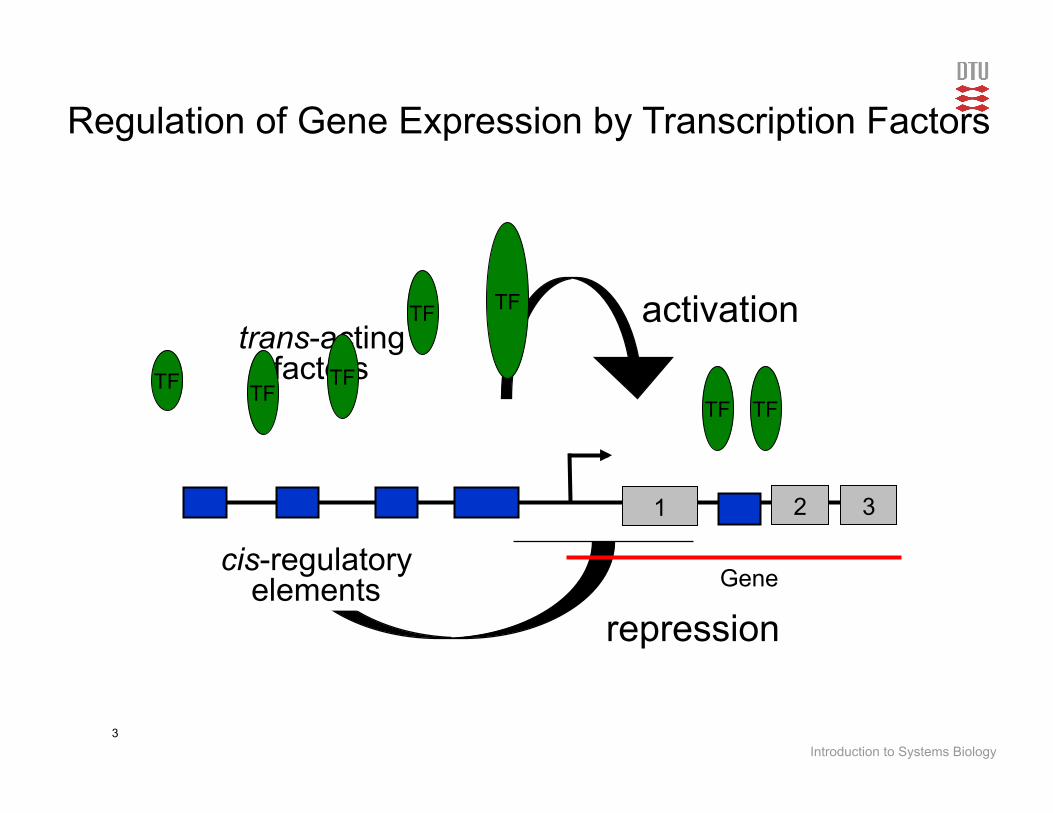
activation
repression
1 2 3
cis-regulatory elements
TF
trans-acting factors
TF TF
TF TF TF
TF
Regulation of Gene Expression by Transcription Factors
Gene

4 Introduction to Systems Biology
“…how these TFs orchestrate the expression of thousands of genes in a genome to create such a spectrum of biological diversity remains a mystery…” Several methods have been developed in the last several years to study TF-DNA interactions and to understand the function of TFs.
The big point is:
5 Introduction to Systems Biology
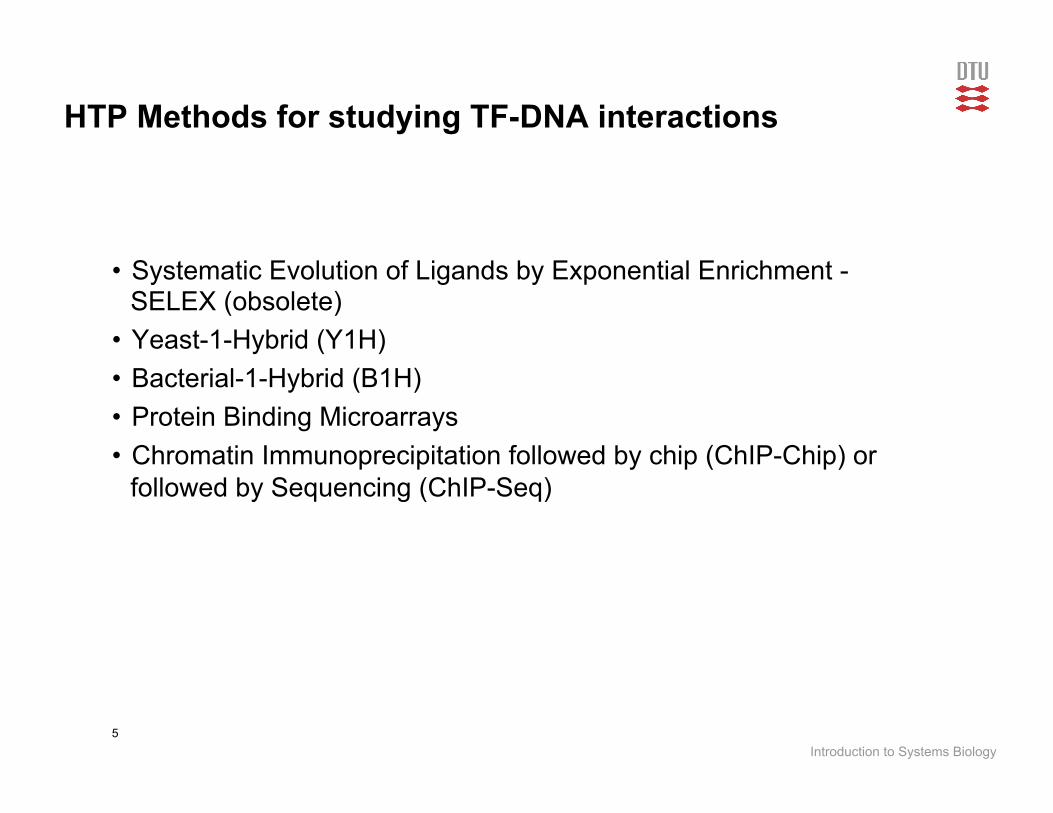
HTP Methods for studying TF-DNA interactions
• Systematic Evolution of Ligands by Exponential Enrichment - SELEX (obsolete)
• Yeast-1-Hybrid (Y1H) • Bacterial-1-Hybrid (B1H) • Protein Binding Microarrays • Chromatin Immunoprecipitation followed by chip (ChIP-Chip) or
followed by Sequencing (ChIP-Seq)

6 Introduction to Systems Biology
How does ChIP-Seq work?
TF is specifically bound to its cognate DNA sequence

7 Introduction to Systems Biology
At any given time, my TF is bound in many locations

8 Introduction to Systems Biology
Chromatin IP

9 Introduction to Systems Biology
Chromatin IP
300 bp

10 Introduction to Systems Biology
Next Generation Sequencing
Let’s see this in action
11 Introduction to Systems Biology
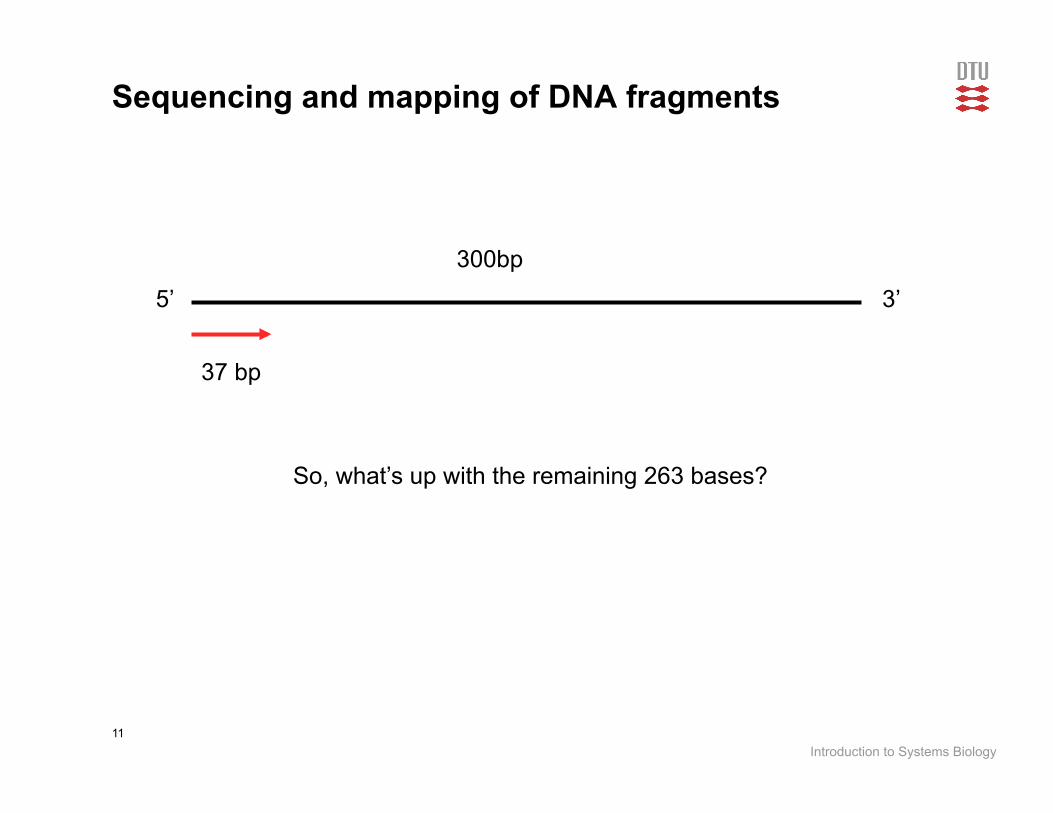
Sequencing and mapping of DNA fragments
5’ 3’
300bp
37 bp
So, what’s up with the remaining 263 bases?

12 Introduction to Systems Biology
Sequencing and mapping of DNA fragments
Chromosome
300bp
But we only have 37bp of each 300 bp!!!

13 Introduction to Systems Biology
ChIP-Seq

14 Introduction to Systems Biology
ChIP-Seq allows for the analysis of more events
• Since we do not use a pre-defined set of sequences to design and investigate a microarray, we can use ChIP-Seq to study many different types of protein-DNA interactions.
• Additionally, modifications of ChIP have been designed to study DNA modifications such as DNA methylation, using met-DNA binding proteins. These methods are known as:
– MRE-Seq (Methylation-sensitive Restriction Enzyme) – MeDIP-Seq (Methylated DNA Immuno Precipitation)

15 Introduction to Systems Biology
Using ChIP-Seq to understand transcriptional processes

16 Introduction to Systems Biology
Pol II => transcriptional events

17 Introduction to Systems Biology
Pol II pausing and release factors => dynamics

18 Introduction to Systems Biology
Super elongation complex => dynamics

19 Introduction to Systems Biology
Histone modifications => Epigenetics

20 Introduction to Systems Biology
Histone modifications => Epigenetics
Histone Type of
modification H3K4 H3K9 H3K14 H3K27 H3K79 H4K20 H2BK5
mono-
methylation activation activation activation activation activation activation
di-methylation repression repression activation
tri-methylation activation repression repression activation,
repression repression
acetylation activation activation
H3K4me3 is found in actively transcribed promoters, particularly just after the transcription start site.
H3K9me3 is found in constitutively repressed genes.
H3K27me is found in facultatively repressed genes.
H3K36me3 is found in actively transcribed gene bodies.
H3K9ac is found in actively transcribed promoters.
H3K14ac is found in actively transcribed promoters.

21 Introduction to Systems Biology
Mediator and Cohesin complexes => Chromatin structure

22 Introduction to Systems Biology
Polycomb and Trithorax => repressed/active promoters

23 Introduction to Systems Biology
Scalechr17:
User Trackjunctions
RepeatMasker
2 kb syboss_mm935,641,500 35,642,000 35,642,500 35,643,000 35,643,500 35,644,000 35,644,500 35,645,000 35,645,500 35,646,000 35,646,500 35,647,000 35,647,500 35,648,000 35,648,500 35,649,000 35,649,500
User Supplied TrackTopHat junctionsRefSeq Genes
Repeating Elements by RepeatMaskerMouse mRNAs from GenBank
RNA-seq Xiao2012
Pol_II
Poll II Pause
Poll II Pause
Poll II Pause
Super Elongation Complex
Super Elongation Complex
Super Elongation Complex
Transcription Factors
Mediator
Mediator
Cohesin
Cohesin
Cohesin
Cohesin
Transcription Factors
Transcription Factors
Transcription Factors
Transcription Factors
Transcription Factors
Transcription Factors
Transcription Factors
Transcription Factors
Transcription Factors
Transcription Factors
Transcription Factors
Transcription Factors
Transcription Factors
Transcription Factors
Transcription Factors
Transcription Factors
Transcription Factors
Transcription Factors
Transcription Factors
TF Co-Factors
Chromation Organisation and Remodeling
Chromation Organisation and Remodeling
Histone Modifiers
Histone Modifiers
Chromatin State Xiao2012
Chromatin State Xiao2012
Chromatin State Xiao2012
Chromatin State Xiao2012
Chromatin State Xiao2012
Chromatin State Xiao2012
Chromatin State Xiao2012
Chromatin State Xiao2012
Chromatin State Xiao2012
Trithorax
Trithorax
Trithorax
Trithorax
Polycomb
Pou5f1Pou5f1
Tcf19Tcf19Tcf19
AB375278M34381
AK145321BC068268AB221654
X52437AB375276
AB375269AB375270AB375272AB375271AB375273
AB375277HM346525HM346526
AB375274AB375275
BC004617AK004231AK088479AK077414AK078697
AK207827
d0_RNA_seq_1_Xiao2012
197 _
1 _
Pol_II_0hr_Lin2011
112 _
1 _
Spt5_Rahl2010
93 _
1 _
NelfA_Rahl2010
145 _
1 _
Ctr9_Rahl2010
44 _
1 _
AFF4_0hr_Lin2011
73 _
1 _
Cdk9_0hr_Lin2011
23 _
1 _
ELL2_0hr_Lin2011
77 _
1 _
TAF1_Xiao2012
144 _
1 _
Med1_Kagey2010
104 _
1 _
Med12_Kagey2010
161 _
1 _
Nipbl_Kagey2010
142 _
1 _
Smc1_Kagey2010
145 _
1 _
Smc3_Kagey2010
154 _
1 _
Rad21_Nitzsche2011
201 _
1 _
Oct4
50 _
1 _
Nanog_Chen2008
69 _
1 _
Sox2_Chen2008
68 _
1 _
Essrb_Chen2008
57 _
1 _
Tcfcp2l1_Chen2008
144 _
1 _
Klf4_Chen2008
63 _
1 _
CTCF_Chen2008
37 _
1 _
cMyc_Chen2008
39 _
1 _
E2f1_Chen2008
131 _
1 _
iFlag_Hoxc9_d5_Mazzoni2011
297 _
1 _
Rfx1_np_Creyghton2010
296 _
1 _
REST_Rahl2011
155 _
1 _
CTCF_Handoko2011
180 _
1 _
Cdx2_Nishiyama2009
59 _
1 _
Olig2_d4_Mazzoni2011
183 _
1 _
Zfx1_Chen2008
69 _
1 _
n_Myc_Chen2008
45 _
1 _
iHoxc9_V5_Mazzoni2011
59 _
1 _
Stat3_Chen2008
58 _
1 _
MCAF1_Rahl2011
72 _
1 _
CHD7_Schnetz2010
75 _
1 _
Lamin_B_Handoko2011
239 _
1 _
p300_Schnetz2010
75 _
1 _
Eset_Yuan2009
70 _
1 _
d0_H3K27ac_Xiao2012
148 _
1 _
d0_H3K27me3_Xiao2012
198 _
1 _
d0_H3K36me3_Xiao2012
136 _
1 _
d0_H3K4me1_Xiao2012
128 _
1 _
d0_H3K4me2_Xiao2012
128 _
1 _
d0_H3K4me3_Xiao2012
369 _
1 _
d0_H2AZ_Xiao2012
206 _
1 _
MeDIP_seq_Xiao2012
255 _
1 _
MRE_seq_Xiao2012
12 _
1 _
Dpy_30_Jiang2011
212 _
1 _
Rbpp5_Ang2011
64 _
1 _
Wdr5_Ang2011
69 _
1 _
WDR5_FL_Ang2011
59 _
1 _
Ring1b_Rahl2011
123 _
1 _
All of these can be brought together to give us a complete picture

24 Introduction to Systems Biology

25 Introduction to Systems Biology

Analysing ChIP-Seq data

27 Introduction to Systems Biology
Analysis pipeline

28 Introduction to Systems Biology
Analysis pipeline

29 Introduction to Systems Biology
Analysis pipeline
Com
mon
to a
lmos
t all
NG
S p
ipel
ines
C
hIP
-Seq
sp
ecifi
c
sratoolkit
FastQC
fastx-toolkit
bowtie

30 Introduction to Systems Biology
Analysis pipeline
Autom
ated R
equires H
uman intervention

Alignment to genome
• As for any other NGS application, we need to align our reads to a base genome.
• ChIP-Seq uses bowtie
• For ChIP-Seq we only want uniquely mapped sequences and allowing up to 2 mismatches – Usual parameters are –m 1 –n 2 –e 70 –l 28

Peak calling!
• Mostly used algorithm is MACS (Model-based Analysis of ChIP-Seq) – http://liulab.dfci.harvard.edu/MACS/index.html
Simple description:
Usually stringent threshold required for low false discovery rates (FDRs) due to the correction for multiple testing

Peak calling!
– MACS allows for the calling of peaks using a background (control) track or against reactions performed in different conditions

Scalechr6:
CCDSEnsembl Genes
miRNAGap
Mouse mRNAs
100 kb122600000 122650000 122700000 122750000
Consensus CDSEnsembl GenesRefSeq Genes
MicroRNAs from miRBaseGap Locations
Mouse mRNAs from GenBankHEK4me3 - Marson2008
c-Myc - Chen008
Klf4 - Chen008
Sox2 - Chen2008
STAT3 - Chen2008
Zfx - Chen2008
H3K36me3 - Marson2008
H3K79me2 - Marson2008
Marson2008_macs14
Tcf3 - Marson2008
Suz12 - Marson2008
Suz12 - Chen2008
CTCF - Chen2008
E2f1 - Chen008
GFP - Chen2008
Nanog - Chen008
Oct4 - Chen2008
p300 - Chen2008
Smad - Chen2008
Tcfcp2I - Chen008
Fics2011_MeDIP-Seq
Fics2011_MeDIP-Seq
Fics2011_MeDIP-Seq
Fics2011_MeDIP-Seq
Fics2011_MeDIP-Seq
Fics2011_MeDIP-Seq
Fics2011_MeDIP-Seq
Fics2011_MeDIP-Seq
Fics2011_MeDIP-Seq
Fics2011_MeDIP-Seq
Fics2011_MeDIP-Seq
Fics2011_MeDIP-Seq
Fics2011_MeDIP-Seq
Fics2011_MeDIP-Seq
Fics2011_MeDIP-Seq
Fics2011_MeDIP-Seq
Fics2011_MeDIP-Seq
Fics2011_MeDIP-Seq
Fics2011_MeDIP-Seq
Fics2011_MeDIP-Seq
Fics2011_MeDIP-Seq
Fics2011_MeDIP-Seq
Fics2011_MeDIP-Seq
Fics2011_MeDIP-Seq
Fics2011_MeDIP-Seq
Fics2011_MeDIP-Seq
Fics2011_MeDIP-Seq
Fics2011_MeDIP-Seq
Fics2011_MeDIP-Seq
Fics2011_MeDIP-Seq
Fics2011_MeDIP-Seq
Fics2011_MeDIP-Seq
Fics2011_MeDIP-Seq
Fics2011_MeDIP-Seq
Fics2011_MeDIP-Seq
Fics2011_MeDIP-Seq
Fics2011_MeDIP-Seq
Fics2011_MeDIP-Seq
Fics2011_MeDIP-Seq
Fics2011_MeDIP-Seq
Fics2011_MeDIP-Seq
Fics2011_MeDIP-Seq
Fics2011_MeDIP-Seq
Fics2011_MeDIP-Seq
Fics2011_MeDIP-Seq
Fics2011_MeDIP-Seq
Fics2011_MeDIP-Seq
Fics2011_MeDIP-Seq
Fics2011_MeDIP-Seq
Fics2011_MeDIP-Seq
Fics2011_MeDIP-Seq
Apobec1Apobec1
Gdf3
Dppa3 NanogNanogpd
Slc2a3
HEK4me3
c-Myc
Klf4
Sox2
STAT3
Zfx
H3K36me3
H3K79me2217.431 _
0 _
Nanog_mES_rep2227.795 _
0.0007 _
Tcf3
Suz12
Suz12
CTCF
E2f1
GFP
Nanog
Oct4
p300
Smad
Tcfcp2I
s_2_1_J1_ES_hMeDIP_1
s_2_1_J1_ES_hMeDIP_2
s_2_1_Np95___ES_hMeDIP_2
s_3_1_Np95___ES_MeDIP_2
s_2_2_J1_ES_hMeDIP_1
s_2_2_J1_ES_hMeDIP_2
s_2_2_Np95___ES_hMeDIP_2
s_2_ES_J1_mRNA_Seq
s_3_1_J1_ES_MeDIP_2
s_3_2_J1_ES_MeDIP_2
s_3_1_pMEF_MeDIP
s_3_1_Tet1_Tet2_KD_ES_hMeDIP_1
s_3_2_Np95___ES_MeDIP_2
s_3_2_pMEF_MeDIP
s_3_2_Tet1_Tet2_KD_ES_hMeDIP_1
s_4_1_E14_ES_hMeDIP_2
s_4_1_Tet1_Tet2_KD_ES_hMeDIP_2
s_4_2_E14_ES_hMeDIP_1
s_4_2_E14_ES_hMeDIP_2
s_4_2_Tet1_Tet2_KD_ES_hMeDIP_2
s_4_Mock_KD_ES_J1_2_mRNA_Seq
s_3_Mock_KD_ES_J1_1_mRNA_Seq
s_6_Mock_KD_ES_J1_3_mRNA_Seq
s_4_Tet1_2_KD_ES_J1_1_mRNA_Seq
s_5_Tet_1_2_KD_ES_J1_2_mRNA_Seq
s_7_Tet_1_2_KD_ES_J1_3_mRNA_Seq
s_7_2_Tet1_KD_ES_MeDIP
s_5_1_E14_ES_MeDIP_1
s_5_1_E14_ES_MeDIP_2
s_5_1_Tet1_Tet2_KD_ES_MeDIP_2
s_5_2_E14_ES_MeDIP_1
s_5_2_E14_ES_MeDIP_2
s_6_1_E14_EB_hMeDIP_2
s_6_1_Tet1_KD_ES_hMeDIP
s_6_2_E14_EB_hMeDIP_1
s_6_2_E14_EB_hMeDIP_2
s_6_2_Tet1_KD_ES_hMeDIP
s_7_1_E14_EB_MeDIP_1
s_7_1_E14_EB_MeDIP_2
s_7_1_J1_ES_MeDIP_1
s_7_1_Np95___ES_MeDIP_1
s_7_1_Tet1_KD_ES_MeDIP
s_7_1_Tet1_Tet2_KD_ES_MeDIP_1
s_7_2_E14_EB_MeDIP_1
s_7_2_E14_EB_MeDIP_2
s_7_2_J1_ES_MeDIP_1
s_7_2_Np95___ES_MeDIP_1
s_7_2_Tet1_Tet2_KD_ES_MeDIP_1
s_8_1_pMEF_hMeDIP
s_8_2_Np95___ES_hMeDIP_1
s_8_2_pMEF_hMeDIP
WHAT DOES THIS ALL MEAN???

Downstream analysis: the biology!
- Having called the peaks, we need to find out what they are and how biologically relevant they are..
- We need to find the DNA motifs bound by the TF - We need to call the peaks: what genes might be regulated by the TF? - We need to compare / integrate various datasets to get the full story
- Many tools have been created for this, but I like Homer (Heinz S, Benner C, Spann N, Bertolino E et Mol Cell 2010 May 28;38(4):576-589.) http://biowhat.ucsd.edu/homer/ngs/index.html

36 Introduction to Systems Biology
Downstream analysis of processed tracks
• Homer can take macs14 output files (bed files) and perform several statistics and analysis functions:
– Motif finding – Gene Ontology enrichment analysis (GO, KEGG, Interpro, pfam, etc) – Peak association – Motif mapping on promoters – Statistics (heat-maps, histograms, etc)

37 Introduction to Systems Biology
Zfx
Oct-4 NanogSox-2
REST
Hoxc9
Olig2
Rfx1Essrb
Klf4
Stat3
Tcfcp2l1
cMyc
CTCF
nMyc
Motif finding

38 Introduction to Systems Biology
Peak identification: “closest annotation” PeakID Chr Start End Peak Score Annotation Distance to TSS Nearest PromoterID Nearest Unigene Nearest Refseq Nearest Ensembl Gene Name
MACS_peak_1 chr1 9738113 9738647 30.01 promoter-TSS (NM_173443) 83 NM_173443 Mm.440951 NM_173443 ENSMUSG00000045210 Vcpip1MACS_peak_2 chr1 9934163 9934369 31.27 promoter-TSS (NR_024067) -67 NR_024067 Mm.28311 NR_024067 Snhg6MACS_peak_3 chr1 10223144 10223424 31.27 promoter-TSS (NM_001102430) -533 NM_001102430 Mm.229141 NM_001102430 ENSMUSG00000067851 Arfgef1MACS_peak_4 chr1 14299912 14300325 31.13 5' UTR (NM_010164, exon 1 of 18) 162 NM_010164 Mm.250185 NM_010164 ENSMUSG00000025932 Eya1MACS_peak_5 chr1 15550790 15551134 31.27 intron (NM_001098528, intron 1 of 1) -244777 NM_009352 Mm.4306 NM_009352 ENSMUSG00000025925 Terf1MACS_peak_6 chr1 16231057 16231519 30.64 intron (NM_025303, intron 12 of 13) 135325 NM_133832 Mm.274376 NM_133832 ENSMUSG00000025921 Rdh10MACS_peak_7 chr1 16646897 16647322 31.01 promoter-TSS (NM_026456) -163 NM_026456 Mm.289248 NM_026456 ENSMUSG00000079658 Tceb1MACS_peak_8 chr1 18048238 18048692 30.72 Intergenic 78667 NM_030033 Mm.319913 NM_030033 ENSMUSG00000025774 Crisp4MACS_peak_9 chr1 28405286 28405514 31.27 Intergenic 431697 NM_001013750 Mm.214178 NM_001013750 ENSMUSG00000048411 Gm597MACS_peak_10 chr1 33545031 33545274 31.27 intron (NM_008922, intron 10 of 13) 181451 NM_008922 Mm.27705 NM_008922 ENSMUSG00000026134 Prim2MACS_peak_11 chr1 34542882 34543084 31.27 Intergenic -12292 NM_009355 Mm.10725 NM_009355 ENSMUSG00000026125 Prss39MACS_peak_12 chr1 36568483 36568781 31.27 promoter-TSS (NM_001039551) -89 NM_001039551 Mm.256323 NM_001039551 ENSMUSG00000001138 Cnnm3MACS_peak_13 chr1 36573340 36573846 30.25 intron (NM_053186, intron 1 of 7) 4872 NM_053186 Mm.256323 NM_001039551 ENSMUSG00000001138 Cnnm3MACS_peak_14 chr1 37042748 37042953 31.27 Intergenic -46478 NM_018872 Mm.186943 NM_018872 ENSMUSG00000026116 Tmem131MACS_peak_15 chr1 37509245 37509550 31.27 exon (NM_173870, exon 10 of 15) 22380 NM_026123 Mm.27404 NM_026123 ENSMUSG00000026111 Unc50MACS_peak_16 chr1 39106807 39107265 30.68 Intergenic 62377 NM_026850 Mm.28121 NM_026850 ENSMUSG00000026078 Pdcl3MACS_peak_17 chr1 42743330 42743817 30.41 intron (NR_027826, intron 1 of 3) 8097 NR_027826 Mm.45203 NR_027826 2610017I09RikMACS_peak_18 chr1 44608959 44609420 30.65 intron (NM_028450, intron 1 of 10) 673 NM_028450 Mm.133132 NM_028450 ENSMUSG00000056870 Gulp1MACS_peak_19 chr1 58024231 58024659 30.97 exon (NM_001159864, exon 2 of 7) 1923 NR_027630 Mm.339711 NM_001159864 ENSMUSG00000054770 Kctd18MACS_peak_20 chr1 58307233 58307506 31.27 intron (NM_023631, intron 21 of 34) -27801 NM_001008419 Mm.414292 NM_001008419 ENSMUSG00000079554 Aox3l1MACS_peak_21 chr1 58561375 58561704 31.27 intron (NM_008765, intron 1 of 17) 224 NM_008765 Mm.3411 NM_001025378 ENSMUSG00000026037 Orc2MACS_peak_22 chr1 59052716 59053033 31.27 TTS (NM_172656) 22459 NM_172656 Mm.286006 NM_172656 ENSMUSG00000026027 StradbMACS_peak_23 chr1 59452617 59452951 31.27 Intergenic -86207 NM_008057 Mm.297906 NM_008057 ENSMUSG00000041075 Fzd7MACS_peak_24 chr1 59466694 59466915 31.27 Intergenic -72187 NM_008057 Mm.297906 NM_008057 ENSMUSG00000041075 Fzd7MACS_peak_25 chr1 62813907 62814436 30.06 intron (NM_010939, intron 10 of 15) 64280 NM_001077405 Mm.266341 NM_001077403 ENSMUSG00000025969 Nrp2MACS_peak_26 chr1 63223398 63223643 31.27 promoter-TSS (NM_001160038) 115 NM_018796 Mm.2718 NM_018796 ENSMUSG00000025967 Eef1b2MACS_peak_27 chr1 66739647 66739891 31.27 intron (NM_175510, intron 62 of 64) -7698 NM_025683 Mm.240912 NM_025683 ENSMUSG00000026005 RpeMACS_peak_28 chr1 68506260 68506647 31.27 intron (NM_010154, intron 3 of 26) 648180 NM_010154 Mm.442420 NM_010154 ENSMUSG00000062209 Erbb4MACS_peak_29 chr1 72886622 72887150 30.06 intron (NM_008342, intron 1 of 3) 15809 NM_008342 Mm.141936 NM_008342 ENSMUSG00000039323 Igfbp2MACS_peak_30 chr1 74634689 74635038 31.27 promoter-TSS (NM_029888) -72 NM_025784 Mm.358700 NM_025784 ENSMUSG00000026172 Bcs1lMACS_peak_31 chr1 75484212 75484606 31.27 intron (NM_178884, intron 16 of 19) 8302 NM_177056 Mm.44401 NM_177056 ENSMUSG00000051703 Tmem198MACS_peak_32 chr1 77379445 77379687 31.27 exon (NM_007936, exon 13 of 18) 132097 NM_007936 Mm.400747 NM_007936 ENSMUSG00000026235 Epha4MACS_peak_33 chr1 78414324 78414823 30.31 3' UTR (NM_001004173, exon 5 of 5) 70848 NM_011811 Mm.447792 NM_011811 ENSMUSG00000026245 FarsbMACS_peak_34 chr1 88154636 88155004 31.27 intron (NM_030184, intron 22 of 24) -44976 NM_145222 Mm.86467 NM_145222 ENSMUSG00000079445 B3gnt7MACS_peak_35 chr1 88423602 88423928 31.27 intron (NM_008972, intron 1 of 4) 454 NM_008972 Mm.19187 NM_008972 ENSMUSG00000026238 PtmaMACS_peak_36 chr1 89053527 89053877 31.27 Intergenic -2100 NM_021306 Mm.140765 NM_021306 ENSMUSG00000026247 Ecel1MACS_peak_37 chr1 90137423 90137857 30.91 intron (NM_001177364, intron 18 of 42) 14045 NM_001177364 Mm.386915 NM_001177364 ENSMUSG00000079429 Heatr7b1MACS_peak_38 chr1 90351357 90351698 31.27 Intergenic 47933 NM_029269 Mm.173058 NM_029269 ENSMUSG00000026295 Spp2MACS_peak_39 chr1 91649825 91650081 31.27 intron (NM_001037136, intron 11 of 16) -69486 NR_015540 Mm.444291 NR_015540 4933400F21RikMACS_peak_40 chr1 91828061 91828504 30.83 promoter-TSS (NM_010262) -531 NM_010262 Mm.204730 NM_010262 ENSMUSG00000034486 Gbx2MACS_peak_41 chr1 92110841 92111293 30.74 exon (NM_007722, exon 2 of 2) 10489 NM_007722 Mm.6522 NM_007722 ENSMUSG00000044337 Cxcr7MACS_peak_42 chr1 92860478 92860815 31.27 intron (NM_008998, intron 2 of 5) 3598 NM_001159725 Mm.279780 NM_001159725 ENSMUSG00000026304 Rab17MACS_peak_43 chr1 93308179 93308547 31.27 3' UTR (NM_019479, exon 4 of 4) 1436 NM_019479 Mm.280029 NM_019479 ENSMUSG00000067071 Hes6MACS_peak_44 chr1 93797586 93798066 30.48 Intergenic 99772 NM_007855 Mm.9474 NM_007855 ENSMUSG00000007805 Twist2MACS_peak_45 chr1 94077009 94077215 31.27 Intergenic -32142 NM_207225 Mm.318567 NM_207225 ENSMUSG00000026313 Hdac4MACS_peak_46 chr1 94108420 94108757 31.27 Intergenic -63618 NM_207225 Mm.318567 NM_207225 ENSMUSG00000026313 Hdac4MACS_peak_47 chr1 94633707 94634167 30.66 Intergenic -88519 NM_153114 Mm.219545 NM_153114 ENSMUSG00000044055 OtosMACS_peak_48 chr1 94651419 94651841 31.04 Intergenic -76633 NM_016696 Mm.297976 NM_016696 ENSMUSG00000034220 Gpc1MACS_peak_49 chr1 95327476 95327874 31.27 exon (NM_133808, exon 7 of 28) 47710 NM_133808 Mm.30012 NM_133808 ENSMUSG00000034088 HdlbpMACS_peak_50 chr1 95616670 95616902 31.27 intron (NM_025920, intron 3 of 5) 34515 NM_016778 Mm.3295 NM_016778 ENSMUSG00000026278 Bok

39 Introduction to Systems Biology
Heatmaps: visualizing distributions of peaks
Peak 1 +3000bp -3000bp
Peak 2 +3000bp -3000bp
Peak n-1 +3000bp -3000bp
Peak n +3000bp -3000bp
TF2
TF2
TF2

40 Introduction to Systems Biology
Heatmaps: visualizing distributions of peaks
Nanog vs Oct4 Nanog vs Sox2
6000bp 6000bp

41 Introduction to Systems Biology
cMyc vs Oct4 cMyc vs Sox2
Heatmaps: visualizing distributions of peaks

42 Introduction to Systems Biology
Histograms of “tag directories”
Nanog vs Sox2 Nanog vs Oct4

43 Introduction to Systems Biology
Histograms of “tag directories”
cMyc vs Sox2 cMyc vs Oct4