Measuring Procurement's Performance
38
©ALL RIGHTS RESERVED - Confidential 1 Measuring Procurement’s Performance Peter Smith Wednesday October 17th 2012 Spend Matters UK/Europe
-
Upload
bravosolution -
Category
Business
-
view
10.521 -
download
1
Transcript of Measuring Procurement's Performance

©ALL RIGHTS RESERVED - Confidential 1
Measuring Procurement’s Performance
Peter Smith Wednesday October 17th 2012
Spend Matters UK/Europe

©ALL RIGHTS RESERVED - Confidential 2
• The Real World Sourcing Series is a series of 6 sessions covering hot topics for procurement professionals.
• The Real World Sourcing Series is promoted and supported by BravoSolution, and developed by Peter Smith (Spend Matters) and Guy Allen (4C Associates).
• Peter Smith started his procurement career with Mars Confectionery, then was CPO for Dun & Bradstreet Europe, the Department of Social Security and the NatWest Group. He is now a consultant, author, non-executive director and editor of the Spend Matters website. He was President of CIPS in 2002/3.
Spend Matters UK/Europe Spend Matters UK/Europe Spend Matters UK/Europe
Part 1 - Introduction

©ALL RIGHTS RESERVED - Confidential 3
Measuring Procurement’s Performance October 17th 2012
Agenda
1. Introduction
2. Measuring Savings
3. Other Measures
4. Conclusions
Spend Matters UK/Europe

©ALL RIGHTS RESERVED - Confidential 4
Hypothesis 1
Most organisations focus too strongly on “savings” as a measure of the procurement function’s effectiveness. But that’s a topic for another day really...
Today we will accept that reality
Part 2 – Measuring Savings

©ALL RIGHTS RESERVED - Confidential 5
Hypothesis 2
Procurement is worse than any other business function at measuring its performance in a objective, truthful and credible manner.
Even Marketing does it better!* They measure:
• Market share
• Response to adverts, websites etc.
• Consumer awareness – prompted / unprompted
• Brand equity
All pretty genuine measures. What are our equivalents?
(*Guy Allen disagrees!)
Part 2 – Measuring Savings
©ALL RIGHTS RESERVED - Confidential 6
Hypothesis 3
Most procurement functions deliberately deceive their bosses in terms of how they choose and apply the measurement methodology
There are many, many ways of doing this.
Here are just twelve......
Part 2 – Measuring Savings

©ALL RIGHTS RESERVED - Confidential 7
1. Carry forward savings from previous years to smooth the
profile.
2. Count the same savings year after year after year..
3. Move business to an outsourcer and claim ‘benchmarked’
savings against the market (even if prices are higher than those
you paid previously)!
4. Claim savings against your own market ‘benchmarks’, defined
as you choose.
5. Set a high commodity–specific inflation rate then beat it (e.g.
Facilities Management – assume 5% inflation; we only paid 3%, so
2% saving).
Falsifying Procurement Savings – part 1

©ALL RIGHTS RESERVED - Confidential 8
6. Take advantage of market prices naturally reducing e.g. most
technology (although this can be a genuine ‘saving’, it is passive,
not active.)
7. Claim sourcing savings even if more quantity bought and overall
spend rises (buy 1100 PCs at £800 instead of 800 at £1000 and
claim a ‘saving’ of 1100 x £200 = £220K although overall spend
has risen by £80K).
8. Claim demand management savings even if unit price and
therefore overall spend has increased (e.g. buy 800 printers at
£1100 rather than 1000 at £800 and claim a ‘saving’ of 200 x
£1100 = £220K although overall spend has risen by £80K again!)
Falsifying Procurement Savings – part 2
©ALL RIGHTS RESERVED - Confidential 9
9. Claim savings against unrealistically high budgets for capital
and project spend, or against high initial supplier bids. (At
best, cost avoidance).
10. Reduce budgets without any mitigating action – “all non-pay
budgets frozen year on year.” (Note that this is at least a
genuine cashable ‘saving’ but is probably a ‘cut’ rather than an
efficiency, assuming no mitigating action is taken.)
11. Claim a notional savings for process simplification (based on
greater use of purchase card, reduced POs etc.) even if there
is no headcount reduction
12. Wherever budgets are reduced, just claim it as a saving!
Falsifying Procurement Savings – part 3

©ALL RIGHTS RESERVED - Confidential 10
What process will be used
Last year as the Category Manager I bought 50,000 standard
cartons at a total cost of £5000.
• This year we’ve found a new specification that uses 10% less
raw material.
• But the dollar (pulp is priced in $ on the world market)
appreciated 5% against the £
• The pulp market weakened by 20% because of global
recession
• We bought 100,000 cartons and our total cost was £8,000.
HOW DID I DO? HOW MUCH HAVE I “SAVED”?
Exercise

©ALL RIGHTS RESERVED - Confidential 11
• Different expenditure types should be treated
differently in terms of measuring and capturing
savings
• The two main dimensions are:
– Is it Capital Expenditure or Operating Expenditure
– Is it a recurring spend (i.e. basically the same year after
year) or a one-off spend?
Different types of Expenditure

©ALL RIGHTS RESERVED - Confidential 12
How do we choose which? Spend Types
Unique consulting projects “Emergency” activities
Direct materials Packaging Office supplies Facilities management Outsourced services
Construction projects Plant and equipment Major IT development
IT equipment “Repeat” construction Factory equipment
Opex
Capex
One-offs
Recurring
©ALL RIGHTS RESERVED - Confidential 13
Our main focus will be on recurring spend. But let’s briefly look
at one-offs.
We’ve seen organisations measuring savings by comparing
actual spend against;
• Budget
• Initial or average quotes
• A market benchmark
• A bottom-up cost analysis
Different types of Expenditure

©ALL RIGHTS RESERVED - Confidential 14
Pros and Cons?
Comparing actual spend for one-offs against;
• Budget
• Initial or average quotes
• A market benchmark
• A bottom-up cost analysis
But all of these are essentially cost avoidance rather than
true “savings” – only the “budget” option, if it is at a
granular level and Opex, enables a saving to be tracked to
the P&L
Different types of Expenditure

©ALL RIGHTS RESERVED - Confidential 15
How do we choose which? Measuring “savings”
Track procurement “contribution” but not “savings” – cost avoidance
Feasible to measure procurement savings and identify in P&L
Track contribution against budget / benchmark, not traceable to P&L
Possible to measure procurement savings – but hard to trace in the P&L
Opex
Capex
One-offs
Recurring

©ALL RIGHTS RESERVED - Confidential 16
Recurring Spend
The issue here is not that we don’t have anything definite
to compare against – we do.
We have the previous cost (last month, last year) against
which we can measure the new cost.
The difficulty comes from isolating out the different
influences on the cost so we can see (if we want to) the
true “savings”.
What are those influences?

©ALL RIGHTS RESERVED - Confidential 17
Look at some examples
A number of “value drivers” are (usually) outside the control of
the procurement function. They are:
• Currency
• Volume (quantity used, NOT the economy of scale issue)
• Market movements
Spend data needs to be normalised to take these out of the
equation if we’re going to consider true “procurement savings”
Recurring Spend
©ALL RIGHTS RESERVED - Confidential 18
Currency movements can lead to additional cost or savings,
independent of any procurement action.
Last year the dollar was $1.60 = £1.
This year it is $1.70 = £1
Items priced in dollars will, all else being equal, be 1.60/1.70 = =
94.1% of the price. A 5.9% “saving”!
Currency can of course apply only to elements of the final product
e.g. UK manufactured paper–based product may have around half its
cost liked to global pulp market price
Currency
©ALL RIGHTS RESERVED - Confidential 19
OGC Procurement Capability Volume
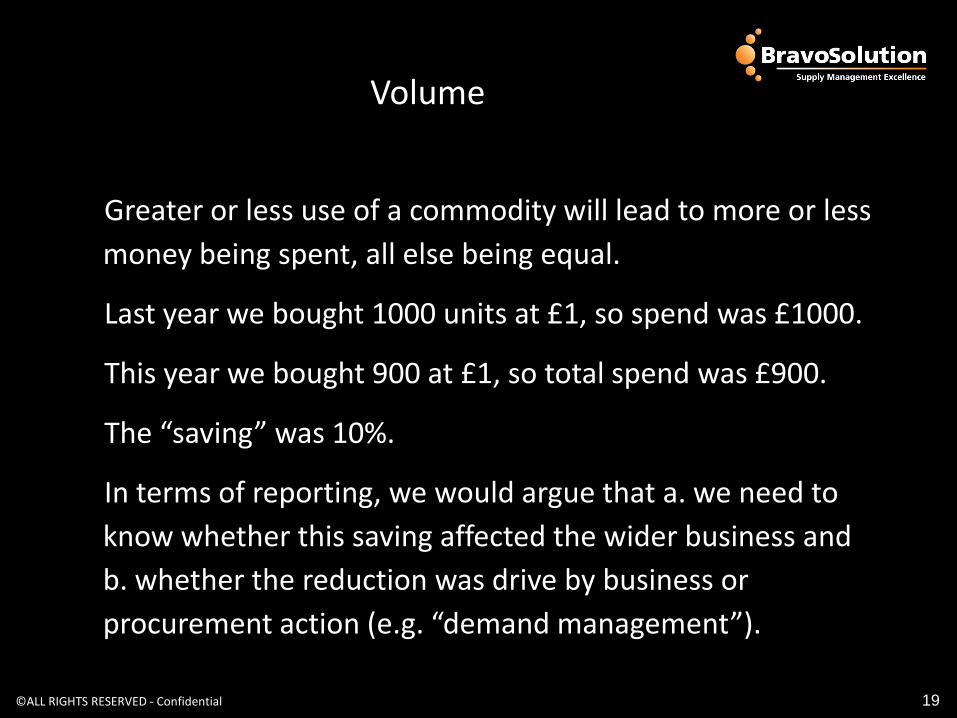
Greater or less use of a commodity will lead to more or less
money being spent, all else being equal.
Last year we bought 1000 units at £1, so spend was £1000.
This year we bought 900 at £1, so total spend was £900.
The “saving” was 10%.
In terms of reporting, we would argue that a. we need to
know whether this saving affected the wider business and
b. whether the reduction was drive by business or
procurement action (e.g. “demand management”).

©ALL RIGHTS RESERVED - Confidential 20
OGC PCR Output Market
Market price movements will clearly have an affect on prices
and savings.
Last year, the market price for cocoa was (on average) £1500 /
Tonne. This year it is £1350.
Our costs have reduced by 10% - a saving, but one that had
nothing to do with procurement (or anyone else in the
business)
Note - the market price factor may only affect some of the cost
element of the item we’re buying (see currency example).
May still need procurement input to achieve market pricing!

©ALL RIGHTS RESERVED - Confidential 21
Normalisation
Last year we paid £10 per unit for widgets, and we bought 500
units.
The pound has depreciated (weakened) by 10% against the dollar –
widgets are made in Texas and priced in $ on the international
market.
We’ve bought 1000 widgets this year.
The market price of widgets has declined by 5%.
All else being equal, how much would you expect us to have spent
on widgets this year (total) ?
If this year we paid £9 per unit, what is the procurement saving?

©ALL RIGHTS RESERVED - Confidential 22
Normalisation
Last year we paid £10 per unit for widgets, and we bought 500
units. £5000 total spend
The pound has depreciated by 10% against the dollar –
widgets are made in Texas. Expect that to grow to £5500.
We’ve bought twice as many this year. So expect spend of
£11000.
The market price of widgets has declined by 5%. So £11000
would be reduced by 5% or £550
All else being equal, how much would you expect us to have
spent on widgets this year (total) ? £10450 (£11000 - £550)

©ALL RIGHTS RESERVED - Confidential 23
Normalisation
We actually spend 1000 x £9, so our “saving” is £10450 -
£9000 = £1450.
As a percentage of expected spend, that is
£1450 / £10450 = 13.8%
But that doesn't mean 13.8% is necessarily the procurement
contribution of course ....
And some of that may be down to an economy of scale effect
as volume went form 5000 to 10000 units.

©ALL RIGHTS RESERVED - Confidential 24
GOVERNANCE
STRATEGY & LADERSHIP
Commercial Factors
The saving on widgets (outside the normalised factors,
beyond our control) may have come from various actions by
procurement or the business (“strategic levers”):
• Changes in specification
• A change of supplier
• Aggregation or economy of scale
• Pure negotiation
• Other commercial factors
©ALL RIGHTS RESERVED - Confidential 25
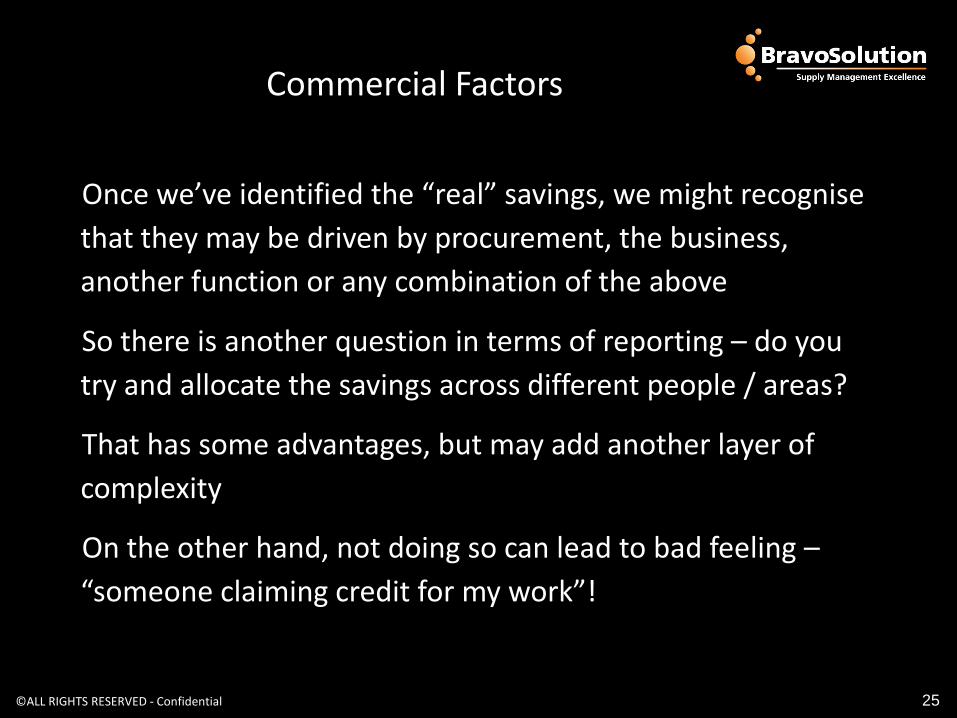
Commercial Factors
Once we’ve identified the “real” savings, we might recognise
that they may be driven by procurement, the business,
another function or any combination of the above
So there is another question in terms of reporting – do you
try and allocate the savings across different people / areas?
That has some advantages, but may add another layer of
complexity
On the other hand, not doing so can lead to bad feeling –
“someone claiming credit for my work”!

©ALL RIGHTS RESERVED - Confidential 26
Part 3 – What Should We
Almost another whole topic in itself!
• But important – “what good are your procurement savings if I
can’t see them impacting the bottom line”?
• Less of an issue in a manufacturing (direct materials)
environment.
• Savings will generally come through to the bottom line however
the budgeting and tracking process is carried out (standard
pricing, etc).
Capturing the savings

©ALL RIGHTS RESERVED - Confidential 27
Strategy More challenging with services and discretionary spend.
How do we know the contracts we’ve agreed are actually being
used? (Internal compliance).
How do we know the suppliers are charging the prices and
offering the Ts and Cs we think we've negotiated? (External
compliance).
These factors mean “real” savings are often way out compared
to the procurement savings quoted which are based on
negotiated deals rather than actual spend.
Capturing the savings

©ALL RIGHTS RESERVED - Confidential 28
People
How do we make sure our negotiated savings get captured at
real spend level?
Several options:
• Don’t do anything
• Build savings into next year’s budget
• Real-time adjustment of budgets (in year)
• Build savings into current year (in advance of actual spend)
All of these have pros and cons .....
Capturing the savings
©ALL RIGHTS RESERVED - Confidential 29
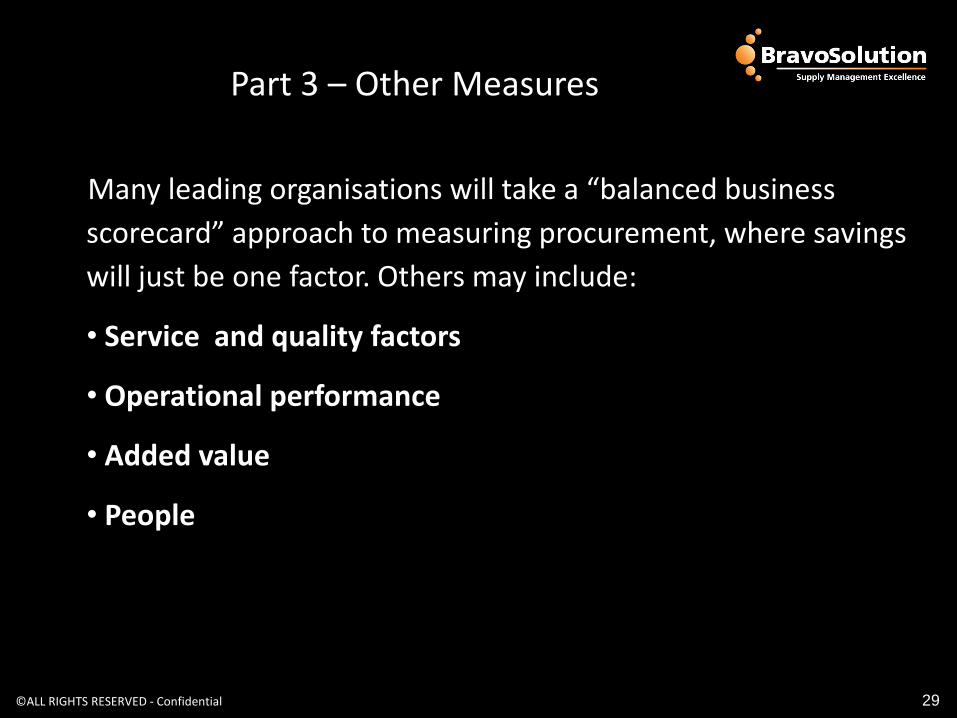
Many leading organisations will take a “balanced business
scorecard” approach to measuring procurement, where savings
will just be one factor. Others may include:
• Service and quality factors
• Operational performance
• Added value
• People
Part 3 – Other Measures

©ALL RIGHTS RESERVED - Confidential 30
Governance
Service and quality factors
• Stakeholder satisfaction with procurement
• Quality of goods purchased
• Response to stakeholder queries, turn-around times
• Quality of supplier performance *
* a topic for next year’s Real World Sourcing Series, we suspect!
Other Measures

©ALL RIGHTS RESERVED - Confidential 31
Key processes (e.g. Contract
Operational performance
• Running the function within budget
• Speed and accuracy of processing activities
• Stockholding, delivery and logistics measures
• Invoices matching POs or similar P2P measures
Other Measures

©ALL RIGHTS RESERVED - Confidential 32
Added value
• Spend coverage
• Supplier satisfaction / improved relationships
• Innovation / contribution to top-line
• Risk management – avoidance of major incidents, strength of
process
Other Measures

©ALL RIGHTS RESERVED - Confidential 33
Time-Out: Discussion
People
• Training and development
• Professionalism – e.g. CIPS membership
• Retention
• Staff satisfaction / survey results
Other Measures
©ALL RIGHTS RESERVED - Confidential 34
Improvement Outcomes
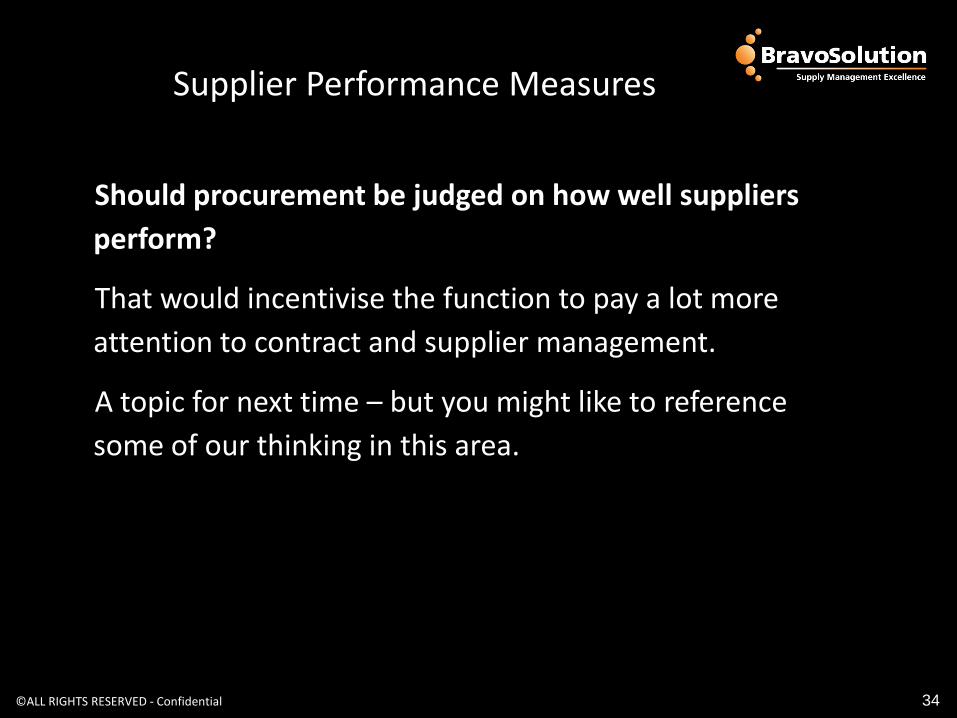
Should procurement be judged on how well suppliers
perform?
That would incentivise the function to pay a lot more
attention to contract and supplier management.
A topic for next time – but you might like to reference
some of our thinking in this area.
Supplier Performance Measures

©ALL RIGHTS RESERVED - Confidential 35
Improvement Plans
• Given that measuring “savings” is such an important part of assessing procurement, we really should try and get better at it.
• That means
– different measures & reporting for one offs / recurring spend
– normalising to eliminate purely external factors
– looking to explain the internal strategic drivers
– ensuring savings are captured
• But we should also promote a wider balanced business scorecard approach to measuring procurement’s performance
Conclusions and key messages

©ALL RIGHTS RESERVED - Confidential 36
Conclusions and key
• Decide whether you REALLY want to measure savings
• If you do, make some effort to normalise the data and report in a reasonable manner
• Measure based on actual spend not theoretical “negotiated” prices
• Give the business credit where it is due
• Introduce a wider balanced business scorecard approach and look to reflect where procurement brings value to the organisation
• Move the focus away from purely “savings”
Recommendations

©ALL RIGHTS RESERVED - Confidential 37
• £2500 towards any procurement based training
• Log on to the BravoSolution Education Network with the details you’ll receive tomorrow
• Complete the certification programme
• Check your ranking!
• The winner will be announced at the Sourcing Experts dinner on 19 December
Spend Matters UK/Europe
Real World Sourcing Scholarship

©ALL RIGHTS RESERVED - Confidential 38
THANK YOU!
Please feel free to contact me on
Spend Matters UK/Europe