

Dr Denzil Rodrigues Technical Manager, Hydropath Holdings Ltd.
Upload
claplanteCategory
view
356download
3
Measuring Knowledge CommercializationA Presentation By Denzil J. Doyle
Making Technology Happen TM
June 12th, 2007
Prepared For:
Federal Partners for Technology Transfer2007 National Meeting
Halifax, Nova Scotia

Contents:
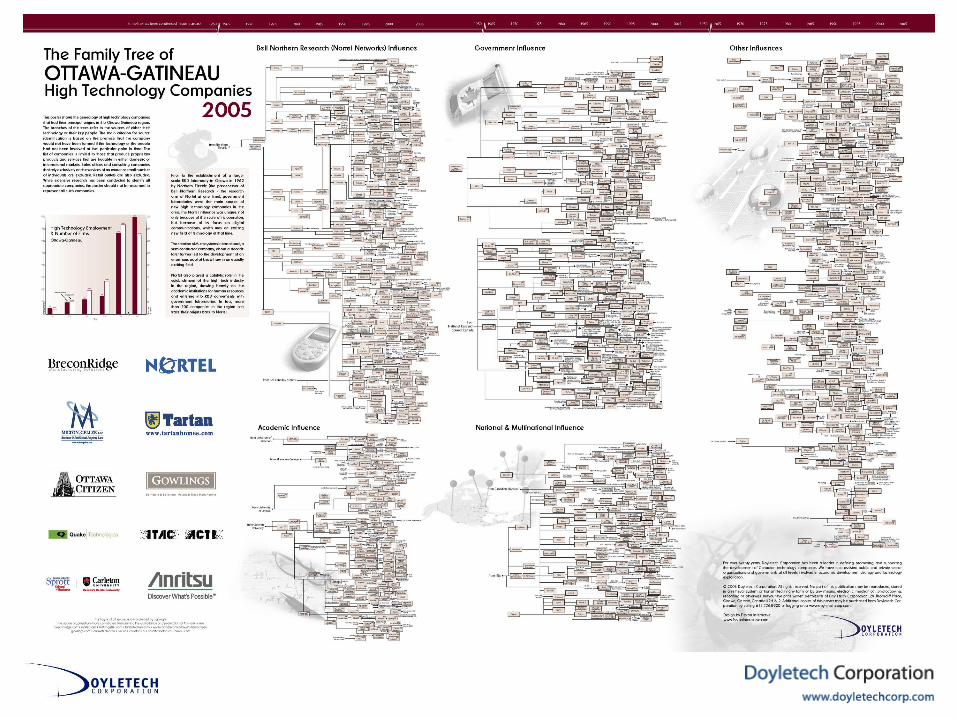
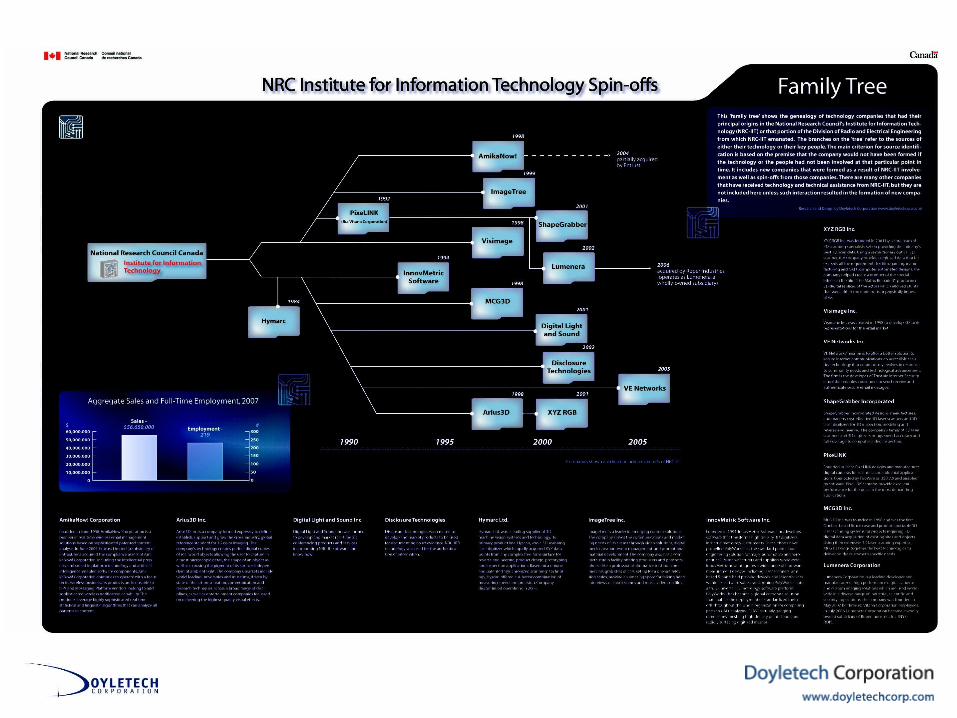
• Licensing and Spin-off FamilyTrees
• Measuring Knowledge Commercialization – The Model
• The Commercialization Engine
• Economic Impact Results from the Model
• Implementation
Measuring Knowledge Commercialization: FPTT National Meeting 2007

1. Licensing and Spin-off FamilyTrees
Measuring Knowledge Commercialization: FPTT National Meeting 2007

Measuring Knowledge Commercialization: FPTT National Meeting 2007

Measuring Knowledge Commercialization: FPTT National Meeting 2007
Measuring Knowledge Commercialization: FPTT National Meeting 2007
2. Measuring Knowledge Commercialization – The Model

Measuring Knowledge Commercialization: FPTT National Meeting 2007
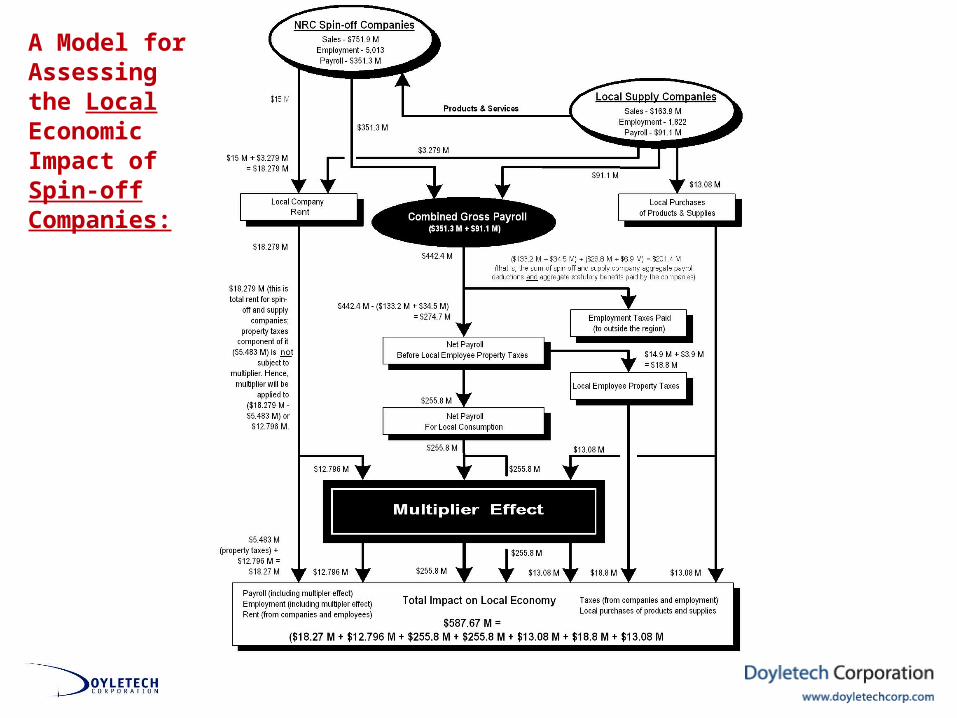
Measuring Knowledge Commercialization

Licensing & Cost recovery dollars go to the laboratory. Highly visible & measurable. Shorter time frame. Tax dollars go to the government. Less visible & measurable. Longer time frame. Tax dollars much greater than the licensing and cost recovery dollars. Taxes typically 20% of sales. Royalties typically less than 5% of sales. Cost recovery can conflict with long-term payback – scientists may hoard the technology to provide a test or calibration service that should be delivered by the private
sector.
Some Things to Note About the Model:
Measuring Knowledge Commercialization: FPTT National Meeting 2007

Measuring Knowledge Commercialization: FPTT National Meeting 2007
3. The Commercialization Engine
Measuring Knowledge Commercialization: FPTT National Meeting 2007

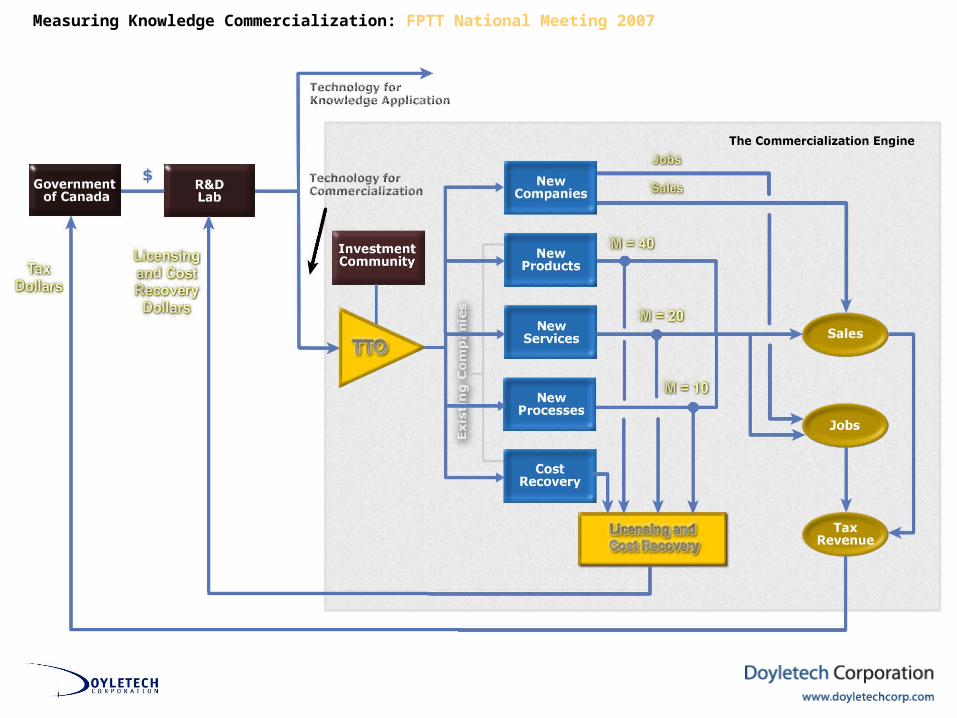
The TTO is an amplifier whose gain is controlled by the investment community.- IRAP, VCs, angels, SREDs, corporate treasuries, etc.- No money, no commercialization.
New companies – companies that would not exist without the transfer of people or technology from the lab.
Licensing rates will vary depending on the end use – products, services, or processes.
The cost recovery box may or may not have a multiplier associated with it.
Some Things to Note About the Commercilization Engine:
Measuring Knowledge Commercialization: FPTT National Meeting 2007
Measuring Knowledge Commercialization: FPTT National Meeting 2007
4. Economic Impact Results from the Model

Companies
0 27
15
26
39
51
5853
62
0
10
20
30
40
50
60
70
1960 1965 1970 1975 1980 1985 1990 1995 2000 2005
Year
Com
pani
es
Measuring Knowledge Commercialization: FPTT National Meeting 2007
Source: Estimates by Doyletech Corporation, October 2006.
CRC Spin-offs – Number of Companies
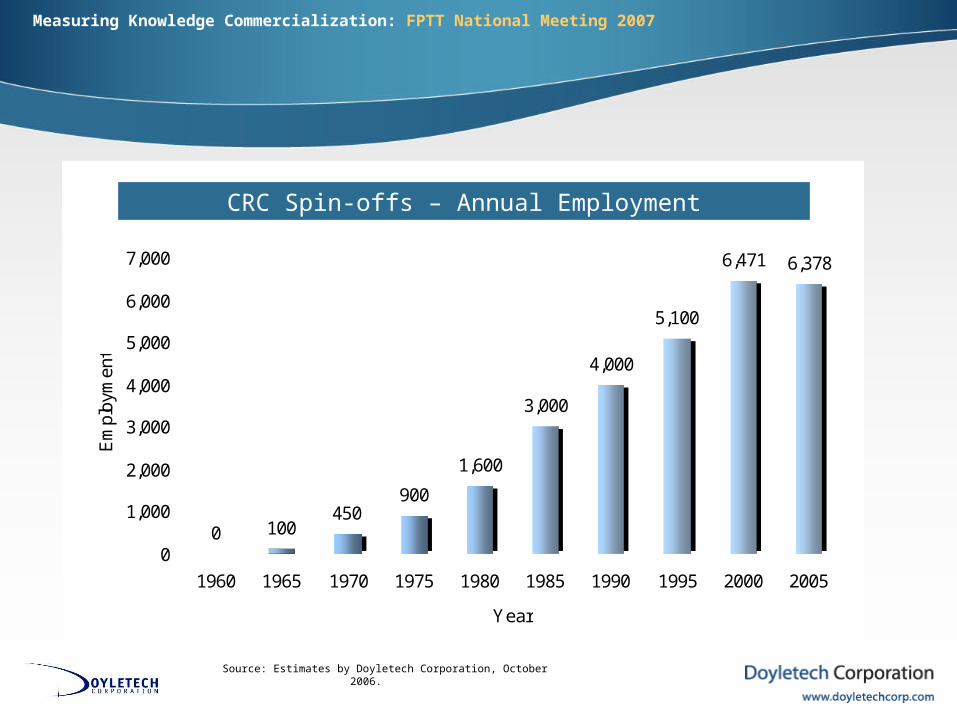
Employment
0 100450
900
1,600
3,000
4,000
5,100
6,471 6,378
0
1,000
2,000
3,000
4,000
5,000
6,000
7,000
1960 1965 1970 1975 1980 1985 1990 1995 2000 2005
Year
Em
ploy
men
t
Measuring Knowledge Commercialization: FPTT National Meeting 2007
Source: Estimates by Doyletech Corporation, October 2006.
CRC Spin-offs – Annual Employment
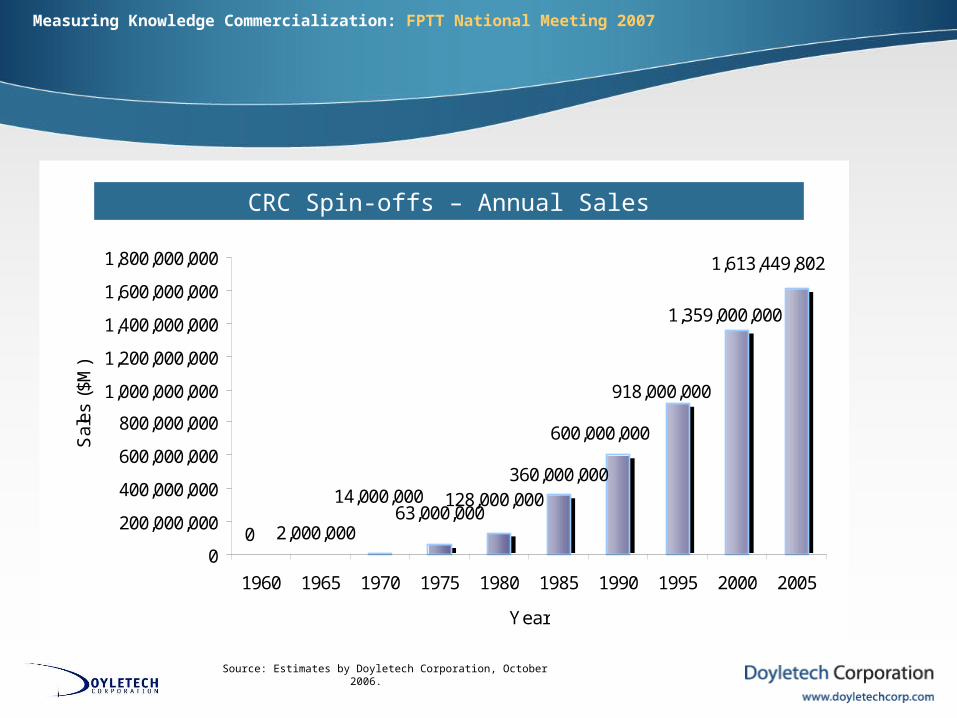
Sales
63,000,000
360,000,000
1,359,000,000
1,613,449,802
128,000,00014,000,000
2,000,0000
600,000,000
918,000,000
0
200,000,000
400,000,000
600,000,000
800,000,000
1,000,000,000
1,200,000,000
1,400,000,000
1,600,000,000
1,800,000,000
1960 1965 1970 1975 1980 1985 1990 1995 2000 2005
Year
Sal
es (
$M)
Measuring Knowledge Commercialization: FPTT National Meeting 2007
Source: Estimates by Doyletech Corporation, October 2006.
CRC Spin-offs – Annual Sales

Chart #1 - Cumulative Licensing and Contract Revenue
002,959,328
9,928,227
17,338,371
3,280,968
9,224,094
16,356,436
0
5,000,000
10,000,000
15,000,000
20,000,000
25,000,000
30,000,000
35,000,000
40,000,000
1990 1995 2000 2005
$
Foreign
Canadian
Measuring Knowledge Commercialization: FPTT National Meeting 2007
Source: Estimates by Doyletech Corporation, October 2006.
CRC’s Cumulative Licensing and Contract Revenue

If a company pays a royalty of 2.5% on sales of products, its product sales are forty times licensing revenue.
This ratio was used for product-oriented licensees.
For service-oriented licensees, a ratio of 20:1 was used.
For a number of reasons – like a service company cannot develop its own technology so easily.
For the licensing of a process – a factor of 10:1 was used – incremental sales are not usually a priority – efficiency is.
Extrapolating From Licensing Revenue to Sales:
Measuring Knowledge Commercialization: FPTT National Meeting 2007

Multiply all Canadian product licensing revenue over some period of time (5 year intervals were used) by forty to get Canadian cumulative sales over that period.
Do the same with Canadian service licensing revenues (using 20:1 multiplier) and with process licensing revenues using 10:1.
Add them all up to get Canadian cumulative sales.
The result is the next slide.
The Extrapolation Process:
Measuring Knowledge Commercialization: FPTT National Meeting 2007

Chart #2A - Cumulative Canadian Sales(Summary Total)
0
87,027,224
323,263,504
520,327,235
0
100,000,000
200,000,000
300,000,000
400,000,000
500,000,000
600,000,000
1990 1995 2000 2005
$
Measuring Knowledge Commercialization: FPTT National Meeting 2007
Source: Estimates by Doyletech Corporation, October 2006.
Cumulative Canadian Sales (Summary Total)

To Turn this into Employment:
Industry Canada
A sales/employee figure of $200,000 was used for all licensees. The result is cumulative person-years of employment. See next side.
Measuring Knowledge Commercialization: FPTT National Meeting 2007

Measuring Knowledge Commercialization: FPTT National Meeting 2007
Source: Estimates by Doyletech Corporation, October 2006.
Chart #3A - Cumulative Canadian Person-Years of Employment(Summary Total)
0
435
1,617
2,602
0
500
1,000
1,500
2,000
2,500
3,000
1990 1995 2000 2005
#
Cumulative Canadian Person-Years of Employment (Summary Total)
Summary:
CRC’s 62 spin-off companies are generating $1.6 billion of sales (in one year) and 6,378 in employment. CRC’s licensing activities have generated $520 million of cumulative sales and 2,602 cumulative person-years of employment over 17 years. A typical high-technology company generates tax revenues of all types (employee, corporate, GST, EHT, stock options, etc.) of 20% of revenue. The $1.6 billion of spin-off sales is generating $320 million of tax revenues per year. The $520 million of cumulative sales has generated about $100 million of tax revenue over the past seventeen years.
Measuring Knowledge Commercialization: FPTT National Meeting 2007

Measuring Knowledge Commercialization: FPTT National Meeting 2007
5. Implementation5. Implementation

Making Technology Happen TM
Completed By:
Doyletech Corporation
Project Team:
Denzil Doyle, Jeffrey Doyle, and Glenn McDougall
Project:Project:Measuring Knowledge CommercializationFederal Partners for Technology Transfer