Measuring GDP by Final Demand Approach An Introduction Vu Quang Viet International Workshop on...
14
Measuring GDP by Final Demand Approach An Introduction Vu Quang Viet International Workshop on Measuring GDP by Final Demand Approach Shenzhen, China 25-27 April 2011
-
Upload
collin-stevenson -
Category
Documents
-
view
219 -
download
0
Transcript of Measuring GDP by Final Demand Approach An Introduction Vu Quang Viet International Workshop on...

Measuring GDP by Final Demand Approach
An Introduction
Vu Quang VietInternational Workshop on
Measuring GDP by Final Demand Approach Shenzhen, China25-27 April 2011

Definition of GDP by final expenditureCategories GDP = Data availability/indicators
Final consumption +
Households Retail sale, household survey
NPISH ?
Government Readily available
Gross fixed capital formation + Survey + data analysis
Households ?
NPISH ?
Corporations Survey
Government More or less readily available
Changes in inventories + Survey
Imports - Readily available
Exports + Readily available

Shares of components of GDP, 2009Country
Final consumption
HH GOV GCF GFCF INV Exports Imports
China 0.504 0.368 0.136 0.456 0.438 0.017 0.392 0.306
India 0.696 0.573 0.123 0.350 0.337 0.013 0.206 0.253
Indonesia 0.682 0.586 0.096 0.310 0.311 -0.001 0.241 0.213
Malaysia 0.645 0.502 0.143 0.140 0.204 -0.064 0.969 0.754
Philippines 0.844 0.739 0.105 0.146 0.146 0.000 0.317 0.308
Thailand 0.683 0.550 0.133 0.219 0.244 -0.026 0.685 0.579
Vietnam 0.733 0.670 0.064 0.384 0.348 0.036 0.762 0.886
Australia 0.737 0.557 0.180 0.283 0.283 0.000 0.195 0.200
Canada 0.807 0.588 0.219 0.210 0.215 -0.005 0.287 0.304
USA 0.883 0.710 0.173 0.136 0.146 -0.010 0.111 0.138

Supply and use table, year = t SUPPLY 1 2 3 4 5 Imports Trade &
Transport margins
Product taxes
Product supply purchr’ prices
1 31 177 5 70 22 60 15 380
2 2 2 59 2 -60 3 8
3 20 1 0 2 23
4 10 0 0 0 10
Indus. output basic prices
33 179 64 20 80 28 0 20
USE 1 2 3 4 5 Exports GCF FCE Product uses
1 7 93 30 5 23 37 40 145 380
2 4 0 2 2 8
3 1 12 1 1 2 1 5 23
4 1 9 10
VA 25 69 33 14 55 1 2
Industry output/TT 33 179 64 20 80 41 40 163

Estimation in constant prices, year = t+n
• Given– Industry output in basic prices– Product price indexes– Data on exports and imports– Preliminary data on general government FCE and GCF– Limited information on household FCE
• Need to do– Convert industry output to product output in purchasers’
prices– Deflate product output– Estimate products consumed as intermediate inputs– Estimate total products that can be used for GCF and
household FCE

Data given and estimated, year = t+nSUPPLY
current prices1 2 3 4 5 Product output in current
prices estimated
1 0.94 0.99 0.08 0.87 251.3
2 0.06 0.10 0.92 69.2
3 1.00 22.0
4 0.13 15.0
Industry output curr. prices
40 200 70 22 12
USE in constant prices
1 2 3 4 5 Product output in constant prices estimated
1 0.21 0.52 0.47 0.25 0.29 239.3
2 0.02 67.8
3 0.03 0.07 0.02 0.05 0.02 21.6
4 0.01 1.5
VA 28.9 73.4 35.3 15.1 7.9Industry output 38.2 190.5 68.5 21.6 11.5
Shares/coefficients in In constant
prices

Estimation in constant prices, year = t+nSUPPLY Products
producedImports Trade &
Transport margins
Product taxes
Supply of product
1 239.3 ?
2 67.8 Data given ?
3 21.6 ?
4 1.5 ?
Total
USE Intermediate consumption
Exports GCF FCE Uses of products
1 147.9 ?
2 4.3 Data given ?
3 16.4 ?
4 1.1 ?Total
Based on base-year ratios which then adjusted to given
totals
Estimation by: •Extrapolation based on survey,•Analysis of production and import data

Estimation of trade (wholesaling retailing) and transport (freight) margins for base year
• Direct measurement of output of wholesaling, retailing and freight transport services provided to kind of products. Normally:– Wholesaling margins are assigned to intermediate consumption
and gross capital formation– Retailing margins are assigned to household final consumption
• Indirect measurement of margins– Percentage difference between retail price (excluding all sale
taxes) and basic price (normally called wholesale price or producer price) of a product unit . These unit prices are regularly collected to calculate CPI and PPI.
• Allocation rule: Normally margin on a given product is allocated proportionally to the values of products used.

Taxes on products by kind of products of base-year
• Ratios of taxes on products of the base year are calculated by kind of products.
• For that, taxes are distributed proportionally to the values consumed, excluding consumption categories that are either not subject to taxes or subject to tax deduction.

Estimation of margins and product taxes for the current year
• The same ratios are applied to estimate margins and product taxes for the current year for both constant and current prices.– Margins in constant prices: apply the ratios to
values of supply at basic values in constant prices.
– Margins in current prices: apply the ratios to the values of supply at basic values in current prices.

Trade and transport margins in US, 2002
Producers’ prices
Trade and transport margins
Freight costs
Wholesale and retail
trade
Purchasers prices
Auto 100% 45% 3% 42% 145%
Tires 100% 158% 2% 156% 258%
Accessories 100% 136% 3% 133% 236%
Furniture 100% 101% 12% 89% 201%
Cereals 100% 63% 3% 60% 163%
Bakeries 100% 61% 2% 59% 161%
Beef & veal 100% 57% 3% 54% 157%
Sea food 100% 62% 3% 59% 161%
Fruits 100% 101% 13% 88% 200%
Vegetables 100% 114% 21% 93% 214%Processed fruits and vegetables 100% 62% 4% 58% 162%
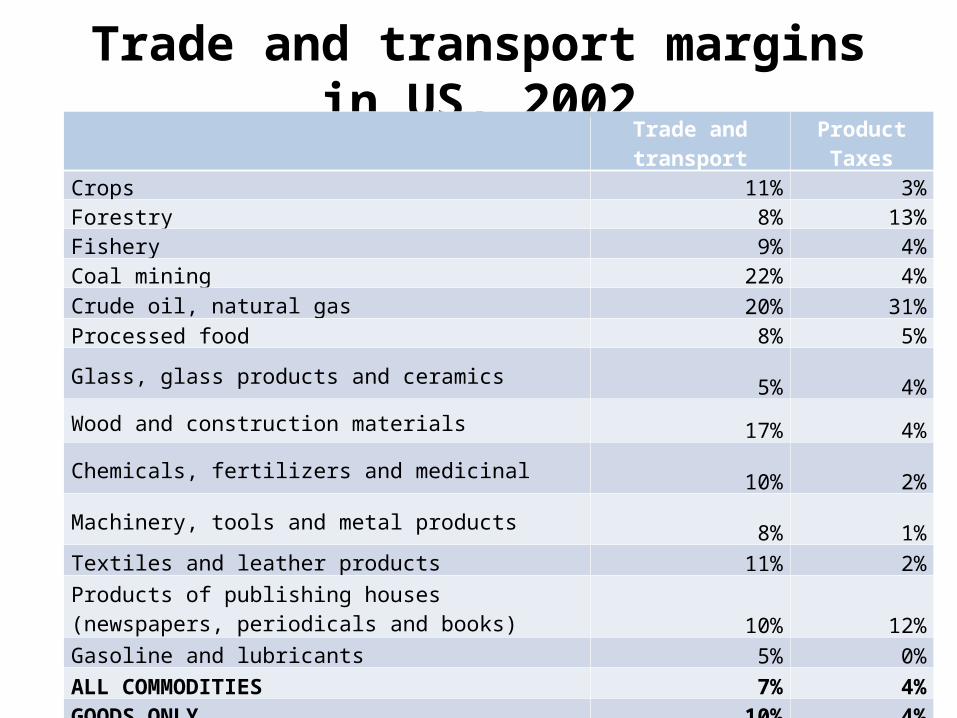
Trade and transport margins in US, 2002Trade and transport Product Taxes
Crops 11% 3%Forestry 8% 13%Fishery 9% 4%Coal mining 22% 4%Crude oil, natural gas 20% 31%Processed food 8% 5%
Glass, glass products and ceramics 5% 4%
Wood and construction materials 17% 4%
Chemicals, fertilizers and medicinal 10% 2%
Machinery, tools and metal products 8% 1%Textiles and leather products 11% 2%Products of publishing houses (newspapers, periodicals and books) 10% 12%Gasoline and lubricants 5% 0%ALL COMMODITIES 7% 4%GOODS ONLY 10% 4%

Allocation of supply of goods and services destined to final expenditures
• Basically, supply of a particular good or service destined to final expenditures = Total uses - Exports - Intermediate consumption
• Thus, this residue can go either to final consumption or gross capital formation.
• Allocation rules:– Construction after deducting maintenance should go to GCF– New automobiles should be allocated to households (FC) and other
sectors (GCF) on the bases of car registration. Old car is estimated differently
– Machineries (need to identify them properly) should go to GCF.– Besides known national inventories (oil, cereal, etc.), shares of products
going to inventories should be based on surveys or base-year ratio (if no information is available.
• Estimation rules: – Base year: all sources of data should be confronted to arrive at reliable
data at both detailed and aggregate levels.– Annual/Infra Annual: indicators based on limited but consistent set of
data are used to extrapolate base-year data.

End