Tire = tyre (n) a thick rubber ring that fits around the edge of a wheel of a car, bicycle, etc.

the U.S. economy. BEA releases are eagerly awaited
throughout the economy. Top officials at the White
House (including the president) find these data so im-
portant that they ensure that they get them the night
before they are released to the public. Because meas-
uring the economy in a timely and accurate manner is
essential for people in financial markets and other
lines of business, bond and stock traders in New
York, Tokyo, London, and everywhere else keep their
eyes glued to their computer terminals when a new
government statistic measuring the course of the
economy is about to be released. By buying or selling
quickly in response to the new information, they can
make millions or avoid losing millions.
To economists, measurement of the economy is
interesting in its own right, involving clever solutions
to intriguing problems. One of the first Nobel Prizes in
economics was given to Simon Kuznets for solving
some of these measurement problems. As economics
students, you cannot help but learn a little about how
the economy works when you study how to measure
it, just as geology students cannot help but learn a
little about earthquakes when they study how the
Richter scale measures them. Understanding eco-
nomic problems, designing possible policy solutions
to these problems, and understanding whether the
policy solutions did in fact work all require access to
reliable data.
The purpose of this chapter is not to train you to
work in the BEA. Instead, the goals are to give you a
general understanding of what measures the BEA
uses, to help you better grasp the strengths and
weaknesses of these measures, and to make you
more familiar with some key macroeconomic relation-
ships that exist in the economy.
Measuring GDPTo use GDP as a measure of production, we must be precise about what is included inproduction, where production takes place, and when production takes place.
A Precise Definition of GDPGDP is a measure of the value of all the newly produced goods and services in a countryduring some period of time. Let us dissect this definition to determine what is in GDPand what is not, as well as where and when GDP is produced.
• What? Both goods—such as automobiles and new houses—and services—such as busrides or a college education—are included in GDP. However, only newly producedgoods and services are included. A ten-year-old baby carriage that is being sold at agarage sale is not included in this year’s GDP; it was included in GDP ten years ago,when it was produced.
• Where? Only goods and services produced within the borders of a country areincluded in that country’s GDP. Goods produced by Americans working in anothercountry are not part of U.S. GDP; they are part of the other country’s GDP. Goodsand services produced by foreigners working in the United States are part of U.S.GDP.
Measuring GDP 131

• When? Only goods and services produced during some specified period of time areincluded in GDP. We always need to specify the period during which we are mea-suring GDP. For example, GDP in 2010 is the production during 2010. GDP forthe third quarter of 2010 is the production between July 1 and September 30 of2010. Rounded off to the nearest billion, GDP, or total production, was $14,660billion in the United States in 2010. Rounded off to the nearest trillion, GDP was$15 trillion. That is an average production of about $40 billion worth of goods andservices a day for each of the 365 days of the year.
Prices Determine the Importance of Goods and Services in GDPGDP is a single number, but it measures the production of many different things, fromapples to oranges, from car insurance to life insurance, from audio CDs to DVDs. Howcan we add up such different products? Is a CD more important than a DVD? Does acoconut count more toward GDP than a banana does?
Each good is given a weight when we compute GDP, and that weight is its price. Ifthe price of a DVD is greater than that of a CD, then the DVD will count more inGDP. To see this, imagine that production consists entirely of CDs and DVDs. If aDVD costs $15 and a CD costs $10, then producing three DVDs will add $45 to GDP,and producing five CDs will add $50 to GDP. Thus, producing three DVDs plus fiveCDs adds $95 to GDP, as shown in Table 6-1.
Although this method of weighting by price might not appeal to you personally—you might like CDs more than DVDs—it is hard to imagine anything more workable. Ina market system, prices tend to reflect the cost and value of the goods and services pro-duced. One of the great problems of measuring GDP in centrally planned economiessuch as the former Soviet Union was that the price of goods was set by the government;thus, the weight given each item may have had little to do with either its cost or its valueto individuals. Without market prices, measuring GDP in the Soviet Union was difficult.
Intermediate Goods versus Final Goods When measuring GDP, it is impor-tant not to count the same item more than once. Consider bicycle tires. When you buy a$150 bicycle, the tires are considered part of the bicycle. Suppose the tires are worth $20.It would be a mistake to count both the $20 value of the tires and the $150 value of thebicycle, for a total value of $170. That would count the tires twice, which is called doublecounting. When a tire is part of a new bicycle, it is an example of an intermediate good.Intermediate goods are part of final goods, which by definition are goods that undergono further processing—in this case, the bicycle. To avoid double counting, we never count in-termediate goods; only final goods are part of the GDP. If in a few years you buy a new$25 bicycle tire, then the tire will be a final good.
Table 6-1Adding Up Unlike Products: CDs and DVDs
5 CDs $10 per CD $50 of CD productionþ 3 DVDs $15 per DVD þ $45 of DVD production
? $95 of CD and DVD production
. . . we multiplyby their prices toget the dollarvalue of each . . .
To add upunlikeproducts . . .
intermediate gooda good that undergoes furtherprocessing before it is sold toconsumers.
final gooda new good that undergoes nofurther processing before it is soldto consumers.
. . . and add together thedollar values of each to getthe dollar value of the sum.
132 Chapter 6 Measuring the Production, Income, and Spending of Nations

Stocks versus Flows The distinction between stocks and flows is one of the mostuseful concepts in economics, and it is especially important in understanding GDP. GDPis a measure of the flow of new goods and services—it measures the value of all the newlyproduced goods and services in the economy. GDP is not a measure of the stock ofgoods and services in the economy—it does not tell us the value of all the goods andservices that exist in the economy.
For example, the number of new cars produced in the United States during a giventime period is a flow measure, while the number of cars in the United States is a stockmeasure. Therefore, only the former will count toward GDP. Similarly, U.S. GDP for2010 will count the value of new houses built in the United States in 2010 (a flow mea-sure), but it will not count the value of all homes in the United States (a stock measure).
The economist’s distinction between stocks and flows can be illustrated by picturingwater flowing into a bathtub from a tap. The water coming from the tap is a flow mea-sure, while the water that is in the bathtub is a stock measure. GDP in essence is mea-suring the flow from the tap (the new goods and services added to the economy) andnot the water in the tub (all the goods and services that already exist).
Three Ways to Measure GDP Economists measure GDP in three ways. Allthree give the same answer, but they refer to conceptually different activities in the econ-omy and provide different ways to think about GDP. All three are reported in the national
Distinguishing between Stocks and Flows
The economist’s distinction between stocks and flowscan be illustrated by picturing water flowing into and outof a lake—for example, the Colorado River flowing intoand out of Lake Powell behind Glen Canyon Dam. Whenmore water flows in than flows out, the stock of water inLake Powell rises. Similarly, a positive flow of inventoryinvestment raises the stock of inventory at a firm. Andjust as the stock of water falls when more water flows
out than flows in, negative inventory investment lowersthe stock of inventory.
The distinction between stocks and flows is useful inother economic applications as well. The factories inAmerica on December 31, 2010, are a stock. The numberof factories built during 2010 is a flow. The funds in yourchecking account are a stock. The deposit you made lastweek is a flow.
Glen Canyon Dam(700 feet high)
Inflow of wateris large in the spring,small in the fall.
A steady outflowof water generateselectricity.
The stock of water in the lake rises in the spring (26 million acre-feet when full) and declines in the fall.
Colorado River Colorado River Lake Powell
Ad
riel
He
ise
y/G
ett
yIm
ag
es
Measuring GDP 133
income and product accounts, the official U.S. government tabulation of GDP put to-gether by economists and statisticians at the U.S. Department of Commerce’s BEA.
The first way measures the total amount that people spend on goods and services madein the United States. This is the spending approach. The second way measures the totalincome that is earned by all the workers and businesses that produce American goods andservices. This is the income approach. In this approach, your income is a measure of whatyou produce. The third way measures the total of all the goods and services as they are pro-duced, or as they are shipped out of the factory. This is the production approach. Note thateach of the approaches considers the whole economy, and thus we frequently refer to themas aggregate spending, aggregate income, and aggregate production, in which case theword aggregate means total. Let us consider each of the three approaches in turn.
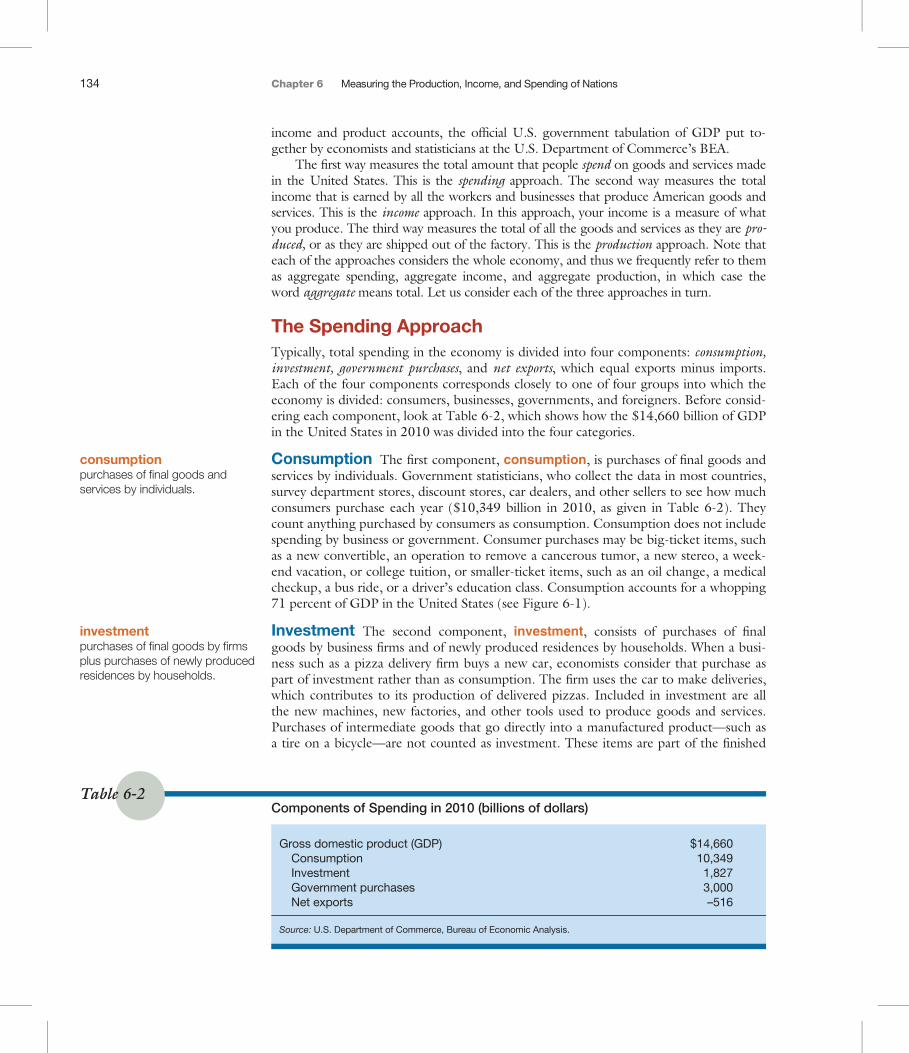
The Spending ApproachTypically, total spending in the economy is divided into four components: consumption,investment, government purchases, and net exports, which equal exports minus imports.Each of the four components corresponds closely to one of four groups into which theeconomy is divided: consumers, businesses, governments, and foreigners. Before consid-ering each component, look at Table 6-2, which shows how the $14,660 billion of GDPin the United States in 2010 was divided into the four categories.
Consumption The first component, consumption, is purchases of final goods andservices by individuals. Government statisticians, who collect the data in most countries,survey department stores, discount stores, car dealers, and other sellers to see how muchconsumers purchase each year ($10,349 billion in 2010, as given in Table 6-2). Theycount anything purchased by consumers as consumption. Consumption does not includespending by business or government. Consumer purchases may be big-ticket items, suchas a new convertible, an operation to remove a cancerous tumor, a new stereo, a week-end vacation, or college tuition, or smaller-ticket items, such as an oil change, a medicalcheckup, a bus ride, or a driver’s education class. Consumption accounts for a whopping71 percent of GDP in the United States (see Figure 6-1).
Investment The second component, investment, consists of purchases of finalgoods by business firms and of newly produced residences by households. When a busi-ness such as a pizza delivery firm buys a new car, economists consider that purchase aspart of investment rather than as consumption. The firm uses the car to make deliveries,which contributes to its production of delivered pizzas. Included in investment are allthe new machines, new factories, and other tools used to produce goods and services.Purchases of intermediate goods that go directly into a manufactured product—such asa tire on a bicycle—are not counted as investment. These items are part of the finished
Table 6-2Components of Spending in 2010 (billions of dollars)
Gross domestic product (GDP) $14,660Consumption 10,349Investment 1,827Government purchases 3,000Net exports –516
Source: U.S. Department of Commerce, Bureau of Economic Analysis.
consumptionpurchases of final goods andservices by individuals.
investmentpurchases of final goods by firmsplus purchases of newly producedresidences by households.
134 Chapter 6 Measuring the Production, Income, and Spending of Nations

product—the bicycle, in this case—purchased by consumers. We do notwant to count such items twice.
The new machines, factories, and other tools that are part of investmentin any year are sometimes called business fixed investment; this amounted to$1,415 billion in 2010. Government statisticians include two other items aspart of investment: inventory investment and residential investment.
Inventory investment is defined as the change in inventories, which arethe goods on store shelves, on showroom floors, or in warehouses that havenot yet been sold or assembled into a final form for sale. For example, carson the lot of a car dealer are part of inventories. When inventory investmentis positive, then inventories are rising. When inventory investment is nega-tive, then inventories are falling.
For example, if a car dealer had an inventory of 50 cars on December31, 2009, got 35 new cars shipped from the factory during 2010, and sold20 cars to consumers during the year, then the dealer’s inventory will be 65cars on December 31, 2010. The contribution of the car dealer to inven-tory investment for the year is positive 15 cars because the dealer’s inven-tory rose from 50 cars to 65 cars.
If, instead, the dealer had an inventory of 50 cars on December 31, 2009,got 35 new cars shipped from the factory during 2010, and sold 45 cars toconsumers during the year, then the dealer’s inventory will be 40 cars onDecember 31, 2010. The contribution of the car dealer to inventory investmentfor the year is negative 10 cars because the dealer’s inventory fell from 50 cars to 40 cars.
Inventory investment is included as a spending item when we compute GDPbecause we want an accurate measure of production. Consider the first car exampleagain. If we looked only at consumption, then we would have concluded that only 20cars were produced in the economy, even though 35 cars actually were produced. Weneed to add the 15 cars of inventory investment to the 20 cars of consumption to get anaccurate measure of production.
What happens when consumers eventually purchase the cars that the dealer has ininventory? Suppose, in 2011, consumers buy 25 of the cars that were in thedealer’s inventory. For 2011, consumption will rise by 25 cars, whereas in-ventory investment will be negative 25 cars, reflecting the fall in the dealer’sinventory. Adding 25 cars of consumption to negative 25 cars of inventoryinvestment gives zero cars added to overall GDP in 2011, which is justwhat we want because none of these cars were produced in 2011; wealready had counted them as production for 2010.
In 2010, inventory investment throughout the economy was $72 bil-lion. Some firms reduced inventories, but others added a greater amount.Inventory investment tends to fluctuate up and down and therefore plays abig role in the business cycle.
The other part of investment that is not business fixed investment isresidential investment, the purchase of new houses and apartment build-ings. About $340 billion worth of housing and apartments were con-structed in 2010. This was a dramatic decline from $757 billion in 2006.Although much of this was purchased by consumers rather than businesses,it is included in investment because it produces services: shelter and, insome cases, a place to relax and enjoy life.
Combining the three parts of investment, we find that investment was$1,827 billion in 2010: $1,415 billion of business fixed investment, $340billion of residential investment, and $72 billion of inventory investment.Investment was about 12 percent of GDP in 2010 (see Figure 6-2).
Figure 6-1Consumption as aShare of GDPConsumption was 71 percent of GDP in theUnited States in 2010.
100908070605040302010
PERCENT OF GDP
Consumption
71percent
Figure 6-2Investment andConsumption as a Share of GDP in 2010Investment is a much smaller share of GDPthan is consumption.
100908070605040302010
PERCENT OF GDP
Consumption71percent
Investment12percent
Measuring GDP 135

Note the special way the term investment is used in this discussion. To an economist,investment means the purchase of new factories, houses, or equipment. In everyday lan-guage, however, investment usually refers to an individual’s putting away some funds forthe future, perhaps in the stock market, such as ‘‘I’ll invest in the stock market.’’ Be sureto stay aware of this distinction.
Government Purchases The third component of spending, government pur-chases, is spending by federal, state, and local governments on new goods and services.Most U.S. government purchases are for the military. At the state and local levels, education,roads, and police dominate government purchases. Government purchases of goods andservices were equal to $3,000 billion in 2010 (see Figure 6-3).
Not all government outlays are included in government purchases. A government wel-fare payment or retirement payment to an individual is not a purchase of a good or service;it is a transfer payment of income from the government to an individual. Transfer paymentsdo not represent new production of anything, unlike the purchase of a weapon or a newroad or a new building. Because GDP measures the production of new goods and services,government outlays on transfer payments like social security, unemployment compensation,and welfare payments are excluded. Only purchases are counted because only these itemsrepresent something produced. Government outlays are purchases plus transfer payments.
Net Exports The final spending component is net exports, the difference betweenexports and imports. American exports are what Americans sell to foreigners, whether phar-maceuticals, computers, grain, or a vacation in Florida. American imports are what Ameri-cans buy from foreigners, whether cars, plasma televisions, shirts, or a vacation in France.Net exports are defined as exports minus imports. Net exports are a measure of how muchmore we sell to foreigners than we buy from foreigners. Another term for net exports is thetrade balance. If net exports are positive, we have a trade surplus. If net exports are nega-tive, we have a trade deficit. By these calculations, the United States had a trade deficit in2010: $1,838 billion in exports and $2,354 billion in imports. Hence, net exports were anegative $516 billion, and appear in Table 6-2 as –$516 billion.
Figure 6-3
100
90
80
70
60
50
40
30
20
10
PERCENT OF GDP
Consumption
Investment
Government purchases
71percent
12percent
20percent
Government Purchases,Investment, andConsumption as a Share ofGDP in 2010Government purchases as ashare of GDP are greater thaninvestment but less thanconsumption. When the stackedbar goes above the 100 percentline, negative net exports result(a trade deficit), as shown here.If the stacked bar stops belowthe 100 percent line, a tradesurplus results.
government purchasespurchases by federal, state, andlocal governments of new goodsand services.
net exportsthe value of exports minus thevalue of imports.
exportsthe total value of the goods andservices that people in one countrysell to people in other countries.
importsthe total value of the goods andservices that people in onecountry buy from people in othercountries.
trade balancethe value of exports minus thevalue of imports.
136 Chapter 6 Measuring the Production, Income, and Spending of Nations

Net exports are added in when computing GDP by the spending approach for tworeasons. First, we included foreign goods in consumption and investment spending. Forexample, an imported Toyota purchased at a car dealer in the United States is includedin consumption even though it is not produced in the United States. To measure what isproduced in the United States, that Toyota must be deducted. Thus, imports must besubtracted to get a measure of total production in the economy. The second reason isthat the exports that Americans sell abroad are produced in the United States, but theyare not counted in consumption or investment or government purchases in the UnitedStates. Thus, exports need to be added in to get a measure of production. Because, bydefinition, net exports are exports minus imports, adding net exports to spending is thesame as adding in exports and subtracting out imports. Adding net exports to totalspending kills two birds with one stone.
In 2010, the United States imported more than it exported, so the sum of consump-tion plus investment plus government purchases overstated what was produced in America.The sum of these three items exceeds GDP, as shown in Figure 6-3. In other words, GDPwas $516 billion less than the sum of consumption plus investment plus government pur-chases.
Algebraic Summary The notion that we can measure production by adding upconsumption, investment, government purchases, and net exports is important enoughto herald with some algebra.
Let the symbol C stand for consumption, I for investment, G for governmentspending, and X for net exports. Let Y stand for GDP because we use G for governmentpurchases. We will use these symbols many times again. The idea that production equalsspending can then be written as
Y ¼ C þ I þ G þ X
This equation states, using algebraic symbols, that production, Y, equals spending: con-sumption, C, plus investment, I, plus government purchases, G, plus net exports, X(meaning exports minus imports). In 2010, the values of these items (in billions of dol-lars) were as follows:
14,660 ¼ 10,349 þ 1,827 þ 3,000 þ (�516)
This simple algebraic relationship plays a key role in later chapters.
The Income ApproachThe income that people earn producing GDP in a country provides another measure ofGDP. To see why, first consider a simple example of a single business firm.
Suppose you start a wedding planning business. Your production and sales of wed-ding planning services in your first year is $50,000; this is the amount you are paid intotal by 50 people for the $1,000 service. To produce these services, you pay a cateringconsultant and a florist consultant $20,000 each, or a total of $40,000, which is yourtotal cost. Your profits are defined as the difference between sales and costs, or $50,000 –$40,000 ¼ $10,000. Now, if you add the total amount of income earned in the produc-tion of your wedding planning service—the amount earned by the two consultants plusthe profits you earn—you get $20,000 þ $20,000 þ $10,000. This sum of incomes isexactly equal to $50,000, which is the same as the amount produced. Thus, by adding upthe income of the people who produce the output of the firm, you get a measure of theoutput. The same idea is true for the country as a whole, which consists of many suchbusinesses and workers.
This is a key equationstating that productionequals spending.
Measuring GDP 137

To show how this works, we look at each of the income items in Table 6-3. We firstdescribe each of these items and then show that when we add the items up, we get GDP.
Labor Income Economists classify wages, salaries, and fringe benefits paid to work-ers as labor income, or payments to people for their labor. Wages refers to payments toworkers paid by the hour; salaries refers to payments to workers paid by the month oryear; and fringe benefits refers to retirement, health, and other benefits paid by firms onbehalf of workers. As shown in Table 6-3, labor income was $7,991 billion in 2010.
Capital Income Economists classify profits, rental payments, and interest paymentsas capital income. Profits include the profits of large corporations like General Motorsor Exxon and also the income of small businesses and farms. The royalties that an inde-pendent screenwriter receives from selling a movie script also are part of profits. Rentalpayments are income to persons who own buildings and rent them out. The rents theyreceive from their tenants are rental payments. Interest payments are income receivedfrom lending to business firms. Interest payments are included in capital income becausethey represent part of the income generated by the firms’ production. Because many indi-viduals pay interest (on mortgages, car loans, and so on) as well as receive interest (ondeposits at a bank and so on), interest payments are defined as the difference betweenreceipts and payments. Table 6-3 shows that capital income was $3,719 billion in 2010,much less than labor income. Capital income is about 45 percent of labor income.
Depreciation Depreciation is the amount by which factories and machines wearout each year. A remarkably large part of the investment that is part of GDP each yeargoes to replace worn-out factories and machines. Businesses need to replace depreciatedequipment with investment in new equipment just to maintain productive capacity—thenumber of factories and machines available for use.
The difference between investment, the purchases of final goods by firms, and deprecia-tion is called net investment, a measure of how much investment is new each year after depre-ciation is subtracted. Net investment was –$42 billion ($1,827 billion – $1,869 billion) in2010. This implies that the stock of physical capital actually fell in the United States in 2010.More machines wore out than were added to the economy. Sometimes the $1,827 billion ofinvestment, including depreciation, is called gross investment. The reason for the term gross ingross domestic product is that it includes gross investment, not just net investment.
When profits and the other parts of capital income are reported to government sta-tisticians, depreciation has been subtracted out. But depreciation must be included aspart of GDP because the new equipment that replaces old equipment must be producedby someone. Thus, when we use the income approach, it is necessary to add in deprecia-tion if we are to have a measure of GDP.
Table 6-3Aggregate Income and GDP in 2010 (billions of dollars)
Aggregate incomeLabor income (wages, salaries, fringe benefits) $ 7,991Capital income (profits, interest, rents) 3,719Depreciation 1,869Taxes, subsidies, and transfers 1,118Net income of foreigners –188Statistical discrepancy 151
Equals GDP 14,660
Source: U.S. Department of Commerce.
labor incomethe sum of wages, salaries, andfringe benefits paid to workers.
capital incomethe sum of profits, rentalpayments, and interest payments.
depreciationthe decrease in an asset’s valueover time; for capital, it is theamount by which physical capitalwears out over a given period oftime. (Ch. 16)
138 Chapter 6 Measuring the Production, Income, and Spending of Nations
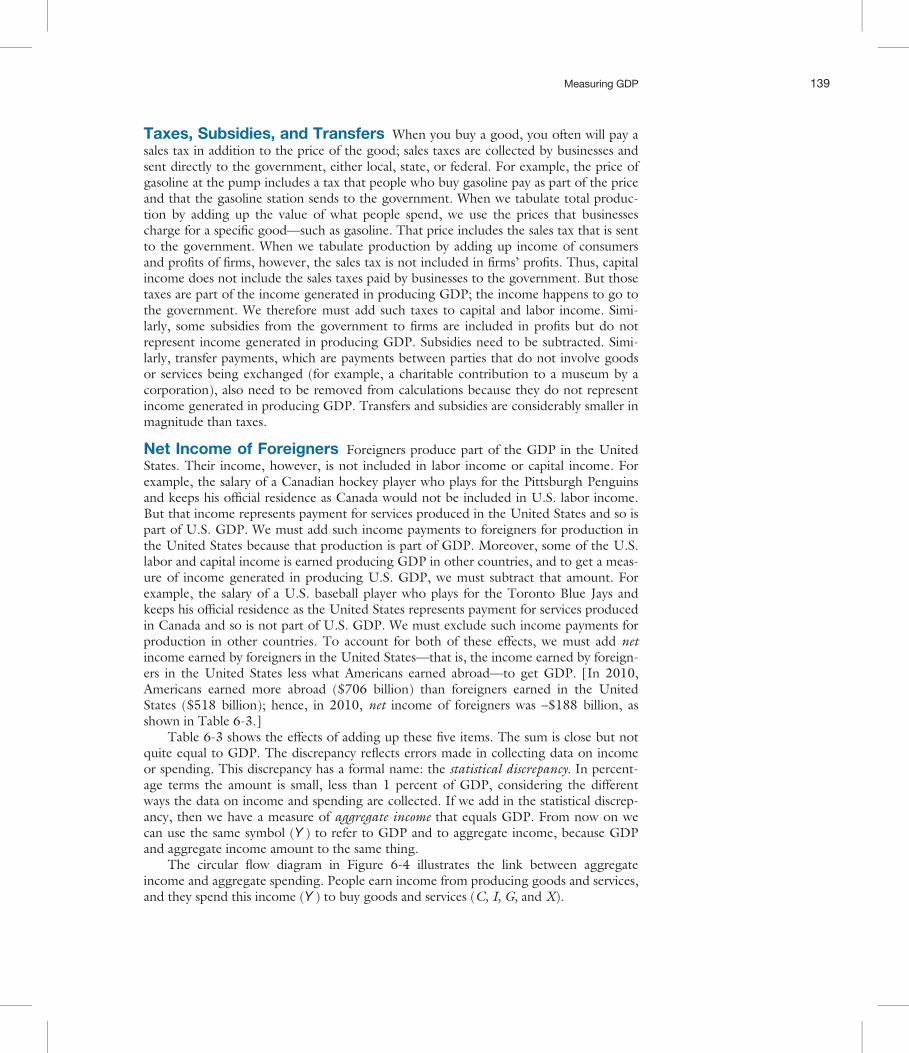
Taxes, Subsidies, and Transfers When you buy a good, you often will pay asales tax in addition to the price of the good; sales taxes are collected by businesses andsent directly to the government, either local, state, or federal. For example, the price ofgasoline at the pump includes a tax that people who buy gasoline pay as part of the priceand that the gasoline station sends to the government. When we tabulate total produc-tion by adding up the value of what people spend, we use the prices that businessescharge for a specific good—such as gasoline. That price includes the sales tax that is sentto the government. When we tabulate production by adding up income of consumersand profits of firms, however, the sales tax is not included in firms’ profits. Thus, capitalincome does not include the sales taxes paid by businesses to the government. But thosetaxes are part of the income generated in producing GDP; the income happens to go tothe government. We therefore must add such taxes to capital and labor income. Simi-larly, some subsidies from the government to firms are included in profits but do notrepresent income generated in producing GDP. Subsidies need to be subtracted. Simi-larly, transfer payments, which are payments between parties that do not involve goodsor services being exchanged (for example, a charitable contribution to a museum by acorporation), also need to be removed from calculations because they do not representincome generated in producing GDP. Transfers and subsidies are considerably smaller inmagnitude than taxes.
Net Income of Foreigners Foreigners produce part of the GDP in the UnitedStates. Their income, however, is not included in labor income or capital income. Forexample, the salary of a Canadian hockey player who plays for the Pittsburgh Penguinsand keeps his official residence as Canada would not be included in U.S. labor income.But that income represents payment for services produced in the United States and so ispart of U.S. GDP. We must add such income payments to foreigners for production inthe United States because that production is part of GDP. Moreover, some of the U.S.labor and capital income is earned producing GDP in other countries, and to get a meas-ure of income generated in producing U.S. GDP, we must subtract that amount. Forexample, the salary of a U.S. baseball player who plays for the Toronto Blue Jays andkeeps his official residence as the United States represents payment for services producedin Canada and so is not part of U.S. GDP. We must exclude such income payments forproduction in other countries. To account for both of these effects, we must add netincome earned by foreigners in the United States—that is, the income earned by foreign-ers in the United States less what Americans earned abroad—to get GDP. [In 2010,Americans earned more abroad ($706 billion) than foreigners earned in the UnitedStates ($518 billion); hence, in 2010, net income of foreigners was –$188 billion, asshown in Table 6-3.]
Table 6-3 shows the effects of adding up these five items. The sum is close but notquite equal to GDP. The discrepancy reflects errors made in collecting data on incomeor spending. This discrepancy has a formal name: the statistical discrepancy. In percent-age terms the amount is small, less than 1 percent of GDP, considering the differentways the data on income and spending are collected. If we add in the statistical discrep-ancy, then we have a measure of aggregate income that equals GDP. From now on wecan use the same symbol (Y ) to refer to GDP and to aggregate income, because GDPand aggregate income amount to the same thing.
The circular flow diagram in Figure 6-4 illustrates the link between aggregateincome and aggregate spending. People earn income from producing goods and services,and they spend this income (Y ) to buy goods and services (C, I, G, and X).
Measuring GDP 139

The Production ApproachThe third measure of GDP adds up the production of each firm or industry in the econ-omy. To make this method work, we must avoid the ‘‘double counting’’ problem dis-cussed earlier. For example, if you try to compute GDP by adding new automobiles tonew steel to new tires, you will count the steel and the tires that go into producing thenew automobiles twice. Thus, when we measure GDP by production, it is necessary tocount only the value added by each manufacturer. Value added is the value of a firm’sproduction less the value of the intermediate goods used in production. In other words,it is the value the firm adds to the intermediate inputs to get the final output. An auto-mobile manufacturer buys steel, tires, and other inputs and adds value by assembling thecar. When we measure GDP by production, we count only the value added at each levelof production. Figure 6-5 shows how adding up the value added for each firm involvedin producing a cup of espresso in the economy will automatically avoid double countingand give a measure of the final value of the cup of espresso when it is purchased at acoffeehouse or cafe. The same is true for the economy as a whole.
Figure 6-4The Circular Flow of Income and ExpenditureThis figure illustrates how aggregate expenditures equal aggregate income. Starting at the bottom right part of the figure,consumption (C) is joined by government purchases (G), investment (I), and net exports (X) to sum to aggregate expenditures(C þ I þ G þ X) on the left. At the top of the figure, this aggregate spending is received by firms that produce the goods, and theypay out aggregate income (Y) to households in the form of wages and salaries as well as rents, interest, and profits. Thegovernment takes in taxes and makes transfer payments and government purchases.
REST OF THEWORLD
Taxes
Consumption (C ) C
Transfers
Aggregateincome (Y )
C + I +G + X In
vest
men
t (I)
C + GC + I + G
Governmentpurchases (G )
Aggregateexpenditure (Y )
Netexports
(X )
FIRMS
CONSUMERSGOVERNMENT
Can be positiveor negative
value addedthe value of a firm’s productionminus the value of theintermediate goods used inproduction.
140 Chapter 6 Measuring the Production, Income, and Spending of Nations

Figure 6-5Value Added in Coffee: From Beans to EspressoBy adding up the value added at each stage of production, from coffee bean growing to espresso making, we get a measure ofthe value of a cup of espresso. Double counting is avoided. Using the same procedure for the whole economy permits us tocompute GDP by adding up production.
Cafe/espressobar
Value added by growing and picking beans
Value added by roasting and packaging
Value of beans
Value added by shipping and wholesaleservices
Igo
r Ste
po
vik/
Sh
utt
ers
toc
k.c
om
Value of roasted andpackagedbeans
Value added by espresso machine and service at a cafe
Value of shipped,roasted, andpackaged beanspurchased bya coffee retailer
Valu
e of
a c
up o
fes
pres
so ($
3.00
)
Coffeegrower
Coffeeroaster
Coffeeshipper andwholesaler
R E V I E W• GDP is a measure of all the goods and services newly
produced in the economy during some period of time.GDP is a flow measure—how many new goods andservices are being produced in the economy. It is not astock measure—how many goods and services exist inthe economy.
• GDP can be measured in three ways: by adding upall the spending in the economy, by adding up all theincome in the economy, and by adding up all theproduction in the economy. All three give the sameanswer.
• Spending in the economy can be placed inone of four categories—consumption,
investment, government purchases, and netexports.
• The sum of labor income; capital income; depreciation;taxes, subsidies, and transfers; and net income paid toforeigners gives another way to measure GDP.
• GDP also can be measured by adding upproduction, but with this method we must be carefulnot to double count. By adding up only the valueadded by each firm or industry, we automaticallyprevent double counting. Value added is thedifference between a firm’s sales and its paymentsfor intermediate inputs to production.
ma
ng
ost
oc
k/S
hu
tte
rsto
ck.
co
m
Measuring GDP 141

SavingAnother important macroeconomic measure is the total amount of saving undertaken byan economy. Investment and saving have an important symbiotic relationship. To seewhy this is, consider what would happen if you wanted to build a factory that makesshoes. To build the factory, you would have to either use your own (or a friend or familymember’s) saving or borrow money from a bank. But the money that a bank lends toyou will be some other individual’s saving. Therefore the total amount of saving is ameasure of the amount of resources the country has available for investment, either in itsown country or abroad. Similarly, the total amount of investment depends on how muchsaving is available from that country and from other countries.
Countries with a high level of saving have a greater ability to undertake investmentprojects than countries with a low level of saving. A country with a low level of saving,however, can increase investment if people and firms in other nations are willing to lendto or invest their own saving in that country. The U.S. economy in recent years has beenable to sustain a high level of investment even when U.S. saving was low. In this section,we will define the concept of national saving and show how it is calculated.
Individual SavingFor an individual, saving is defined as income less taxes and consumption. If you earn$25,000 in income during the year and pay taxes of $5,000 while spending $18,000 onconsumption—food, rent, and movies, for example—by definition, your saving for theyear is $2,000 ($25,000 – $5,000 – $18,000). But if you instead spend $23,000 onfood, rent, and movies for the year, then your saving is –$3,000; you will have to eithertake $3,000 out of the bank or borrow $3,000.
National SavingFor a country, saving is defined in a similar manner: by subtracting from a country’seconomy what is consumed. We subtract government purchases of goods and services inaddition to consumer purchases. National saving, the sum of all saving in the economy,is defined as income less consumption and government purchases. That is,
National saving ¼ income – consumption – government purchases
Using the symbol S for national saving and the symbols already introduced for income (Y),consumption (C), and government purchases (G), we define national saving as follows:
S ¼ Y – C – G
Using the numbers from Table 6-2, national saving in 2010 was $1,311 billion($14,660 billion – $10,349 billion – $3,000 billion).
The major component of national saving is private saving: the sum of all savings byindividuals in the economy. Some people save a lot, some do not save at all, and someare dissaving—that is, they have negative saving. For example, when people retire, theyusually consume a lot more than their income—they are dissaving. When people aremiddle aged, their income is usually greater than their consumption—they are saving.Most young people either save very little or, if they are able to borrow, dissave. Wedefine private savings using the symbol T for taxes, as follows:
Private saving ¼ Y – C – T
A country, however, also has a government, and so we need to include governmentsaving in our calculation of national saving. What do we mean by saving by the
total amount of savinga measure of the amount ofresources that a country has forinvestment, either in its owncountry or abroad.
national savingaggregate income minusconsumption minus governmentpurchases.
Algebraic definition ofnational saving.
142 Chapter 6 Measuring the Production, Income, and Spending of Nations

government? The difference between the government’s receipts from taxes and the gov-ernment’s expenditures, the budget balance, is called government saving. When the bal-ance is positive, a budget surplus results—that is, the government is saving. When thebalance is negative, a budget deficit results—that is, the government is dissaving. Alge-braically, we define government saving as follows:
Government saving ¼ T – G
Combining private and government saving, we see that
Private savingþ government saving ¼ ðY � C� TÞ þ ðT �GÞ ¼ ðY � C�GÞPrivate savingþ government saving ¼ national saving
Measuring Real GDPEconomists also are interested in assessing how the economy is changing over time. Forexample, they might want to know how rapidly the production of goods and services inIndia has grown over the last decade, and how that increase compares with the change inChina’s economy. However, the value of goods and services in an economy, as measured byGDP, is determined by both the quantity of goods and services produced and the price ofthese goods and services. Thus, an increase in the prices of all goods and services will makemeasured GDP grow, even if the amount of production in the economy does not increase.
Suppose, for example, that the prices of all goods in the economy double and thatthe number of items produced of every good remains the same. The dollar value of theseitems then will double even though physical production does not change. A $10,000 carwill become a $20,000 car, a $10 CD will become a $20 CD, and so on. Thus, GDP willdouble as well. Clearly, GDP is not useful for comparing production at different dateswhen all prices increase. Although the example of doubling all prices is extreme, we doknow from Chapter 5 that prices on the average tend to rise over time—a tendency thatwe have called inflation. Thus, when inflation exists, GDP becomes an unreliable meas-ure of the changes in production over time.
Adjusting GDP for InflationReal GDP is a measure of production that corrects for inflation. To emphasize the dif-ference between GDP and real GDP, we will use the term nominal GDP to refer towhat previously has been defined as GDP.
R E V I E W• National saving is an important macroeconomic
variable because it is a measure of the resourcesthat a country has available for investment, either inits own economy or abroad.
• A country with a high level of national savingcan have a high level of investment if it desires.A country with a low level of national saving canhave a high level of investment only if people in othercountries are willing to lend their savings to or investthem in the low-saving country.
• National saving is defined as income minusconsumption minus government purchases. It canbe decomposed into the sum of private saving andgovernment saving.
• Private saving equals income minus consumptionminus taxes. Government saving is the differencebetween government tax receipts and governmentexpenditures, also known as the budget balance.
real GDPa measure of the value of all thegoods and services newlyproduced in a country during someperiod of time, adjusted for changesin prices over time. (Ch. 5)
nominal GDPgross domestic product withoutany correction for inflation; thesame as GDP; the value of all thegoods and services newlyproduced in a country duringsome period of time, usually ayear.
Measuring Real GDP 143
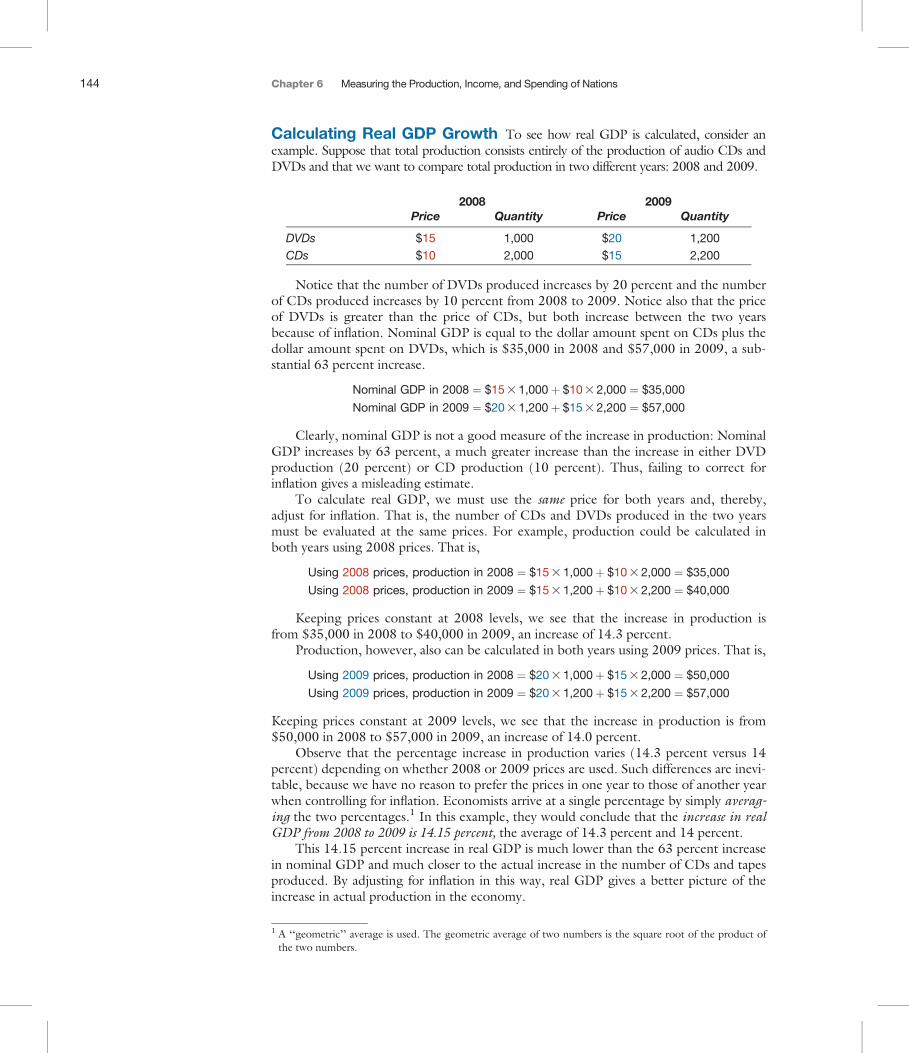
Calculating Real GDP Growth To see how real GDP is calculated, consider anexample. Suppose that total production consists entirely of the production of audio CDs andDVDs and that we want to compare total production in two different years: 2008 and 2009.
2008 2009Price Quantity Price Quantity
DVDs $15 1,000 $20 1,200CDs $10 2,000 $15 2,200
Notice that the number of DVDs produced increases by 20 percent and the numberof CDs produced increases by 10 percent from 2008 to 2009. Notice also that the priceof DVDs is greater than the price of CDs, but both increase between the two yearsbecause of inflation. Nominal GDP is equal to the dollar amount spent on CDs plus thedollar amount spent on DVDs, which is $35,000 in 2008 and $57,000 in 2009, a sub-stantial 63 percent increase.
Nominal GDP in 2008 ¼ $15 3 1,000þ $10 3 2,000 ¼ $35,000
Nominal GDP in 2009 ¼ $20 3 1,200þ $15 3 2,200 ¼ $57,000
Clearly, nominal GDP is not a good measure of the increase in production: NominalGDP increases by 63 percent, a much greater increase than the increase in either DVDproduction (20 percent) or CD production (10 percent). Thus, failing to correct forinflation gives a misleading estimate.
To calculate real GDP, we must use the same price for both years and, thereby,adjust for inflation. That is, the number of CDs and DVDs produced in the two yearsmust be evaluated at the same prices. For example, production could be calculated inboth years using 2008 prices. That is,
Using 2008 prices, production in 2008 ¼ $15 3 1,000þ $10 3 2,000 ¼ $35,000
Using 2008 prices, production in 2009 ¼ $15 3 1,200þ $10 3 2,200 ¼ $40,000
Keeping prices constant at 2008 levels, we see that the increase in production isfrom $35,000 in 2008 to $40,000 in 2009, an increase of 14.3 percent.
Production, however, also can be calculated in both years using 2009 prices. That is,
Using 2009 prices, production in 2008 ¼ $20 3 1,000þ $15 3 2,000 ¼ $50,000
Using 2009 prices, production in 2009 ¼ $20 3 1,200þ $15 3 2,200 ¼ $57,000
Keeping prices constant at 2009 levels, we see that the increase in production is from$50,000 in 2008 to $57,000 in 2009, an increase of 14.0 percent.
Observe that the percentage increase in production varies (14.3 percent versus 14percent) depending on whether 2008 or 2009 prices are used. Such differences are inevi-table, because we have no reason to prefer the prices in one year to those of another yearwhen controlling for inflation. Economists arrive at a single percentage by simply averag-ing the two percentages.1 In this example, they would conclude that the increase in realGDP from 2008 to 2009 is 14.15 percent, the average of 14.3 percent and 14 percent.
This 14.15 percent increase in real GDP is much lower than the 63 percent increasein nominal GDP and much closer to the actual increase in the number of CDs and tapesproduced. By adjusting for inflation in this way, real GDP gives a better picture of theincrease in actual production in the economy.
1 A ‘‘geometric’’ average is used. The geometric average of two numbers is the square root of the product ofthe two numbers.
144 Chapter 6 Measuring the Production, Income, and Spending of Nations
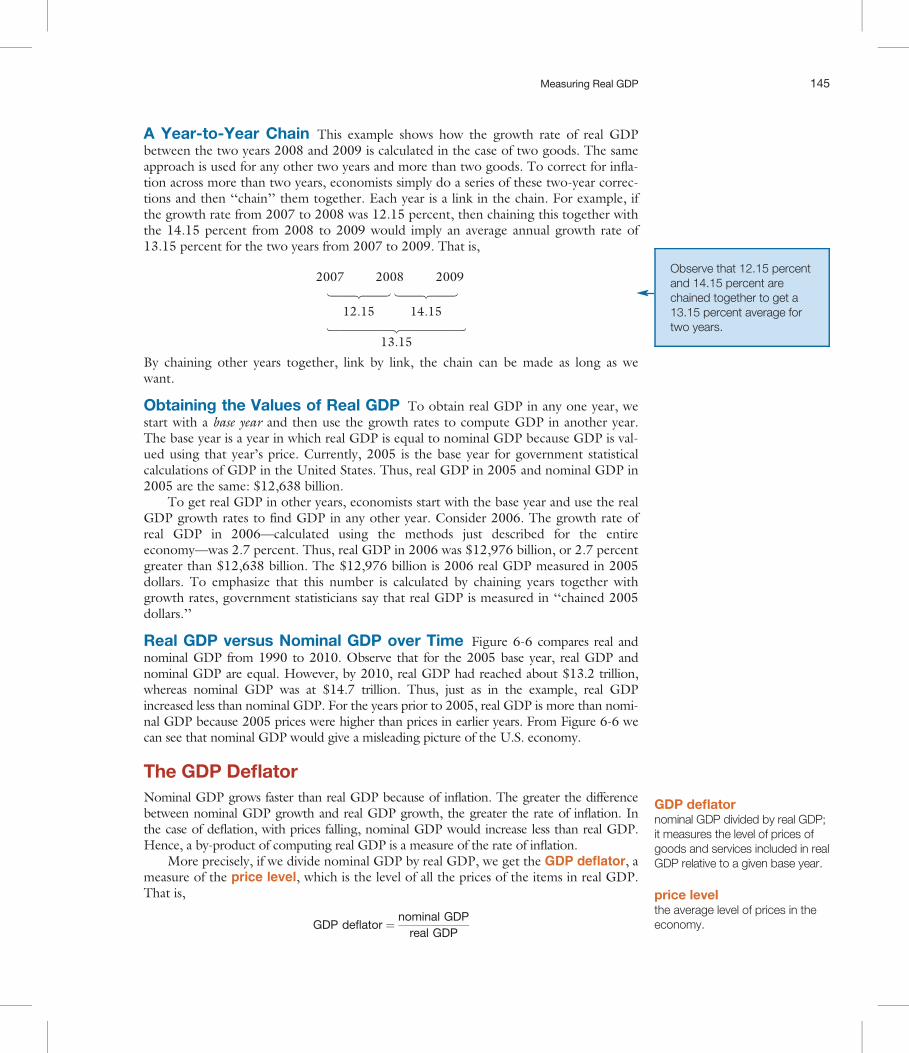
A Year-to-Year Chain This example shows how the growth rate of real GDPbetween the two years 2008 and 2009 is calculated in the case of two goods. The sameapproach is used for any other two years and more than two goods. To correct for infla-tion across more than two years, economists simply do a series of these two-year correc-tions and then ‘‘chain’’ them together. Each year is a link in the chain. For example, ifthe growth rate from 2007 to 2008 was 12.15 percent, then chaining this together withthe 14.15 percent from 2008 to 2009 would imply an average annual growth rate of13.15 percent for the two years from 2007 to 2009. That is,
2007 2008 2009
12.15 14.15
13.15
By chaining other years together, link by link, the chain can be made as long as wewant.
Obtaining the Values of Real GDP To obtain real GDP in any one year, westart with a base year and then use the growth rates to compute GDP in another year.The base year is a year in which real GDP is equal to nominal GDP because GDP is val-ued using that year’s price. Currently, 2005 is the base year for government statisticalcalculations of GDP in the United States. Thus, real GDP in 2005 and nominal GDP in2005 are the same: $12,638 billion.
To get real GDP in other years, economists start with the base year and use the realGDP growth rates to find GDP in any other year. Consider 2006. The growth rate ofreal GDP in 2006—calculated using the methods just described for the entireeconomy—was 2.7 percent. Thus, real GDP in 2006 was $12,976 billion, or 2.7 percentgreater than $12,638 billion. The $12,976 billion is 2006 real GDP measured in 2005dollars. To emphasize that this number is calculated by chaining years together withgrowth rates, government statisticians say that real GDP is measured in ‘‘chained 2005dollars.’’
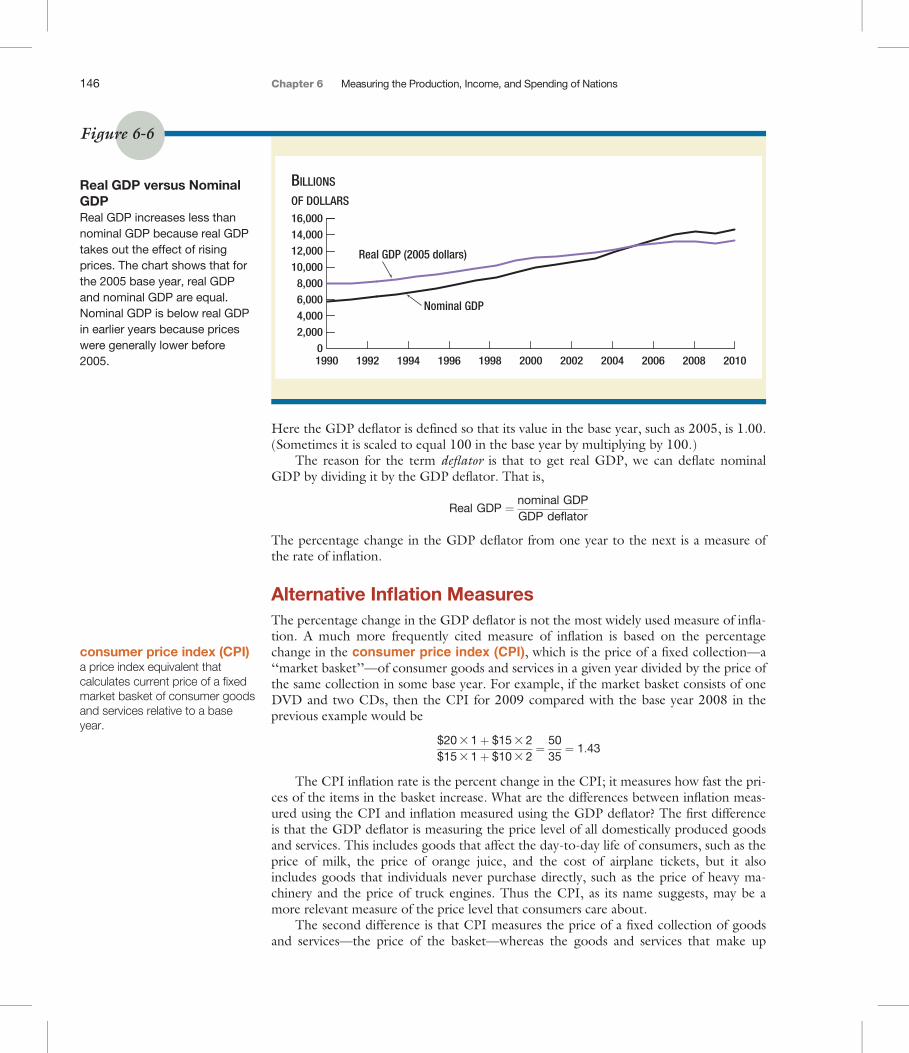
Real GDP versus Nominal GDP over Time Figure 6-6 compares real andnominal GDP from 1990 to 2010. Observe that for the 2005 base year, real GDP andnominal GDP are equal. However, by 2010, real GDP had reached about $13.2 trillion,whereas nominal GDP was at $14.7 trillion. Thus, just as in the example, real GDPincreased less than nominal GDP. For the years prior to 2005, real GDP is more than nomi-nal GDP because 2005 prices were higher than prices in earlier years. From Figure 6-6 wecan see that nominal GDP would give a misleading picture of the U.S. economy.
The GDP DeflatorNominal GDP grows faster than real GDP because of inflation. The greater the differencebetween nominal GDP growth and real GDP growth, the greater the rate of inflation. Inthe case of deflation, with prices falling, nominal GDP would increase less than real GDP.Hence, a by-product of computing real GDP is a measure of the rate of inflation.
More precisely, if we divide nominal GDP by real GDP, we get the GDP deflator, ameasure of the price level, which is the level of all the prices of the items in real GDP.That is,
GDP deflator ¼ nominal GDPreal GDP
Observe that 12.15 percentand 14.15 percent arechained together to get a13.15 percent average fortwo years.
GDP deflatornominal GDP divided by real GDP;it measures the level of prices ofgoods and services included in realGDP relative to a given base year.
price levelthe average level of prices in theeconomy.
Measuring Real GDP 145
Here the GDP deflator is defined so that its value in the base year, such as 2005, is 1.00.(Sometimes it is scaled to equal 100 in the base year by multiplying by 100.)
The reason for the term deflator is that to get real GDP, we can deflate nominalGDP by dividing it by the GDP deflator. That is,
Real GDP ¼ nominal GDPGDP deflator
The percentage change in the GDP deflator from one year to the next is a measure ofthe rate of inflation.
Alternative Inflation MeasuresThe percentage change in the GDP deflator is not the most widely used measure of infla-tion. A much more frequently cited measure of inflation is based on the percentagechange in the consumer price index (CPI), which is the price of a fixed collection—a‘‘market basket’’—of consumer goods and services in a given year divided by the price ofthe same collection in some base year. For example, if the market basket consists of oneDVD and two CDs, then the CPI for 2009 compared with the base year 2008 in theprevious example would be
$20 3 1þ $15 3 2$15 3 1þ $10 3 2
¼ 5035¼ 1:43
The CPI inflation rate is the percent change in the CPI; it measures how fast the pri-ces of the items in the basket increase. What are the differences between inflation meas-ured using the CPI and inflation measured using the GDP deflator? The first differenceis that the GDP deflator is measuring the price level of all domestically produced goodsand services. This includes goods that affect the day-to-day life of consumers, such as theprice of milk, the price of orange juice, and the cost of airplane tickets, but it alsoincludes goods that individuals never purchase directly, such as the price of heavy ma-chinery and the price of truck engines. Thus the CPI, as its name suggests, may be amore relevant measure of the price level that consumers care about.
The second difference is that CPI measures the price of a fixed collection of goodsand services—the price of the basket—whereas the goods and services that make up
Figure 6-6
Nominal GDP
Real GDP (2005 dollars)
BILLIONS
OF DOLLARS
0
2,000
4,000
6,000
8,000
10,000
12,000
14,000
16,000
1990 1992 1994 1996 1998 2000 2002 2004 2006 2008 2010
Real GDP versus NominalGDPReal GDP increases less thannominal GDP because real GDPtakes out the effect of risingprices. The chart shows that forthe 2005 base year, real GDPand nominal GDP are equal.Nominal GDP is below real GDPin earlier years because priceswere generally lower before2005.
consumer price index (CPI)a price index equivalent thatcalculates current price of a fixedmarket basket of consumer goodsand services relative to a baseyear.
146 Chapter 6 Measuring the Production, Income, and Spending of Nations

GDP, and hence are measured by the GDP deflator, change from year to year. The useof a fixed collection of goods and services in the CPI is one of the reasons economiststhink the CPI overstates inflation. When the price of goods rises, the quantity demandedshould decline; when the price falls, the quantity demanded should rise. Thus, by notallowing the quantities to change when the price changes, the CPI puts too muchweight on items with rising prices and too little weight on items with declining prices.The result is an overstatement of inflation; in other words, by assuming that people buyno less of the goods and services that have increased in price and buy no more of thegoods and services that have decreased in price, the CPI tends to indicate that priceshave gone up by more than they really have. During the 1990s, a group of economistsappointed by the U.S. Senate and chaired by Michael Boskin of Stanford Universityfound that the government, by adjusting expenditures according to this overstated CPI,was spending billions of dollars more than it would with a correct CPI. Hence, gettingthe economic statistics right makes a big difference.
The third difference between the CPI and the GDP deflator is that the CPI marketbasket can include goods and services that are produced in other countries, whereas theGDP deflator, by definition, will measure the price of domestically produced goods andservices. In countries where imported goods lack good domestic substitutes, inflationmeasured using the CPI may be a better measure of the difficulties that both people andbusinesses in the economy face.
Figure 6-7 shows how measures of inflation using the GDP deflator and the CPIcompare. The general inflation movements are similar, but the CPI is more volatile. TheGDP deflator and the CPI each have strengths and weaknesses relative to the other. Soyou should think of them as alternative ways of measuring price levels and inflation rates,rather than as competing measurements.
Yet another measure of inflation is the producer price index (PPI), which measuresthe prices of raw materials and intermediate goods as well as the prices of final goods soldby producers. Prices of raw materials—oil, wheat, and copper—sometimes are watchedcarefully because they give early warning signs of increases in inflation.
Figure 6-7
CPI inflation
Deflatorinflation
INFLATION RATE
(PERCENT PER YEAR)
–2.00%0.00%2.00%4.00%6.00%8.00%
10.00%12.00%14.00%16.00%
1960
1962
1964
1966
1968
1970
1972
1974
1976
1978
1980
1982
1984
1986
1988
1990
1992
1994
1996
1998
2000
2002
2004
2006
2008
2010
Comparison of Measures ofInflationMeasuring inflation with eitherthe CPI or the GDP deflatorshows the rise in inflation in the1960s and 1970s and the lowerinflation in the 1980s and 1990s.The CPI is more volatile: Itbounces around more. (Theinflation rate is based on yearlypercent changes in the statedvariable.)
Measuring Real GDP 147
Shortcomings of the GDP MeasureAlthough nominal GDP is the best measure of overall production that we have, it is defi-cient in several ways. You need to understand what these limitations are, so that you canmake informed judgments about what is really happening in the economy. NominalGDP has three main types of limitations: (1) revisions to GDP can change the assess-ment of the economy; (2) some types of production are omitted from GDP; and (3) theproduction of goods and services is only part of what affects the quality of life. Whenyou compare two countries, the one with a higher level of GDP is not necessarily betteroff than the one with a lower level of GDP.
Revisions to GDPGovernment statisticians obtain data on GDP from surveys of stores and businesses, andeven from income tax data from the Internal Revenue Service. Not all of these data arecollected quickly. Data on sales at stores and large firms come in within a month; how-ever, data on exports and imports take several months. Some income tax data arereported only once a year. Information about small firms comes in even more slowly.
For this reason, the statistics on GDP frequently are revised as new data come in.For those who use the GDP data to make decisions, either in business or in government,faulty data on GDP, which are apparent only when the data are revised, can lead to mis-takes. Revisions of GDP are inevitable and occur in all countries. These revisions can bequite large in magnitude. For example, in January 2006, the first estimate for GDP forthe fourth quarter of 2005 was given as $12.735 trillion. In March 2006, the ‘‘final revi-sion’’ of that number was given as $12.766 trillion, a difference of almost $30 billion.
Omissions from GDPGiven the description of how GDP is calculated, you will hardly be surprised to hear thatproduction that does not occur in a formal market is difficult for government statisticiansto measure. Examples include work done in the home and illegal commerce. The otherprincipal difficulty in calculating GDP is how to deal with quality improvements ingoods. Both of these problems are explained in more detail.
R E V I E W• Nominal GDP changes when either the quantity of
goods and services changes or the prices of thosegoods and services change. Therefore the change innominal GDP is not a good measure of how thephysical amount of production in the economy ischanging over time.
• Economists use real GDP when they want tocompare production over time. Real GDP correctsnominal GDP for inflation by measuring theproduction of goods and services in the dollars of agiven base year, such as 2005.
• The GDP deflator is a measure of the price level in theeconomy. It is defined as the ratio of nominal GDP to
real GDP. The percentage change in the GDP deflatorfrom year to year is a measure of the inflation rate.
• The CPI is the most widely used measure of the pricelevel in the economy. It is defined as the price of arepresentative market basket of goods and services,relative to the price of that basket in a base year. Thepercentage change in the CPI from year to year is themost widely used measure of the inflation rate.
• Some important differences exist between the CPIand the GDP deflator. Each has strengths andweaknesses compared with the other. You shouldthink of them as alternative ways of measuring pricelevels and inflation rates.
148 Chapter 6 Measuring the Production, Income, and Spending of Nations
Home Work and Production Much of the production that people do athome—making dinner or a sweater, changing the car oil or a baby’s diapers, cutting thegrass or the kids’ hair—is productive activity, but it is not included in GDP because thetransactions are not recorded in the markets in which statisticians measure spending.Such production would be included in GDP if people hired and paid someone else to doany of these things. So if you look after your young siblings after school while yourparents are at work, that typically will not count toward GDP, whereas if your parentswere to take your siblings to a day-care center and pay for child-care services, that wouldcount toward GDP. Some home production is included in GDP. If you run a mail orderor telemarketing business out of your home and pay taxes on your income, for example,then this production likely will be counted in GDP.
Leisure Activity Much leisure activity is not included in GDP even though it maybe enjoyable. Going to the beach or hiking in the mountains more often and workingless might be something you decide to do as your income increases. If people start takingFriday afternoons off, GDP will go down, but the level of well-being may increase. Theconsumption of leisure is omitted from GDP unless it involves a purchase in the market,such as a ticket to a movie or a ballgame.
The Underground Economy A large amount of production is not counted inGDP because it is purposely hidden from the view of the government. Illegal activity—growing marijuana in the California coastal range, selling pharmaceuticals not yetapproved by the Food and Drug Administration—is excluded from GDP because no onewants to report this activity to the government. People who get cash payments—perhapsin the form of tips at hotels or restaurants, or babysitting money from a neighbor—maynot report this income, perhaps to avoid taxes, and thus it also is not counted. If peopledo not report interest on a loan to a friend or relative, this, too, is omitted from GDP.
The sum of all the missing items is referred to as the underground economy. Esti-mates of the size of the underground economy are understandably uncertain. Theyrange from about 10 percent of GDP in the United States to about 25 percent in Italyto more than 40 percent in Peru.
The underground economy makes GDP a less useful measure of the size of an econ-omy, and we should be aware of this fact when we use GDP. But the underground econ-omy does not render GDP useless. It is unlikely that the underground economy growsmuch more or much less rapidly than the rest of the economy. Changes in laws can increaseor decrease the incentives to produce outside the legal market economy, but these changesare unlikely to be large enough to affect the estimated growth rates of GDP by much.
Quality Improvements Our measure of GDP sometimes misses improvements inthe quality of goods and services. For example, a $1,000 notebook computer purchasedin 2010 may be of substantially better quality than a $2,000 notebook computer purchasedin 2005. So the price of the notebook computer not only has fallen by 50 percent, but infact the quality-adjusted price also has fallen by even more. Government statisticians, espe-cially in industrial countries like the United States, have developed sophisticated techniquesto measure the quality-adjusted price change of a good accurately. These techniques, how-ever, do not always work perfectly, especially when the improvements are in hard-to-measureattributes. So, for example, the government statisticians can look at the amount of memory,the speed of the processor, and the storage capacity of the hard drive to gauge how much thequality of the notebook computer has improved; however, they may not be able to gauge aseffectively the quality improvements that make a new model car more comfortable and betterable to absorb shocks than the old model.
Shortcomings of the GDP Measure 149