Measuring Food Enviroments: A Historical Perspective
35
Measuring Food Enviroments: A Historical Perspective Karen Glanz, Ph.D., M.P.H. Rollins School of Public Health Emory University NCI Workshop: Measures of the Food and Built Environments: Enhancing Research Relevant to Policy on Diet, Physical Activity, Weight
Transcript of Measuring Food Enviroments: A Historical Perspective

Measuring Food Enviroments: A Historical Perspective
Karen Glanz, Ph.D., M.P.H.Rollins School of Public Health
Emory University
NCI Workshop: Measures of the Food and Built Environments: Enhancing Research Relevant to Policy on Diet, Physical Activity, Weight

Why measure food environments?
Food environments are complex – and different
Traditions/streams of measurement
Roles for measures in the current obesity epidemic
Focus forward toward the present and future

Environmental Causes of Obesity
• Increased eating• Decreased energy expenditure
Environments are believed to be important among the multiple levels of determinants of nutrition and physical activity

To make significant progress in the area of eating & nutrition environments…* we need valid, reliable measures of nutrition environments and policies… that are also practical

An Ecological Framework Depicting the Multiple Influences on What People Eat
Individual Factors
(personal)
Social Environment(networks)
Macro-level Environments
(sectors)
Physical Environments
(settings)
HomeWorksitesSchool, AfterschoolChild-careNeighborhoods & CommunitiesRestaurants & fast food outletsSupermarketsConvenience & corner stores
AccessAvailabilityBarriersOpportunities
Cognitions (e.g. attitudes, preferences, knowledge, values)Skills and behaviorsLifestyleBiological (e.g. genes, gender, age)Demographics (e.g. income, race/ethnicity)
Outcome expectationsMotivationsSelf-efficacyBehavioral capability
Societal and cultural norms and valuesFood and beverage industryFood marketing and mediaFood and agriculture policiesEconomic systemsFood production & distribution systemsGovernment & political structures and policiesFood assistance programsHealth care systemsLand use and transportation
PracticesLegislative, regulatory, or policy actions
FamilyFriendsPeers
Role modelingSocial supportSocial norms
Story et al., ARPH, 2007

Social Environment(networks)
Macro-level Environments
(sectors)
Physical Environments
(settings)
HomeWorksitesSchool, AfterschoolChild-careNeighborhoods & CommunitiesRestaurants & fast food outletsSupermarketsConvenience & corner stores
AccessAvailabilityBarriersOpportunities
Societal and cultural norms and valuesFood and beverage industryFood marketing and mediaFood and agriculture policiesEconomic systemsFood production & distribution systemsGovernment & political structures and policiesFood assistance programsHealth care systemsLand use and transportation
PracticesLegislative, regulatory, or policy actions
FamilyFriendsPeers
Role modelingSocial supportSocial normsStory et al., ARPH, 2007

Macro-level Environments
(sectors)
Physical Environments
(settings)
HomeWorksitesSchool, AfterschoolChild-careNeighborhoods & CommunitiesRestaurants & fast food outletsSupermarketsConvenience & corner stores
AccessAvailabilityBarriersOpportunities
Societal and cultural norms and valuesFood and beverage industryFood marketing and mediaFood and agriculture policiesEconomic systemsFood production & distribution systemsGovernment & political structures and policiesFood assistance programsHealth care systemsLand use and transportation
PracticesLegislative, regulatory, or policy actions
Story et al., ARPH, 2007

Nutrition/Food vs PA Environments
Food is a commodityFood products are big businessFood is highly regulated
(safety, taxation, hygiene)Complex (nutrients, foods)Organizational environments
may play a bigger roleNot as advanced as PA
environment measures fora range of current needs
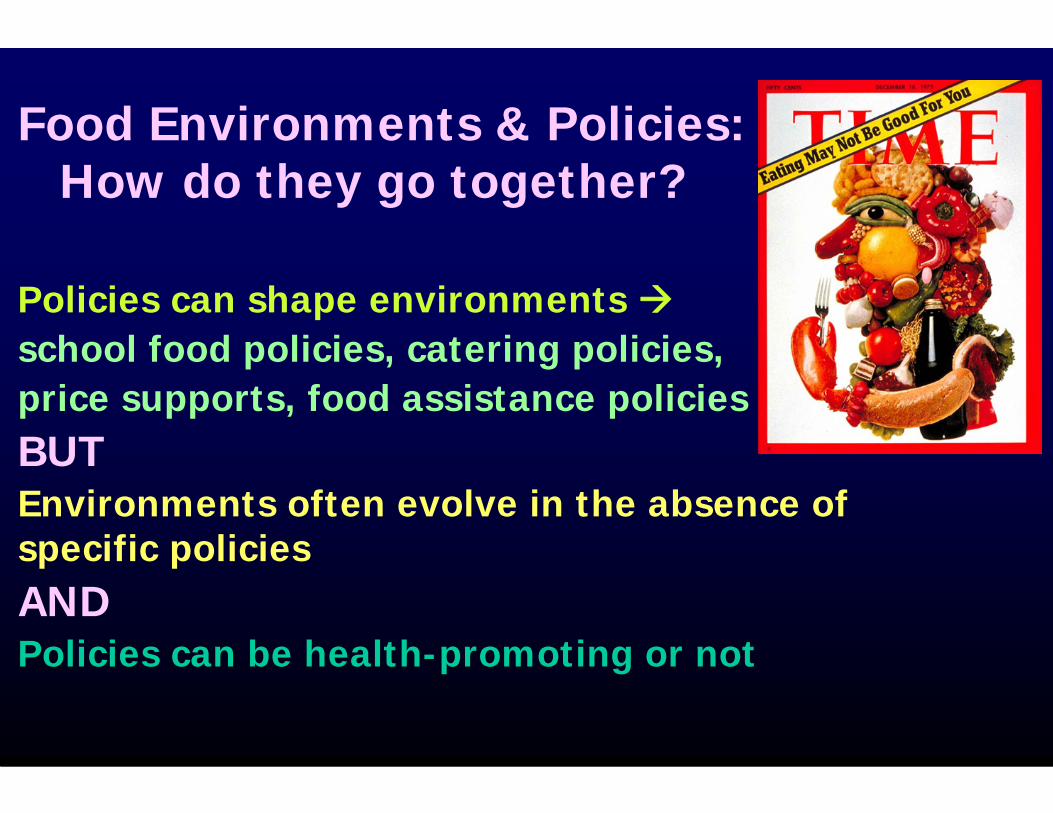
Food Environments & Policies: How do they go together?
Policies can shape environments school food policies, catering policies,price supports, food assistance policiesBUTEnvironments often evolve in the absence of specific policiesANDPolicies can be health-promoting or not

Model of Community Nutrition Environments
[Glanz, Sallis, Saelens, & Frank 2005]
Policy Variables Environmental Variables Individual Variables Behavior
GovernmentGovernmentandand
Industry PolicyIndustry Policy
Community Nutrition Community Nutrition EnvironmentsEnvironments
•Type & Location of FoodOutlets (stores, restaurants)
•Accessibility – hours of Operation, drive-thru)
Organizational Organizational Nutrition EnvironmentsNutrition Environments
Home
Work
School
Other
Consumer Nutrition EnvironmentConsumer Nutrition Environment•Available healthy options
•Price, promotion, placement
•Nutrition Information
SocioSocio--demographicsdemographics
PsychosocialPsychosocialFactorsFactors
Perceived Perceived NutritionNutrition
EnvironmentsEnvironments
EatingEatingPatternsPatterns
Information Information EnvironmentEnvironment
(Media, Advertising)(Media, Advertising)

Macro level: food and agriculture policies
Economics and pricing
Food marketing and media influences
Organizational food environments & policies
Community food environments
Consumer food environments
Traditions/Streams of Measuring Food Environments*
* U.S.-focused summary
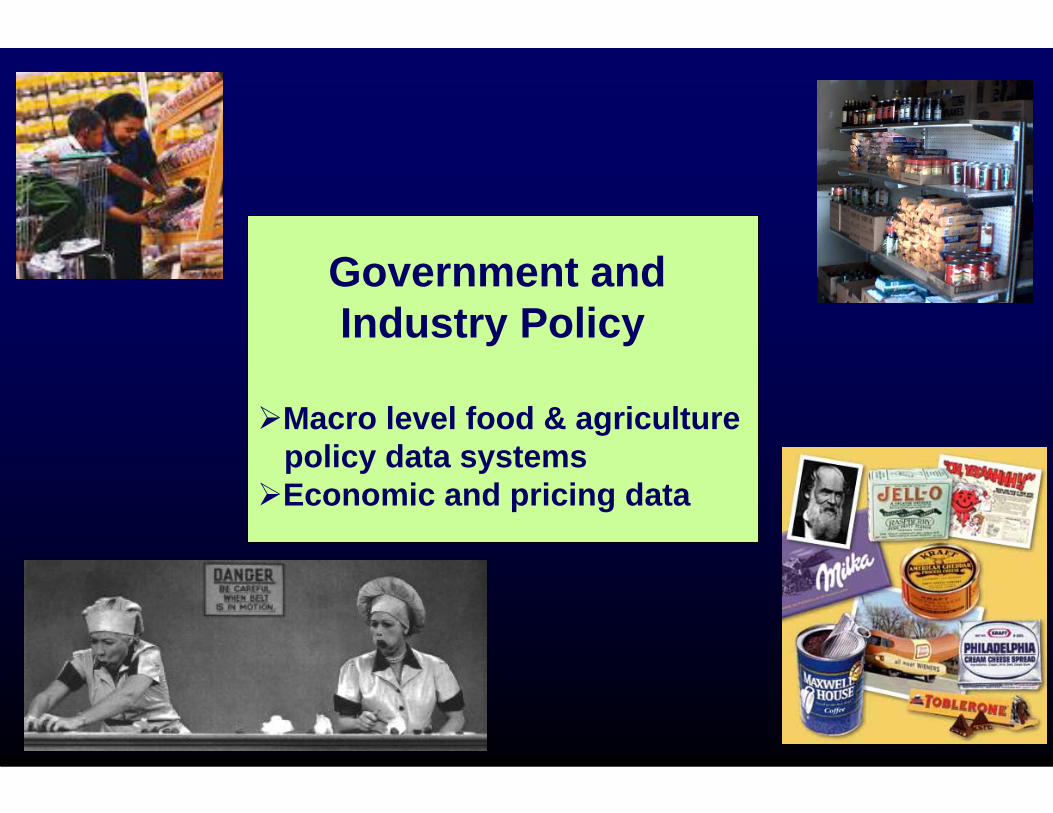
Government andIndustry Policy
Macro level food & agriculture policy data systemsEconomic and pricing data
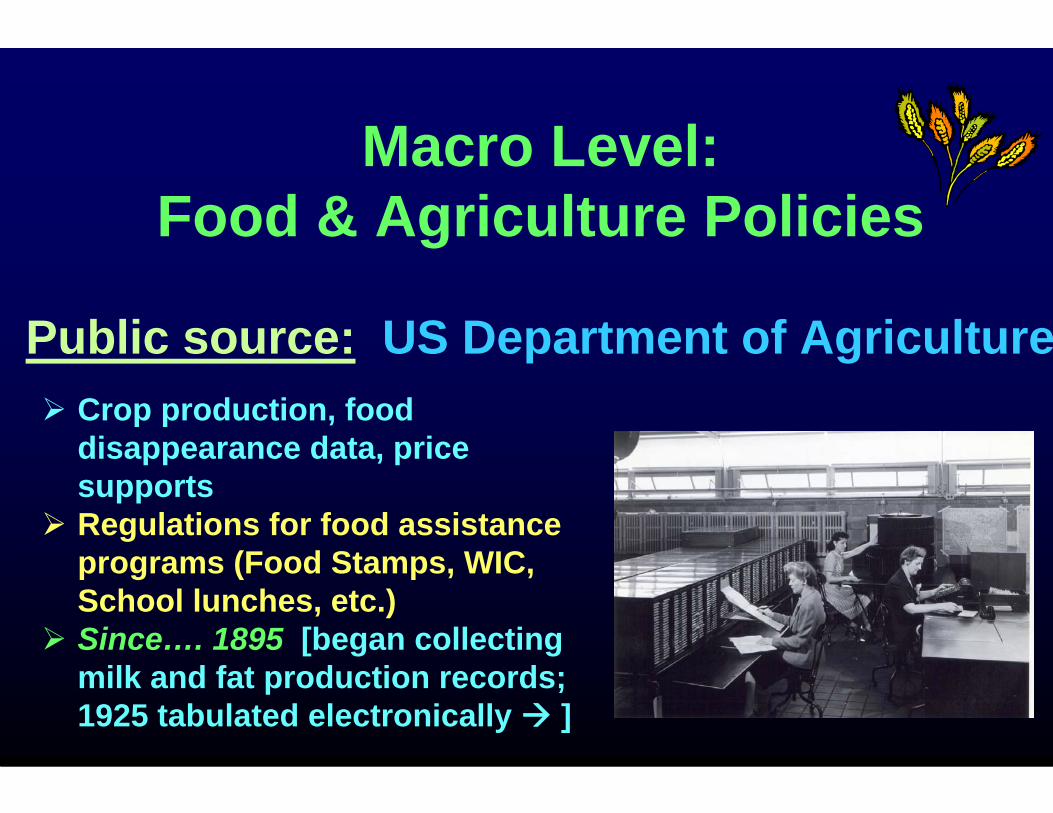
Crop production, food disappearance data, price supportsRegulations for food assistance programs (Food Stamps, WIC, School lunches, etc.) Since…. 1895 [began collecting milk and fat production records; 1925 tabulated electronically ]
Macro Level: Food & Agriculture Policies
Public source: US Department of Agriculture

Economic & Pricing Data(and sales data)
Public sources: US Department of Agriculture – Economic Research Service
Commercial sources: food industry – corporations, industry groups and tracking services
How valid are sources? Historical data—unknown quality/applicability

Soft Drink Single Serving Size, 1950 - 2002
8 ounces 12 ounces 20 ounces 42 ounces4¢ per oz.5¢ per oz. 2.3¢ per
oz.
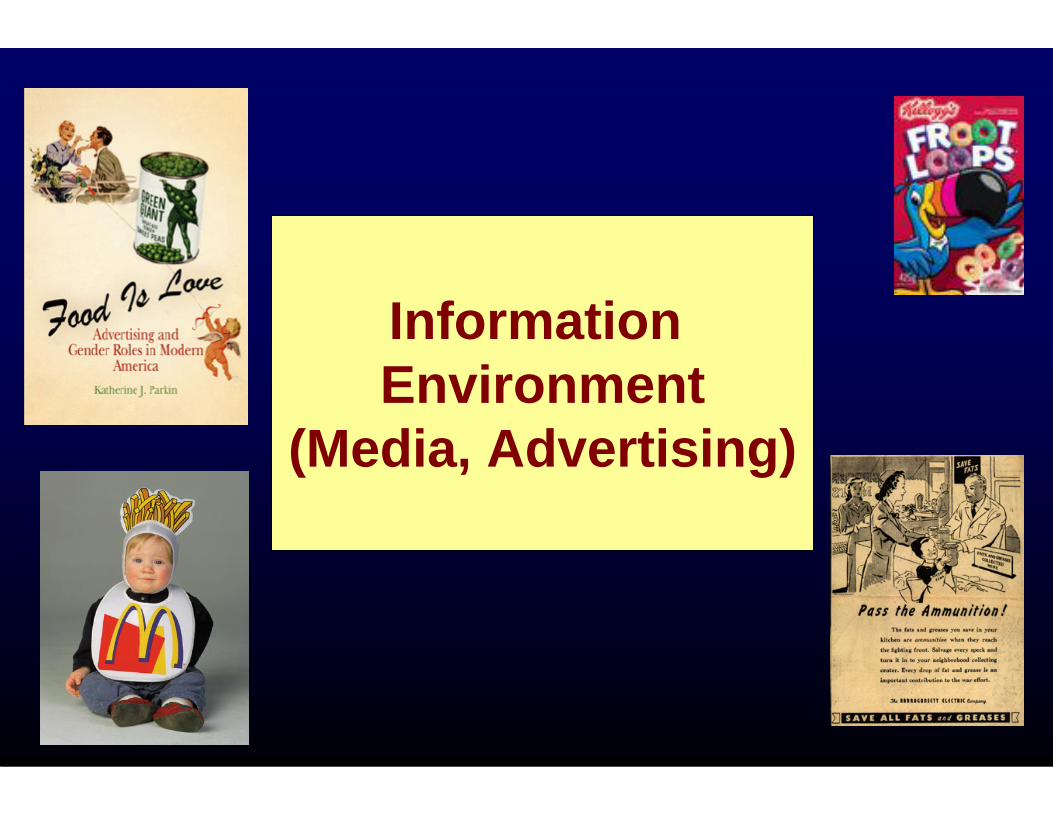
Information Environment
(Media, Advertising)

with permission from McDonald’s Corporation
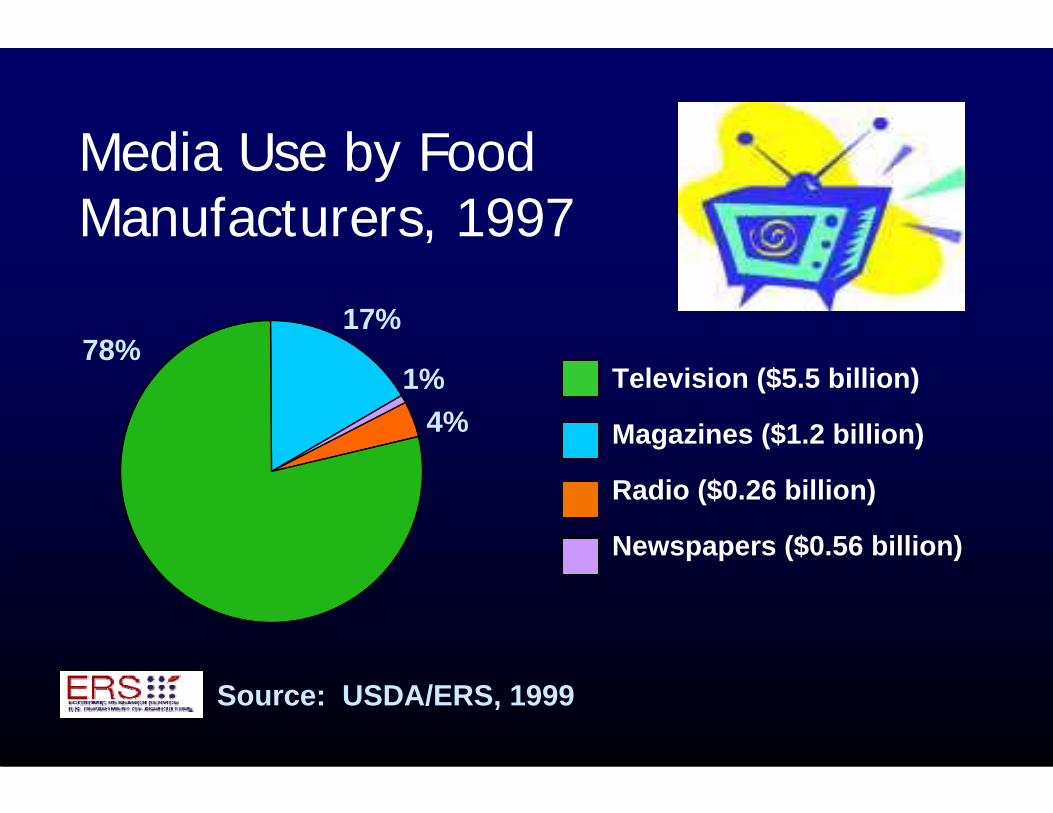
Media Use by Food Manufacturers, 1997
Source: USDA/ERS, 1999
78%17%
1%4%
Television ($5.5 billion)
Magazines ($1.2 billion)
Radio ($0.26 billion)
Newspapers ($0.56 billion)

Total Food-Related Advertising, 1999
63%
29%
8%Processed Food$7.2 billion (63%)
Eating / Drinking Places$3.4 billion (29%)
Food Stores$0.9 billion (8%)
Source: USDA/ERS, 2001

Food Marketing and Food Marketing and Media InfluencesMedia Influences
Puppets as FastFood Promotion in 1960-70’s
Television & other broadcast media: tracked by Nielsen Media Research – since the 1920’s
Print and electronic media: 111 media tracking services currently active (a growing business)
Food advertising: tracked by USDA’s Economic Research Svc

Organizational Nutrition Environments
Home
Work
School
Other
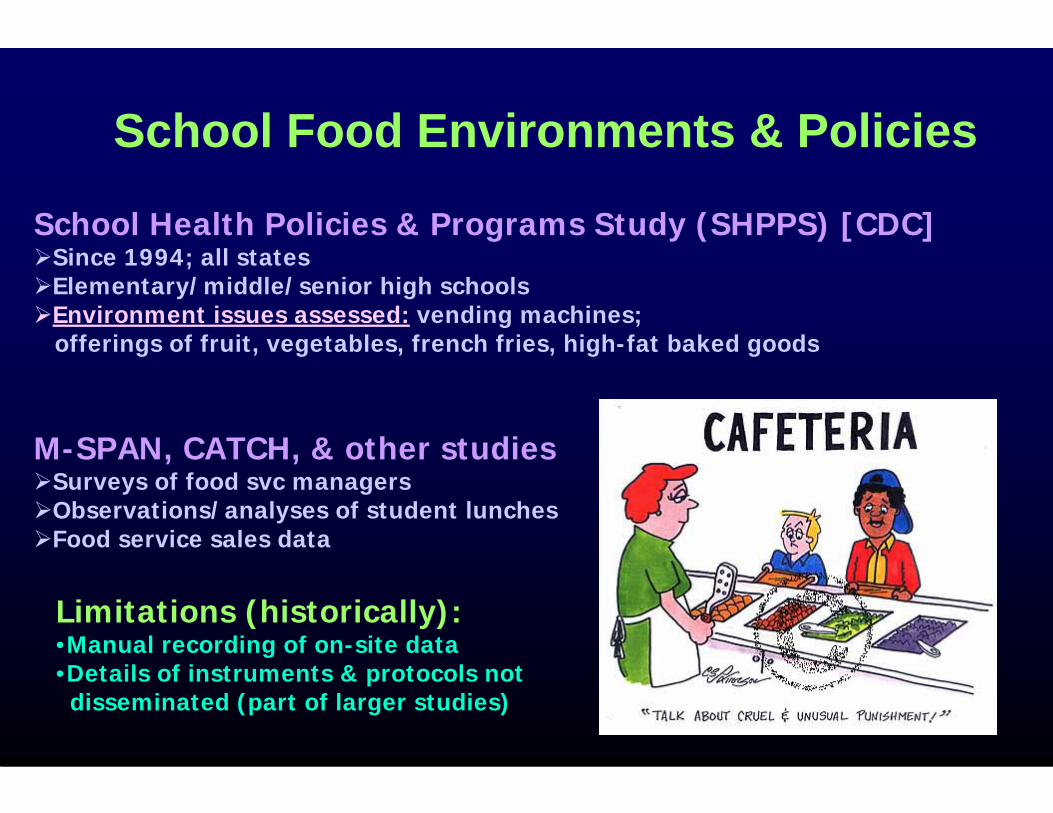
School Food Environments & Policies
School Health Policies & Programs Study (SHPPS) [CDC]Since 1994; all statesElementary/middle/senior high schoolsEnvironment issues assessed: vending machines; offerings of fruit, vegetables, french fries, high-fat baked goods
M-SPAN, CATCH, & other studiesSurveys of food svc managersObservations/analyses of student lunchesFood service sales data
Limitations (historically):•Manual recording of on-site data•Details of instruments & protocols not
disseminated (part of larger studies)

Worksite Food Environments & Policies
Mainly used in intervention studies
Example: Working Well Trial (Biener, Glanz et al. 1998)Multicomponent assessmentAccess to healthy food, nutrition informationFound to be associated with intervention + self-report
Example: Section of CHEW (Australia)(Oldenburg, Sallis, et al. 2002; dev 1995)Audit tool, included nutrition information,canteen (cafeteria), vending machinesUsed NHF ‘tick’ to indicate healthful choicesHigh reliability (0.8-1.0)

Community & Consumer Nutrition Environments
Community nutrition environments = •Type & location of food outlets•Accessibility (e.g., hours, drive-thru)
Consumer nutrition environments = •Availability of healthful food choices•Pricing, promotion, placement•Information availability

Community Nutrition Environments
•Type & Location of FoodOutlets (stores, restaurants)
•Accessibility – hours of Operation, drive-thru)

Grocery Stores
Convenience Stores
Supermarkets Snack ShopsConvenience Stores Vending Farmer’s Markets MachinesInternet Groceries
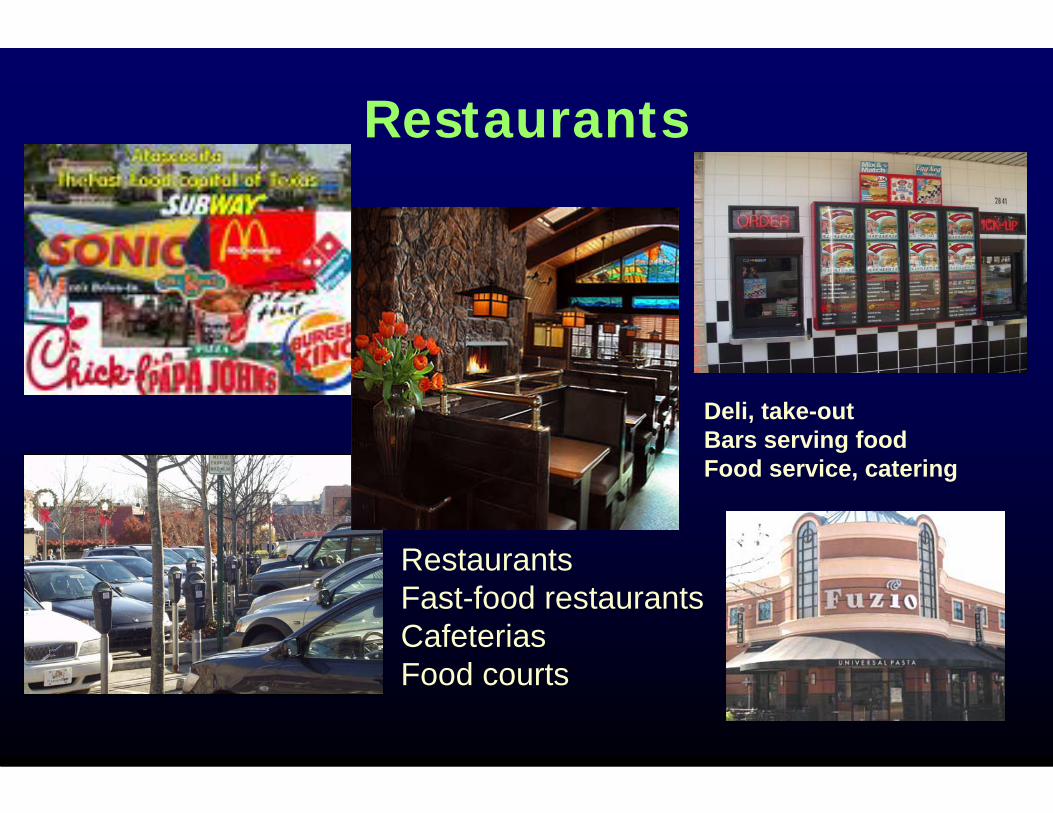
Restaurants
RestaurantsFast-food restaurantsCafeterias Food courts
Deli, take-outBars serving foodFood service, catering

Community Food Environments: Objective Data Sources
Or, ‘where are places to get food’?
Public SourcesGovernment: Food licenses (retail & food service)Other: Yellow Pages, Online directories, etc.
Commercial SourcesDun & Bradstreet, InfoUSA, others
Issues: Completeness? Up-to-date? Accuracy? High turnoverWang et al. [IJBNPA, 2007] –• compared sources of historical data on food stores• State Board vs business directories: 127 vs 351 food stores• State Board had 36 added stores, directories showed 260 more

Consumer Nutrition Environments
•Available healthy options•Price, promotion, placement
•Nutrition Information
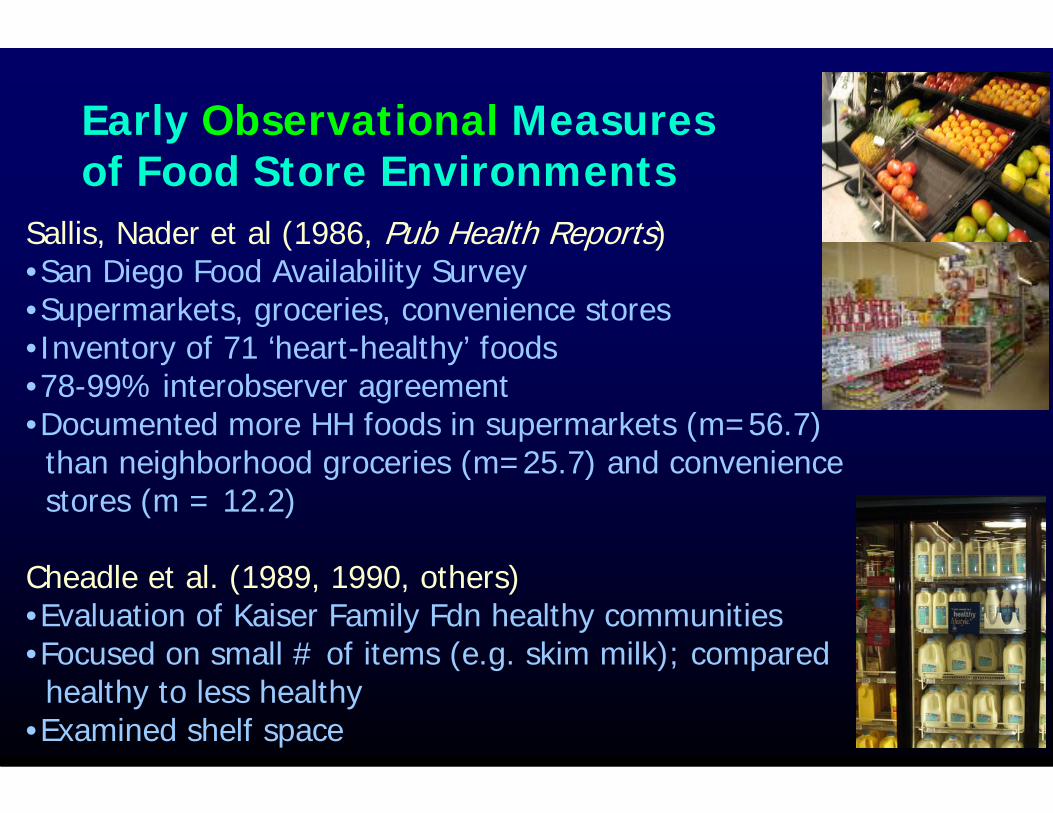
Early Observational Measures of Food Store Environments
Sallis, Nader et al (1986, Pub Health Reports)•San Diego Food Availability Survey•Supermarkets, groceries, convenience stores•Inventory of 71 ‘heart-healthy’ foods•78-99% interobserver agreement•Documented more HH foods in supermarkets (m=56.7)than neighborhood groceries (m=25.7) and conveniencestores (m = 12.2)
Cheadle et al. (1989, 1990, others)•Evaluation of Kaiser Family Fdn healthy communities•Focused on small # of items (e.g. skim milk); comparedhealthy to less healthy
•Examined shelf space

• Reports [‘factual’] – e.g., how far to nearest store, where do you shop, where do you eat out?
• Perceptions [‘opinion/attitude’] – how easy/hard is it to find…? How expensive are…?
• Sources of measures/scales: not too ‘old’ –Echeverria et al. 2004 (4 items); NQLS study (unpublished)
• Important distinction! Report vs perception
Self-Reported Measures of Consumer Nutrition Environments

Emergence of the currentobesity epidemic – roles for food environment measures
Describe environments & variation across them (including disparities)Defined neighborhoods + macro analysesPerceived – reported – archival measuresAssess environment ID needed interventionsEvaluate interventions
• Research + practical needs
• Standards for measurement
• Meaningful measures (Nutrients? Foods? Policies?)
• Adaptable, disseminablemeasures
Focus toward the Present and Future

The Fork is in the Road…

Thank you!