Measuring Farm Level Sustainability with the Teagasc ... · Measuring Farm Level Sustainability...
27
Measuring Farm Level Sustainability with the Teagasc National Farm Survey Thia Hennessy, Cathal Buckley, Emma Dillon, Trevor Donnellan, Kevin Hanrahan, Brian Moran and Mary Ryan Agricultural Economics & Farm Surveys Department Rural Economy and Development Programme Teagasc Athenry, Co. Galway www.teagasc.ie December 10 th 2013 ISBN 978-1-84170-604-7
Transcript of Measuring Farm Level Sustainability with the Teagasc ... · Measuring Farm Level Sustainability...

Measuring Farm Level
Sustainability
with the
Teagasc National Farm
Survey
Thia Hennessy, Cathal Buckley, Emma Dillon,
Trevor Donnellan, Kevin Hanrahan, Brian Moran
and Mary Ryan
Agricultural Economics & Farm Surveys Department
Rural Economy and Development Programme
Teagasc
Athenry, Co. Galway
www.teagasc.ie
December 10th 2013 ISBN 978-1-84170-604-7


An increasing number of so-called “Grand Challenges” for food and agriculture have emerged in the first decade of the 21st century. These include population growth, climate change, energy, water supply and re-emerging diseases, all of which affect the potential of agriculture to provide a secure supply of safe food for a rapidly growing population. Hence, the sustainable intensification of agricultural production is emerging as a major priority for policymakers and international development agencies. Sustainable intensification has been defined as producing more from the same area of land while reducing negative environmental impacts and increasing contributions to natural capital and the flow of environmental services. It is therefore important for Ireland to establish a system that allows us to assess the sustainability status of Irish farming. In this context, I welcome this Teagasc initiative to develop a set of farm-level sustainability indicators for Ireland. Sustainability Indicators are an important means of improving transparency, accountability and ensuring the success of monitoring, controlling and evaluating the sustainable intensification of Irish farming. I particularly welcome that this initiative is being developed through our Teagasc National Farm Survey (NFS) resource. The NFS is the only nationally representative and objectively collected data source on farming in Ireland. The data collected through this survey are both verifiable and representative of the sector, both important attributes when measuring sustainability. This report marks the beginning of an innovative process within Teagasc to develop indicators to capture the multi-dimensional nature of farm sustainability, encompassing economic, environmental, social and innovation indicators, which can be used to reveal data trends over time. This report will be the first in a series of periodical publications on farm level sustainability and while the present report presents interesting results for farming in Ireland, it is important to emphasise that the indicators developed are likely to evolve over time reflecting scientific and data availability developments in this important area of research. It is also important to stress that the true value of a report on sustainability indicators, such as this one, is not the interpretation of the absolute values in a given time period but to examine the trends which will emerge in the coming decades.
Professor Gerry Boyle
Director, Teagasc
Foreword


A series of farm level sustainability indicators for Ireland, developed using data from the Teagasc National Farm Survey are presented within this report. Four dimensions, reflecting the multifaceted nature of sustainability (economic, environmental, social and innovation) are considered. Within this multidimensional framework a set of farm level indicators encompassing each dimension was constructed. The advantages of using Teagasc National Farm Survey data for the development of such indicators include the objective, verifiable and representative nature of the data. This coupled with the wide spectrum of variables recorded make it an ideal data source for the development of sustainability indicators and for the credible reporting of changes to national agricultural sustainability trends. In evaluating the economic sustainability of Irish farms five indicators are reported upon: productivity of land use, productivity of labour, profitability, market orientation and economic viability. Given the wealth of data within the National Farm Survey the design of economic indicators is relatively straightforward. Measurement of environmental sustainability is however somewhat more complicated. As a result, a lengthy discussion with regard to priority areas is contained within the report. This outlines potential areas of importance where further environmental data could be assessed. Four environmental indicators are currently reported: total greenhouse gas emissions per farm, greenhouse gas emissions per unit of product, greenhouse gas emissions emanating from energy and fuel use and nitrogen balance per hectare. Social sustainability indicators are designed here to gauge the quality of life of the farming community with five indicators considered: the economic vulnerability of the farm, the demography of the farm household, risk of isolation, work-life balance and education level. Finally, the use of innovation indicators within the sustainability framework is a relatively new concept. Such indicators can help gauge how innovation can impact on farm level sustainability. Three innovative farm practices deemed appropriate to each of the farm systems analysed are considered here. An analysis of the indicators across farm systems indicates that Dairy farms, followed by Tillage, tend to be the most economically sustainable. Results further indicate a wide variation with regard to environmental performance. Despite this, a consistent pattern within each of the farm systems is the correlation between economic performance and environmental sustainability. In relation to greenhouse gas emissions in particular, the top performing farms (in an economic sense) also tend to be best performing farms from an environmental sustainability perspective, in other words they emit relatively less greenhouse gases per unit of product produced. However, the same cannot be said with regard to nitrogen. While nitrogen use efficiency is positively correlated with economic performance, nitrogen balance tends to be negatively correlated i.e., the top performing economic farms tend to produce a greater surplus of nitrogen per hectare. From a social perspective Dairy and Tillage farms tend to be the most sustainable but the differences across systems are not as pronounced as with the economic indicators. Demography in particular tends to be correlated with economic performance, whereby the economically better performing farms also tend to have households of a younger age profile. It should be noted that the report does not draw any conclusions about cause and effect. Finally, adoption of innovative farm practices was shown to be highly correlated with farm economic performance, however no conclusion is drawn as to which indicator drives the other. The report concludes with a discussion on future work with regard to farm level sustainability measurement and in particular highlights the importance of the continued publication of indicators to facilitate an ongoing assessment of the overall progress of the farm sector.
Executive Summary

1
The concept of sustainability is one of the forefront issues in global agricultural production and food marketing at present, given mounting pressure to increase food production in both a socially responsible and environmentally friendly way. Despite this, debate over the precise meaning of the term sustainability and the most appropriate way to measure it continues. Nonetheless, a meaningful measure is required if the sustainability concept is to guide policy. The 1987 Brundtland Report “Our Common Future” defined sustainable development as “development which meets the needs of the present without compromising the ability of future generations to meet their own needs.” Although differences exist in the interpretation and definition of agricultural sustainability, there exists an overall consensus in emphasizing the multidimensional goals of sustainable agricultural development. Reflecting the multifaceted nature of sustainability, indicators have been designed to measure economic, environmental and social sustainability. Analysing agricultural sustainability through the lens of economic growth, environmental protection and social progress is often referred to as the triple P approach; Profit, Planet and People.
Recent studies of farm sustainability have acknowledged the role that innovation can play in the sustainable intensification of the agri-food sector and as such, the concept of sustainability has been broadened to encompass innovation. Farm sustainability remains difficult to measure. Some argue that precise measurement is impossible as it is site-specific and dynamic. Many studies use an indicator approach where indicators are used to judge whether a certain development contributes to movement in ‘the right direction’ rather than serving as a precisely defined benchmark. The development of farm level indicators here serves as a starting point from which future trends in sustainability can be examined.
Sustainability indicators are quantifiable and measurable attributes of a system that are judged to be related to its sustainability. They are statistical constructs which support decision-making by revealing trends in data that can then be used to analyse results of policy actions. Ideally, they can provide an early warning of potential economic, social or environmental damage. Indicators should be limited in number and easy to interpret. The development of indicators assists in the evaluation of the sustainable intensification of Irish farming, but will depend on the availability of good quality data updated at regular intervals. Indicator development is an iterative process as, particularly in the area of environmental sustainability, the development of novel scientific methodologies will necessitate further data collection. As such indicator design will evolve over time. The quantification of agricultural sustainability through a large set of indicators can be difficult to interpret and it may be useful to aggregate a set of indicators into a single index or composite indicator. However, there is some debate as to the usefulness of composite indicators; they are helpful in that they can summarise complex issues and are easy to interpret, but may lack accuracy unless well constructed.
SUSTAINABLE AGRICULTURE
ECONOMIC
ENVIRONMENT
SOCIAL
INNOVATION
Sustainability Indicators
What is Sustainability?

2
A farm sector which is sustainable and efficient is a primary objective of European agricultural policy. Indeed sustainability is a key element towards a profitable future for farming. Therefore, the requirement for procedures to measure sustainability within an integrated framework at the farm level is increasingly recognised. Farm level sustainability indicators, encompassing the four facets of sustainability, economic, environmental, social and innovation are developed here in an integrated framework to gauge the current sustainability of Irish farming. Indicators were chosen according to their overall suitability within the context of the Irish socio-economic situation and are being developed using Teagasc National Farm Survey (NFS) data. NFS data are particularly suitable for the design of indicators as the collection method is consistent and verifiable, both important issues for objective credible, national reporting. Furthermore, the longitudinal nature of the data makes it possible to chart indicators over time. While the fact that the NFS is linked to a harmonised international database (The Farm Accountancy Data Network of the EU) opens up the possibility of engaging in international comparative studies in the future. The indicators developed are examined by system and aggregated nationally. These can be evaluated annually. As already alluded to indicator design will evolve over time reflecting relevant scientific and data availability developments. Indeed, on-going validation and expert consultation on indicator design is important.
“Indicators provide the basis for assessing progress towards the long-term objective of sustainable development. Long-term targets only have meanings as policy goals if progress towards them can be assessed objectively.” (European Commission, 2001)
Indicators are quantitative measures against which farm sustainability performance can be assessed. NFS variables are utilised here in the design of farm level indicators to help simplify the complexity of agricultural sustainability.
According to the European Commission, sustainability indicators should help to assess the extent to which sustainability concerns have been integrated into the Common Agricultural Policy and should therefore meet certain criteria as described below.
Applying multiple criteria in sustainability assessments is problematic i.e., considering too many indicators can result in difficulties in interpretation. Thus the prioritisation of indicators is challenging. When selecting variables for the design of indicators, practitioners typically start by defining sustainability, listing the relevant variables and then assessing their availability. Whilst this suggests selection is subjective, environments and threats to them vary, so indicators need to be country, region and farm specific.
Selection of Indicators
Measuring farm level sustainability
Teagasc National Farm Survey
The NFS is a nationally representative sample of over 1,000 Irish farms collected annually with each farm assigned a national weighting factor. Given the broad spectrum of data collected it is possible to begin the development of indicators to represent all four aspects of sustainability.
Indicator Design Criteria
Policy relevance & effectiveness
Statistical validity
Cost efficiency
Conceptual & analytical soundness
Appropriate level of
aggregation
Technical feasibility

3
Evaluation of economic performance is an integral part of an overall assessment of Irish agricultural sustainability at the farm level. Although much of the focus in the sustainability debate is directed towards environmental resource management this is not of much relevance if the farm is not economically viable and cannot sustain itself in the longer term. An overview of the economic performance of Irish farming across systems is documented on an annual basis using NFS data with year-on-year performance heavily dependent on external factors such as weather conditions and market output and input prices. Given the wealth of data within the NFS the design of economic sustainability indicators is relatively straightforward. Five farm level economic indicators of sustainability are considered here that capture the broad concepts of productivity, profitability and viability. Productivity is a measure of the efficiency of production and is evaluated here in the context of profit per unit of land and income per unit of labour used. The economic viability of the farm business is also assessed in an overall evaluation of economic sustainability. The development of each of these indicators using NFS data is discussed in turn below. Productivity of labour The return to labour invested on the farm is measured as family farm income per unpaid family labour unit employed on the farm. The family farm income measure includes a deduction for paid hired labour; hence the measure only includes unpaid family labour.
Productivity of land The productivity of land is measured as gross output per hectare. Profitability Market based gross margin (gross margin less subsidies) per hectare is the measure used to capture the profitability of the farm business.
Viability of investment While viability is a multidimensional concept that can include both the farm business and household, the latter is not considered here. An economically viable farm is defined as one having the capacity to remunerate family labour used on the farm at the average agricultural wage and the capacity to provide an additional five per cent return on non-land assets. Market orientation This variable considers the market orientation of the farm business and as such can be considered the converse of a farm’s reliance on subsidies.
Economic Indicators
Indicator Measure Unit
Productivity of Labour Income per unpaid labour unit €/labour unit
Productivity of Land Gross Output per hectare €/hectare
Profitability Market based Gross Margin per hectare €/hectare
Viability of Investment Farm is economically viable 1=viable, 0= not viable
Market Orientation Output derived from the market %
ECONOMIC SUSTAINABILITY
PRODUCTIVITY OF LAND
PRODUCTIVITY OF LABOUR
PROFTIABILITY VIABILITY OF INVESTMENT
MARKET ORIENTATION
Economic Indicators

4
As scientific knowledge on the interactions between farming and the environment deepens and as environmental policy targets are developed, there will be more clarity on the data and the analysis that will be required for the development of environmental indicators. As this process evolves, so too will the collection of data and the selection of indicators. The environmental thematic areas for which indicators are developed are outlined here:
Air quality/climate change
Risk to water quality
Habitat and biodiversity Air quality and climate change Greenhouse gas (GHG) emissions are the primary cause of global warming. One of the most pressing challenges for Irish agriculture will be to produce more food while reducing these GHG emissions. Agriculture is Ireland’s single largest emissions source by sector, accounting for 32.1 % of total GHG emissions in 2012 (EPA, 2013). Two greenhouse gas emission indicators are developed in this analysis. Both indicators are calculated using IPCC coefficients and conventions (see page 5). One is expressed on a per farm basis while the other is expressed per unit of product. Emissions from fuel and energy use on the farm and by hired contractors are not included in the above indicators but are also estimated. The consumption of energy products, in this case motor fuel and electricity, releases large amounts of carbon into the atmosphere. This increases the greenhouse gas effect and contributes to climate change. Here the emissions from energy usage are expressed relative to the output produced.
Risk to water quality The interactions between agriculture and water quality are not yet fully understood, therefore developing relevant indicators on which data is available is challenging. Ideally, holistic whole farm soil/surface indicators would take account of the nutrient status of the soils. However, using the data available, a farm gate nitrogen balance per hectare measure of the risk to water quality is developed for all systems and a measure of nitrogen use efficiency in milk production is developed for the dairy system.
Habitat and biodiversity Ideally measurements of habitat area and diversity should be included to represent a measure of farmland biodiversity. However, while a number of studies have collected farm biodiversity data, there is no nationally representative dataset. Furthermore, a standardised methodology for aggregation and weighting of farmland biodiversity data is needed. At the moment, there is insufficient information to support the development of meaningful biodiversity indicators (see p 8 for further detail).
ENVIRONMENTAL SUSTAINABILITY
GHG EMISSIONS PER
FARM
GHG EMISSIONS PER
UNIT OF OUTPUT
N BALANCE /USE
EFFICIENCY
FUEL & ELECTRICITY
EMMISSIONS
BIODIVERSITY
Environmental Indicators
Environmental Indicators
Indicator Measure Unit
GHG emissions per farm IPCC estimate/ farm1 Tonnes CO2 equivalent/farm
GHG emissions per kg of output IPCC estimate/ kg of output Kg CO2 equivalent/kg output
Nitrogen (N) balance
Nitrogen (N) use efficiency
Risk to water quality2
Nitrogen use efficiency /product
Kg N surplus/hectare
Kg N surplus/unit product
Emissions from fuel and electricity CO2 equivalent/kg output Kg CO2 equivalent/kg output
1 – See the following page for details on GHG emission methodologies 2 – See p 7 for details of Nitrogen balance methodologies

5
The measurement, reporting and verification of GHG emissions from the agricultural sector is highly complicated from both a scientific and administrative perspective. Generally, there are two different commonly used approaches to measuring GHG emissions from agriculture and the agri-food chain. These are the Intergovernmental Panel for Climate Change (IPPC) methodology and the Life-Cycle Assessment (LCA) approach.
For the purposes of this study, the methods selected were largely determined by data availability. Sufficient activity data were available to estimate GHG emissions associated with each farm enterprise using IPCC coefficients and conventions and to produce an estimate of total emissions per farm. Once GHG emissions per farm are estimated, the principal GHG indicator used here is kilograms of carbon equivalents (IPCC method) per kilogram of product produced. This is presented for the main product produced by each farm system. In the case of Dairy and Tillage farms actual kilograms of milk and crop production are recorded by the NFS. In the case of Cattle and Sheep farms it was necessary to
estimate kilograms of output by using standardised animal weights and prices.
An alternative method to the IPCC approach to measuring carbon is the Life-Cycle Assessment approach which accounts for emissions through the entire food production supply chain.
Considerably more data are required to conduct an LCA study or to produce a carbon footprint analysis for each product produced on a farm. At present such detailed data are only available for Dairy farms participating in the NFS and as such it was only possible to conduct a carbon footprint analysis of milk using NFS data. Further detail on this is contained on the next page.
Life-Cycle Assessment Methodology
Life-cycle assessment (LCA) is a holistic systems approach that aims to quantify the potential environmental impacts e.g. GHG emissions, generated throughout a product’s life cycle, from raw-material acquisition through production, use, recycling and final disposal. Thus it accounts for all GHG emissions from the farm up to the point of product sale. It is generally expressed per unit of product produced. The LCA approach attempts to capture all emissions associated with a product. It therefore ignores national boundaries and seeks to enumerate all emission along the chain, irrespective of country of origin. See LCA carbon footprint for milk on P.6.
Intergovernmental Panel on Climate Change Methodology
The standard method for reporting GHG emissions is the IPCC approach. The IPCC method quantifies GHG emissions using a national sector-based approach. The approach estimates emissions associated with agricultural production activity within defined national boundaries. In the case of agriculture it confines itself to the emissions within the farm gate. Emissions associated with imported inputs, such as animal feed, fertiliser or farm animals are not included in this measure.
Further Reading:
Foley, P., Crosson, P., Lovett, D.K., Boland, T.M., O’Mara, F.P. and Kenny, D.A., 2011. Whole-farm systems modelling of greenhouse gas emissions from suckler beef cow production systems. Agriculture, Ecosystems and the Environment 142, 222-230
O'Brien, D., Shalloo, L., Buckley, F., Horan, B., Grainger, C., Wallace, M., 2011. The effect of methodology on estimates of greenhouse gas emissions from grass-based dairy systems. Agriculture, Ecosystems and Environment. 141, 39-48.
Schulte, R.P.O. and Donnellan, T. (eds.), 2012. A Marginal Cost Abatement Curve for Irish Agriculture. Teagasc submission to the public consultation on Climate Policy development.
Counting Carbon

6
A provisional estimate of the carbon footprint ofmilk was produced by the Teagasc NationalFarm Survey for the first time in 2013. TheMoorepark dairy LCA model was used for thisanalysis. This model, which is accredited by theNational Carbon Trust (UK) , has previously beenused to estimate the carbon footprint of milkproduction on a number of research farms aswell as a sample of farms supplying a particulardairy processor. The system boundaries of theMoorepark LCA model are defined to include allemissions associated with the dairy productionsystem up to the point where milk is sold fromthe farm.
The advantage of applying the Moorepark DairyLCA model to NFS data is that it is nationallyrepresentative and thus reflects the fullspectrum of farming conditions in the countryand as such allows us to produce a nationallyrepresentative carbon footprint measure.
Additional data over and above what is normallycollected by the Teagasc NFS were required tomake the LCA model operational. The additionaldata required included information on thelength of the grazing season, slurry spreadingmethods, timing of slurry application, use ofagricultural contractors and electricity provider.
These additional data were collected for the firsttime in the autumn of 2012/spring of 2013 on anationally representative sample of 300 dairyfarms. Application of the Moorepark model tothese data facilitated the estimation of anationally representative carbon footprint.
The chart shows the distribution of milkproduction in Ireland and the associated carbonfootprint for 2012. It is evident that there isquite a considerable distribution around themean footprint. Approximately 22 percent ofmilk was produced at a carbon footprint of 1kgof carbon equivalent per kg of fat and proteincorrected milk solids. At the opposite end of thedistribution, approximately 17 percent of milkwas produced at a carbon footprint of 1.3 orgreater.
It is important to note that 2012 was asomewhat atypical year for milk production.Inclement weather conditions adverselyaffected grass growth and the length of thegrazing season in most regions of the country.Furthermore, concentrate feed usage wassignificantly above normal levels in 2012 whilemilk output per cow was reduced.
Caveats
As with the other indicators presented in thisreport, the emphasis should not be on theabsolute carbon footprint measure but ratherthe direction in which the indicator movesover time. The main objective of this researchis to establish indicators with which futureprogress can be documented.
Future Work
Teagasc in conjunction with Bord Bia havealready made significant progress in thecarbon footprinting of beef production.However, at present the Teagasc NFS data arenot sufficiently detailed to allow us toestimate a carbon footprint for beef. It isenvisaged that the data collection process willbe augmented to facilitate such an analysis inthe near future.
The Carbon Footprint of Milk
Production in Ireland

7
Inefficient use of nutrients on farms has significant economic implications for farmers as well as for the wider environment. Nitrogen (N) is one of the main elements underpinning agricultural production. However, nitrogen also poses a risk to the aquatic environment. All other things being equal, optimal use of nitrogen can deliver a double dividend of reduced risk of nutrient loss from agricultural land thereby, helping the achievement of environmental water quality objectives while maximizing economic margins at farm level.
Nutrient accounting approaches provide a reliable assessment of nutrient management efficiency at farm or enterprise level while providing an indicator of environmental pressure in terms of risk to water quality. Farm gate or whole farm balance approaches are the most commonly used nutrient accounting systems. The farm gate approach restricts analysis to imports and exports of nutrients over which the farmer has direct control (through the farm gate). Whereas whole farm approaches additionally account for nutrient inputs and exports that are less directly controllable by the farmer, such as atmospheric deposition; biological fixation and mineralisation of nutrients in soils.
The links between nitrogen balance (imports of N less exports) at farm and field level and loss to the environment are complex and difficult to predict. The nature of the interactions depends on factors such as soil type, hydrology, weather, farm structures and management practices. The level of detail required to undertake a whole farm balance analysis is not currently available. However, all things being equal, farm gate nitrogen balances are a reliable indicator of agronomic efficiency and environmental pressure (Schroder et al., 2004). Additionally, the use of farm gate balances highlights the nutrient imports, exports and management practices that are most directly under the control of the farmer.
The farm gate N balance in this instance is established by subtracting the total quantities of N imported from total quantities of N exported on a per hectare basis. Each of the products exported from the farm (e.g. milk, meat, crops, wool) and imports (mainly chemical fertilisers and feedstuffs) are converted to kilogrammes of N using relevant co-efficients (see Buckley et al., 2013 for detailed methodology). Farms importing or exporting organic
manures were excluded from the analysis due to data limitations.
Nitrogen use efficiency of milk production is also calculated for dairy farms as this is becoming a more frequently reported metric internationally (Nevens et al., 2006; Beukes et al., 2012). This is reported here as kilogrammes of milk produced per kilogramme of N surplus (excess of N imports over exports relevant to the dairy enterprise).
Nitrogen balance / use efficiency
Future work It is envisaged that the data collection process will be augmented in the future to include data in the area of farm nutrient soil status and quantities of organic manures being imported and exported to allow a whole farm balance approach to be explored.
Further Reading
Beukes, P. C., Scarsbrook, M. R., Gregorini, P., Romera, A. J., Clark, D. A. and Catto, W., 2012. The relationship between milk production and farm-gate nitrogen surplus for the Waikato region, New Zealand. Journal of Environmental Management, 93, 44-51. Buckley, C., Murphy, P., Wall., D., 2013. Farm-gate N and P balances and use efficiencies across specialist dairy farms in the Republic Ireland. REDP Working Paper Series 13-WP-RE-02 Available: http://www.agresearch.teagasc.ie /rerc/downloads workingpapers/13wpre02.pdf Nevens, F., Verbruggen, I., Reheul, D. & Hofman, G., 2006. Farm gate nitrogen surpluses and nitrogen use efficiency of specialized dairy farms in Flanders: Evolution and future goals. Agricultural Systems, 88, 142-155. Schroder, J. J., Scholefield, D., Cabral, F. & Hofman, G., 2004. The effects of nutrient losses from agriculture on ground and surface water quality: the position of science in developing indicators for regulation. European Journal of Agronomy, 7, 15-23.

8
The measurement of biodiversity is a key component of any assessment of environmental sustainability. Many Irish farming systems tend to have a relatively high proportion of habitats for farmland wildlife, and this is a feature of Irish agriculture that is attractive to Irish and international producers and retailers. Measurement of these features will be required to translate farmland wildlife attributes into labelling and marketing initiatives. Aside from its intrinsic and cultural values, biodiversity has a functional value in the provision of services, e.g. food and fuel. This functional role includes the support of nutrient cycling and regulation of climate and hydrological services, which are central to sustainable agro-ecosystems. There is significant scope to augment and reintroduce biodiversity in agricultural habitats without necessarily compromising productivity. “Indeed, with greater knowledge of the functional value of natural populations and ecosystem processes within agro-ecosystems, there is likely to be positive agronomic merit in the development of less artificial and more environmentally sustainable production systems that benefit from an increased utilisation of the ecological advantages of biological diversity” (EPA, 2009). Farmland wildlife and habitats should be represented in sustainability assessments, but to do this would require ecological expertise in farm-scale assessments and such assessments would need to be measured in a consistent manner across farms and across time. In principle, methods for farm-scale assessment of wildlife habitats are well-developed (e.g. Sheridan et al. 2011), and the primary constraints are the financial and logistical effort required to undertake habitat surveys. Ideally, measurements of habitat area and diversity would be used to represent a measure of farmland wildlife; however, the data collected on NFS farms is not yet sufficiently detailed to develop meaningful indicators of farmland wildlife. In addition to conducting farm-scale assessments, there needs to be a protocol which broadly distinguishes between the ecological value of different habitat and land use types. Small-scale studies have been conducted, but there is currently no national scale assessment to provide data for a national-scale benchmark of the ecological quality of farming systems in Ireland.
Measurement of the number of land use types and their proportional abundance as reported in the NFS dataset could form the basis of a future biodiversity indicator. The farming intensity of the land use types recorded in the NFS ranges from pasture and tillage to rough grazing and old woodland. NFS data can be used to measure the richness and evenness of land use diversity. However, these data do not contain information on the value of each land use in terms of the ecosystem services provided. Further work needs to be undertaken to investigate the weighting of each land use type in terms of its ecological quality.
Measuring Biodiversity
Future Work Teagasc researchers have recently begun investigating methods for measuring biodiversity and farmland habitats on 80 “sustainability farms”. This research will help inform future NFS data collection and use of farmland habitat indicators as part of sustainability assessments.
Further Reading
EPA (2009) AG-BIOTA – Monitoring, Functional Significance and Management for the Maintenance and Economic Utilisation of Biodiversity in the Intensively Farmed Landscape. (2001-CD/B1-M1) STRIVE Report. Frater, P. and Franks, J. (2013). Measuring agricultural sustainability at the farm-level: A pragmatic approach. International Journal of Agricultural Management, Vol. 2, Issue 4. Louwagie, G., Northey, G., Purvis, G. and J. Finn. (2012). Development of indicators for assessment of the environmental impact of livestock farming in Ireland using the Agri-environmental Footprint Index. Ecological Indicators 18: 149-162. Sheridan, H., McMahon, B.J., Carnus, T., Finn, J.A., Kinsella, A., Purvis, G. (2011). Pastoral farmland habitat diversity in south east Ireland. Agriculture, Ecosystems & Environment 144: 130-135.

9
In order to develop agricultural production in a sustainable manner, an understanding of the inter-relationship between the agricultural industry and the wider society in which it operates is required. Agriculture contributes to the viability of rural areas, helping to maintain the rural infrastructure. Indeed, it is often the primary economic activity in peripheral areas. Social sustainability indicators are designed here to gauge the quality of life of the farming community by identifying and quantifying those ‘social life’ dimensions not determined by economic activity.
In evaluating sustainability in the past, economic and environmental factors took precedence and income was commonly used as an indicator of social welfare in the literature. There is now a growing recognition of the need to examine overall human well-being and quality of life within the sustainability framework. Welfare is determined not only by economic activity but also by a wide range of additional dimensions of social life. Household Vulnerability In this analysis a household is defined as vulnerable if the farm business is not viable and neither the farmer nor spouse is employed off-farm. Education Level An examination of the education levels of farm households can be indicative in the context of farm succession.
High Age Profile An examination of the age profile of farm households can also be indicative of demographic viability. A household is designated as being of high age profile if the farmer is aged over 60 and there is no household member less than 45 years. Isolation Against the backdrop of an ageing farming population and continued outward migration lies the threat of rural isolation. A household is classified as at risk of isolation here if the farmer lives alone. Work Life Balance This is calculated by taking account of the hours worked by the farmer on the farm.
SOCIAL SUSTAINABILITY
HOUSEHOLD VULNERABILITY
HIGH AGE
PROFILE
EDUCATION
LEVEL ISOLATION
RISK
WORK-LIFE
BALANCE
Social Indicators
Social Indicators
Indicator Measure Unit
Household Vulnerability Farm business is not viable - no off-farm
employment
Binary, 1= Yes, 0= No
Education Level Educational attainment Count variable 1 - 51
Isolation Risk
High Age Profile
Farmer lives alone
Farmer is over 60 years of age and no
household member is less than 45
Binary, 1= Yes, 0= No
Binary, 1=Yes, 0= No
Work Life Balance Work load of farmer Hours worked on the farm
1 – 1=primary only, 2=secondary, 3=some agricultural education, 4=agricultural certificate, 5=higher level

10
Innovation in agriculture has a key role to play in producing more food without depleting natural resources. To remain competitive, farmers need to innovate continuously so as to adapt to market developments and changes in resource quality and availability. Innovation is a broad concept but it is fundamentally about embracing novelty, which can be “new to the firm, new to the market or new to the world” (OECD and Eurostat, 2005). Innovation can be one of five main types: new processes, new products, new organisational forms, entering new markets or using new supply sources. At the farm level, many innovations are process innovations as they relate to the use of new production techniques, e.g. the use of improved seeds or the adoption of management practices that optimise resource efficiency. By contrast, organisational innovations include farm partnerships and share farming. Adoption is defined by Leeuwis (2004) as the uptake of innovation by individuals. Researchers and businesses input into farm level innovation, but actual innovation only occurs when farmers put something new into use. Farm advisors facilitate the diffusion of innovation amongst farmers in order to improve production efficiencies and overall sustainability. More efficient use of our resources (land, animals, nutrients, human capital, technology) not only reduces impacts on the environment, it also reduces production costs. In this context, data collected within the NFS on the adoption of new technologies or participation in knowledge transfer programmes are used as a measure of innovation on farms. As innovations are generally specific to the farm enterprise, indicators were developed for each farm system representing innovations in farm processes, management practices and farm products.
INNOVATION
PRACTICE
PRODUCT PROCESS
Innovation Indicators
Future Work
Regular gathering of such data would allow for future ranking of innovative practices or technologies to identify those which provide the highest pay off in the shortest time. It would also facilitate the development of a composite indicator of farm level innovation which would measure the economic and environmental efficiencies achieved, as well as the social contribution of innovation to farm sustainability.
Innovation Indicators1
Dairy Cattle Sheep Tillage
Milk Recording Quality Assurance Member Quality Assurance Member Forward Selling
Discussion Group Member Reseeding Reseeding ICT Usage
Spring slurry spreading2 Soil Testing Soil Testing Soil Testing
1 – Each indicator is binary. Yes=1, No=0 2 – greater than 50% of slurry spread in spring (Jan, Feb, Mar, Apr).
Further Reading
Leeuwis, C. (2004) Communication for Rural Innovation: Rethinking Agricultural Extension. Oxford: Blackwell Science. OECD and Eurostat (2005) Oslo Manual: The Measurement of Scientific and Technological Activities – Proposed Guidelines for Collecting and Interpreting Technological Innovation Data. Joint publication OECD and Eurostat. Third edition.
11
The following section presents an overview of each of the indicators (economic, environmental, social and innovation) for Dairy farms. Economic indicators are presented first and then the subsequent indicators are presented relative to the farm’s economic performance. Economic sustainability Approximately 69 percent of dairy farms were viable in 2012. The average output per hectare was €3,061 in 2012, while market gross margin per hectare was €1,440. The considerable variation around the mean values is evident from the box plot graphs below.
Farms are grouped, on the basis of gross margin, into the Top, Middle and Bottom performing one-third of farms. These groups are displayed in subsequent charts. The average income per labour unit on dairy farms was €38,225 in 2012.
The market orientation of the farm is represented as the proportion of output derived from the market, as distinct from income from subsidies and was 85 percent on average for dairy farms.
Environmental sustainability The average dairy farm emitted 435 tonnes of carbon equivalents (IPCC coefficients and conventions) in 2012. Approximately 61 percent of these emanated from the dairy enterprise, 39 percent from cattle with the remainder from an amalgam of other enterprises.
The emissions emanating from the dairy enterprise (less those associated with calves and culls) are expressed per unit (kgs) of milk produced in the following chart. It should be noted that this does not equate to a carbon footprint measure.
The results confirm the negative correlation between emissions and economic performance. The Top performing one-third of farms, in an economic sense, produces on average 0.71kg of CO2 equivalent per kg of milk, while the Bottom performing one-third of farms produce on average 0.85kg of CO2 per kg of milk. It is also interesting to note from the whiskers in the graph that the farms with the highest emissions tend to be in the Bottom one-third group.
Dairy Farms
0
1000
2000
3000
4000
5000
Gross Output Gross Margin
€/h
ecta
re
Productivity and profitability: Dairy Farms
Avg. Shaded box & whiskers: 70 & 90% of sample
-25000
0
25000
50000
75000
100000
125000
Top Middle Bottom
€ /
lab
ou
r u
nit
Productivity of labour - Dairy Farms
Avg. Shaded box & whiskers: 70 & 90% of sample
0
100
200
300
400
500
Dairy
ton
nes
CO
2 Eq
uiv
/far
m
GHG Emissions per Farm: Dairy Farms
Dairy Cattle Sheep Crops Other
0.5
0.7
0.9
1.1
1.3
Top Middle Bottom kg
CO
2 E
qv
/kg
of
milk
Emissions CO2 Eqv/Milk kg: Dairy Farms
Avg. Shaded box & whiskers: 70 & 90% of sample

12
The emissions from energy and fuel display a similar pattern. The Top economic performing farms tend to use energy and fuel more efficiently and hence have lower emissions per unit of product.
Nitrogen use efficiency of milk production is positively correlated with economic performance; the Top performing farms produce relatively more milk per kg of N surplus. From a risk to water quality perspective, it is also important to consider N surplus on a per hectare basis. The Top performing farms tend to have higher N surplus per hectare on average. This is consistent with the higher rates of intensity on these farms.
Social sustainability In terms of work-life balance dairy farming tends to be quite labour intensive. The number of hours worked by the typical farm operator in an average week was 47 hours. Approximately 27 percent of all dairy farm households were classified as vulnerable in 2012, meaning the business is not viable and there is no other income source in the household. Furthermore, 10 percent were classified as having poor demography, i.e. the farmer is considered to be nearing retirement age and there is no obvious successor on the farm. Vulnerability and poor demography tend to be negatively correlated with economic performance.
Innovation Three farm practices that might be considered innovative were considered for dairy farms. The first is membership of a discussion group, a measure of interaction with extension services, although it should be noted that this may be driven by a publically funded incentive programme in 2012. The other practices include conducting milk recording and whether at least 50 percent of slurry is spread in the spring. Adoption rates across all three practices are correlated with economic performance.
20 40 60 80
100 120 140 160
Top Middle Bottom kgs
of
milk
/kg
N s
urp
lus
N Use Efficiency of Milk : Dairy Farms
Avg. Shaded box & whiskers: 70 & 90% of sample
0
20
40
60
80
All Top Middle Bottom
% o
f fa
rms
Vulnerable & High age profile: Dairy farms
Vulnerable High age profile
0 50
100 150 200 250 300
Top Middle Bottom
Kg
of
N S
urp
lus/
ha
N Balance per ha: Dairy farms
Avg. Shaded box & whiskers: 70 & 90% of sample
0
50
100
All Top Middle Bottom
% o
f fa
rms
Innovative Practices: Dairy Farms
Dis'n Group Milk Rec'g Early Slurry App'
0 0.02 0.04 0.06 0.08
0.1 0.12
Top Middle Bottom kg
CO
2 Eq
v/kg
of
milk
Energy & Fuel Emissions/Milk kg: Dairy Farms
Avg. Shaded box & whiskers: 70 & 90% of sample
13
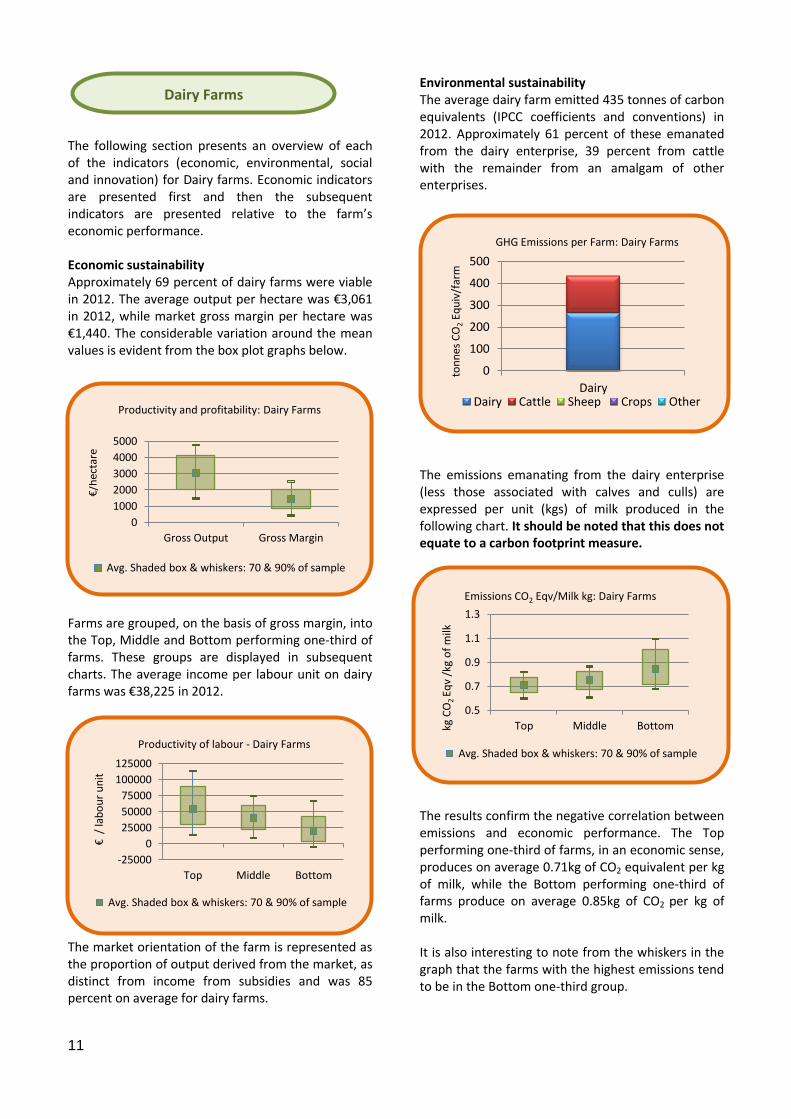
The sustainability indicators for Cattle farms, combining both Cattle Rearing and Cattle Finishing, are presented in the following section. As with the analysis for Dairy farms, the economic sustainability indicators are presented first and then the subsequent indicators are presented relative to the farm’s economic performance. Economic sustainability Approximately 25 percent of cattle farms were viable in 2012. The productivity of land use is represented in the chart by gross output per hectare which stood at €1,230 in 2012 on the average cattle farm. The corresponding figure for profit was €430 per hectare. The considerable variation around these mean values is evident from the box plot graphs below.
The market orientation of all Cattle farms is presented, as is the level for the Top, Middle and Bottom farms. Across all farms approximately 60 percent of output is on average derived from the market with the remainder coming from subsidies. As can be seen lower market orientation is correlated with lower profitability.
A large proportion of Cattle farms are operated on a part-time basis. When allowing for the quantity of labour supplied to the farm, the results show that the average income per labour unit on Cattle farms was €15,742 in 2012. But the average for the Bottom performing one-third was just €4,000 per labour unit supplied. Environmental sustainability The average Cattle farm emitted 143 tonnes of carbon equivalents (IPCC coefficients and conventions) in 2012. Cattle farms are relatively specialised and as can be seen, the vast majority of emissions come from cattle based enterprises.
The emissions emanating from the cattle enterprise are expressed per unit of beef liveweight produced on the farm. The liveweight measures are imputed from the data on animal type and value. It should be noted that this does not equate to a carbon footprint measure. The results confirm the negative correlation between emissions and economic performance. The Top performing one-third of Cattle farms produces on average 11.3kg of carbon equivalent per kg of liveweight beef. While the Bottom performing one-third of farms produce on average 13.2kg.
Cattle Farms
-1000
0
1000
2000
3000
4000
Gross Output Gross Margin
€/h
ecta
re
Productivity and Profitability: Cattle Farms
Avg. Shaded box & whiskers: 70 & 90% of sample
25
50
75
100
Top Middle Bottom
% o
f o
utp
ut
Market Orientation: Cattle Farms
Avg. Shaded box & whiskers: 70 & 90% of sample
0
50
100
150
Cattle ton
nes
CO
2 Eq
uiv
/far
m
Emissions (CO2 Equiv) per Farm: Cattle Farms
Dairy Cattle Sheep Crops Other
-20000 0
20000 40000 60000 80000
100000
Top Middle Bottom
€ /
lab
ou
r u
nit
Productivity of Labour: Cattle Farms
Avg. Shaded box & whiskers: 70 & 90% of sample

14
The emissions from energy and fuel display a similar pattern. The Top economic performing farms tend to use energy and fuel more efficiently, emitting less per kilogram of beef produced than the Bottom performing group. Furthermore, the distribution around the mean value tends to be greater for the Bottom group compared to the others. The following chart shows N surplus per hectare. As with Dairy farms, the Top performing farms tend to have higher N surplus per hectare on average. This is consistent with the relatively higher intensity of production on these farms. The average N surplus was relatively low ranging 61kgs per hectare on the Top farms to 43kg on the Bottom farms.
Social sustainability In an average week the typical Cattle farmer works 32 hours on the farm. It should be noted however that many Cattle farmers also work off farm and when these hours are also considered, their work-life balance may not appear as positive.
Approximately 48 percent of all Cattle farm households were classified as vulnerable in 2012 and 28 percent were classified as having a high age profile. Vulnerability and poor demography tend to be negatively correlated with economic performance. Almost 60 percent of the Bottom group are vulnerable households compared to 40 percent of the Top group. Innovation Three innovative farm practices appropriate to Cattle farms were considered. The first is membership of the Bord Bia Beef Quality Assurance Scheme. Approximately 42 percent of all Cattle farms are members of the Quality Assurance Scheme, and membership tends to be highly correlated with economic performance. The other practices include soil testing and reseeding some grassland in the last 3 years. Adoption of these practices is also correlated with economic performance, with the Top group having greater rates of adoption for all three practices.
0
5
10
15
20
25
30
Top Middle Bottom kg C
O2
Eqv/
kg o
f b
eef
Emissions CO2 Equiv/Beef kg: Cattle Farms
Avg. Shaded box & whiskers: 70 & 90% of sample
0
20
40
60
80
All Top Middle Bottom
% o
f fa
rms
Vulnerable & high age profile: Cattle farms
Economically vulnerable High age profile
0 25 50 75
100 125 150 175
Top Middle Bottom
kg o
f N
Su
rplu
s/h
a
Nitrogen balance per ha: Cattle Farms
Avg. Shaded box & whiskers: 70 & 90% of sample
0
20
40
60
80
All Top Middle Bottom
% o
f fa
rms
Innovative Practices: Cattle Farms
Soil Testing Quality Ass' Reseeding
0 0.25
0.5 0.75
1 1.25
1.5 1.75
Top Middle Bottom
kg C
O2
Eqv
/kg
bee
f
Energy & Fuel Emissions /Beef kg: Cattle Farms
Avg. Shaded box & whiskers: 70 & 90% of sample

15
An overview of each of the indicators for Sheep farms is given in the following section. As with the previous analyses, the economic sustainability indicators are presented first and then the subsequent indicators are presented relative to the farm’s economic performance. Economic sustainability Approximately 25 percent of Sheep farms were viable in 2012. The average gross output per hectare on Sheep farms was €1,190 in 2012. While the vast majority of Sheep farms (70%) had an output of less than €2,300, there were a small number of farms achieving output of up to €4,000 per hectare. The average market-based gross margin per hectare was €460. The variation around the mean values can be seen in the box plots below.
The market orientation of all Sheep farms is presented, as is the level for the Top, Middle and Bottom farms. Across all farms approximately 55 percent of output is on average derived from the market with the remainder coming from subsidies. As with Cattle farms, lower market orientation is correlated with lower rates of profitability.
The average income per labour unit on Sheep farms was €16,629 in 2012. The large variation around that mean is displayed in the following chart. Again there are a small number of farms in the Top groups achieving incomes considerably higher than average. Environmental sustainability The average Sheep farm emitted 118 tonnes of carbon equivalents (IPCC coefficients and conventions) in 2012. Despite being specialised in sheep production, the cattle enterprise still accounts for the bulk of emissions at 54 percent, compared to 44 percent from sheep.
The emissions emanating from the Sheep enterprise are expressed per unit of lamb and sheepmeat liveweight. The liveweight measures are imputed from the data on animal type and value. It should be noted that this does not equate to a carbon footprint measure. Again the negative correlation between emissions and economic performance is apparent. The Top performing one-third of Sheep farms produces on average 5.8kg of CO2 equivalents per kg of lamb liveweight compared to 9kg for the Bottom group. The very wide distribution around the mean in the Bottom group is evidence of the variability in performance.
Sheep Farms
-1000
0
1000
2000
3000
4000
Gross Output Gross Margin
€/h
ecta
re
Productivity and profitability: Sheep Farms
Avg. Shaded box & whiskers: 70 & 90% of sample
0
20
40
60
80
Top Middle Bottom
% o
f o
utp
ut
Market Orientation: Sheep Farms
Avg. Shaded box & whiskers: 70 & 90% of sample
0
20
40
60
80
100
120
140
Sheep
ton
nes
CO
2 E
qu
iv/f
arm
Emissions (CO2 Equiv)/ Farm: Sheep Farms
Dairy Cattle Sheep Crops Other
-15000
0
15000
30000
45000
60000
Top Middle Bottom
€ /
lab
ou
r u
nit
Productivity of labour - Sheep farms
Avg. Shaded box & whiskers: 70 & 90% of sample
16
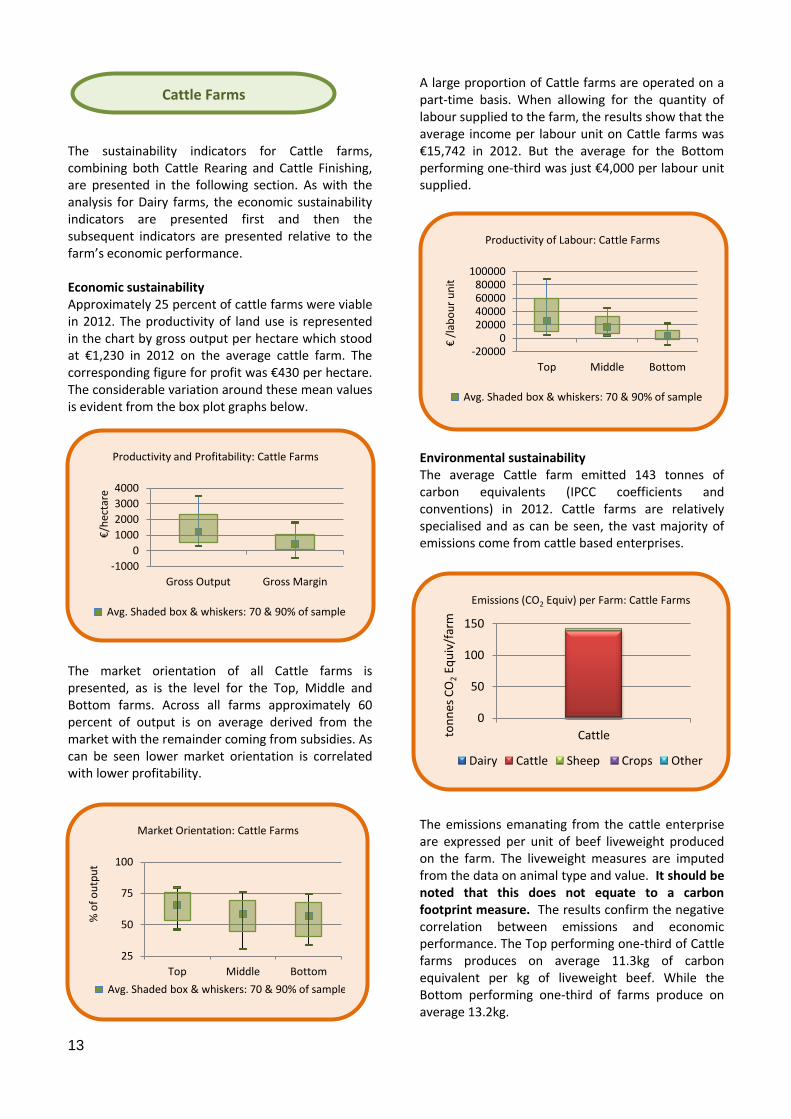
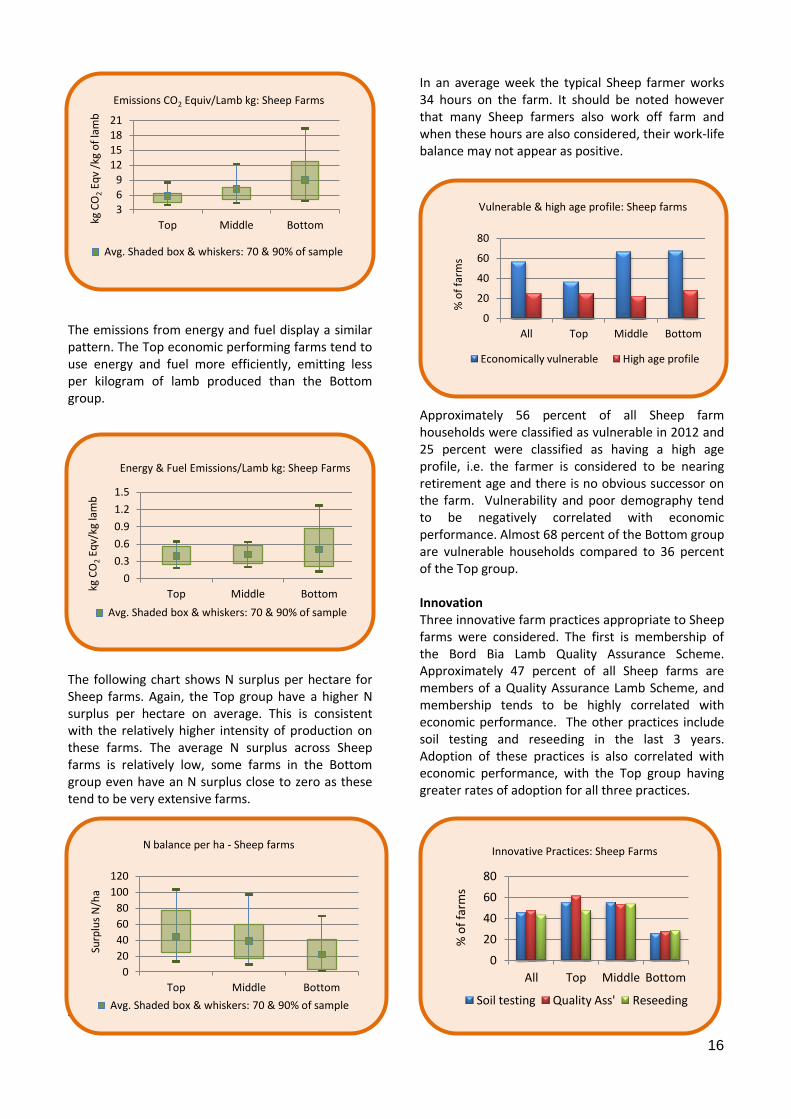
The emissions from energy and fuel display a similar pattern. The Top economic performing farms tend to use energy and fuel more efficiently, emitting less per kilogram of lamb produced than the Bottom group.
The following chart shows N surplus per hectare for Sheep farms. Again, the Top group have a higher N surplus per hectare on average. This is consistent with the relatively higher intensity of production on these farms. The average N surplus across Sheep farms is relatively low, some farms in the Bottom group even have an N surplus close to zero as these tend to be very extensive farms.
Social sustainability
In an average week the typical Sheep farmer works 34 hours on the farm. It should be noted however that many Sheep farmers also work off farm and when these hours are also considered, their work-life balance may not appear as positive.
Approximately 56 percent of all Sheep farm households were classified as vulnerable in 2012 and 25 percent were classified as having a high age profile, i.e. the farmer is considered to be nearing retirement age and there is no obvious successor on the farm. Vulnerability and poor demography tend to be negatively correlated with economic performance. Almost 68 percent of the Bottom group are vulnerable households compared to 36 percent of the Top group. Innovation Three innovative farm practices appropriate to Sheep farms were considered. The first is membership of the Bord Bia Lamb Quality Assurance Scheme. Approximately 47 percent of all Sheep farms are members of a Quality Assurance Lamb Scheme, and membership tends to be highly correlated with economic performance. The other practices include soil testing and reseeding in the last 3 years. Adoption of these practices is also correlated with economic performance, with the Top group having greater rates of adoption for all three practices.
3 6 9
12 15 18 21
Top Middle Bottom kg C
O2
Eqv
/kg
of
lam
b
Emissions CO2 Equiv/Lamb kg: Sheep Farms
Avg. Shaded box & whiskers: 70 & 90% of sample
0
20
40
60
80
All Top Middle Bottom
% o
f fa
rms
Vulnerable & high age profile: Sheep farms
Economically vulnerable High age profile
0
20
40
60
80
100
120
Top Middle Bottom
Surp
lus
N/h
a
N balance per ha - Sheep farms
Avg. Shaded box & whiskers: 70 & 90% of sample
0
20
40
60
80
All Top Middle Bottom
% o
f fa
rms
Innovative Practices: Sheep Farms
Soil testing Quality Ass' Reseeding
0
0.3
0.6
0.9
1.2
1.5
Top Middle Bottom
kg C
O2
Eqv/
kg la
mb
Energy & Fuel Emissions/Lamb kg: Sheep Farms
Avg. Shaded box & whiskers: 70 & 90% of sample

17
A selection of indicators for Tillage farms is presented in the following section. Again Tillage farms are categorised on the basis of their market based gross margin into one-third groupings: Top, Middle and Bottom. Indicators are then presented for these groups. Economic sustainability Approximately 60 percent of Tillage farms were viable in 2012. The average gross output per hectare on Tillage farms was €1,846 in 2012. The average market based gross margin per hectare was €840. However, there is a very large distribution around this mean, with some farms achieving gross margins of almost €4,000.
The market orientation of all Tillage farms is presented in the following chart. Across all farms approximately 75 percent of output is on average derived from the market with the remainder coming from subsidies.
The average income per labour unit on Tillage farms was €43,098 in 2012. The large variation around that mean is displayed in the following chart showing
some farms achieving an income per labour unit of almost €120,000. There are a small number of Tillage farms that have a very low labour input as a large proportion of the work is contracted out and they are highly profitable. Environmental sustainability The average Tillage farm emitted 139 tonnes of carbon equivalents (IPCC coefficients and conventions) in 2012. As can be seen in the chart below, despite being specialised in tillage production, the cattle enterprise still accounts for the bulk of emissions at 63 percent.
Cereal crops in general account for 28 percent of emissions from the average Tillage farm. However, no particular crop is dominant on the Tillage farm. Barley and wheat account for similar proportions, about 7 percent of the total farm emissions. Relatively little work has been published in an Irish context on the carbon footprint of cereal crops, it proved difficult to validate the estimates being produced from this analysis for CO2 equivalents for barley or grain production. Furthermore, given that no particular crop dominates on the Tillage farm it was decided not to produce a carbon measure for any particular crop at this stage.
-1000 0
1000 2000 3000 4000 5000
Gross Output Gross Margin
€/h
ecta
re
Productivity and Profitability: Tillage Farms
Avg. Shaded box & whiskers: 70 & 90% of sample
50
60
70
80
90
100
Top Middle Bottom
% o
f o
utp
ut
Market Orientation: Tillage Farms
Avg. Shaded box & whiskers: 70 & 90% of sample
0
50
100
150
Tillage
ton
nes
CO
2 Eq
uiv
/far
m Emissions (CO2 Equiv)/ Farm: Tillage Farms
Dairy Beef Sheep Barley Wheat Other Cereals
-20000 0
20000 40000 60000 80000
100000 120000
Top Middle Bottom € In
com
e/la
bo
ur
un
it
Productivity of labour - Tillage farms
Avg. Shaded box & whiskers: 70 & 90% of sample
Tillage Farms

18
The average N surplus per hectare across all Tillage farms was 45 kilograms of N per hectare. The N balance results for Tillage farms are homogenous relative to the results for livestock farms. There is very little variation in the mean values for the Top, Middle and Bottom groups, varying from 41 to 48 kg per hectare. However, as can be seen the variation around the mean is much larger for the Top performing groups.
Social sustainability In an average week the typical Tillage farmer works 30 hours on the farm, this is the lowest average of any of the farming systems. Approximately 20 percent of all Tillage farm households were classified as vulnerable in 2012 and 20 percent were classified as having a high age profile. The rates of vulnerability and poor demography tend to be quite low across the Tillage farming system in general with the exception of the Bottom group. The negative correlation between farm performance and the household demography is more striking for Tillage farms in comparison to any of the other farm systems. Over 45 percent of farms in the Bottom group have a poor demography compared to just 5 percent in the Top group.
Innovation Three innovative farm practices appropriate to Tillage farms were considered. The first is use of forward contracting. Price volatility has been a major issue confronting Tillage farms in the last number of years. Forward contracting has emerged as a relatively new and innovative means of managing price risk. As can be seen approximately 30 percent of Tillage farms entered a forward contract in 2012. It is interesting that there is no strong relationship between the use of forward contracting and the economic performance of the farm. In fact the use of contracting is lowest for the Top group. It should be borne in mind that in a given year, farmers will win or lose by entering a forward contract depending on the difference between the contract price offered, which is determined by the futures price, and the actual market price. Hence entering a forward contract can in itself determine the economic performance of the farm.
The other farm practices considered were the use of a computer for farm business purposes and soil testing. Soil testing is highly positively correlated with economic performance, but the relationship between economic performance and IT usage is less pronounced.
0
25
50
75
100
125
Top Middle Bottom
kg o
f Su
rplu
s N
/ha
Nitrogen balance per ha - Tillage farms
Avg. Shaded box & whiskers: 70 & 90% of sample
0
20
40
60
All Top Middle Bottom
% o
f fa
rms
Vulnerable & High age profile: Tillage farms
Economically vulnerable High age profile
0
20
40
60
80
All Top Middle Bottom
% o
f fa
rms
Innovative Practices: Tillage Farms
Fwd Contracts IT Usage Soil Testing
Further Work: Tillage Farms
Further work is required to allocate the greenhouse gas emissions from the farm to the particular crops cultivated on the farm and to validate these results. Furthermore, additional analysis is required to allocate fuel and energy usage to particular crops, as these are currently recorded on a whole farm basis and are not attributed to any particular crop.

19
In this section the sustainability performance of the various farm systems is compared. Given that there are up to 25 indicators per farm system, each measuring a different concept and using a different scale, it is necessary to normalise the data and bring the various indicators to a common scale. Normalisation was performed using the MIN-MAX approach whereby the lowest value for every given indicator is subtracted from the value for a given observation and then divided by the range of the dataset for that indicator. Indicators are then scaled from zero to 100, zero indicating the poorest performance in the sample and 100 indicating the best performance. The normalised indicators are then presented using spider diagrams.
Here spider diagrams are used to show the relative performance of the various farm systems along the various dimensions of sustainability. The following chart compares the economic sustainability indicators for Dairy, Cattle, Sheep and Tillage farms. On average, Dairy farms, followed by Tillage farms, perform better along all of the economic indicators relative to the other farm systems. The performance of Sheep and Cattle farms is very similar. The least variability in performance is exhibited along the market orientation dimension, where the four farm systems are clustered closest together.
The following chart presents the social sustainability indicators for the various farm systems. While Dairy and Tillage farms perform better than the drystock systems again along these indicators, the differences between the systems are less pronounced than the economic indicators. In particular, the demographic related variables, high age profile and isolation tend to vary only slightly across the systems. Dairy and Tillage farmers also tend to be better educated. The performance along the education indicator may look poor in general, but this is a scaling issue.
It is more difficult to compare the environmental and innovation performance across the various farm systems as the indicators selected were farm system specific in the case of innovation and many were product specific in the case of the environmental
Farm System Comparison
Spider Diagrams
Given that sustainability indicators measure a variety of concepts along a number of different metrics, it is necessary to normalise the indicators along a scale. A scale from 0 to 100 is used in this case. Spider diagrams are commonly used in the sustainability literature to present these normalised scales. The spider diagram is constructed so that zero, or poorest performance, is at the centre of the diagram and 100, or best performance is at the outer edge. The diagram is then interpreted as the lines, or systems in this case, closer to centre of the diagram, being the poorer performing.
0
50
100 Productivity
Profitability
Productivity of Labour
Market Orientation
Economic Viability
Economic Sustainability
Dairy Cattle
Sheep Tillage
0
50
100 Vulnerable
High Age
Isolation Education
Work/life
Social Sustainability
Dairy Cattle
Sheep Tillage

20
indicators. It is not sensible to compare the environmental performance of different farm systems on an emissions per product basis, if the farm systems are producing very different products, i.e. kilograms of beef versus kilograms of milk. Instead, environmental performance is examined within the farm system and farms are compared on the basis of their economic performance. The following chart shows the environmental performance of all farms on the basis of their economic performance within their own farm system.
As can be seen economic and environmental performance are correlated for the greenhouse gas emissions produced per unit of product. In other words, the Top performing economic farms emit less greenhouse gas emissions per product produced than the Bottom performing farms. The variation in performance is even more pronounced when greenhouse gas emissions from energy and fuel are considered. It is evident that the Top performing group use energy and fuel far more efficiently than the Bottom performing group, per unit of product produced. Only Nitrogen balance per hectare is negatively correlated with economic performance. Along this criterion the Bottom farms perform best by having the lowest Nitrogen surplus per hectare.
Many studies of farm-level sustainability conclude by developing a series of composite indicators. The various indicators can be combined to arrive at one
indicator for each of the dimensions of sustainability, for example one economic, one social, one innovation and one environmental indicator per farm. It is also possible to aggregate all of these indicators so as to arrive at one composite measure of farm-level sustainability for each farm or for the farming sector as a whole. To arrive at a composite indicator, the various indicators must be combined and a judgement must be made whether to weight or unweight the various indicators that is, to deem each indicator to be of equal importance or to select certain indicators as being more important than others. Some studies have attempted to do this by seeking expert opinion, however by construction the outcome is likely to be quite subjective and the weights selected are likely to drive the final conclusions. There is much debate in the literature surrounding the use of composite indicators with many claiming they over-simplify a complex issue. Despite this, composite indicators do offer some advantages. With composite indicators interpretation of the data can be simplified further by having one indicator per farm that summarises all of the sustainability indicators, thus making it easier to identify trends across farms and/or through time. In the context of policy analysis it makes it relatively easier to analyse changes in sustainability following a particular policy development. At this stage of the analysis we have not yet attempted to develop composite indicators of farm-level sustainability and given that the debate about their usefulness is ongoing, it is still questionable at this point in time whether the development of such indicators is worthwhile.
One of the greatest advantages of sustainability indicators is that they can be used to chart progress over time. While this report has only summarised the results for one year, it is possible to develop indicators retrospectively for earlier years to examine progress to date. It is intended to produce these indicators on a regular basis so as to chart the future development of farm-level sustainability. As our understanding of the interactions between the intensity of farming and its impact on the environment, and the role of innovation in this relationship, deepens, it is likely that new and more sophisticated indicators will be developed.
0
50
100
GHG per product
Energy GHG per product
N balance
Environmental Sustainability
Top Middle Bottom
Composite Indicators
Future Work

21
References Beukes, P. C., Scarsbrook, M. R., Gregorini, P., Romera, A. J., Clark, D. A. and Catto, W., 2012. The relationship between milk production and farm-gate nitrogen surplus for the Waikato region, New Zealand. Journal of Environmental Management, 93, 44-51. Buckley, C., Murphy, P., Wall., D., 2013. Farm-gate N and P balances and use efficiencies across specialist dairy farms in the Republic Ireland. REDP Working Paper Series 13-WP-RE-02 Available: http://www.agresearch.teagasc.ie/rerc/downloads workingpapers/13wpre02.pdf Dillon, E.J., Hennessy, T. and Hynes, S. (2010). Assessing the sustainability of Irish agriculture. International Journal of Agricultural Sustainability, Vol. 8, Issue 3. EPA (2009) AG-BIOTA – Monitoring, Functional Significance and Management for the Maintenance and Economic Utilisation of Biodiversity in the Intensively Farmed Landscape. (2001-CD/B1-M1) STRIVE Report. EPA (2013) https://www.epa.ie/pubs/reports/air/airemissions/ Ire_GHG_Emissions_1990_2012_handout.pdf Foley, P., Crosson, P., Lovett, D.K., Boland, T.M., O’Mara, F.P. and Kenny, D.A., 2011. Whole-farm systems modelling of greenhouse gas emissions from suckler beef cow production systems. Agriculture, Ecosystems and the Environment 142, 222-230 Frater, P. and Franks, J. (2013) Measuring agricultural sustainability at the farm-level: A pragmatic approach. International Journal of Agricultural Management, Vol. 2, Issue 4.
Hennessy, T., Moran, B., Kinsella, A. and Quinlan, G. (2013). National Farm Survey 2012. Teagasc, Carlow.
Leeuwis, C. (2004). Communication for Rural Innovation:Rethinking Agricultural Extension. Oxford: Blackwell Science.
Louwagie, G., Northey, G., Purvis, G. and J. Finn. (2012) Development of indicators for assessment of the environmental impact of livestock farming in Ireland using the Agri-environmental Footprint Index. Ecological Indicators 18: 149-162. Nevens, F., Verbruggen, I., Reheul, D. & Hofman, G., 2006. Farm gate nitrogen surpluses and nitrogen use efficiency of specialized dairy farms in Flanders: Evolution and future goals. Agricultural Systems, 88, 142-155. OECD and Eurostat (2005) Oslo Manual: The Measurement of Scientific and Technological Activities – Proposed Guidelines for Collecting and Interpreting Technological Innovation Data. Joint publication OECD and Eurostat. Third Edition. OECD (2010) Ministerial report on the OECD Innovation Strategy: Innovation to strengthen growth and address global and social challenges: Key Findings. Available at: www.oecd.org/dataoecd/51/28/45326349.pdf Schroder, J. J., Scholefield, D., Cabral, F. & Hofman, G., 2004. The effects of nutrient losses from agriculture on ground and surface water quality: the position of science in developing indicators for regulation. European Journal of Agronomy, 7, 15-23. Schulte, R.P.O. and Donnellan, T. (eds.), 2012. A Marginal Cost Abatement Curve for Irish Agriculture. Teagasc submission to the public consultation on Climate Policy development. Teagasc, Carlow, 30 April 2012. Sheridan, H., McMahon, B.J., Carnus, T., Finn, J.A., Kinsella, A., Purvis, G. (2011) Pastoral farmland habitat diversity in south east Ireland. Agriculture, Ecosystems & Environment 144: 130-135.
UN (1987) Report of the World Commission on Environment and Development Our Common Future. United Nations.
22
Acknowledgements
The authors wish to thank all those who contributed to this report: Our Teagasc colleagues for their constructive feedback and advice on earlier versions of this report: P. Crossan, J. Finn, K. Heanue, S. Lalor , G. Lanigan, P. Murphy, D. O’Brien, F. O’Mara, K. Richards, R Schulte, L. Shalloo, G. Shortle, J. Spink, F. Thorne and D. Wall The Teagasc research staff involved in the collection and validation of the farm data: P. Bryce, M. Corcoran, A. Curley, L. Deane, L. Delaney, P. Harnett, P. Hayes, P. Healy, P. Madden, E.McGrath, M. Nicholson, J. Colgan, J. Robinson, J. Teehan and to Marian Moloney for the adminsitration of the survey. The farmers who participate voluntarily in the National Farm Survey Any final errors or omissions remain the responsbility of the authors.