Measuring Benefits of Oil Spill Prevention: Methods … · Measuring Benefits of Oil Spill...
26
Transcript of Measuring Benefits of Oil Spill Prevention: Methods … · Measuring Benefits of Oil Spill...

Measuring Benefits of Oil Spill Prevention:Measuring Benefits of Oil Spill Prevention: Methods and ApproachesMethods and Approaches
U.S. Environmental Protection AgencyU.S. Environmental Protection AgencyOffice of Solid Waste and Emergency ResponseOffice of Solid Waste and Emergency Response
Office of Emergency ManagementOffice of Emergency ManagementRegulation and Policy DeveRegulation and Policy Dev lopment Divisionelopment Division
with assistance bywith assistance byAbt Associates Inc.Abt Associates Inc.
EPA Contract No. 68-W-03-020EPA Contract No. 68-W-03-020
April 29, 2009April 29, 2009
IntroductionIntroduction� EPA develops regulations to protect human
health and the environment.
� EPA conducts an economic analysis for economically significant regulations to estimate the costs and benefits.
� Economically significant regulations are those with annual economic impact of $100 million or more and meet other criteria.
In this presentation we focus onestimating BENEFITS.
2
Economic Analysis of RegulationsEconomic Analysis of Regulations
According to: � Executive Order 12866
“Regulatory Planning and Review”*
� Office of Management and Budget (OMB)Circular A-4
� “Guidelines for Preparing EconomicAnalyses,” USEPA, September 2000
* EO 12866 is currently under review at the request of the White House.
3
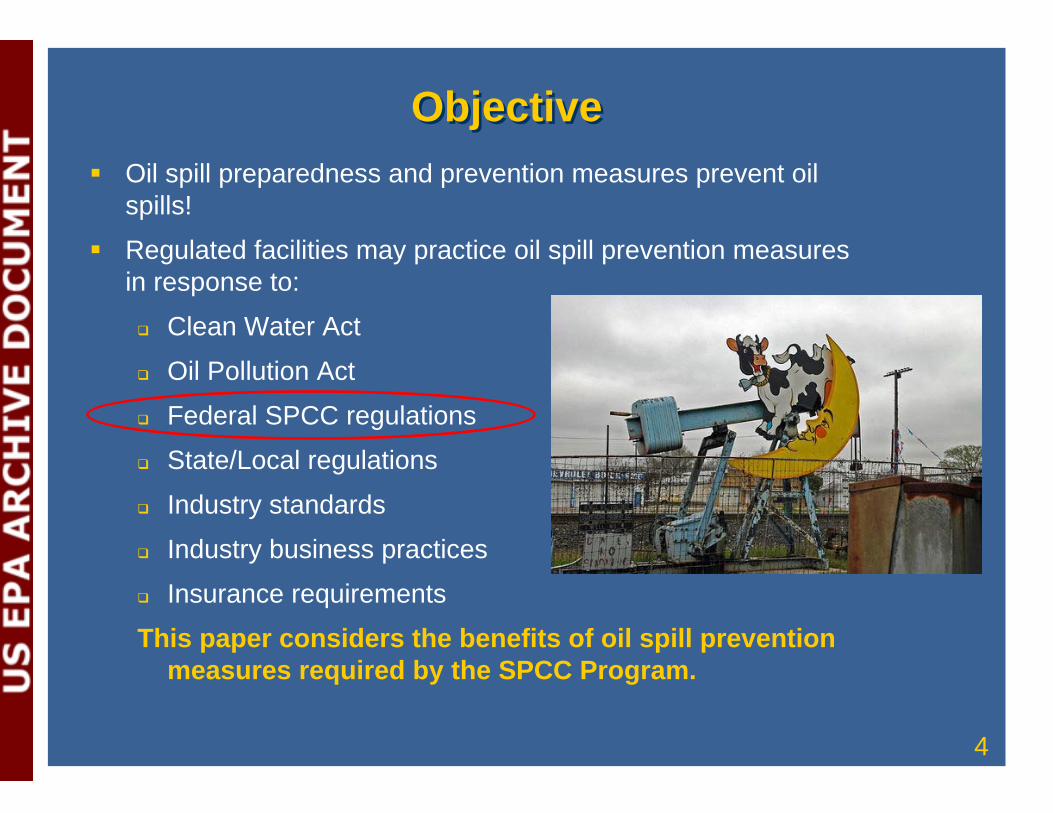
ObjectiveObjective� Oil spill preparedness and prevention measures prevent oil
spills!
� Regulated facilities may practice oil spill prevention measures in response to:
� Clean Water Act
� Oil Pollution Act
Federal SPCC regulations�
� State/Local regulations
� Industry standards
� Industry business practices
� Insurance requirements
This paper considers the benefits of oil spill prevention measures required by the SPCC Program.
4
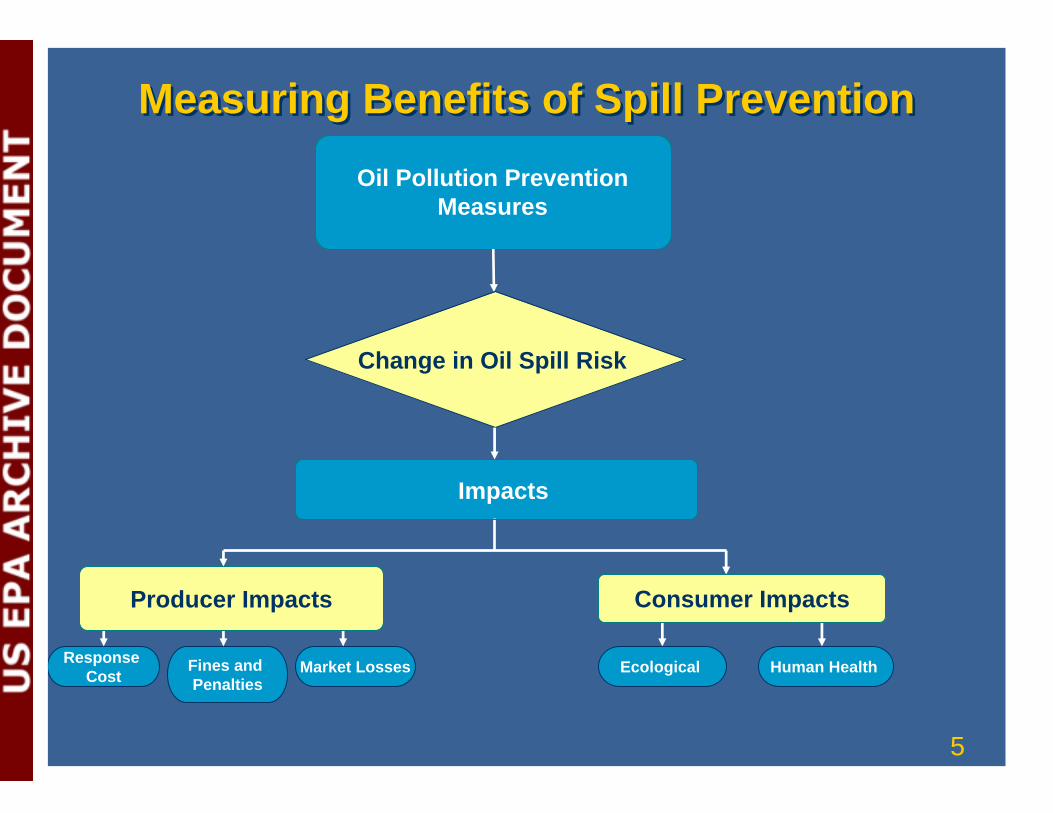
Measuring Benefits of Spill PreventionMeasuring Benefits of Spill Prevention
5
Response Cost Human HealthEcological
Oil Pollution Prevention Measures
Change in Oil Spill Risk
Impacts
Fines and Penalties
Market Losses
Producer Impacts Consumer Impacts
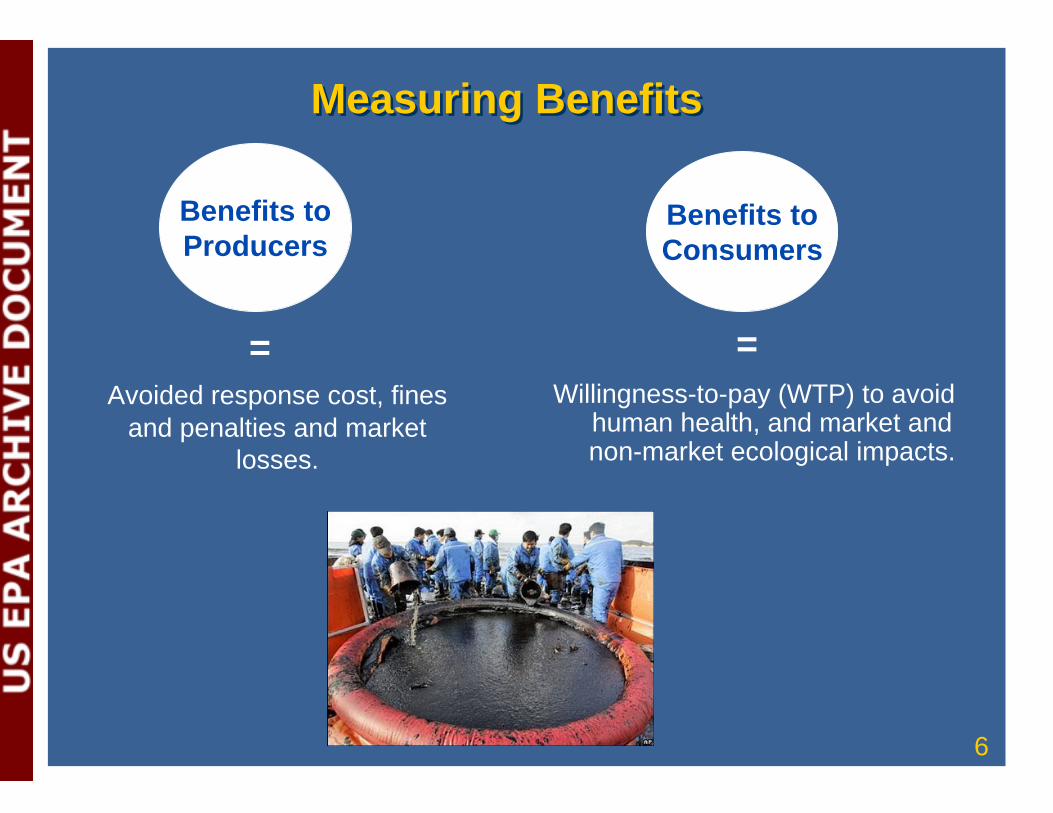
Measuring BenefitsMeasuring Benefits
Benefits to Producers
Benefits to Consumers
= = Avoided response cost, fines Willingness-to-pay (WTP) to avoid
and penalties and market human health, and market and losses. non-market ecological impacts.
6
Measuring Benefits of Spill PreventionMeasuring Benefits of Spill Prevention
Benefits to Producers � Benefits to the producers is the avoided cost from an oil
spill that includes response cost, fines and penalties and market losses.
� EPA used historical data on response costs*, fines and penalties to estimate the avoided cost.
* Data sources: PHMSA (Pipeline and Hazardous Material Safety Administration), POLREPS (EPA Pollution Reports), US Coast Guard data.
7
Measuring Benefits of Spill PreventionMeasuring Benefits of Spill Prevention
Benefits to Consumers � The measure of benefits to consumers from the avoided
impact on resources is the willingness-to-pay (WTP) toprevent environmental damages from oil spills.
� Environment is a public good – the total benefits to consumers of a policy/regulation to protect theenvironment = sum of individual WTP.
� Data on WTP to prevent environmental damages from oilspills are limited to marine water bodies.
� Other models are available: Random utility models(RUM), Market models.
8
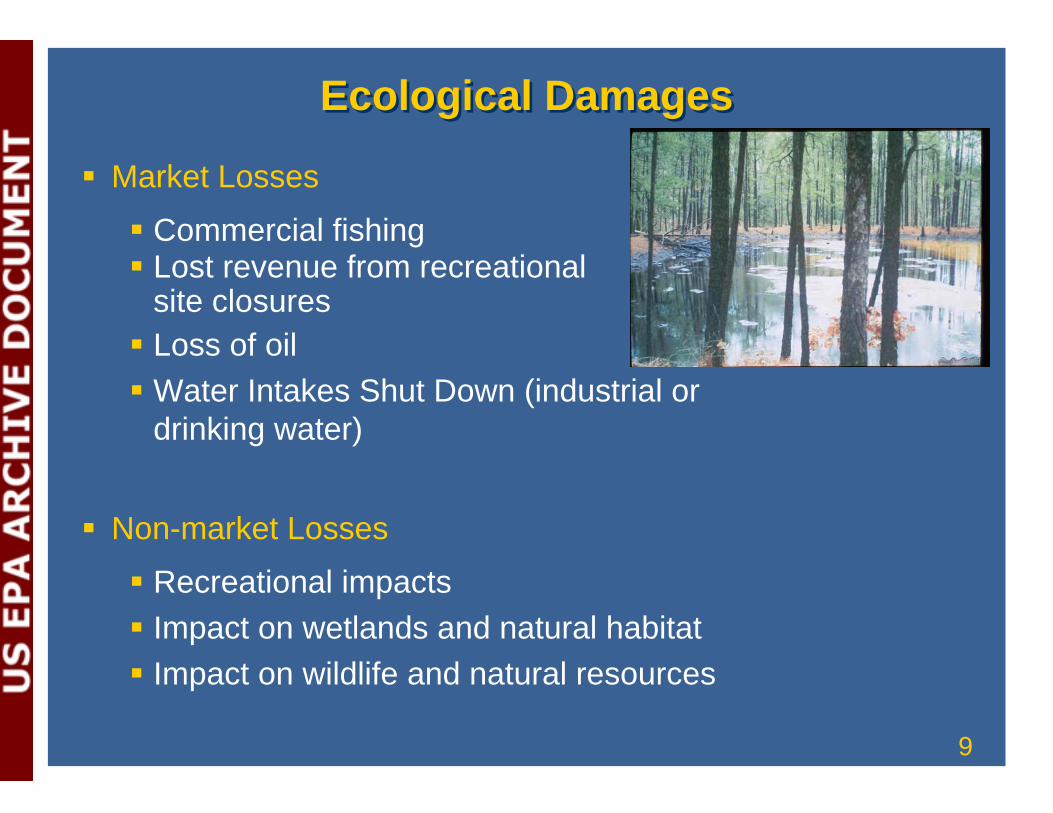
Ecological DamagesEcological Damages
9
� Market Losses
� Commercial fishing� Lost revenue from recreational
site closures � Loss of oil � Water Intakes Shut Down (industrial or
drinking water)
� Non-market Losses
� Recreational impacts � Impact on wetlands and natural habitat � Impact on wildlife and natural resources
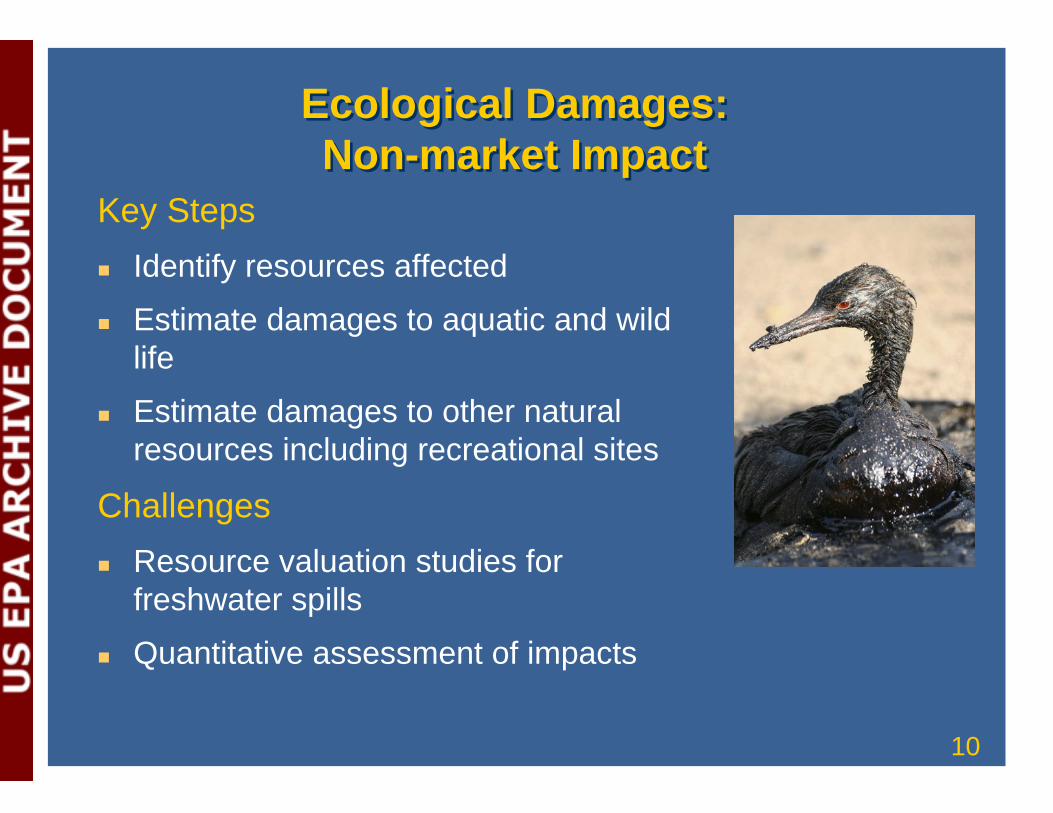
Ecological Damages:Ecological Damages:Non-market ImpactNon-market Impact
Key Steps � Identify resources affected
� Estimate damages to aquatic and wild life
� Estimate damages to other natural resources including recreational sites
Challenges � Resource valuation studies for
freshwater spills
� Quantitative assessment of impacts
10
Ecological Impacts QuantifiedEcological Impacts Quantifiedin Natural Resource Damage Assessmentsin Natural Resource Damage Assessments
Chalk Point, MD: 140,000 gallons fuel oil spill, 2000: � 76 acres of wetlands oiled
� 696 birds, 376 muskrats, 122 diamondback terrapins estimated dead
� Restoration projects:
– Duck nesting habitat: $589,900
– Tidal marsh, Washington Creek: $754,600
East Walker River, CA: 3,600 gallons fuel oil spill, 2000: � 1 Virginia rail, 2 dippers, 1 mink, and 6 beavers collected dead
� 1 merganser, 1 heron, 1 bald eagle spotted alive and oiled
� Riparian habitat improvement project: $11,500
11
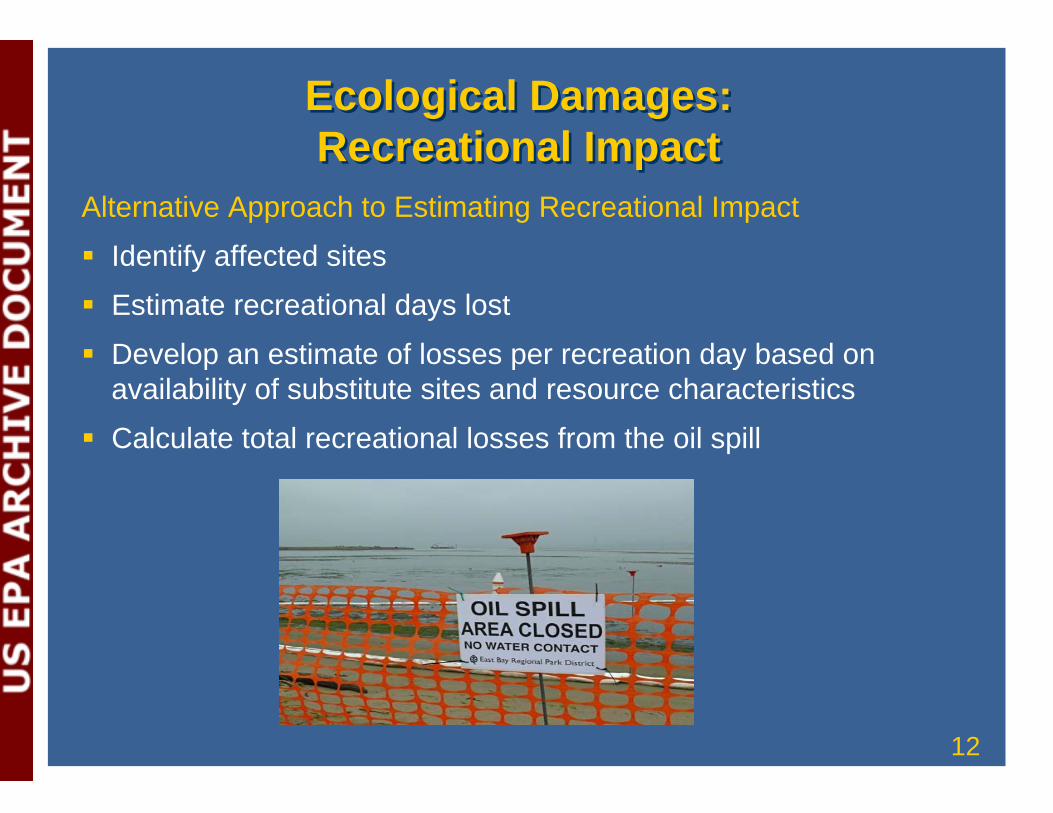
Ecological Damages:Ecological Damages: Recreational ImpactRecreational Impact
Alternative Approach to Estimating Recreational Impact
� Identify affected sites
� Estimate recreational days lost
� Develop an estimate of losses per recreation day based on availability of substitute sites and resource characteristics
� Calculate total recreational losses from the oil spill
12

Recreational Impacts QuantifiedRecreational Impacts Quantified in Natural Resource Damage Assessmentsin Natural Resource Damage Assessments
Chalk Point, MD: � ADA-Accessible Kayak/Boat Ramp: $95,485
� Boardwalk, trail, interpretive signs, benches, parking: $97,986
� Estimated lost recreational value: 125,000 trips / $453,500
East Walker River, CA: � Riparian Enhancement: $12,500
� Outdoor Recreational Improvement: $347,300 (partly funded by USFS) – improve access w/ toilets, interpretive signs, fencing sensitive areas
� Estimated recreational fishing value damages: $232,540
13
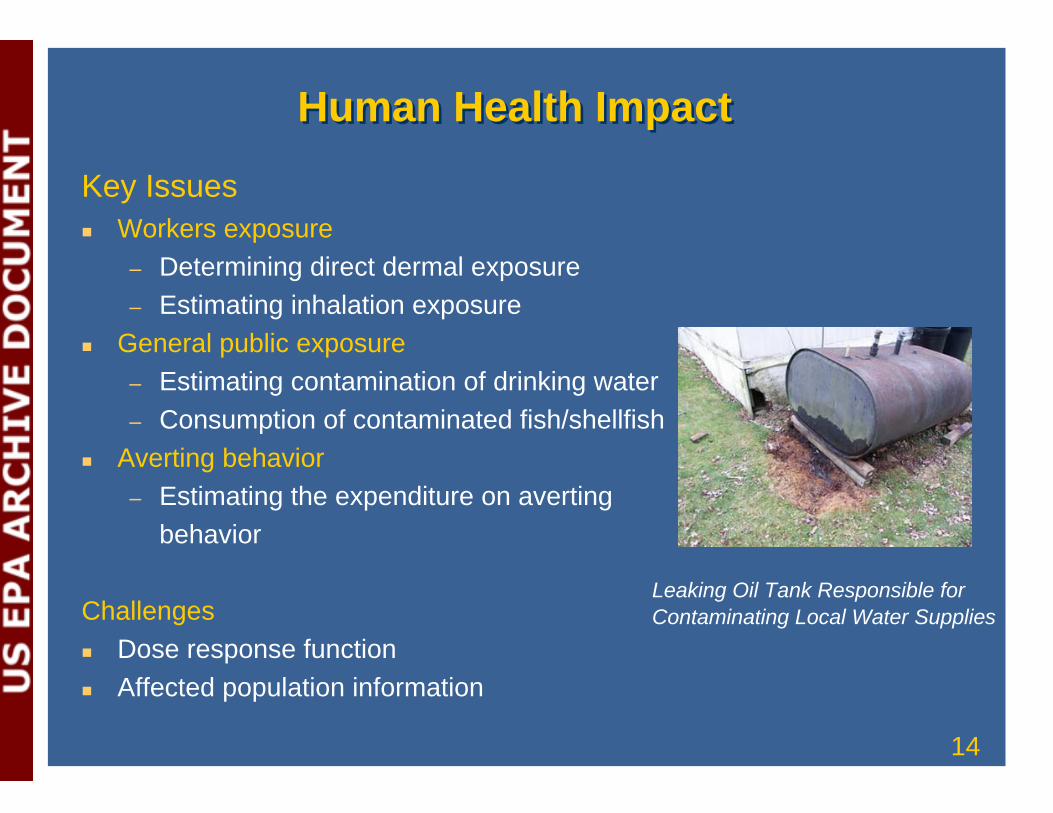
Human Health ImpactHuman Health Impact
Key Issues � Workers exposure
– Determining direct dermal exposure – Estimating inhalation exposure
� General public exposure – Estimating contamination of drinking water
Leaking Oil Tank Responsible forContaminating Local Water Supplies
– Consumption of contaminated fish/shellfish � Averting behavior
– Estimating the expenditure on averting behavior
Challenges � Dose response function � Affected population information
14
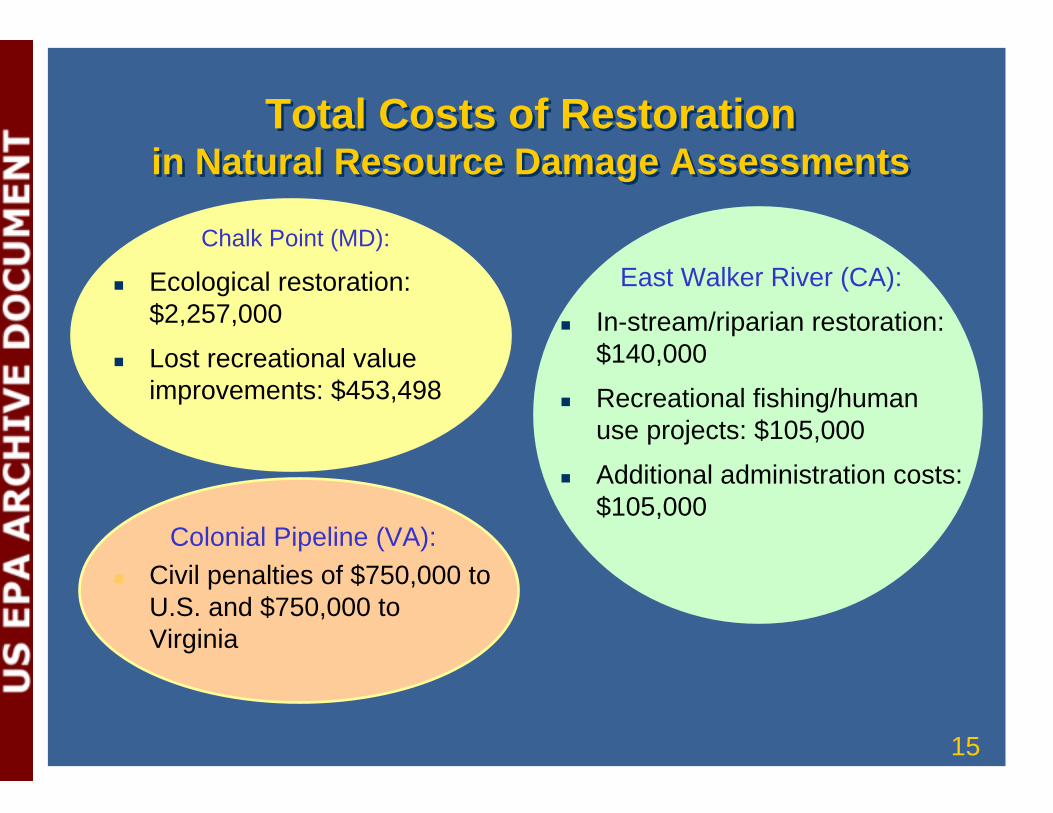
Total Costs of RestorationTotal Costs of Restorationin Natural Resource Damage Assessmentsin Natural Resource Damage Assessments
Chalk Point (MD):
� Ecological restoration: $2,257,000
� Lost recreational value improvements: $453,498
Colonial Pipeline (VA): � Civil penalties of $750,000 to
U.S. and $750,000 to Virginia
East Walker River (CA):
� In-stream/riparian restoration: $140,000
� Recreational fishing/human use projects: $105,000
� Additional administration costs: $105,000
15
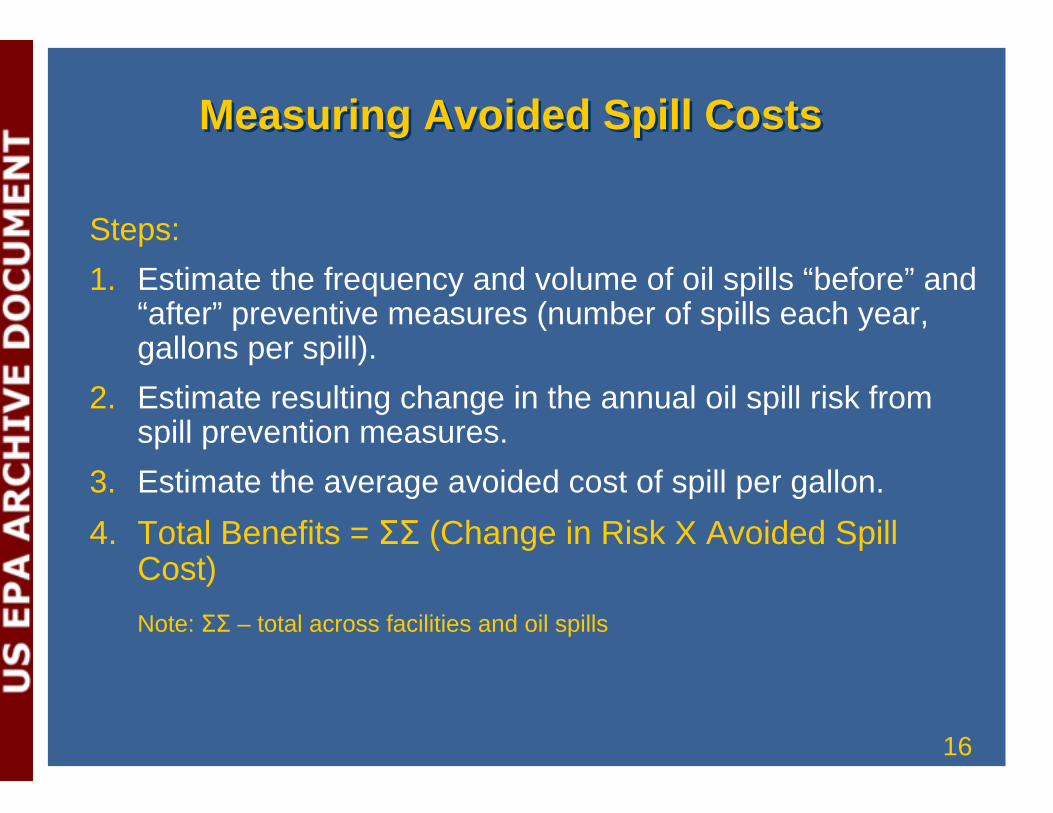
Measuring Avoided Spill CostsMeasuring Avoided Spill Costs
Steps: 1. Estimate the frequency and volume of oil spills “before” and
“after” preventive measures (number of spills each year,gallons per spill).
2. Estimate resulting change in the annual oil spill risk fromspill prevention measures.
3. Estimate the average avoided cost of spill per gallon. 4. Total Benefits = ΣΣ (Change in Risk X Avoided Spill
Cost) Note: ΣΣ – total across facilities and oil spills
16
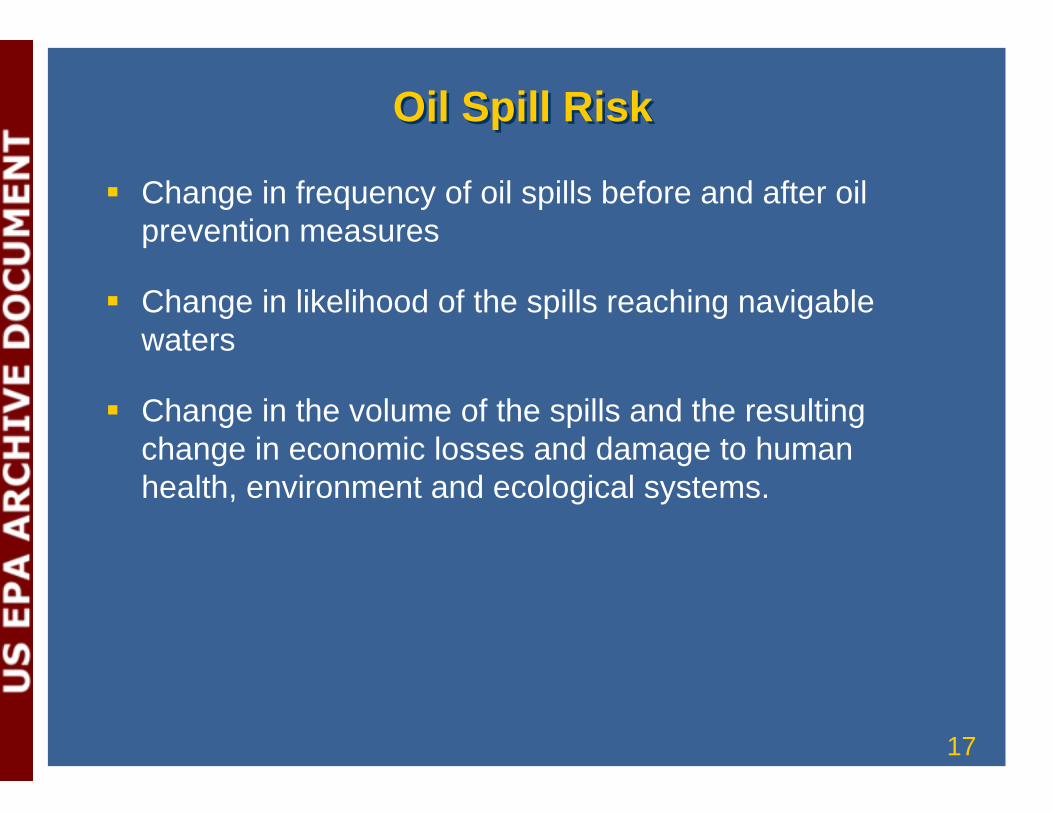
Oil Spill RiskOil Spill Risk
� Change in frequency of oil spills before and after oil prevention measures
� Change in likelihood of the spills reaching navigable waters
� Change in the volume of the spills and the resulting change in economic losses and damage to human health, environment and ecological systems.
17
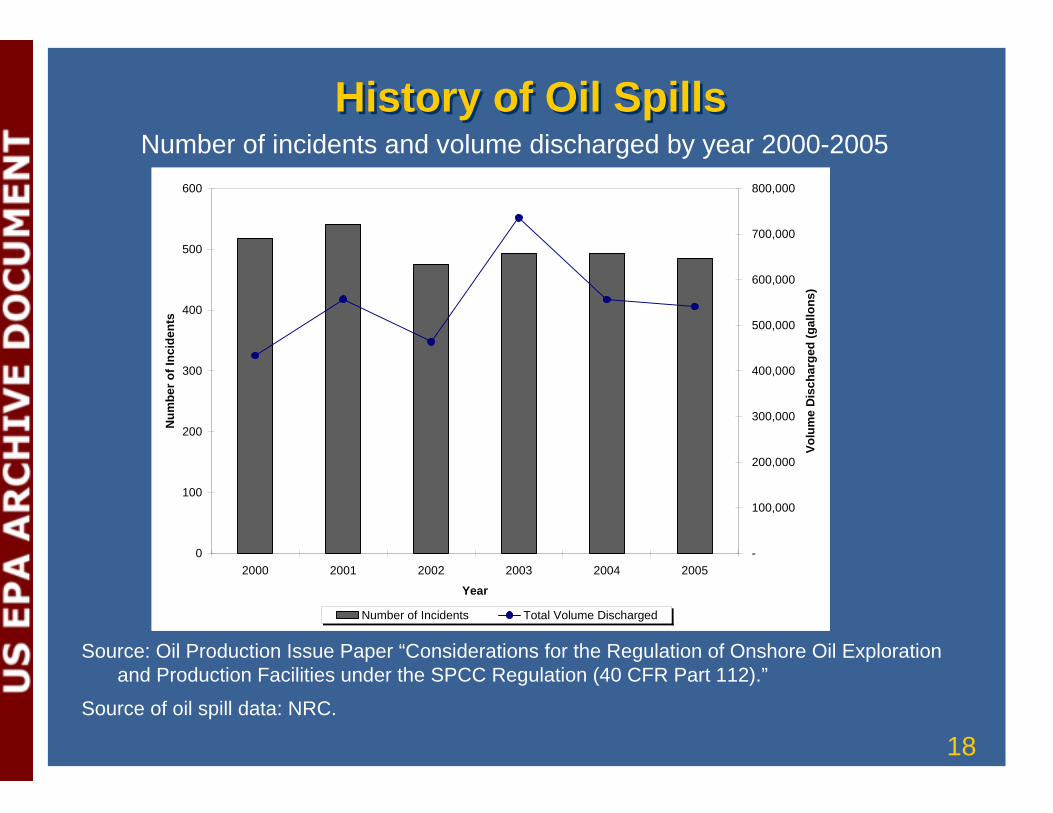
History of Oil SpillsHistory of Oil SpillsNumber of incidents and volume discharged by year 2000-2005
Source: Oil Production Issue Paper “Considerations for the Regulation of Onshore Oil Exploration and Production Facilities under the SPCC Regulation (40 CFR Part 112).”
Source of oil spill data: NRC.
18
0
100
200
300
400
500
600
2000 2001 2002 2003 2004 2005
Year
Num
ber o
f Inc
iden
ts
-
100,000
200,000
300,000
400,000
500,000
600,000
700,000
800,000
Volu
me
Dis
char
ged
(gal
lons
)
Number of Incidents Total Volume Discharged
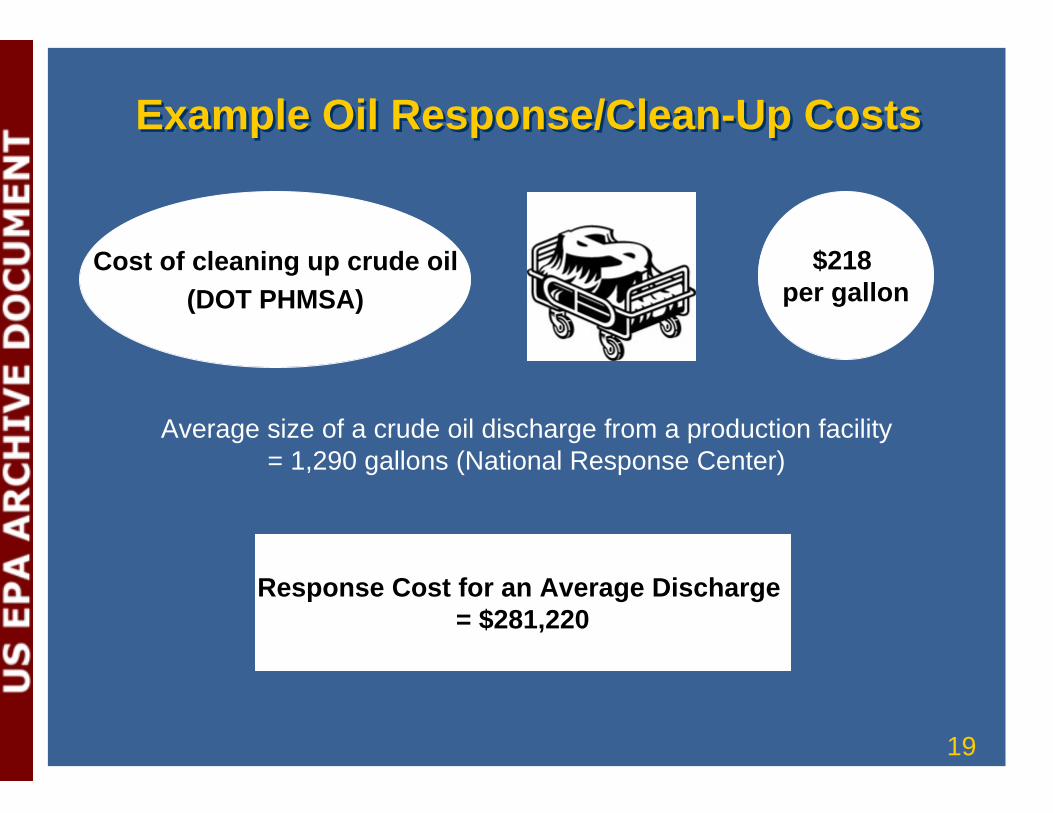
Example Oil Response/Clean-Up CostsExample Oil Response/Clean-Up Costs
19
Cost of cleaning up crude oil (DOT PHMSA)
$218 per gallon
Average size of a crude oil discharge from a production facility = 1,290 gallons (National Response Center)
Response Cost for an Average Discharge = $281,220
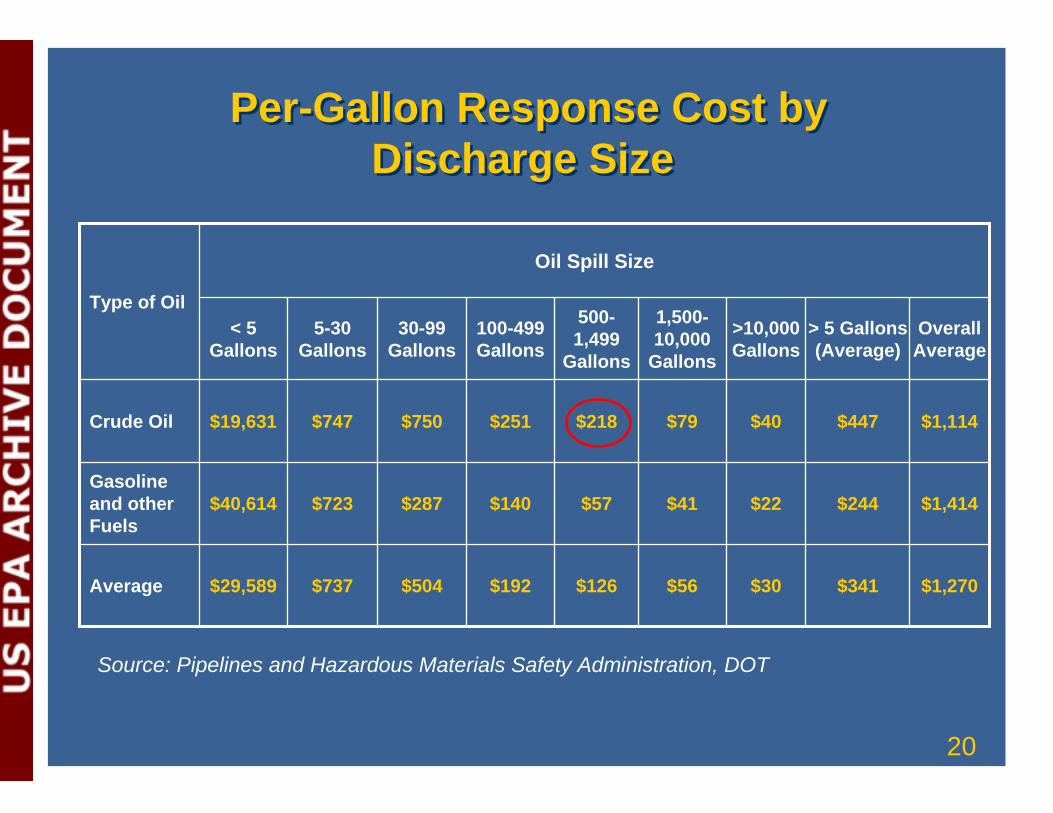
Per-Gallon Response Cost byPer-Gallon Response Cost by Discharge SizeDischarge Size
Oil Spill Size
Type of Oil 500- 1,500-< 5 5-30 30-99 100-499 >10,000 > 5 Gallons Overall1,499 10,000Gallons Gallons Gallons Gallons Gallons (Average) AverageGallons Gallons
Crude Oil $19,631 $747 $750 $251 $79 $40 $447 $1,114
Gasoline and other Fuels
$40,614 $723 $287 $140 $57 $41 $22 $244 $1,414
Average $29,589 $737 $504 $192 $126 $56 $30 $341 $1,270
Source: Pipelines and Hazardous Materials Safety Administration, DOT
$218
20
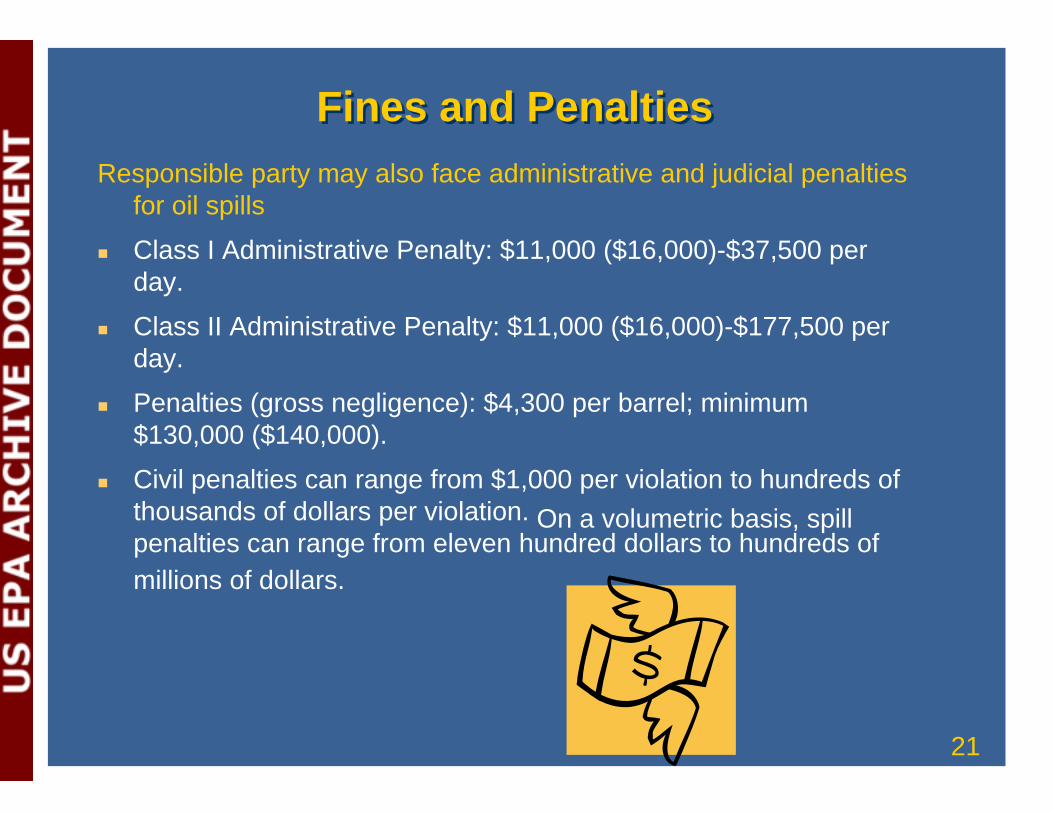
Fines and PenaltiesFines and PenaltiesResponsible party may also face administrative and judicial penalties
for oil spills
� Class I Administrative Penalty: $11,000 ($16,000)-$37,500 per day.
� Class II Administrative Penalty: $11,000 ($16,000)-$177,500 per day.
� Penalties (gross negligence): $4,300 per barrel; minimum $130,000 ($140,000).
� Civil penalties can range from $1,000 per violation to hundreds of thousands of dollars per violation. On a volumetric basis, spill penalties can range from eleven hundred dollars to hundreds of millions of dollars.
21
LimitationsLimitations
� Accounts for avoided cost per unit of oil spilled only, not total avoided costs resulting from SPCC.
� Limited spill data for estimating change in oil spill risk – which is needed to estimate total avoided costs.
� Limited spill data for estimating ecological and human health impact.
� Facilities use oil spill prevention measures for many reasons, not just Federal or State requirements.
22
Summary FindingsSummary Findings
� Oil spills from transportation and non-transportation-related facilities create losses and damages to individuals, communities, and the overall U.S. economy.
� Response cost of an average size spill (1,290 gallons) in oil production sector -- $281,000.
� Between 2002-2006 average penalty per case ranged from $4,400 to $230,400 per case.
� These losses and damages are preventable.
23
Potential Future WorkPotential Future Work
� Conduct a consequence analysis to measure total benefits from specific spill scenarios.
� Conduct a survey of regulated facilities to collect data on oil spill history and spill risk.
� Conduct focus groups and discussions with trade associations of regulated industry and professional engineers to identify motivation for implementing spill prevention measures.
24
Questions or Comments?
George Denning Economist
U.S. Environmental Protection Agency (202) 564-2404
Questions orComments?
George DenningEconomist
U.S. Environmental Protection Agency(202) 564-2404
25