Measuring and Modeling Nominal Operating Cell Temperature ... · Measuring and Modeling Nominal...
15
NREL is a national laboratory of the U.S. Department of Energy, Office of Energy Efficiency and Renewable Energy, operated by the Alliance for Sustainable Energy, LLC. NREL Test & Evaluation Matthew Muller Sept 22-23, 2010 PV Performance Modeling Workshop Albuquerque, NM NREL/PR-520-49505 Measuring and Modeling Nominal Operating Cell Temperature (NOCT)
Transcript of Measuring and Modeling Nominal Operating Cell Temperature ... · Measuring and Modeling Nominal...
NREL is a national laboratory of the U.S. Department of Energy, Office of Energy Efficiency and Renewable Energy, operated by the Alliance for Sustainable Energy, LLC.
NRELTest & Evaluation
Matthew Muller
Sept 22-23, 2010PV Performance Modeling WorkshopAlbuquerque, NM
NREL/PR-520-49505
Measuring and Modeling Nominal Operating Cell Temperature (NOCT)
Outline• Overview of NOCT (IEC 61215)• Motivation for NOCT research• Basic Heat transfer model in relation to NOCT• Hypothesis and Testing at NREL• Results for single module over 8 months• Side by Side comparison of 3 modules with
substantially different reported NOCT values• Problems with the NOCT procedure• Unanswered questions• Conclusions and continuing work
National Renewable Energy Laboratory Innovation for Our Energy Future2
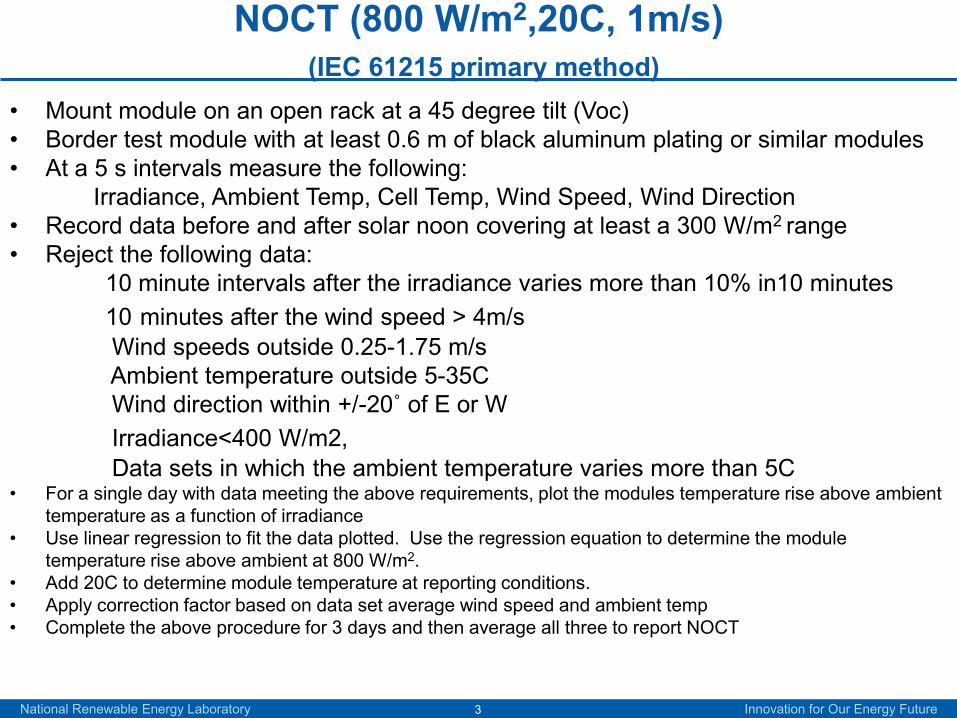
NOCT (800 W/m2,20C, 1m/s)(IEC 61215 primary method)
National Renewable Energy Laboratory Innovation for Our Energy Future3
• Mount module on an open rack at a 45 degree tilt (Voc)• Border test module with at least 0.6 m of black aluminum plating or similar modules• At a 5 s intervals measure the following:
Irradiance, Ambient Temp, Cell Temp, Wind Speed, Wind Direction• Record data before and after solar noon covering at least a 300 W/m2 range• Reject the following data:
10 minute intervals after the irradiance varies more than 10% in10 minutes 10 minutes after the wind speed > 4m/s Wind speeds outside 0.25-1.75 m/sAmbient temperature outside 5-35C Wind direction within +/-20˚ of E or WIrradiance<400 W/m2,Data sets in which the ambient temperature varies more than 5C
• For a single day with data meeting the above requirements, plot the modules temperature rise above ambient temperature as a function of irradiance
• Use linear regression to fit the data plotted. Use the regression equation to determine the module temperature rise above ambient at 800 W/m2.
• Add 20C to determine module temperature at reporting conditions.• Apply correction factor based on data set average wind speed and ambient temp• Complete the above procedure for 3 days and then average all three to report NOCT
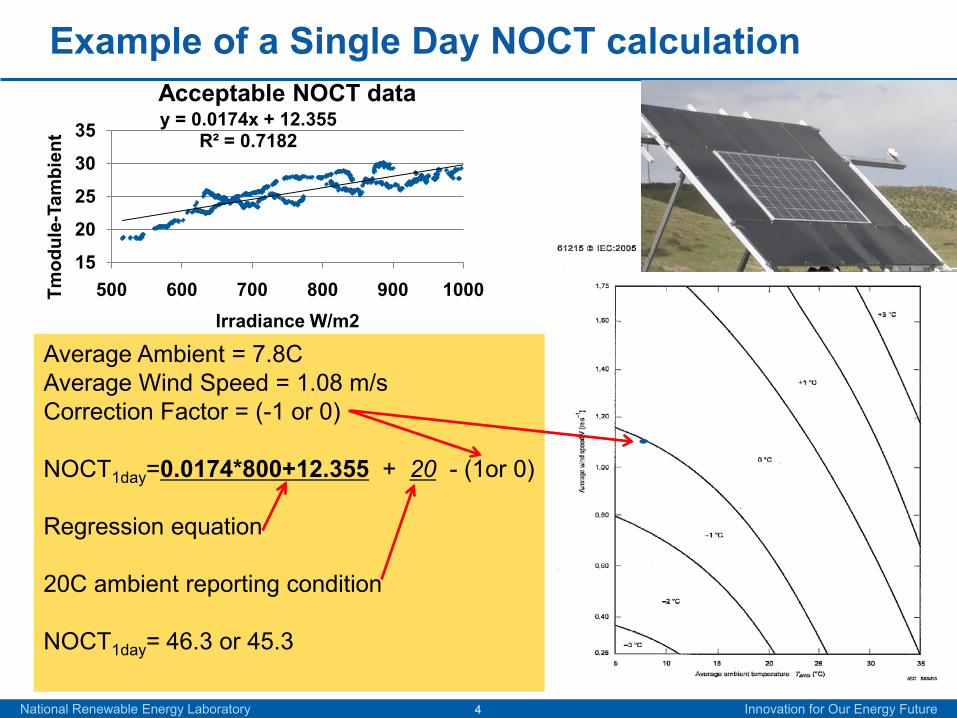
Example of a Single Day NOCT calculation
National Renewable Energy Laboratory Innovation for Our Energy Future4
y = 0.0174x + 12.355R² = 0.7182
15
20
25
30
35
500 600 700 800 900 1000Tmod
ule-
Tam
bien
t
Irradiance W/m2
Acceptable NOCT data
Average Ambient = 7.8CAverage Wind Speed = 1.08 m/sCorrection Factor = (-1 or 0)
NOCT1day=0.0174*800+12.355 + 20 - (1or 0)
Regression equation
20C ambient reporting condition
NOCT1day= 46.3 or 45.3
Motivation for NOCT research
National Renewable Energy Laboratory Innovation for Our Energy Future5
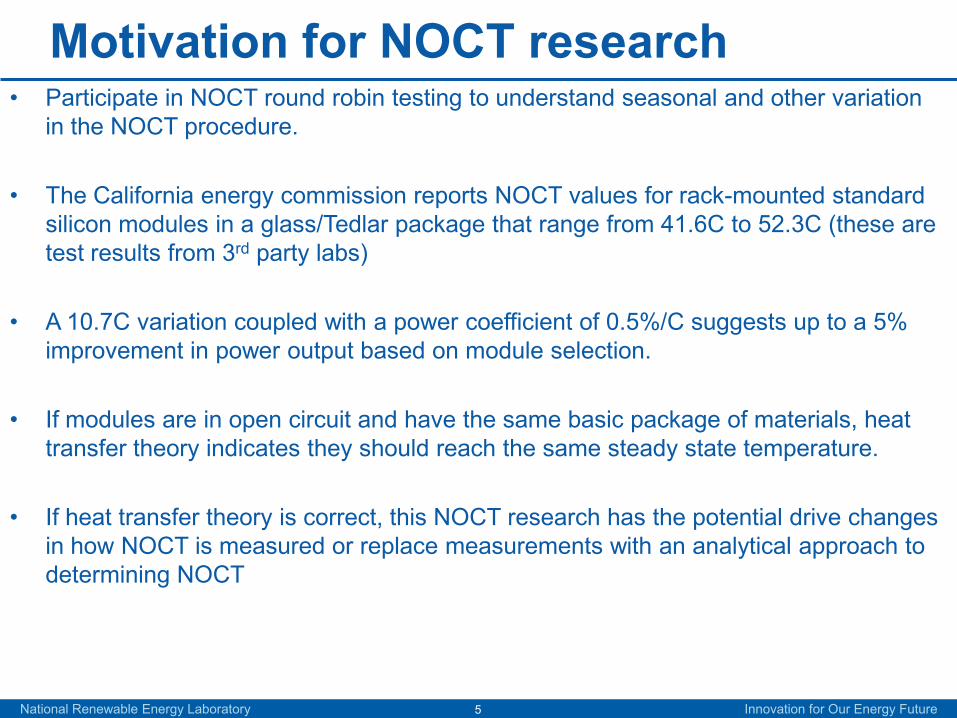
• Participate in NOCT round robin testing to understand seasonal and other variation in the NOCT procedure.
• The California energy commission reports NOCT values for rack-mounted standard silicon modules in a glass/Tedlar package that range from 41.6C to 52.3C (these are test results from 3rd party labs)
• A 10.7C variation coupled with a power coefficient of 0.5%/C suggests up to a 5% improvement in power output based on module selection.
• If modules are in open circuit and have the same basic package of materials, heat transfer theory indicates they should reach the same steady state temperature.
• If heat transfer theory is correct, this NOCT research has the potential drive changes in how NOCT is measured or replace measurements with an analytical approach to determining NOCT
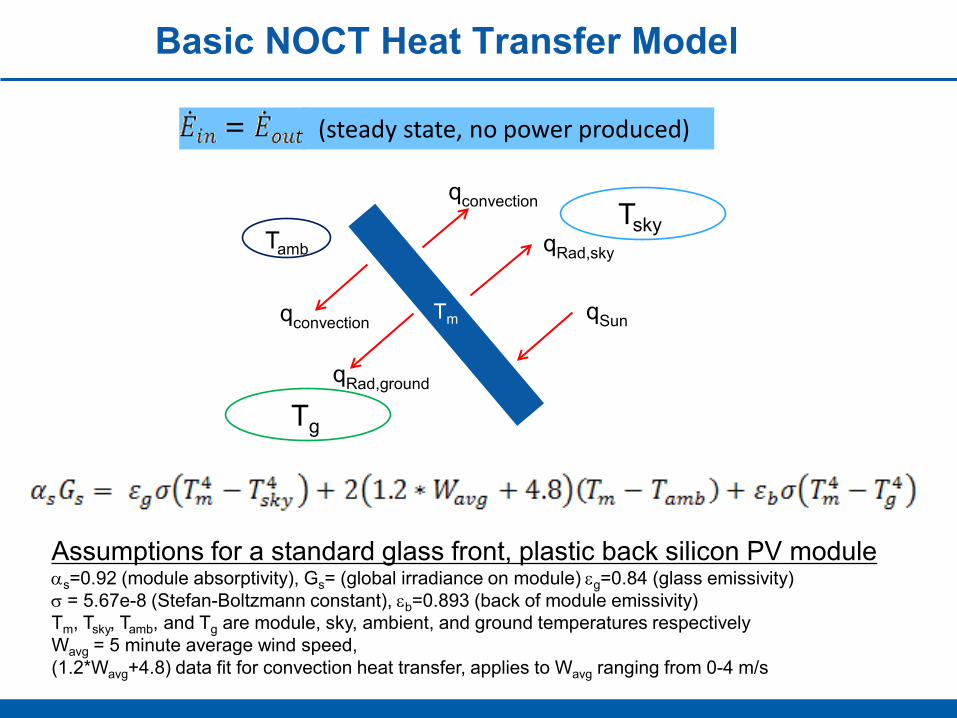
Basic NOCT Heat Transfer Model
(steady state, no power produced)
Tm
Tsky
Tg
qRad,ground
qRad,sky
qSun
qconvection
qconvection
Tamb
Assumptions for a standard glass front, plastic back silicon PV moduleαs=0.92 (module absorptivity), Gs= (global irradiance on module) εg=0.84 (glass emissivity)σ = 5.67e-8 (Stefan-Boltzmann constant), εb=0.893 (back of module emissivity)Tm, Tsky, Tamb, and Tg are module, sky, ambient, and ground temperatures respectivelyWavg = 5 minute average wind speed,(1.2*Wavg+4.8) data fit for convection heat transfer, applies to Wavg ranging from 0-4 m/s
Heat Transfer Model Against NOCT data
National Renewable Energy Laboratory Innovation for Our Energy Future7
295300305310315320325330335
7:12 9:36 12:00 14:24 16:48
Tcel
l,Kel
vin
Time
3/16/2010
Tmeasure Tpredicted
305310315320325330335340
7:12 9:36 12:00 14:24 16:48
Tcel
l, K
elvi
n
Time
9/17/2010
Tmeasured Tpredicted
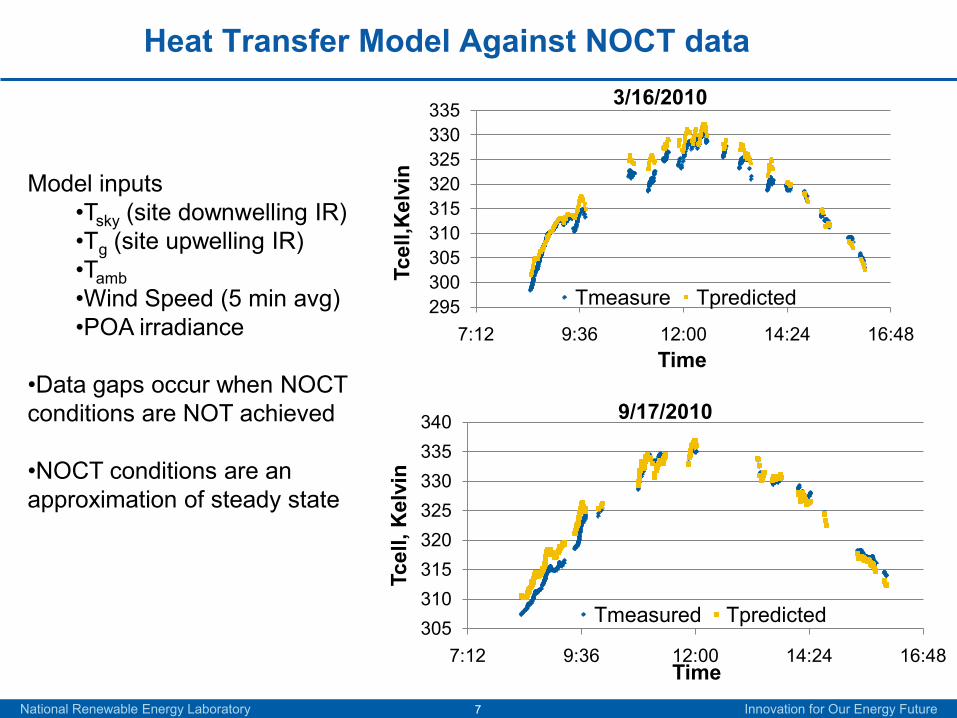
Model inputs•Tsky (site downwelling IR)•Tg (site upwelling IR)•Tamb•Wind Speed (5 min avg)•POA irradiance
•Data gaps occur when NOCT conditions are NOT achieved
•NOCT conditions are an approximation of steady state
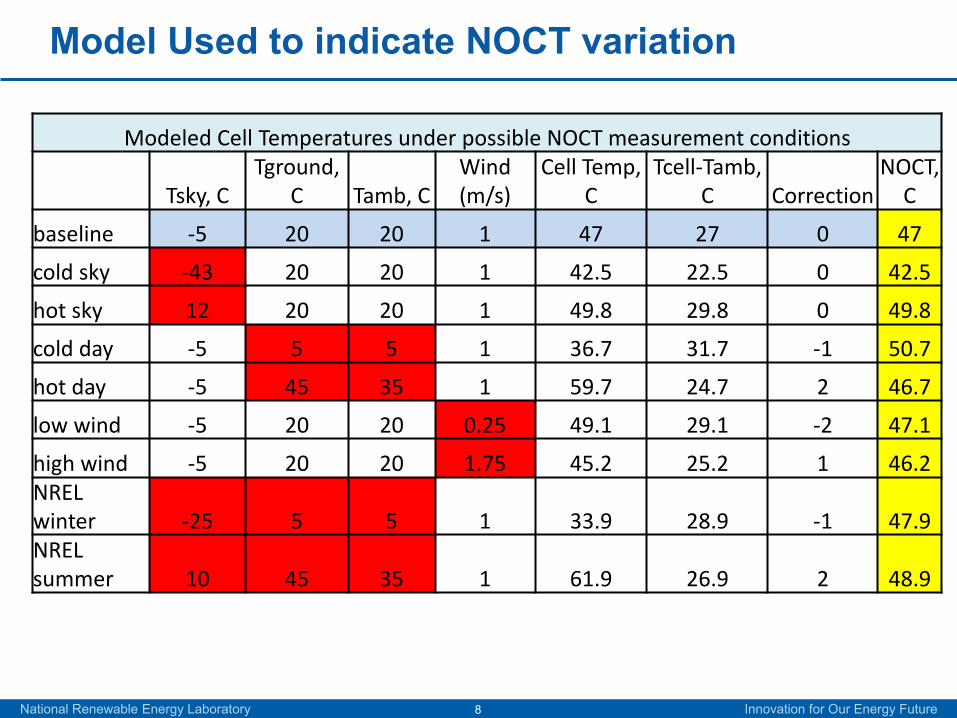
Model Used to indicate NOCT variation
Modeled Cell Temperatures under possible NOCT measurement conditions
Tsky, CTground,
C Tamb, CWind (m/s)
Cell Temp, C
Tcell-Tamb, C Correction
NOCT, C
baseline -5 20 20 1 47 27 0 47
cold sky -43 20 20 1 42.5 22.5 0 42.5
hot sky 12 20 20 1 49.8 29.8 0 49.8
cold day -5 5 5 1 36.7 31.7 -1 50.7
hot day -5 45 35 1 59.7 24.7 2 46.7
low wind -5 20 20 0.25 49.1 29.1 -2 47.1
high wind -5 20 20 1.75 45.2 25.2 1 46.2NREL winter -25 5 5 1 33.9 28.9 -1 47.9NREL summer 10 45 35 1 61.9 26.9 2 48.9
National Renewable Energy Laboratory Innovation for Our Energy Future8
Hypothesis and Testing at NREL
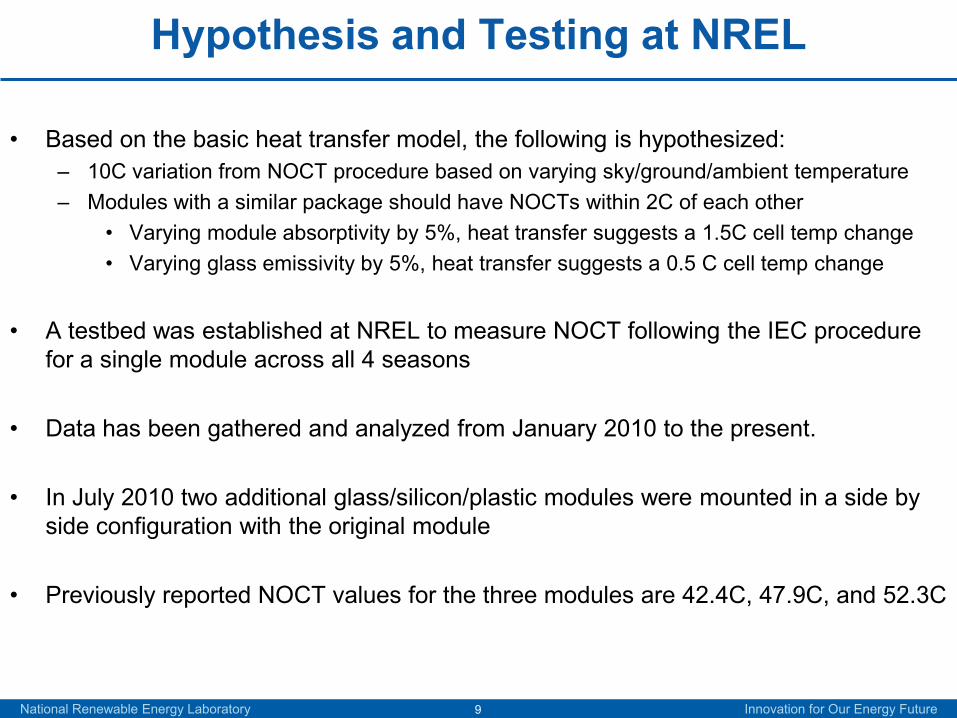
• Based on the basic heat transfer model, the following is hypothesized:– 10C variation from NOCT procedure based on varying sky/ground/ambient temperature– Modules with a similar package should have NOCTs within 2C of each other
• Varying module absorptivity by 5%, heat transfer suggests a 1.5C cell temp change• Varying glass emissivity by 5%, heat transfer suggests a 0.5 C cell temp change
• A testbed was established at NREL to measure NOCT following the IEC procedure for a single module across all 4 seasons
• Data has been gathered and analyzed from January 2010 to the present.
• In July 2010 two additional glass/silicon/plastic modules were mounted in a side by side configuration with the original module
• Previously reported NOCT values for the three modules are 42.4C, 47.9C, and 52.3C
National Renewable Energy Laboratory Innovation for Our Energy Future9
8 Month Results for Single Module
National Renewable Energy Laboratory Innovation for Our Energy Future10
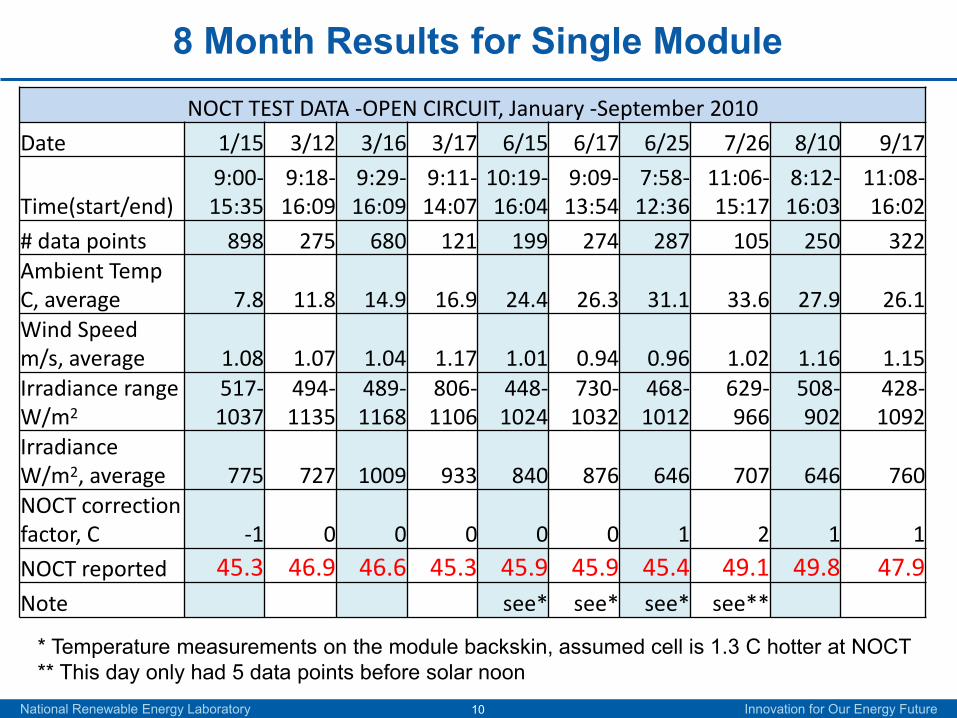
NOCT TEST DATA -OPEN CIRCUIT, January -September 2010
Date 1/15 3/12 3/16 3/17 6/15 6/17 6/25 7/26 8/10 9/17
Time(start/end)9:00-15:35
9:18-16:09
9:29-16:09
9:11-14:07
10:19-16:04
9:09-13:54
7:58-12:36
11:06-15:17
8:12-16:03
11:08-16:02
# data points 898 275 680 121 199 274 287 105 250 322Ambient Temp C, average 7.8 11.8 14.9 16.9 24.4 26.3 31.1 33.6 27.9 26.1Wind Speed m/s, average 1.08 1.07 1.04 1.17 1.01 0.94 0.96 1.02 1.16 1.15Irradiance range W/m2
517-1037
494-1135
489-1168
806-1106
448-1024
730-1032
468-1012
629-966
508-902
428-1092
Irradiance W/m2, average 775 727 1009 933 840 876 646 707 646 760NOCT correction factor, C -1 0 0 0 0 0 1 2 1 1
NOCT reported 45.3 46.9 46.6 45.3 45.9 45.9 45.4 49.1 49.8 47.9Note see* see* see* see**
* Temperature measurements on the module backskin, assumed cell is 1.3 C hotter at NOCT** This day only had 5 data points before solar noon
Comments on 8 month Results
• Lowest 3 day average is 45.33 C NOCT
• Highest 3 day average is 48.9 C NOCT
• This is within +/-4C uncertainty associated with the NOCT procedure
• Only 10 days over 8 months suggest procedure is too limited
• Several good days were unusable because the temperature increased more than 5C over the needed irradiance range
• 2 potential days were lost due to measurement problems
• 2 days had to be thrown out due to snow on the ground. Module temperature was elevated by 2 degrees due to irradiance to the back side
National Renewable Energy Laboratory Innovation for Our Energy Future11
NREL Test Results for 3 Modules Reported to Have NOCT Values of 42.4C, 47.9C, and 52.3C
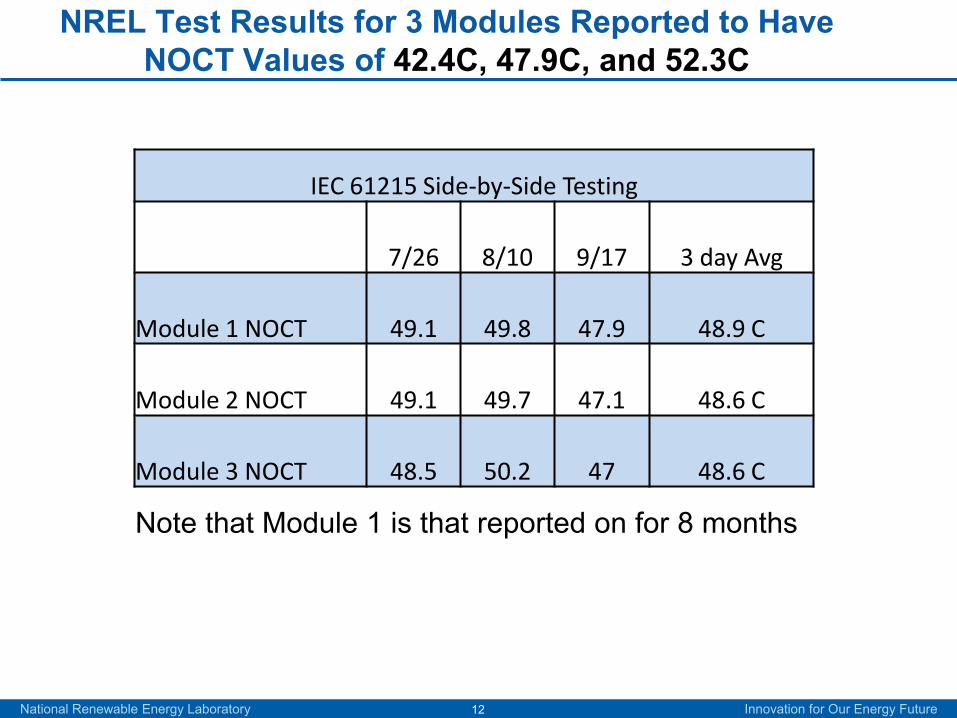
IEC 61215 Side-by-Side Testing
7/26 8/10 9/17 3 day Avg
Module 1 NOCT 49.1 49.8 47.9 48.9 C
Module 2 NOCT 49.1 49.7 47.1 48.6 C
Module 3 NOCT 48.5 50.2 47 48.6 C
National Renewable Energy Laboratory Innovation for Our Energy Future12
Note that Module 1 is that reported on for 8 months
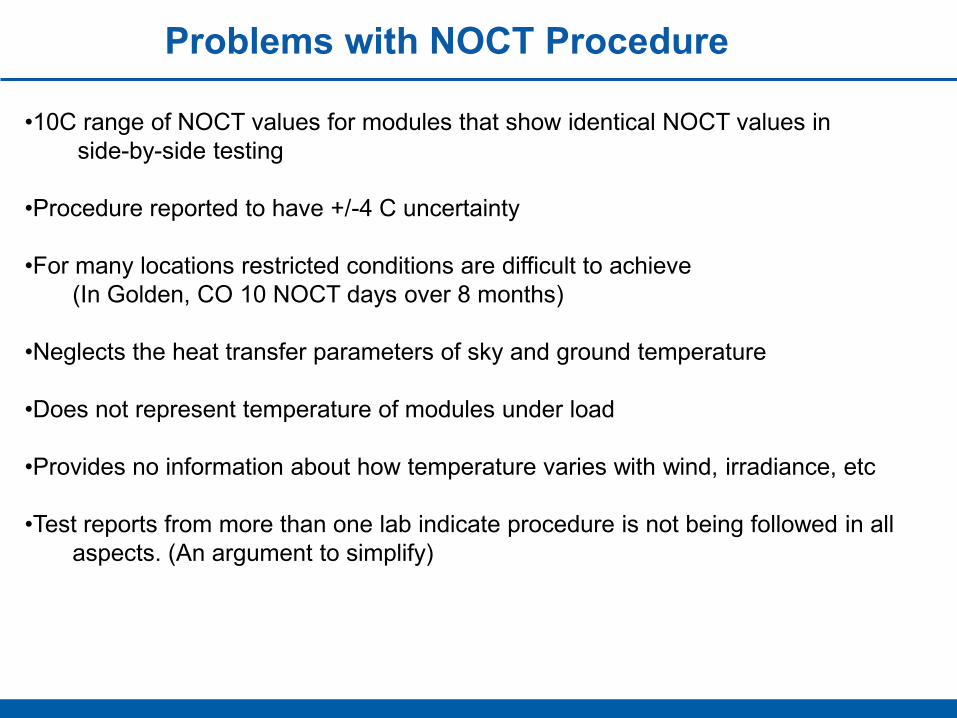
Problems with NOCT Procedure
•10C range of NOCT values for modules that show identical NOCT values in side-by-side testing
•Procedure reported to have +/-4 C uncertainty
•For many locations restricted conditions are difficult to achieve(In Golden, CO 10 NOCT days over 8 months)
•Neglects the heat transfer parameters of sky and ground temperature
•Does not represent temperature of modules under load
•Provides no information about how temperature varies with wind, irradiance, etc
•Test reports from more than one lab indicate procedure is not being followed in allaspects. (An argument to simplify)
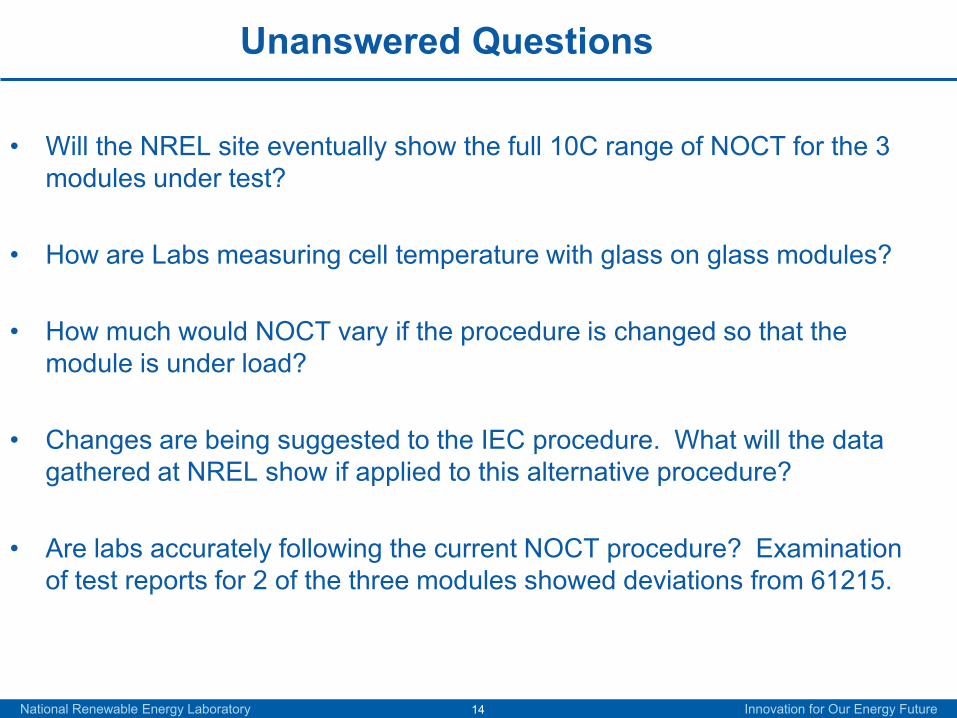
Unanswered Questions
• Will the NREL site eventually show the full 10C range of NOCT for the 3 modules under test?
• How are Labs measuring cell temperature with glass on glass modules?
• How much would NOCT vary if the procedure is changed so that the module is under load?
• Changes are being suggested to the IEC procedure. What will the data gathered at NREL show if applied to this alternative procedure?
• Are labs accurately following the current NOCT procedure? Examination of test reports for 2 of the three modules showed deviations from 61215.
National Renewable Energy Laboratory Innovation for Our Energy Future14
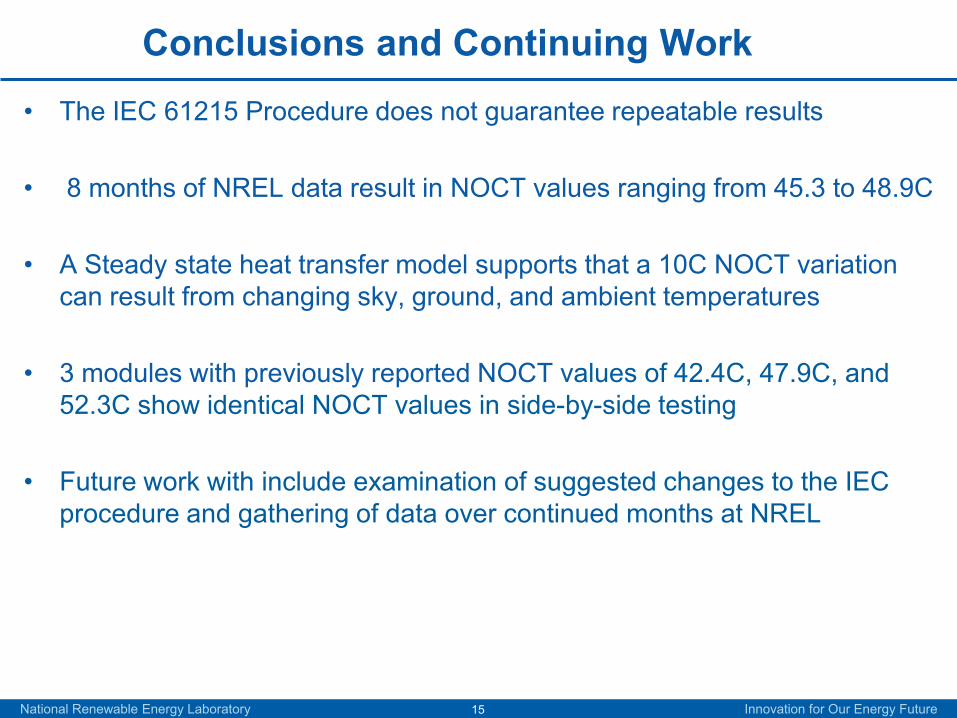
Conclusions and Continuing Work
• The IEC 61215 Procedure does not guarantee repeatable results
• 8 months of NREL data result in NOCT values ranging from 45.3 to 48.9C
• A Steady state heat transfer model supports that a 10C NOCT variation can result from changing sky, ground, and ambient temperatures
• 3 modules with previously reported NOCT values of 42.4C, 47.9C, and 52.3C show identical NOCT values in side-by-side testing
• Future work with include examination of suggested changes to the IEC procedure and gathering of data over continued months at NREL
National Renewable Energy Laboratory Innovation for Our Energy Future15