Measures of Project Management Performance and Value
44
Comprehensive List of Measures Page 1 of 34 Measures of Project Management Performance and Value A BENCHMARK OF CURRENT BUSINESS PRACTICES
Transcript of Measures of Project Management Performance and Value

Comprehensive List of Measures
Page 1 of 34
Measures of
Project Management Performance and Value
A BENCHMARK OF CURRENT BUSINESS PRACTICES

Comprehensive List of Measures
Page 2 of 34
Comprehensive List of Measures of PM Performance & Value Implementing a pmValue Measurement System to measure project management performance and value will help organizations achieve one or more of the following goals:
• to identify the business impact of implementing project management improvement initiatives • to compare costs to benefits of project management improvement initiatives • to determine if a project management improvement initiative is accomplishing its objectives • to assist in marketing future project management improvement initiatives.
Note that these goals are based on determining the value of implementing project management improvement initiatives in the organization. That value is determined by showing improvement in some measure or measures over time. Choosing those measures is key to the success of the pmValue Measurement System. PM Solutions Center for Business Practices has compiled an extensive list of possible measures for consideration. These measures are a starting point for a pmValue Scorecard development process, not a simple menu to craft a pmValue Scorecard from. So use the list as a starting point to think about measures that are most important to your organization’s goals. We recommend that you select 3-7 measures for your measurement system (it’s too difficult and costly to collect too many measures). Also note that you will be selecting measures of project management value rather than measures of project performance. The key difference in performance measures versus value measures is the reason for doing the measuring. In measuring performance, you are trying to gather information to help you make management decisions to affect change that, hopefully, will improve that performance. For example, project performance measures are undertaken to provide information to managers in order to exert control over the project. Those measures must be appropriate to the organizational level that can immediately effect change based on information it learns in order to control the performance of the project at hand (measuring the earned value of the project will provide information on the performance of the project to allow managers to make critical decisions to bring the project to closure successfully). These measures must be collected fairly often, perhaps even weekly, depending on the duration of the project. In measuring value, you are trying to demonstrate that decisions you made to implement change (project management improvement initiatives) has indeed added value to the organization. So you are measuring value rather than performance (which may or may not be the same). Sometimes (usually) improved performance can be translated into value. For example, improving schedule performance for all your projects over a period of a year can be translated into improvement in average project cycle time, which can be translated into improvement in time to market, which can add significant value to your organization. Value measures, therefore, provide information on the performance of the organization rather than the performance of a project. They must be collected over a longer period of time (no more than quarterly) and over your portfolio of projects.

Comprehensive List of Measures
Page 3 of 34
TOP 10 PROJECT MANAGEMENT BENCHMARKING MEASURES James S. Pennypacker Director-Center for Business Practices, PM Solutions There is no single set of measures that universally applies to all companies. The appropriate set of measures depends on the organization’s strategy, technology, and the particular industry and environment in which they compete. That said, below are my choices for the top 10 measures an organization should benchmark to lead to project management success. The measures should be indexed—that is, averaged over a large number of similar types of projects over a period of time (for example, per year). Return on Investment (Net Benefits/Costs) x 100 The most appropriate formula for evaluating project investment (and project management investment) is Net Benefits divided by Cost. By multiplying this result by 100, this calculation determines the percentage return for every dollar you’ve invested. The key to this metric is in placing a dollar value on each unit of data that can be collected and used to measure Net Benefits. Sources of benefits can come from a variety of measures, including contribution to profit, savings of costs, increase in quantity of output converted to a dollar value, quality improvements translated into any of the first three measures. Costs might include the costs to design and develop and/or maintain the project or project management improvement initiative, cost of resources, cost of travel and expenses, cost to train, overhead costs, etc. Productivity Productivity is output produced per unit of input. Productivity measures tell you whether you’re getting your money’s worth from your people and other inputs to the organization. Typically the resources have to do with people, but not always. A straightforward way to normalize productivity measurement across organizations is to use revenue per employee as the key metric. Dividing revenue per employee by the average fully burdened salary per employee yields a ratio. This ratio is the average-per-employee “Productivity Ratio” for the organization as a whole. Other productivity metrics might be number of projects completed per employee, number of lines of code produced per employee. The key to selecting the right productivity measures is to ask whether the output being measured (the top half of the productivity ratio) is of value to your organization’s customers. Cost of Quality Cost of Quality/Actual Cost Cost of quality is the amount of money a business loses because its product or service was not done right in the first place. It includes total labor, materials, and overhead costs attributed to imperfections in the processes that deliver products or services that don’t meet specifications or expectations. These costs would include inspection, rework, duplicate work, scrapping rejects, replacements and refunds, complaints, loss of customers, and damage to reputation. Cost Performance Earned Value/Actual Cost The Cost Performance Index is a measure of cost efficiency. It’s determined by dividing the value of the work actually performed (the earned value) by the actual costs that it took to accomplish the earned value. The ability to accurately forecast cost performance allows organizations to confidently allocate capital, reducing financial risk, possibly reducing the cost of capital. CPI Standard Deviation is an even better metric, one that shows the accuracy of budget estimating. Schedule Performance Earned Value/Planned Value

Comprehensive List of Measures
Page 4 of 34
The Schedule Performance Index is the ratio of total original authorized duration versus total final project duration. The ability to accurately forecast schedule helps meet time-to-market windows. SPI Standard Deviation is an even better metric that shows the accuracy of schedule estimating. Customer Satisfaction Scale of 1-100 Customer satisfaction means that customer expectations are met. This requires a combination of conformance to requirements (the project must produce what it said it would produce) and fitness for use (the product or service produced must satisfy real needs). The Customer Satisfaction Index is an index comprising hard measures of customer buying/use behavior and soft measures of customer opinions or feelings. Index is weighted based on how important each value is in determining customer overall customer satisfaction and buying/use behavior. Includes measures such as repeat and lost customers (30%), revenue from existing customers (15%), market share (15%), customer satisfaction survey results (20%), complaints/returns (10%), and project-specific surveys (10%). Cycle Time There are two types of cycle time—project cycle and process cycle. The project life cycle defines the beginning and the end of a project. Cycle time is the time it takes to complete the project life-cycle. Cycle-time measures are based on standard performance. That is, cycle times for similar types of projects can be benchmarked to determine a Standard Project Life-Cycle Time. Measuring cycle times can also mean measuring the length of time to complete any of the processes that comprise the project life-cycle. The shorter the cycle times, the faster the investment is returned to the organization. The shorter the combined cycle time of all projects, the more projects the organization can complete. Requirements Performance Meeting requirements is one of the key success factors for project management. To measure this factor you need to develop measures of fit, which means the solution completely satisfies the requirement. A requirements performance index can measure the degree to which project results meet requirements. Types of requirements that might be measured include functional requirements (something the product must do or an action it must take), non-functional requirements (a quality the product must have, such as usability, performance, etc.). Fit criteria are usually derived some time after the requirement description is first written. You derive the fit criterion by closely examining the requirement and determining what quantification best expresses the user’s intention for the requirement. Employee Satisfaction An employee satisfaction index will give you one number to look at to determine employee morale levels. The ESI comprises a mix of soft and hard measures that are each assigned a weight based on their importance as a predictor of employee satisfaction levels. The ESI should include the following (percentage represents weight): climate survey results (rating pay, growth opportunities, job stress levels, overall climate, extent to which executives practice organizational values, benefits, workload, supervisor competence, openness of communication, physical environment/ergonomics, trust) (35%), focus groups (to gather in-depth information on the survey items) (10%), rate of complaints/grievances (10%), stress index (20%), voluntary turnover rate (15%), absenteeism rate (5%), and rate of transfer requests (5%). Alignment to Strategic Business Goals Most project management metrics benchmark the efficiency of project management—doing projects right. You also need a metric to determine whether or not you’re working on the right projects. Measuring the alignment of projects to strategic business goals is such a metric. It’s determined through a survey of an appropriate mix of project management professionals, business unit managers, and executives. Use a Likert scale from 1-10 to rate the statement: Projects are aligned with the business’s strategic objectives.

Comprehensive List of Measures
Page 5 of 34
MEASURES TO DETERMINE THE VALUE OF PROJECT MANAGEMENT Source: Center for Business Practices, Value of Project Management Research Report, 2000. Financial Measures
- Return on Investment - Return on Capital Employed - Economic Value-Added - Sales Growth % - Sales Growth $ - Productivity - Cost Savings - Earnings Per Share - Cash Flow Per Share
Customer Measures
- Customer Satisfaction - Customer Retention - Customer Acquisition - Customer Profitability - Market Share - Customer Use
Project/Process Measures
- Project Budget Performance
- Project Schedule Performance - Requirements Performance - Process Errors - Defects - Rework - Resource Utilization - Time to Market - Scope Changes - Project Completions - Business Strategy - Project Risk
Learning and Growth Measures
- Employee Satisfaction - Employee Turnover - Training Time - Employee Productivity - Employee Motivation - Employee Empowerment - Information System Availability
MEASURES TO DETERMINE THE VALUE OF PROJECT MANAGEMENT IN IT ORGANIZATIONS Source: Center for Business Practices, Value of Project Management in IT Organizations Research Report, 2000. - Return on investment - Time to market - Customer satisfaction - Alignment to strategic business goals - Time and budget to date - Quality - Labor hours performance - Schedule performance - Cost performance - Defect rate
- Component size - Defect per peer review - Staff productivity - Response time - Average time to repair defect - Schedule estimating - Cost/hours estimating - Defect rate estimating - Component size estimating - Quality estimating

Comprehensive List of Measures
Page 6 of 34
DISTRIBUTED PROJECT MANAGEMENT MEASURES Source: Financial To ensure projects are executed in accordance with specified goals of cost, schedule and performance
- Earned value - Quality of product delivered (meeting specifications)
Project and Internal Processes To maintain sound internal processes that enable efficient and effective execution of projects
- Consistency in estimating and risk definition - Quality of planning and progress tracking - Efficiency of project change management
Innovation and Learning To use projects as a capability-building process and developing expertise
- Quality of project portfolio - Progression on maturity models - Motivation of teams
Customer To ensure that the organization delivers full satisfaction to customers during project execution
- Responsiveness in terms of after-delivery service - Level of mutual trust
Comprehensive List of Measures
Page 7 of 34
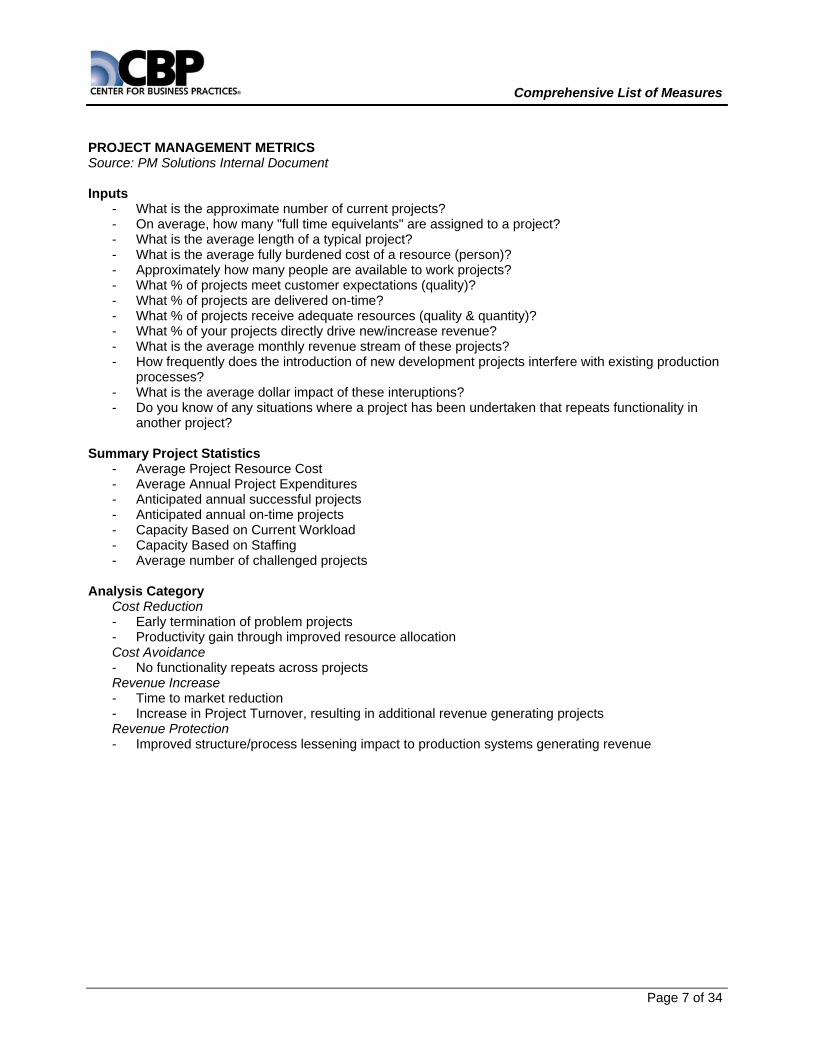
PROJECT MANAGEMENT METRICS Source: PM Solutions Internal Document Inputs
- What is the approximate number of current projects? - On average, how many "full time equivelants" are assigned to a project? - What is the average length of a typical project? - What is the average fully burdened cost of a resource (person)? - Approximately how many people are available to work projects? - What % of projects meet customer expectations (quality)? - What % of projects are delivered on-time? - What % of projects receive adequate resources (quality & quantity)? - What % of your projects directly drive new/increase revenue? - What is the average monthly revenue stream of these projects? - How frequently does the introduction of new development projects interfere with existing production
processes? - What is the average dollar impact of these interuptions? - Do you know of any situations where a project has been undertaken that repeats functionality in
another project? Summary Project Statistics
- Average Project Resource Cost - Average Annual Project Expenditures - Anticipated annual successful projects - Anticipated annual on-time projects - Capacity Based on Current Workload - Capacity Based on Staffing - Average number of challenged projects
Analysis Category
Cost Reduction - Early termination of problem projects - Productivity gain through improved resource allocation Cost Avoidance - No functionality repeats across projects Revenue Increase - Time to market reduction - Increase in Project Turnover, resulting in additional revenue generating projects Revenue Protection - Improved structure/process lessening impact to production systems generating revenue
Comprehensive List of Measures
Page 8 of 34
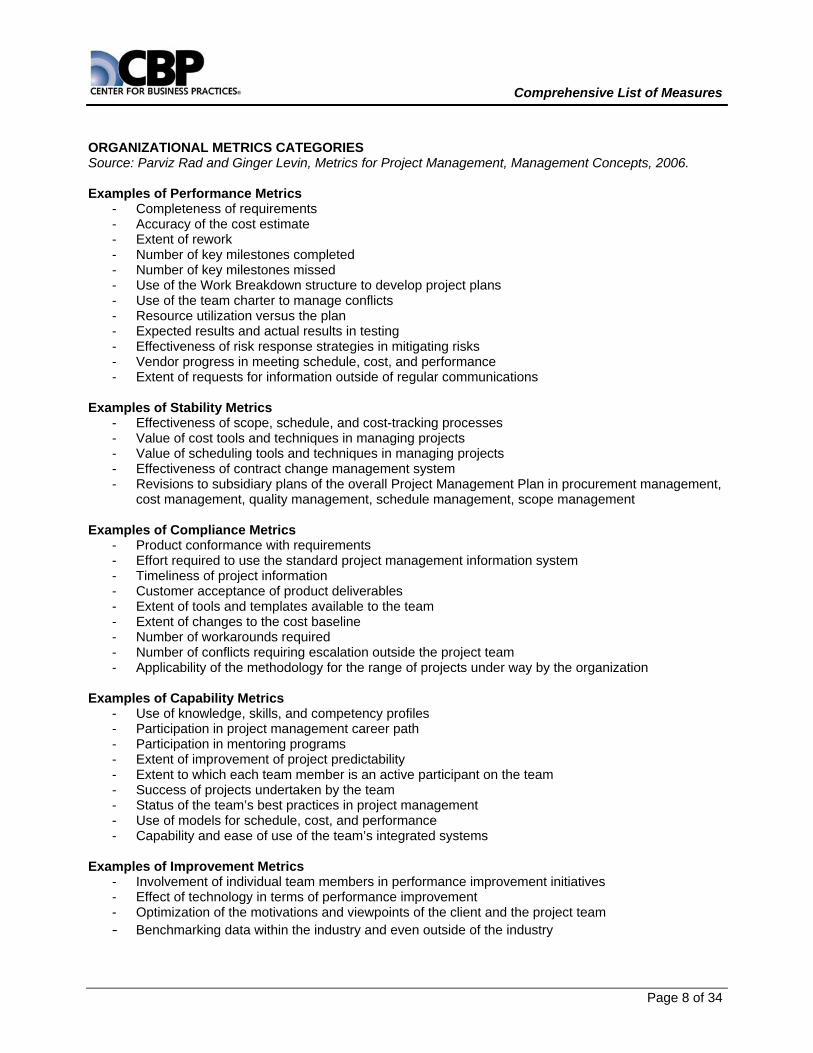
ORGANIZATIONAL METRICS CATEGORIES Source: Parviz Rad and Ginger Levin, Metrics for Project Management, Management Concepts, 2006. Examples of Performance Metrics
- Completeness of requirements - Accuracy of the cost estimate - Extent of rework - Number of key milestones completed - Number of key milestones missed - Use of the Work Breakdown structure to develop project plans - Use of the team charter to manage conflicts - Resource utilization versus the plan - Expected results and actual results in testing - Effectiveness of risk response strategies in mitigating risks - Vendor progress in meeting schedule, cost, and performance - Extent of requests for information outside of regular communications
Examples of Stability Metrics
- Effectiveness of scope, schedule, and cost-tracking processes - Value of cost tools and techniques in managing projects - Value of scheduling tools and techniques in managing projects - Effectiveness of contract change management system - Revisions to subsidiary plans of the overall Project Management Plan in procurement management,
cost management, quality management, schedule management, scope management Examples of Compliance Metrics
- Product conformance with requirements - Effort required to use the standard project management information system - Timeliness of project information - Customer acceptance of product deliverables - Extent of tools and templates available to the team - Extent of changes to the cost baseline - Number of workarounds required - Number of conflicts requiring escalation outside the project team - Applicability of the methodology for the range of projects under way by the organization
Examples of Capability Metrics
- Use of knowledge, skills, and competency profiles - Participation in project management career path - Participation in mentoring programs - Extent of improvement of project predictability - Extent to which each team member is an active participant on the team - Success of projects undertaken by the team - Status of the team’s best practices in project management - Use of models for schedule, cost, and performance - Capability and ease of use of the team’s integrated systems
Examples of Improvement Metrics
- Involvement of individual team members in performance improvement initiatives - Effect of technology in terms of performance improvement - Optimization of the motivations and viewpoints of the client and the project team - Benchmarking data within the industry and even outside of the industry
Comprehensive List of Measures
Page 9 of 34
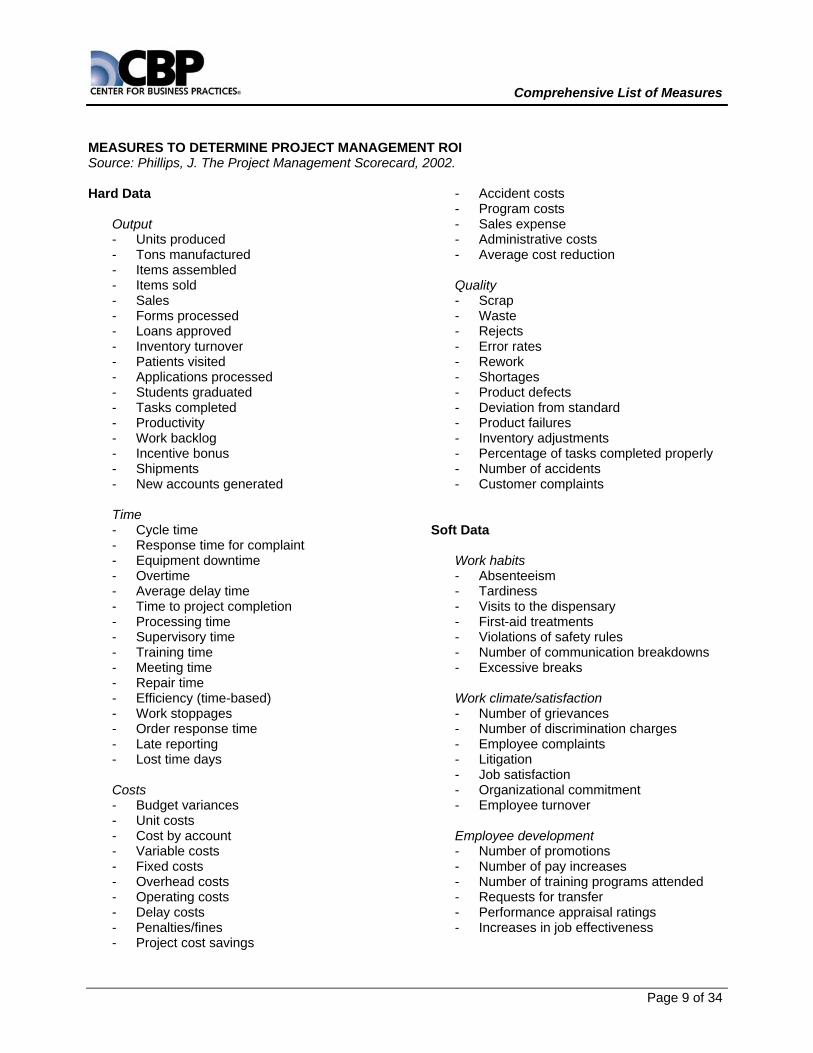
MEASURES TO DETERMINE PROJECT MANAGEMENT ROI Source: Phillips, J. The Project Management Scorecard, 2002. Hard Data
Output - Units produced - Tons manufactured - Items assembled - Items sold - Sales - Forms processed - Loans approved - Inventory turnover - Patients visited - Applications processed - Students graduated - Tasks completed - Productivity - Work backlog - Incentive bonus - Shipments - New accounts generated Time - Cycle time - Response time for complaint - Equipment downtime - Overtime - Average delay time - Time to project completion - Processing time - Supervisory time - Training time - Meeting time - Repair time - Efficiency (time-based) - Work stoppages - Order response time - Late reporting - Lost time days Costs - Budget variances - Unit costs - Cost by account - Variable costs - Fixed costs - Overhead costs - Operating costs - Delay costs - Penalties/fines - Project cost savings
- Accident costs - Program costs - Sales expense - Administrative costs - Average cost reduction Quality - Scrap - Waste - Rejects - Error rates - Rework - Shortages - Product defects - Deviation from standard - Product failures - Inventory adjustments - Percentage of tasks completed properly - Number of accidents - Customer complaints
Soft Data
Work habits - Absenteeism - Tardiness - Visits to the dispensary - First-aid treatments - Violations of safety rules - Number of communication breakdowns - Excessive breaks Work climate/satisfaction - Number of grievances - Number of discrimination charges - Employee complaints - Litigation - Job satisfaction - Organizational commitment - Employee turnover Employee development - Number of promotions - Number of pay increases - Number of training programs attended - Requests for transfer - Performance appraisal ratings - Increases in job effectiveness
Comprehensive List of Measures
Page 10 of 34
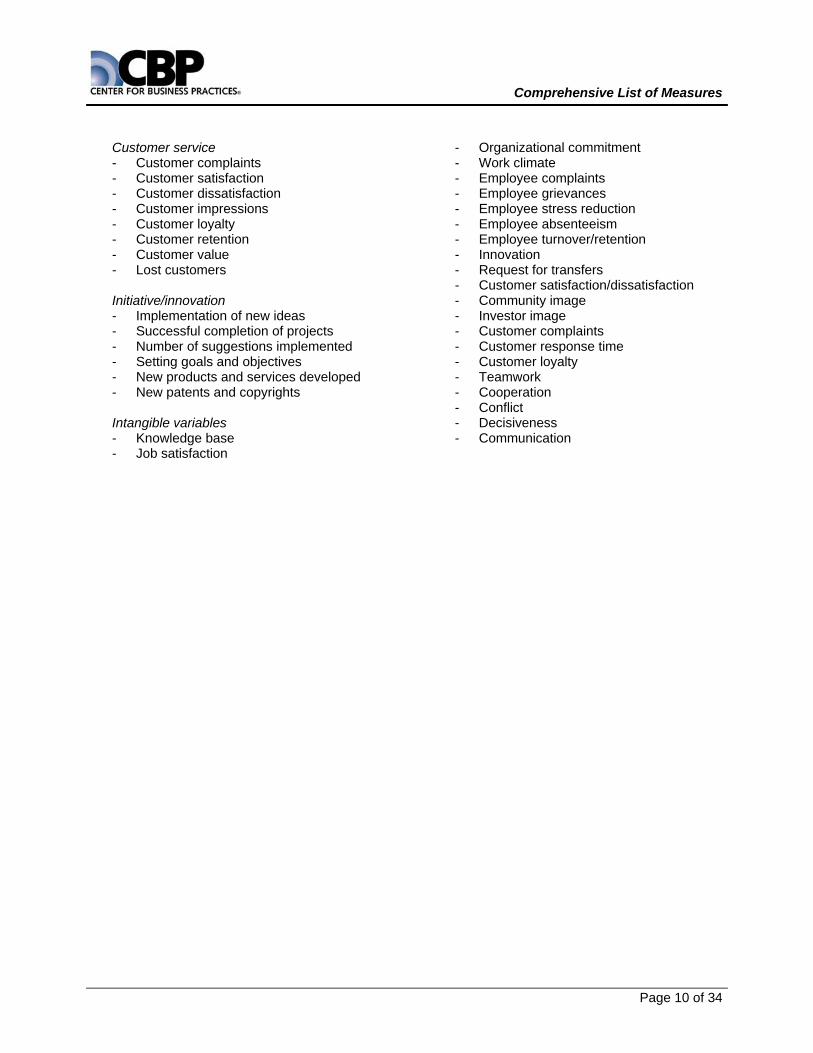
Customer service - Customer complaints - Customer satisfaction - Customer dissatisfaction - Customer impressions - Customer loyalty - Customer retention - Customer value - Lost customers Initiative/innovation - Implementation of new ideas - Successful completion of projects - Number of suggestions implemented - Setting goals and objectives - New products and services developed - New patents and copyrights
Intangible variables - Knowledge base - Job satisfaction
- Organizational commitment - Work climate - Employee complaints - Employee grievances - Employee stress reduction - Employee absenteeism - Employee turnover/retention - Innovation - Request for transfers - Customer satisfaction/dissatisfaction - Community image - Investor image - Customer complaints - Customer response time - Customer loyalty - Teamwork - Cooperation - Conflict - Decisiveness - Communication
Comprehensive List of Measures
Page 11 of 34
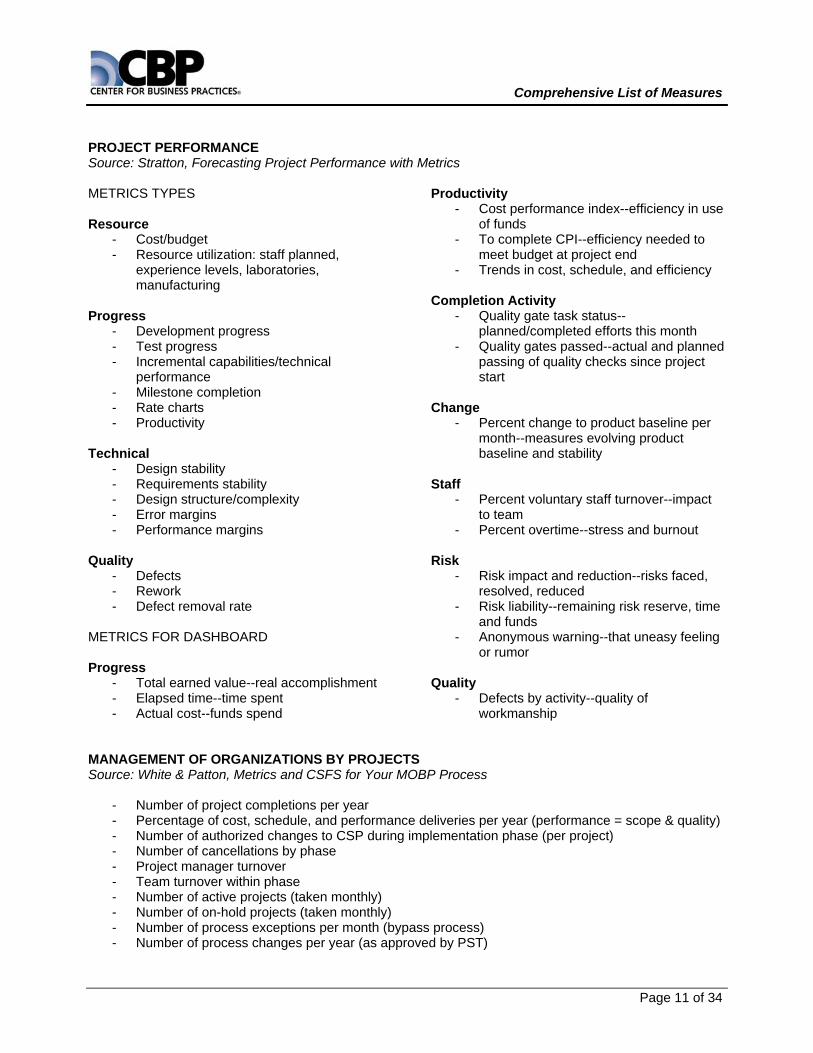
PROJECT PERFORMANCE Source: Stratton, Forecasting Project Performance with Metrics METRICS TYPES Resource
- Cost/budget - Resource utilization: staff planned,
experience levels, laboratories, manufacturing
Progress
- Development progress - Test progress - Incremental capabilities/technical
performance - Milestone completion - Rate charts - Productivity
Technical
- Design stability - Requirements stability - Design structure/complexity - Error margins - Performance margins
Quality
- Defects - Rework - Defect removal rate
METRICS FOR DASHBOARD Progress
- Total earned value--real accomplishment - Elapsed time--time spent - Actual cost--funds spend
Productivity - Cost performance index--efficiency in use
of funds - To complete CPI--efficiency needed to
meet budget at project end - Trends in cost, schedule, and efficiency
Completion Activity
- Quality gate task status--planned/completed efforts this month
- Quality gates passed--actual and planned passing of quality checks since project start
Change
- Percent change to product baseline per month--measures evolving product baseline and stability
Staff
- Percent voluntary staff turnover--impact to team
- Percent overtime--stress and burnout Risk
- Risk impact and reduction--risks faced, resolved, reduced
- Risk liability--remaining risk reserve, time and funds
- Anonymous warning--that uneasy feeling or rumor
Quality
- Defects by activity--quality of workmanship
MANAGEMENT OF ORGANIZATIONS BY PROJECTS Source: White & Patton, Metrics and CSFS for Your MOBP Process
- Number of project completions per year - Percentage of cost, schedule, and performance deliveries per year (performance = scope & quality) - Number of authorized changes to CSP during implementation phase (per project) - Number of cancellations by phase - Project manager turnover - Team turnover within phase - Number of active projects (taken monthly) - Number of on-hold projects (taken monthly) - Number of process exceptions per month (bypass process) - Number of process changes per year (as approved by PST)

Comprehensive List of Measures
Page 12 of 34
ORGANIZATIONAL SUCCESS DIMENSIONS Source: Martz, A.C., Shenhar, A.J., & Marino, D.N. (2000). Defining & Measuring Organizational Success, Stevens Institute of Technology Financial
- Sales - Profit margin - Revenue growth - Cash flow - Net operating income - Return on Investment (ROI) - Revenue per employee - Profit per employee - Stock price / market capitalization - Economic Value added (EVA) - Earnings per share (EPS) - Return on Common Equity (ROE) - 5 year growth in common equity
Customer/Market
- Customer Satisfaction Index - Customer retention rate - Service quality - Responsiveness (customer defined) - Customer benefits from product/service - Market Share or Position - On-time delivery (customer defined) - Customer acquisition rate - Growth in Market Share - Corporate image - Sales backlog
Process
- Time to market for new products and services
- Quality of new product development and project management processes
- Quantity and depth of standardized processes
- Quality of manufacturing processes - Quality initiative processes (TQM) - Cycle time - Quality and speed of translating new
product development to manufacturing - Quality of cross-learning within product
teams - Quality of cross-learning between
business units
- Quality of cross-learning bet. product teams
- Quality of Re-engineering processes People Development
- Retention of top employees - Quality of professional/ technical
development - Quality of leadership development - Encourage employees to suggest/test
new ideas - Employee skills training (days per year) - Employee satisfaction survey - Quality of corporate culture development - Quality of HR benefit plans (e.g., pension,
medical) - Concern for quality of employee and
family life (e.g., day care, company health club)
- Articulated and supportive HR policy - Quality of HR administrative processes
Future
- Depth and quality of strategic planning - Anticipating/preparing for unexpected
changes in the external environment - Extent of joint ventures and strategic
alliances to gain competitiveness in new technologies
- Investment in new market development - Investment in new technology
development - % sales from new products (<5 years old) - Understanding/forecasting
MEGATRENDS - Quality and extent of strategic focus /
intent - Investment in R&D (% of sales) - % sales from new business lines (<5
years old) - High levels of technology forecasting - % of our products that have potential to
change basis of competition - Investments in high risk projects
Comprehensive List of Measures
Page 13 of 34
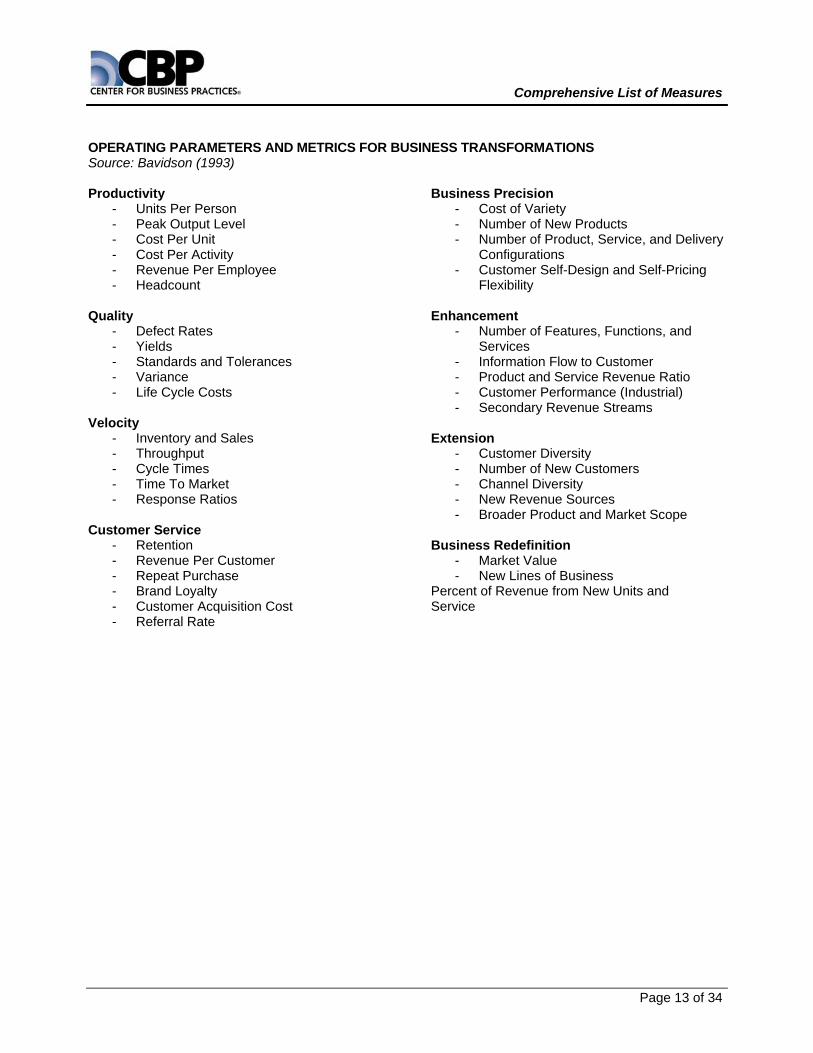
OPERATING PARAMETERS AND METRICS FOR BUSINESS TRANSFORMATIONS Source: Bavidson (1993) Productivity
- Units Per Person - Peak Output Level - Cost Per Unit - Cost Per Activity - Revenue Per Employee - Headcount
Quality
- Defect Rates - Yields - Standards and Tolerances - Variance - Life Cycle Costs
Velocity
- Inventory and Sales - Throughput - Cycle Times - Time To Market - Response Ratios
Customer Service
- Retention - Revenue Per Customer - Repeat Purchase - Brand Loyalty - Customer Acquisition Cost - Referral Rate
Business Precision - Cost of Variety - Number of New Products - Number of Product, Service, and Delivery
Configurations - Customer Self-Design and Self-Pricing
Flexibility Enhancement
- Number of Features, Functions, and Services
- Information Flow to Customer - Product and Service Revenue Ratio - Customer Performance (Industrial) - Secondary Revenue Streams
Extension
- Customer Diversity - Number of New Customers - Channel Diversity - New Revenue Sources - Broader Product and Market Scope
Business Redefinition
- Market Value - New Lines of Business
Percent of Revenue from New Units and Service

Comprehensive List of Measures
Page 14 of 34
SAMPLE PRODUCT DEVELOPMENT/ENGINEERING PERFORMANCE MEASURES Source: U.S Department of Energy, Performance Measures
- Percent of drafting errors per print - Percent of prints released on schedule - Percent of errors in cost estimates - Number of times a print is changed - Number of off-specifications approved - Simulation accuracy - Accuracy of advance materials list - How well the product meets customer expectations - Field performance of product - Percent of error-free designs - Percent of errors found during design review - Percent of repeat problems corrected - Time to correct a problem - Time required to make an engineering change - Percent of reports with errors in them - Data recording errors per month - Percent of evaluations that meet engineering objectives - Percent of special quotations that are successful - Percent of test plans that are changed (change/test plan) - Number of meetings held per quarter where quality and defect prevention were the main subject - Person-months per released print - Percent of total problems found by diagnostics as released - Number of problems that were also encountered in previous products - Cycle time to correct customer problem - Number of errors in publications reported from the plan and field - Number of products that pass independent evaluation error-free - Number of misused shipments of prototypes - Number of unsuccessful pre-analyses - Number of off-specifications accepted - Percent of requests for engineering - Number of days late to pre-analysis - Percent of requests for engineering action open for more than two weeks - Effectiveness of regression tests - Number of restarts of evaluations and tests - Percent of corrective action schedules missed - Number of days for the release cycle - Cost of input errors to the computer - Percent of bills of material that are released in error - Spare parts cost after warranty - Customer cost per life of output delivered
Comprehensive List of Measures
Page 15 of 34
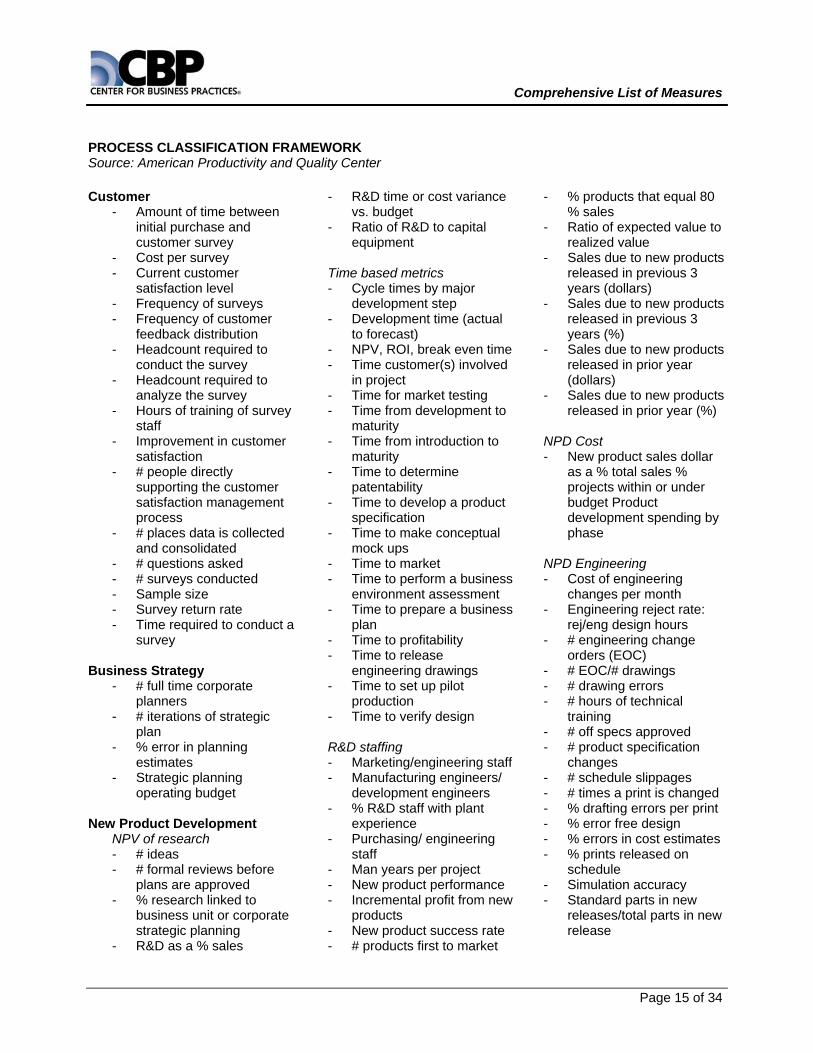
PROCESS CLASSIFICATION FRAMEWORK Source: American Productivity and Quality Center Customer
- Amount of time between initial purchase and customer survey
- Cost per survey - Current customer
satisfaction level - Frequency of surveys - Frequency of customer
feedback distribution - Headcount required to
conduct the survey - Headcount required to
analyze the survey - Hours of training of survey
staff - Improvement in customer
satisfaction - # people directly
supporting the customer satisfaction management process
- # places data is collected and consolidated
- # questions asked - # surveys conducted - Sample size - Survey return rate - Time required to conduct a
survey Business Strategy
- # full time corporate planners
- # iterations of strategic plan
- % error in planning estimates
- Strategic planning operating budget
New Product Development
NPV of research - # ideas - # formal reviews before
plans are approved - % research linked to
business unit or corporate strategic planning
- R&D as a % sales
- R&D time or cost variance vs. budget
- Ratio of R&D to capital equipment
Time based metrics - Cycle times by major
development step - Development time (actual
to forecast) - NPV, ROI, break even time - Time customer(s) involved
in project - Time for market testing - Time from development to
maturity - Time from introduction to
maturity - Time to determine
patentability - Time to develop a product
specification - Time to make conceptual
mock ups - Time to market - Time to perform a business
environment assessment - Time to prepare a business
plan - Time to profitability - Time to release
engineering drawings - Time to set up pilot
production - Time to verify design
R&D staffing - Marketing/engineering staff - Manufacturing engineers/
development engineers - % R&D staff with plant
experience - Purchasing/ engineering
staff - Man years per project - New product performance - Incremental profit from new
products - New product success rate - # products first to market
- % products that equal 80 % sales
- Ratio of expected value to realized value
- Sales due to new products released in previous 3 years (dollars)
- Sales due to new products released in previous 3 years (%)
- Sales due to new products released in prior year (dollars)
- Sales due to new products released in prior year (%)
NPD Cost - New product sales dollar
as a % total sales % projects within or under budget Product development spending by phase
NPD Engineering - Cost of engineering
changes per month - Engineering reject rate:
rej/eng design hours - # engineering change
orders (EOC) - # EOC/# drawings - # drawing errors - # hours of technical
training - # off specs approved - # product specification
changes - # schedule slippages - # times a print is changed - % drafting errors per print - % error free design - % errors in cost estimates - % prints released on
schedule - Simulation accuracy - Standard parts in new
releases/total parts in new release
Comprehensive List of Measures
Page 16 of 34
- Time required to make an engineering change
NPD Patents - # inventions submitted - # patents challenged
(won/lost) - # patents in use - Ratio of patents in use to
total # patents Marketing-Sales
Marketing - Advertising copy errors - Customer retention rate - Inquiries per $10,000 of
advertisement - Market share - Marketing expenses to
sales - % error in market forecasts - % market gained - % proposals accepted - % proposals submitted
ahead of schedule
Sales - Customer satisfaction
rating of sales force - Direct mail response rate - Frequency of customer
contact by customer service
- New customer sale cycle time
- # calls to close a sale - # new customers acquired
annually - # sales meetings per year - # salespeople - % repeat orders - % change in sales - % error in sales forecasts - Sales call per day by
salesperson - Sales revenue per
employee - Salesperson - to customer
ratio - Salesperson time spent in
training (days) - Travel dollars/cost of sales
dollars
- Turnover of sales force - Utilization of salesperson
time (% spent on selling, administration, travel, waiting)
Order Processing - Cost per order - Customer order entry time - # days to approve
customer credit - # days to process
customer orders - Order accuracy: # orders
with errors/total # invoices - Order management cost - Orders per hour - Order to receipt cycle time - % orders with standard
lead time - Order processing time to
production release - % products made to order
vs. standard product or service
Product Order-Delivery
- Active suppliers per purchasing employee
- Average purchased materials cost compared to budgeted cost
- Average time to fill emergency orders
- Cost per purchase order - Dollars handled by
purchasing - Errors per purchase order - Material acquisition cost - # orders received with no
purchase order - # purchase orders issued
past due - # times per year line is
stopped due to lack of supplier parts
- Orders or line items handled per purchasing staff person or buyer
- % change in # active suppliers during the reporting period
- % active suppliers receiving 90 % total purchasing dollars
- % time single sourcing practiced
- % reduction in the # suppliers
- % defective parts - % EDI order placements - % output delivered on
schedule - % target dates missed - % parts with two or more
suppliers - % supplier on time delivery - % time bar coded receipts
are utilized - % transactions made using
procurement cards - Purchase order cycle time - Purchase order errors vs.
purchase orders audited - Purchasing dollars handled
by purchasing per purchasing employee
- Purchasing Headcount as a % total company headcount
- Purchasing operating expense as a % goods and services purchased
- Purchasing operating expense as a % sales dollars
- Purchasing operating expense as a % total purchase dollars
- Sales dollars per purchasing employee
- Supplier lots rejected - Time between firm order
and actual delivery - Total company purchasing
dollars per purchasing employee
- Total purchasing dollars as a % sales dollars
Output
- Actual versus planned volume
Comprehensive List of Measures
Page 17 of 34
- Average machine availability rate or machine uptime
- Capacity utilization - Customer reject or return
rate on finished products (ppm)
- Defective units (ppm) - Finished product first pass
yield - Hours lost due to
equipment downtime - Major component first pass
yield - Manufacturing cycle time
for a typical product - # items exceeding shelf life - # line stops - # fine supervisors - # process changes per
operation due to errors - # processes with yields at
six sigma - % assembly steps
automated - % increase in output per
employee - % "pull" system used - % reduction in component
lot sizes - % error in yield projections - % changes to process
specifications during process design review
- % designed experiments needing revisions
- % errors in stocking - % lots or jobs expedited by
bumping other lots or jobs from schedule
- % production workforce now participating in self directed work teams
- % tools reworked due to design errors
- % tools that fail certification - % reduction in
manufacturing cycle time - % unplanned overtime - Production and test
equipment set up time - Production schedules met
(% time)
- Productivity: units per labor hour
- Reject rate reduction - Rework and repair hours
compared to direct manufacturing hours
- Rework and repair labor cost compared to total manufacturing labor cost
- Scrap and rework costs - Scrap and rework %
reduction - Scrap material dollar
value/total material dollar value
- Standard order to shipment lead time for major products
- Supplier parts scrapped due to engineering changes
- Time line is down due to assembly shortage
- Time required to incorporate engineering changes
- Total scrap and rework as a % sales
- Warranty cost reduction - Warranty repair costs/sales - Yield improvement - Units produced per square
foot or meter of manufacturing and storage space
Warehousing
- Annual lines shipped per SKU
- Cases per hour - Dock to stock cycle time - Inventory accuracy - Items on hand - Lines shipped per person
hour - PaIlets shipped per person
hour - % error in cases shipped - % error in lines shipped - % error in orders shipped - Picking error rate
- Replacement costs for material handling and storage
- Total person hours worked per year
- Warehouse inventory (dollar value) as a % sales dollars
- Warehouse inventory (dollar value) as a % total purchase dollars
Delivery
- Complaints of shipping damage
- Distribution costs (transportation, warehousing, customer service, administration, inventory carrying)
- Fill rate (speed of delivery) - Freight costs per parts
shipment - Frequency of delivery to
customers - # bill of lading errors not
caught in shipping - % incomplete delivery - % misdelivery - % late shipments - % shipping errors - % on time delivery
(promised) - % on time delivery
(requested) - Ratio of actual deliveries to
scheduled deliveries - Transportation cost per
unit Inventory Management
- Annual inventory turns - Annual work in process
(WIP) turns - Back orders Cost of stores - Gross inventory as a %
sales dollars Inventory carrying cost
- Inventory reliability: line items filled on first try per total line items ordered
- Integrated supply contract - Inventory expenses

Comprehensive List of Measures
Page 18 of 34
- Item usage - Line items processed per
employee/hour - On time delivery - Pilferage reduction - Reduced freight expenses - Stock turns per year - Vendor lead time
Quality Assurance
- # audits performed on schedule
- # complaints from manufacturing management
- # customer complaints - # engineering changes
after design review - # errors detected during
design and process reviews
- # manufacturing interruptions caused by supplier parts
- # requests for corrective action being processed
- % error in reliability projections
- % lots going directly to stock
- % product that meets customer expectations
- % quality assurance personnel to total personnel
- % quality engineers to product and manufacturing engineers
- Receiving inspection cycle time
- Time required to process a request for corrective action
- Time to answer customer complaints
- Time to correct a problem - Variations between
inspectors doing the same job
Maintenance
- Labor hours spent on preventive maintenance
- Maintenance cost/equipment cost
- Maintenance cost/output unit
- # unscheduled maintenance calls
- Production time lost because of maintenance problems
- % equipment maintained on schedule
- Waste caused by machine problems
Customer Service
- Billing errors per customer billing
- Billing errors per day of week or month
- Invoicing errors per invoices processed
- Labor cost per invoice - Length of time to prepare
and send a bill - # invoices issued - # invoices per FIE - % invoices disputed - Average # calls customer
service representatives handle per week
- Average time to answer a customer letter
- Average time to resolve a customer inquiry
- Call repair time - Call travel time to site - Customer call waiting time - Duration of typical
customer service phone call
- Duration of typical technical service phone call
- Efficiency of field force (direct service time compared to total service time available)
- # customer service employees as a % total employees
- # FTEs in customer service - # part time employees in
customer service
- % calls closed incomplete or extended due to lack of parts
- % calls that are abandoned, delayed, or answered by recording
- % orders received by customer service department
- % service calls requiring parts
- % total calls fixed remotely by phone
- Ratio of field engineers to support staff
- Returned product repair time
- Revenue per service engineer
Human Resource Management
Personnel Deployment - % employee absenteeism - Cost per external hire - Cost per internal I Lire - Cost to supervise - Current employee/
supervisor ratio - External accession rate - External replacement rate - Internal accession rate - Internal replacement rate - Job posting effectiveness - Job posting response rate - # days to fill an
employment request - # days to respond to
applicant - # job descriptions written - # jobs leveled - Orientation and training
costs per hire - % employment requests
filled on schedule - % offers accepted - Personnel turnover rate - Relocation expenses - Requisitions filled per
month/quarter/year - Requisitions per recruiter - Time to evaluate jobs - Time to process an
applicant

Comprehensive List of Measures
Page 19 of 34
- Time to start Succession-career plan development - Distribution of performance
appraisal ratings - Distribution of merit pay
increase recommendations - Ratio of promotions to total
employees - Ratio of openings filled
internally vs. externally - Average # years or months
between promotions
Employee recruitment & hiring - Average days to fill open
positions - Average days between
opening and fill - Ratio - acceptances to
hires - Ratio - acceptances to
offers - Ratio - qualified applicants
to total applicants
Employee involvement - Current employee/
supervisor ratio - Employees involved in job
rotation - # days to answer
suggestions - # suggestions per
employee - # suggestions per team - % employees participating
in company sponsored activities
- % suggestions accepted - % total workforce now
participating in self directed work teams
Employee development & training - Average pre- and post-
training test score change/performance review change
- Cost per trainee - Hours of employee training
- # days to develop a training course or modules
- # hours per year of career and skill development training per employee
- % employees trained - % employees with
development plans - % training classes
evaluated as excellent - % employees receiving
tuition refunds - Total expenditure for tuition
reimbursement or executive development
- Total external training expenditures
- Total internal training days - Total internal training
expenditures - Trainee or unit work
performance changes - Training costs as a %
payroll - Training costs as a %
sales/revenue - Training days per
employee per year - Training department
employees to total employees
Compensation management - Average salary cost per
employee - Compensation costs - Compensation
costs/revenue - Overtime pay costs - % performance appraisals
submitted on time - Salary range exceptions - Supervisory compensation
costs/total compensation costs
Employee satisfaction - Department morale index
Employee benefit management - Benefits cost per employee - Benefits cost - Benefits costs/revenue
- Benefits costs/total compensation costs
- Benefits to payroll ratio - Error rates in processing
benefits claims - Retiree benefits
costs/expense
Workplace health-safety management - Accidents per month - Lost time for injuries per
total hours worked - # grievances per month - % departments with
disaster recovery plans - Safety violations by
department - Workers' compensation
costs/expense - Workers' compensation
costs/headcount - Days without incident - Hours worked per lost time
incident - Housekeeping audits - Insurance loss ratios - Lost time severity rates - OSHA Fines - OSHA Recordables/
severity rate - Safety meetings held - Total case incident rate - Training documentation
Workforce diversity - Minority representation by
EEO categories - Minority turnover rates
overall, by department, by job familyv
- Promotion rates of individuals from protected classes
- Ratio of EEO grievances/suits to total employee population
- Rejection rate by job category of applicants from protected classes

Comprehensive List of Measures
Page 20 of 34
Labor-management relationships
- Average employee tenure - Average length if time to
settle grievances - Costs associated with work
stoppages/slowdowns - Frequency/duration of work
stoppages/slowdowns - % grievances settles out-
of-court and associated savings
- Ratio of grievances/ complaints to total employees
- Ratio of successful to unsuccessful union drives
- Ratio of voluntary to involuntary terminations
Information resource management - Application availability - Average application
response time - Average duration of
scheduled outages - Average duration of
unscheduled outages - Average # monthly
scheduled outages - Average # monthly
unscheduled outages - Average resolution time of
incident reports received - Errors per thousand lines
of code - Mean time between server
failures - Mean time between
system repairs - Network availability and
bandwidth - # application crashes per
unit of time - # changes after the
program is coded - # documentation errors - # hours spent to maintain
application support - # middleware failures per
unit of time
- # operating system failures per unit of time
- # production jobs not completed during batch night shift
- # revisions to program objectives
- % error in lines of code required
- % time required to debug programs
- Rework costs resulting from computer program
- System/server availability - # incident reports received - # incident reports resolved - Data Centers - Cost per MIPS used - Cost to mount a tape - Cost to print a page - Cost to store a gigabyte of
DASD for one month - CPU non prime shift usage
% - CPU prime shift usage % - CPU usage overall % - DASD usage: allocated
DASD % - Data integrity - Optimally blocked files % - % DASD used - % multiple tape files - % production job failures - Print operators per
100,000 pages - Print usage: production
volume % - Schedulers per 10,000
production jobs - Set up staff per 10,000
production jobs - Small tape files % - Spending on personnel per
MIPS - Spending on software per
MIPS - Tape operators per 10,000
mounts - Tape usage: specific
mounts % - Total annual spending per
MIPS - Total staff per MIPS
- General - IS budget - IS budget as % revenue - IS employees as a % total
employees - % IS budget for client
server - % IS services outsourced
Financial Resource Management
- Asset composition - Average collected balance
per billion dollars of revenue
- Bank accounts per FIE - Capital structure - Cash reinvestment ratio - Cash to current liabilities - Current ratio: current
assets/current liabilities - Debt service coverage
ratio - Dividend as % sales - Dividend yield - Economic value added - Foreign exchange trades
per FIE - Free cash flow - Funds flow adequacy ratio - Gross margin as a % sales - Interest expense as %
average total debt - Internal fund of capital
expenditures - Net earnings per employee - Net operating profit as %
capital employed - # variances in capital
spending - % variation from budget - Pre tax earnings as %
sales - Quick ratio: cash +
accounts receivable /current liabilities
- Return on sales - Return on total assets - Return on total capital
employed - Return on total invested
capital - Revenue: actual versus
plan
Comprehensive List of Measures
Page 21 of 34
- Sales to inventory - Sales to net working
capital - Selling, general, and
administrative expenses as a % sales
- Total assets to sales - Total debt as % total
capital employed - Total operating costs as a
% sales - Trades per FTE - Weighted average cost of
capital
Accounts payable management - A/P labor cost per payment - A/P labor cost per vendor
invoice - A/P late payments - A/P penalties - A/P systems cost per
payment - Accounts payable to sales - Annual # invoices
processed per FIE - Average # invoices per
check - Avg # vendors per product - Avg time to resolve errors - Entry errors in accounts
payable and general ledger - Incoming voucher error
rate - # A/P locations - # A/P personnel per $100
million in disbursements - % errors in checks - % manually processed
checks - % EDI usage - % vendors using
"invoiceless processing" - % vendors using summary
invoicing - Span of control: A/P staff
to management ratio - Total A/P cost as a %
revenue - Total A/P cost per invoice
processed - Total A/P cost per payment
- Voucher processing error rate
Payroll processing - Annual # paychecks
processed per FIE - Average time to resolve
errors - Direct deposit % - # paychecks per FTE - # payroll locations - Payroll labor cost per
paycheck - Payroll personnel per $100
million in revenue - Payroll processing method
by # employees paid - Payroll processing time - Payroll systems cost per
paycheck - % errors in payroll - % manually processed
checks - Span of control: payroll
staff to management ratio - Time card/data preparation
error rate - Total payroll cost as a %
revenue - Total payroll cost per
paycheck
Accounts receivable, credit, and collections processing - Accounts receivable staff
per $1 million in revenues - Accounts receivable
turnover - Annual check turnover per
cash applicator - Annual operating cost per
transaction - Annual transaction
turnover per accounts receivable employee
- Annual transaction turnover per cash applicator
- Average remittances processed per day
- Average collection period - Average write off bill - Bad debt as a % sales - Best possible DSO
- Cost per account requiring credit activity
- Cost per account requiring collections activity
- Credit & collections days outstanding
- Days sales outstanding - Dollars on credit hold - Invoicing errors - Labor cost per remittance - # active customer accounts
per credit and collection employee
- # remittances per FTE - % customers requiring
credit activity - % customer requiring
collections activity - % collections customers
referred to OCAs - % EDI utilization - % remittances that are a
first time match - % remittances with errors - % remittances received on
or before the due date - % same day credit to
customer account - % write offs to total
receivables - Total accounts receivable
as a % revenue - Total accounts receivable
cost per FTE - Total remittance
processing cost per remittance processed
Closing the books - Annual # journal entries
per FTE - Annual # manual journal
entries per FTE - Average age of general
ledger systems - Cost per line item
processes - Cycle time to complete
earnings release, 10Q, 10K, or annual report
- Error correction entries as a % total entries

Comprehensive List of Measures
Page 22 of 34
- External reporting cost as a % revenue
- Frequency for closing key ledgers
- Hours and days for annual dose
- Hours and days for monthly dose
- Hours and days for quarterly close
- # active accounts per FTE - # accounts in chart of
accounts for business unit - # cost centers or
departments for the business unit
- # hard closes in excess of regulatory/required doses per year
- # charts of accounts for the entire company
- # error correction entries as a % total entries
- # errors in financial reports - # general ledger posted
accounts as a % total accounts
- # general ledger systems - # pages in monthly report - % accounts reconciled - % accounts reconciled
during the period - % accounts reconciled at
period end - % financial reports
delivered on schedule - Reporting cycle times to
business unit management - Reporting cycle times to
the public - Time for top management
to review statements - Total cost per journal entry - Total financial reporting
cost as a % revenue - Total financial reporting
cost as a % total assets - Total close the
books/financial reporting cost per FTE
- Total remittance processing cost per remittance processed
Travel and entertainment expense management - Labor cost per invoice - # invoices per FTE - % errors in expense
accounts detected by auditors
- % errors in travel advancement records
- T&E error rate - T&E lead time
Facilities management - Square footage per
occupant - Cost per square foot - Building efficiency rates - Workstation utilization
rates - Utility rates - Environmental costs - Security costs - Project costs - Occupancy costs
Environmental Management - Hazardous waste
generated - # environmental audit non
compliance and risk issues documented
- # notice of violations (NOVs) from regulatory agencies
- # reportable releases (federal, state, local)
- # reportable environmental incidents under local, state, or federal regulations
- OSHA total recordable incident rate (MR) injuries and illnesses
- Packaging waste - Solid waste - Total releases TRI tons - Air emissions costs - Air pollution prevented tons - Avg time to prepare air
permits - Avg time to prepare
emissions inventory - Total air emission tons
- Total releases of hazardous air pollutants (HAP) tons
- Toxic air emissions - Administration - Average time to prepare
hazardous waste manifest - Average time to prepare
SARA 313 Form R - # days required to
complete emissions inventory
- # days required to complete toxic inventory (SARA 312)
- # days required to complete TRI (SARA 313)
- # days required to complete waste inventory
- Direct costs - Capital expenditures for
pollution control - Capital expenditures for
pollution prevention - Days work lost - Direct environmental costs - Direct health and safety
costs - Energy usage (BTLUs) - Environmental audit cost - Environmental fines paid - Human resource statistics - # environmental FTEs
audits - # environmental FTEs
compliance - # FTEs Health and Safety - # environmental FTEs
product stewardship - # environmental FTEs
regulatory and legislation - # environmental FTEs
remediation - # environmental FTEs
waste - # environmental FTEs
water - # environmental training
hours - # environmental FTEs - # safety training hours - Safety & health training
costs
Comprehensive List of Measures
Page 23 of 34
- Total environmental training costs
- Pollution reduction - Methods used to prevent
pollution: % product reformulation, % process modification
- % environmental accreditation of suppliers
- % equipment redesign - % recovery and redesign - Prevented tons - Recyclability/disposal rate - Waste reduction rate - Process waste costs - Process waste tons
disposed - Process waste tons
generated
- Process waste tons recycled
- Total process waste tons - Process waste tons treated - Water - Average time to prepare
water permits - Wastewater prevented
million gallons - Water pollution prevented - Water release costs
Improvement-Change Management - Dollars saved per
employee due to new ideas and/or methods
- # job improvement ideas per employee
- % employees active in improvement teams
Benchmark performance - # benchmarking projects
conducted ROI on benchmarking projects
Business process reengineering - # reengineering projects
conducted ROI on
Comprehensive List of Measures
Page 24 of 34
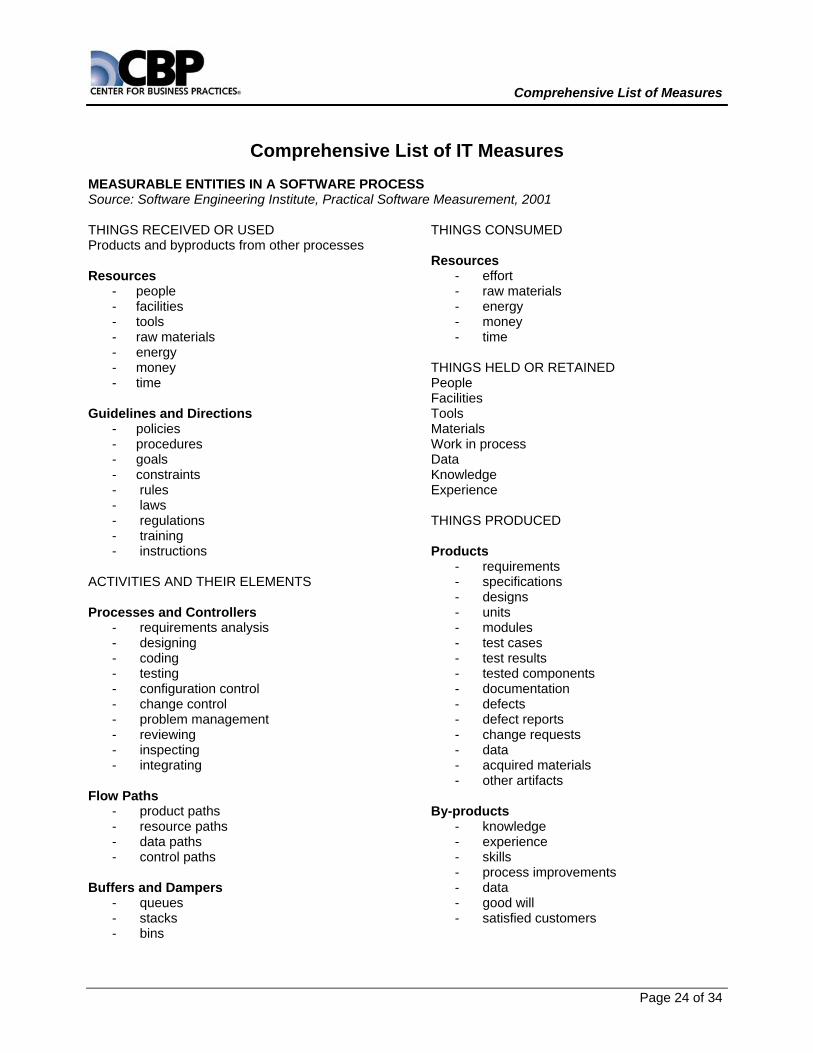
Comprehensive List of IT Measures MEASURABLE ENTITIES IN A SOFTWARE PROCESS Source: Software Engineering Institute, Practical Software Measurement, 2001 THINGS RECEIVED OR USED Products and byproducts from other processes Resources
- people - facilities - tools - raw materials - energy - money - time
Guidelines and Directions
- policies - procedures - goals - constraints - rules - laws - regulations - training - instructions
ACTIVITIES AND THEIR ELEMENTS Processes and Controllers
- requirements analysis - designing - coding - testing - configuration control - change control - problem management - reviewing - inspecting - integrating
Flow Paths
- product paths - resource paths - data paths - control paths
Buffers and Dampers
- queues - stacks - bins
THINGS CONSUMED Resources
- effort - raw materials - energy - money - time
THINGS HELD OR RETAINED People Facilities Tools Materials Work in process Data Knowledge Experience THINGS PRODUCED Products
- requirements - specifications - designs - units - modules - test cases - test results - tested components - documentation - defects - defect reports - change requests - data - acquired materials - other artifacts
By-products
- knowledge - experience - skills - process improvements - data - good will - satisfied customers
Comprehensive List of Measures
Page 25 of 34
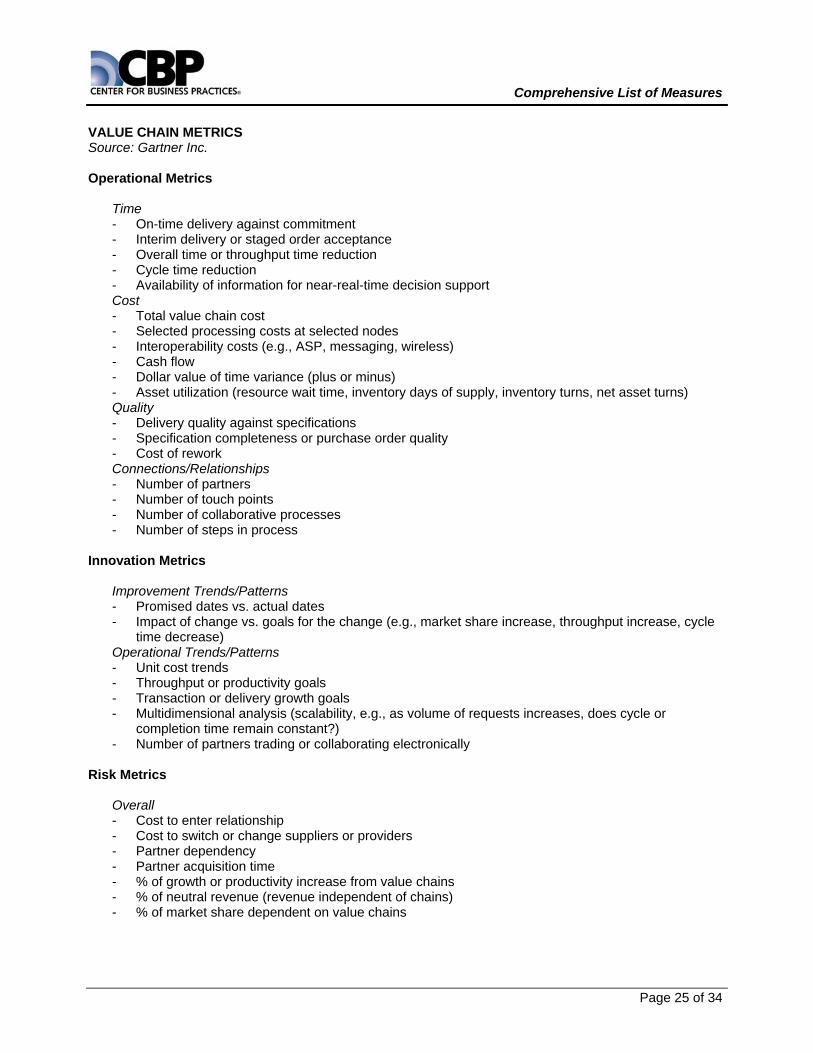
VALUE CHAIN METRICS Source: Gartner Inc. Operational Metrics
Time - On-time delivery against commitment - Interim delivery or staged order acceptance - Overall time or throughput time reduction - Cycle time reduction - Availability of information for near-real-time decision support Cost - Total value chain cost - Selected processing costs at selected nodes - Interoperability costs (e.g., ASP, messaging, wireless) - Cash flow - Dollar value of time variance (plus or minus) - Asset utilization (resource wait time, inventory days of supply, inventory turns, net asset turns) Quality - Delivery quality against specifications - Specification completeness or purchase order quality - Cost of rework Connections/Relationships - Number of partners - Number of touch points - Number of collaborative processes - Number of steps in process
Innovation Metrics
Improvement Trends/Patterns - Promised dates vs. actual dates - Impact of change vs. goals for the change (e.g., market share increase, throughput increase, cycle
time decrease) Operational Trends/Patterns - Unit cost trends - Throughput or productivity goals - Transaction or delivery growth goals - Multidimensional analysis (scalability, e.g., as volume of requests increases, does cycle or
completion time remain constant?) - Number of partners trading or collaborating electronically
Risk Metrics
Overall - Cost to enter relationship - Cost to switch or change suppliers or providers - Partner dependency - Partner acquisition time - % of growth or productivity increase from value chains - % of neutral revenue (revenue independent of chains) - % of market share dependent on value chains

Comprehensive List of Measures
Page 26 of 34
MINIMUM SET OF PROCESS METRICS FOR APPLICATION DEVELOPMENT Source: Gartner Inc. Productivity (Development/Enhancement)
- Function points per staff hour Productivity (Support)
- Function points supported per full-time maintenance programmer Quality (Product)
- Defects per function point found during the warranty period (usually 30 to 90 days after production) Quality (Process)
- Defect removal rate Cost (Development/Enhancement)
- Cost per function point Cost (Support)
- Cost per function point Client Satisfaction
- Organization/project specific KEY IT METRICS FOR CIOS Source: Gartner Inc. Applications Development
- $ per function point Data Center
- $ per MIPS Central Servers
- $ per combined power rating Distributed Computing
- $ per user IT Help Desk
- $ per call Wide-Area Data
- $ per device Voice Network
- $ per minute and $ per extension
Comprehensive List of Measures
Page 27 of 34
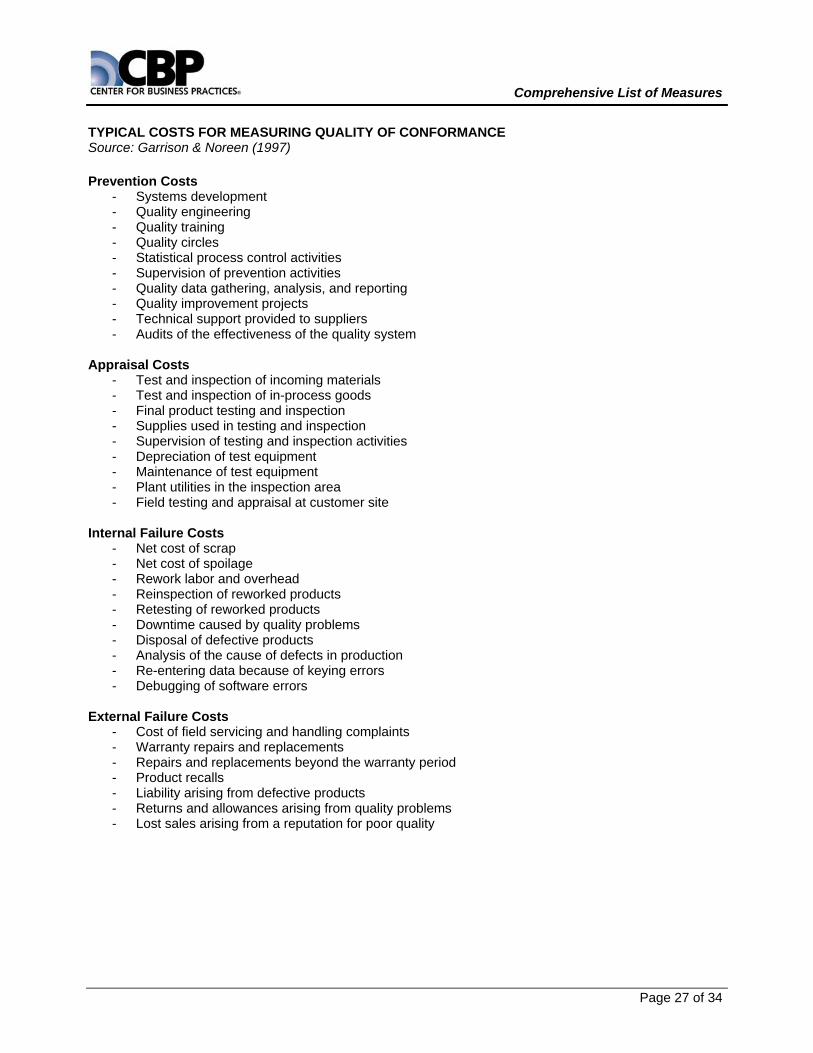
TYPICAL COSTS FOR MEASURING QUALITY OF CONFORMANCE Source: Garrison & Noreen (1997) Prevention Costs
- Systems development - Quality engineering - Quality training - Quality circles - Statistical process control activities - Supervision of prevention activities - Quality data gathering, analysis, and reporting - Quality improvement projects - Technical support provided to suppliers - Audits of the effectiveness of the quality system
Appraisal Costs
- Test and inspection of incoming materials - Test and inspection of in-process goods - Final product testing and inspection - Supplies used in testing and inspection - Supervision of testing and inspection activities - Depreciation of test equipment - Maintenance of test equipment - Plant utilities in the inspection area - Field testing and appraisal at customer site
Internal Failure Costs
- Net cost of scrap - Net cost of spoilage - Rework labor and overhead - Reinspection of reworked products - Retesting of reworked products - Downtime caused by quality problems - Disposal of defective products - Analysis of the cause of defects in production - Re-entering data because of keying errors - Debugging of software errors
External Failure Costs
- Cost of field servicing and handling complaints - Warranty repairs and replacements - Repairs and replacements beyond the warranty period - Product recalls - Liability arising from defective products - Returns and allowances arising from quality problems - Lost sales arising from a reputation for poor quality

Comprehensive List of Measures
Page 28 of 34
HEWLETT PACKARD SOFTWARE PROCESS IMPROVEMENT METRICS Source: Grady (1997) Process and Product Descriptions
- Development Type - Computer Programming Language - Type of Product
High-Level Process Measurements
- Product Size - Effort - Productivity before Changes - Productivity after Changes - Activity Breakdown before Changes
- Activity Breakdown after Changes - Defects before Changes - Defects after Changes - Project Calendar Time before Changes - Project Calendar Time after Changes
Defect Failure Analysis
- Defect Failure Analysis before Changes - Defect Failure Analysis after Changes
MOTOROLA SOFTWARE PROCESS IMPROVEMENT METRICS Source: Daskalantonakis (1992) Project Planning
- Schedule Estimation Accuracy - Effort Estimation Accuracy
Defect Containment
- Total Defect Containment Effectiveness - Phase Containment Effectiveness
Software Reliability
- Failure Rate Software Defect Density
- In-Process Faults - In-Process Defects - Total Release Defects - Total Release Defects Delta
- Customer-Found Defects - Customer-Found Defects Delta
Customer Service
- New Open Problems - Total Open Problems - Mean Age of Open Problems - Mean Age of Closed Problems
Non-Conformance Cost
- Cost of Fixing Problems Software Productivity
- Software Productivity - Software Productivity Delta

Comprehensive List of Measures
Page 29 of 34
AT&T SOFTWARE INSPECTION PROCESS METRICS Source: Barnard & Price (1994) Cost
- Average Effort per Thousand Lines of Code
- Percentage of Re-Inspections Cycle Time
- Average Effort per Thousand Lines of Code
- Total Thousand Lines of Code Inspected Quality
- Average Faults Detected per Thousand Lines of Code
- Average Inspection Rate - Average Preparation Rate
Conformity
- Average Inspection Rate - Average Preparation Rate - Average Lines of Code Inspected
- Percentage of Re-Inspections Efficiency
- Total Thousand Lines of Code Inspected Effectiveness
- Defect Removal Efficiency - Average Faults Detected per Thousand
Lines of Code - Average Inspection Rate - Average Preparation Rate - Average Lines of Code Inspected
Productivity
- Average Effort per Fault Detected - Average Inspection Rate - Average Preparation Rate - Average Inspection Rate - Average Preparation Rate - Average Lines of Code Inspected
SPR SOFTWARE PROCESS IMPROVEMENT METRICS Source: Jones (1997) Process Improvement
- Process Improvement Expenses per Capita
- Process Improvement Stages in Calendar Months
- Improvements in Delivered Defects - Improvement in Development Productivity - Improvements in Development Schedule - Organization Size in Number of People - Capability Maturity Model for Software
Level Application/System
- Application Class - Programming Language - Size in Function Points - Size in Lines of Code
Productivity
- Work Hours per Month (Function Points) - Average Monthly Salary
- Function Points per Month - Lines of Code per Month - Cost per Function Point - Cost per Line of Code
Cost
- Work Hours per Function Point per Activity
- Staff (Number of People) per Activity - Effort (Months) per Activity - Schedule (Months) per Activity - Costs per Activity - Percent of Costs per Activity
Quality
- Potential Defects (Estimated) - Defect Removal Efficiency - Delivered Defects - Defects per Function Point - Defects per Thousand Lines of Code
Comprehensive List of Measures
Page 30 of 34
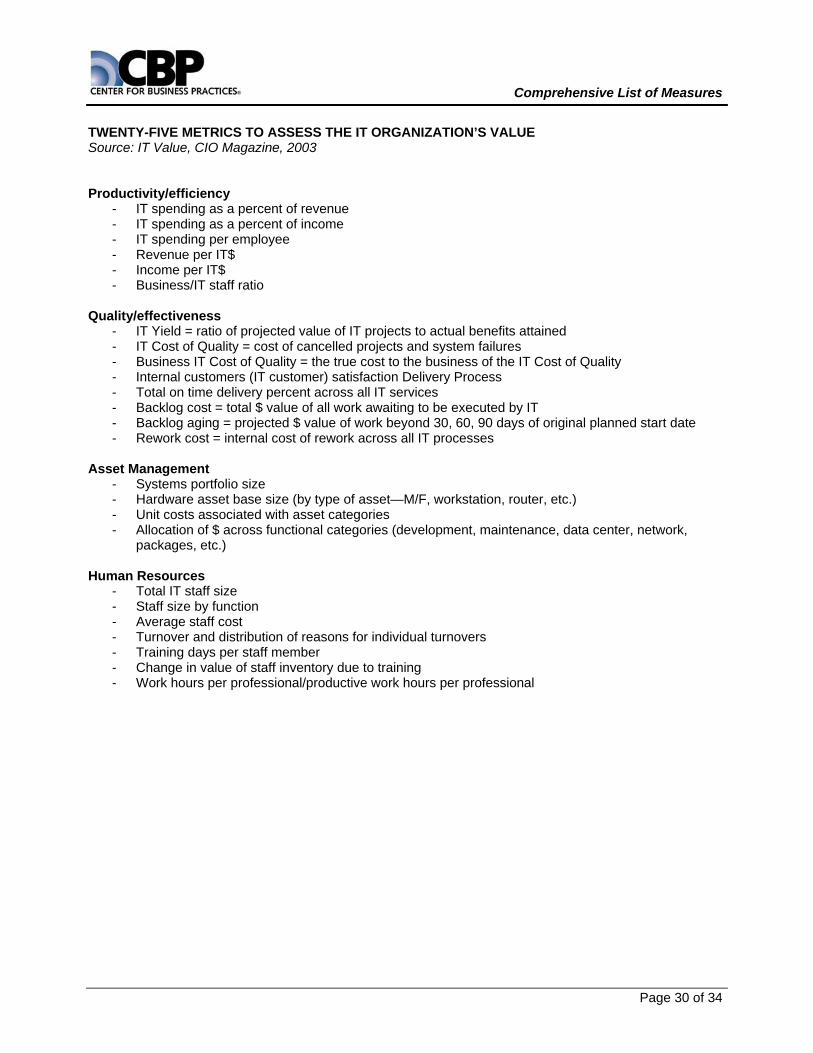
TWENTY-FIVE METRICS TO ASSESS THE IT ORGANIZATION’S VALUE Source: IT Value, CIO Magazine, 2003 Productivity/efficiency
- IT spending as a percent of revenue - IT spending as a percent of income - IT spending per employee - Revenue per IT$ - Income per IT$ - Business/IT staff ratio
Quality/effectiveness
- IT Yield = ratio of projected value of IT projects to actual benefits attained - IT Cost of Quality = cost of cancelled projects and system failures - Business IT Cost of Quality = the true cost to the business of the IT Cost of Quality - Internal customers (IT customer) satisfaction Delivery Process - Total on time delivery percent across all IT services - Backlog cost = total $ value of all work awaiting to be executed by IT - Backlog aging = projected $ value of work beyond 30, 60, 90 days of original planned start date - Rework cost = internal cost of rework across all IT processes
Asset Management
- Systems portfolio size - Hardware asset base size (by type of asset—M/F, workstation, router, etc.) - Unit costs associated with asset categories - Allocation of $ across functional categories (development, maintenance, data center, network,
packages, etc.) Human Resources
- Total IT staff size - Staff size by function - Average staff cost - Turnover and distribution of reasons for individual turnovers - Training days per staff member - Change in value of staff inventory due to training - Work hours per professional/productive work hours per professional
Comprehensive List of Measures
Page 31 of 34
IT BALANCED SCORECARD SAMPLE STARTER METRICS Source: Meta Group, A Few Good Measures, 2003
Profit (financial, costs)
- Budget versus actuals - Percentage of budget on initiatives - Percentage of budget on upgrades - Long-term decreases in O&M over Time - Return-on-investment for IT assets - Percentage of overhead per sales - Sales per employee - Profit per employee - IT budget per employee
Patron (customer, client, end user)
- Percentage of very satisfied customers - Number of very satisfied artifacts - Customer calls per hour - Churn or repurchase rates - Customer lifetime value - Number of touch points with customer - Number of employees the customers
know
Process (operations) - System reliability, uptime, or availability - Service-level agreement metrics - Time to market for new products - Number of Version 1 bugs per new
product - Time to reconfigure (flexibility) of value
chains - Lowest costs vs. worldwide benchmarks - Number of private outsourcing deals - Labor mix (seniority) per project - Number of references per project start
Personnel (people, learning, or training) - Employee satisfaction
- Number of employee determined friends per employee
- Personnel retention rates - Speed of learning new systems or jobs - Number of future project requests for
employee’s expertise - Number of core disciplines mastered by
employee - Market capitalization per employee
Project (change, initiative) - Project team maturity - Number of project leads known by
customer - Number of customers known by project
team - Actuals versus budgets - Rework per project
Peril (risk) - Aggregate loss exposure - Business impact per incident - Insurance premium per employee - Speed of reconstitution - Realism of simulation(s) - Number of impromptu (live) simulations
Policy (governance, mission, vision, values) - Recall of policy by employee - Number of stories per manager - Team recall accuracy of mission, vision,
and values - Embodiment of corporate values - Habitual reminders of values (e.g. safety
moments)
Comprehensive List of Measures
Page 32 of 34
BALANCED SCORECARD OF IT MEASURES Source: U.S. General Accounting Office, Measuring Performance and Demonstrating Results of IT Investments, 1998 IT Strategic Measures
Enterprise mission goals - Percent mission improvements (cost,
time, quality) attributable to IT solutions and services
- Percent planned IT benefits projected v. realized
Portfolio analysis and management - Percent IT portfolio reviewed and
disposed - Percent old applications retired - Percent applications retirement plan
achieved - Percent reusable of core application
modules - Percent new IT investment v. total
spending Financial and investment performance - Percent and cost of services provided in-
house v. industry standard - IT budget as a percent of operational
budget and compared to industry average - Net present value, internal rate of return,
return on investment, return on net assets IT resource usage - Percent consolidated/shared resources
across units - Percent cross-unit shared databases and
applications - Percent hardware/software with
interoperability capabilities IT Customer Measures
Customer partnership and involvement - Percent projects using integrated project
teams - Percent joint IT customer/supplier
service-level agreements Customer satisfaction - Percent customers satisfied with IT
product delivery - Percent customers satisfied with IT
problem resolution
- Percent customers satisfied with IT maintenance and support
- Percent customers satisfied with IT training
- Percent products launched on time - Percent service-level agreements met Business process support - Percent IT solutions supporting process
improvement projects - Percent users covered by training to use
new IT solutions - Percent new users able to use
applications unaided after initial training IT Internal Business Measures
Applications development and maintenance - Number of function points delivered per
labor hour - Number of defects per 100 function points
at user acceptance - Number of critical defects per 100
function points in production - Percent decrease in application software
failures, problems - Mean time to resolve critical defects - Cycle time for development Project performance - Percent projects on time, on budget - Percent projects meeting functionality
requirements - Percent projects using standard
methodology for systems analysis and design
Infrastructure availability - Percent computer availability - Percent communications availability - Percent applications availability - On-line system availability Enterprise architecture standards compliance - Number of variations from standards
detected by review and audit per year - Percent increase in systems using
architecture - Percent staff trained in relevant standards
Comprehensive List of Measures
Page 33 of 34
IT Innovation and Learning Measures
Workforce competency and development - Percent staff trained in use of new
technologies and techniques - Percent staff professionally certified - Percent IT management staff trained in
management skills - Percent IT budget devoted to training and
staff development Advanced technology use - Percent employees skilled in advanced
technology applications - Number of dollars available to support
advanced technology skill development
Methodology currency - Currency of application development
methods used - Percent employees skilled in advanced
application development methods - Percent projects developed using
recognized methods and tools Employee satisfaction and retention - Percent employee satisfaction with the
capability of the existing technical and operating environment to support mission
- Percent employee turnover by function
Comprehensive List of Measures
Page 34 of 34
About the Center for Business Practices The Center for Business Practices is a knowledge center created to capture, organize, and transfer business practice knowledge to project stakeholders in order to help them excel in today’s rapidly changing business environment.. The CBP promotes effective strategy execution through sound portfolio, program, project, and performance management by capturing best practice knowledge and integrating it into actionable, fact-based information: research, publications, and benchmarking events. CBP Research The CBP conducts original research to help organizations realize maximum benefit from their projects. Research reports cover a wide range of topics, including strategy & projects, project portfolio management, project management maturity, the value of project management, project management training, project control functions, high-performance project teams, and more. CBP Summit: Strategy & Projects The annual CBP Summit is a dynamic conference that analyses current management issues through presentations, panel discussions, and open forums led by industry leaders and senior practitioners. The summit focuses on Strategy & Projects and the integration of portfolio, program, project, and performance management practices for effective strategy execution. For more information visit www.cbpsummit.com. CBP Benchmarking Forum The CBP Benchmarking Forums are facilitated two-day structured exchanges of best practice knowledge among senior practitioners. Each forum focuses on a particular set of best practices, such as change management, project management office, government project management, project portfolio management. CBP Books The CBP publishes books through the internationally respected publisher, Taylor & Francis Group (including various imprints: Auerbach Publications, CRC Press, Marcel Dekker). Current titles include The Strategic Project Office, Project Management Maturity Model, Optimizing Human Capital with a Strategic Project Office, Project Portfolio Management Maturity Model, Project Portfolio Management, Managing Multiple Projects, and others. For more information or to order, visit the CBP Store at www.cbponline.com/bookstore. CBP Store The CBP also reviews and sells the best literature on the market for understanding how to manage the organization and its projects effectively. The store also features online training courses, software, and event registrations. Visit the CBP Store at www.cbponline.com/bookstore. Best Practices e-Advisor The Best Practices e-Advisor is a free, monthly e-mail newsletter that provides succinct pointers to practices that help organizations better manage their strategy, projects and business processes. For More Information — www.cbponline.com The CBP is a division of Project Management Solutions, Inc. For more information contact Center for Business Practices, 410 Township Line Rd., Havertown, PA 19083 USA; 484.450.0100; [email protected].
CENTER FOR BUSINESS PRACTICES
410 TOWNSHIP LINE ROAD HAVERTOWN, PA 19382 USA 484.450.0100 • WWW.CBPONLINE.COM
PM Measurement Glossary and References
Center for Business Practices Measurement Glossary and References
© 2005 Page 2 of 7
Glossary Assessment: An all-inclusive term used to denote the act of determining, through a review of objective evidence and witnessing the performance of activities, whether items, processes, or services meet specified requirements. Assessments are conducted through implementation of activities such as audits, performance evaluations, management system reviews, peer reviews, or surveillances, which are planned and documented by trained and qualified personnel.
Balanced ScorecardTM: A management framework for translating an organization's mission and strategy into a comprehensive set of performance measures to provide a framework for strategic measures and management. The scorecard measures organizational performance across several perspectives: financial, customers, internal business processes, and learning and growth.
Baseline: The original plan (for a project, a work package, or an activity), plus or minus approved changes. Usually used with a modifier (e.g., cost baseline, schedule baseline, performance measurement baseline).
Baseline data: Initial collection of data to establish a basis for comparison, evaluation and target setting.
Benchmark: 1) An outcome with a specific target for achievement. Benchmarks are often time-bound (e.g., achieve 100% compliance within two years). 2) A standard based on the performance of another organization or group of organizations (comparison typically made with organizations having similar characteristics and/or demographics).
Benchmarking: The process of continuously comparing and measuring an organization against recognized leaders and similar organizations anywhere in the world to gain information that will help the organization take action to improve its performance.
Best practice: Superior performance within an activity, regardless of industry, leadership, management or operational approaches; methods that lead to exceptional performance. A relative term that usually indicates innovative or interesting business practices that have been identified during a particular benchmarking study as contributing to improved performance.
Best-in-class: Outstanding performance within an industry or sector; words used as synonyms include “best practice” and “best-of-breed.”
Business process redesign: The reengineering of business processes, organizational structures, management systems, and/or values of an organization in order to achieve breakthroughs in performance.
Continuous improvement: 1) The undying betterment of a process based on constant measurement and analysis of results produced by the process and use of that analysis to modify the process. 2) Where performance gains achieved are maintained and early identification of deteriorating environmental, safety, and health conditions is accomplished.
Control: The process of comparing actual performance with planned performance, analyzing variances, evaluating possible alternatives, and taking appropriate corrective action as needed.
Control charts: Control charts are a graphic display of the results, over time and against established control limits, of a process. They are used to determine if the process is “in control” or in need of adjustment.

Center for Business Practices Measurement Glossary and References
© 2005 Page 3 of 7
Core process: The fundamental activities, or group of activities, so critical to an organization's success that failure to perform them in an exemplary manner will result in deterioration of the organization's mission.
Criteria: The rules or tests against which the quality of performance can be measured.
Customer: The person or group that establishes the requirements of a process and receives or uses the outputs of that process; or the person or entity directly served by the organization.
Dashboard: A dashboard is an executive information system that captures financial and nonfinancial measures as indicators of successful strategy deployment.
Data validation: The process of reviewing and updating data for correctness and completeness.
Earned value management: A method for integrating scope, schedule, and resources, and for measuring project performance. It compares the amount of work that was planned with what was actually earned with what was actually spent to determine if cost and schedule performance are as planned.
Effectiveness: An ends-oriented concept that measures the degree to which predetermined goals and objectives for a particular activity or program are achieved. May include both intended and unintended results of a program as part of the measurement of effectiveness.
Efficiency: The relationship between efforts (or inputs) to outputs or outcomes. Measured by indicators of the resources used or cost per unit of output or outcome. A resource-usage concept, also with a least-cost notion, that is concerned with maximizing outputs at minimal cost or using minimum resources.
Environment: Circumstances and conditions that interact with and affect an organization. These can include economic, political, cultural, and physical conditions inside or outside of the organization.
External customer: An individual or group outside the boundaries of the producing organization that receives or uses the output of the process.
Goal: 1) The result that a program or organization aims to accomplish. 2) A statement of attainment/achievement, which is proposed to be accomplished or attained with an implication of sustained effort and energy.
Guideline: A suggested practice that is not mandatory in programs intended to comply with a standard. The word “should” or “may” denotes a guideline; the word “shall” or “must” denotes a requirement.
Impact: Characterization of the outcome of a program as it relates to specific objectives.
Information need: a project manager’s specific information need required to support project decision making
Information product: execution of the measurement plan produces the information products that respond to the project information needs
Internal customer: An individual or group inside the boundaries of the producing organization that receives or uses the output from a previous stage or process to contribute to production of the final product or service.
Key performance indicator: Measurable factor of extreme importance to the organization in achieving its strategic goals, objectives, vision, and values that, if not implemented properly, would likely result in a significant decrease in customer satisfaction, employee morale, and effective financial management.

Center for Business Practices Measurement Glossary and References
© 2005 Page 4 of 7
Lessons learned: A “good work practice” or innovative approach that is captured and shared to promote repeat application. A lesson learned may also be an adverse work practice or experience that is captured and shared to avoid recurrence.
Management: All individuals directly responsible and accountable for planning, implementing, and assessing work activities.
Measurable concept: an idea about the entities that should be measured in order to satisfy the information need
Measure: 1) A category of information used to define the overall performance of an organization, i.e., productivity, satisfaction, etc.
Measurement construct: a measurable concept will be formalized as a measurement construct that specifies exactly what will be measured and how the data will be combined to produce results that satisfy the information need
Measurement plan: all of the applicable information needs, measurement constructs, and measurement procedures for a project. The measurement plan defines which information needs are applicable to a particular project, how the project work products and processes will be measured to satisfy those information needs, and how the measurement process will be resourced and managed.
Measurement procedure: the mechanics of collecting and organizing the data required to instantiate a measurement construct
Metric: The defined means of measurement. Measures should have at least one metric that operationally defines the measure. For example the metric for the measure Dividend Performance may be "% increase in dividends per share per year". Metrics comprise a set of key indicators that will be measured regularly to determine progress toward goals and to anticipate problems in time to be mitigated.
Mission: Provides a summary of the organization’s purpose and answers the questions, “why do we exist?” The mission provides the basis for aligning goals, core businesses and programs. The mission does not answer “how” the purpose will be achieved.
Objective: A statement of the desired result to be achieved. An objective should be realistic, measurable, generally within the control of the organization, and time constrained.
Outcome: The basic unit of measurement of progress toward achieving an objective. An outcome may be initial, intermediate, or long-term.
Outcome measure: An assessment of the results of a program activity or effort compared to its intended purpose.
Output: A product or service produced by a program or process and delivered to customers (whether internal or external).
Output measure: The tabulation, calculation, or recording of activity or effort and can be expressed in a quantitative or qualitative manner.
Performance audit: An appraisal of how effective a particular activity is in carrying out the organization's policies and procedures. May cover any activity within a department, division, or local area and is usually performed by persons independent of the organization. Can also be a review of a program to ensure that it is achieving its objectives (effectiveness) and is doing so at a reasonable cost (economy and efficiency).
Center for Business Practices Measurement Glossary and References
© 2005 Page 5 of 7
Performance goal: A target level of an activity expressed as a tangible measurable objective, against which actual achievement can be compared.
Performance indicator(s): 1) A particular value or characteristic used to measure output or outcome. 2) A parameter useful for determining the degree to which an organization has achieved its goals. 3) A quantifiable expression used to observe and track the status of a process. 4) The operational information that is indicative of the performance or condition of a facility, group of facilities, or site.
Performance management: The use of performance measurement information to help set agreed-upon performance goals, allocate and prioritize resources, inform managers to either confirm or change current policy or program directions to meet those goals, and report on the success in meeting those goals.
Performance measure or indicator: A quantifiable indicator of progress, achievement, and efficiency that includes: outcome, output, input, efficiency, and explanatory indicators.
Performance measurement: A process of assessing progress toward achieving predetermined goals, including information on the efficiency with which resources are transformed into goods and services (outputs), the quality of those outputs (how well they are delivered to clients and the extent to which clients are satisfied) and outcomes (the results of a program activity compared to its intended purpose), and the effectiveness of government operations in terms of their specific contributions to program objectives.
Performance objective: 1) A statement of desired outcome(s) for an organization or activity. 2) A target level of performance expressed as a tangible, measurable objective, against which actual achievement shall be compared, including a goal expressed as a quantitative standard, value, or rate.
Performance report: An internal or external report conveying information about the results of an organization’s services and programs.
Performance reporting: Collecting and disseminating performance information. This includes status reporting, progress measurement, and forecasting.
Performance result: The actual condition of performance level for each measure.
Process: An ongoing, recurring, and systematic series of actions or operations whereby an input is transformed into a desired product (or output).
Process owner: The individual who possess managerial control over a particular business practice or process.
Productivity: Output produced per unit of input. Productivity measures tell you whether or not you are getting your money’s worth from your people and other inputs to your organization.
Project life cycle: A collection of generally sequential project phases whose name and number are determined by the control needs of the organization or organizations involved in the project.
Project: A temporary endeavor undertaken to create a unique product, service, or result.
Resources: The basic building blocks of an organization. Resources include items like the number of employees, physical structures, and budget dollars or items that are more conceptual like a network of volunteers or a system of intergovernmental communication.
Root cause: The fundamental causal reason for a particular observation; the result of asking “why” at least five times to determine the basic cause in a chain of causal relationships.
Center for Business Practices Measurement Glossary and References
© 2005 Page 6 of 7
Scorecard: A scorecard is a management information system that captures financial and nonfinancial measures as indicators of performance. Scorecards show measure information as well as baseline, target, current, and variance data.
Sponsor: Key individual or group within the organization that is committed to achieving the introduction of the performance measurement system. It is usual for the sponsor to be a senior executive within the organization. They need to be in a position to make decisions and persuade other members within the organization to buy into the measurement strategy.
Stakeholder:: Any person, group, or organization that can place a claim on, or influence, the organization's resources or outputs; is affected by those outputs; or has an interest in or expectation of the organization.
Strategic direction: The organization's goals, objectives, and strategies by which it plans to achieve its vision, mission, and values.
Strategic goal: A long-range target that guides an organization's efforts in moving toward a desired future state.
Strategic objective: A broad time-phased measurable accomplishment required to realize the successful completion of a strategic goal.
Strategic planning: A continuous and systematic process whereby guiding members of an organization make decisions about its future, develop the necessary procedures and operations to achieve that future, and determine how success is to be measured.
Strategies: Based on goals and objectives, a strategy is the means for transforming inputs into outputs, and ultimately outcomes, with the best use of resources. A strategy reflects the planned use of budgetary and other resources. Strategies exist at many levels within an organization, corporate, business unit, brands/products/services, operating, etc.
Target: An intended result, used to denote the degree of improvement desired or an attainable goal.
Valid: Well grounded on principles or evidence. Able to stand criticism or objection; sound, meaningful.
Verifiable: Capable of verification; can be proved to be true or accurate.
Verification: Establishment or confirmation of the truth or accuracy of information, or the process of checking the truth or accuracy of information.
Vision: An organization’s vision provides a picture of a preferred future that provides long-term direction, guidance and inspiration for the organization.
World class: Leading performance in a process, independent of industry or geographic location.

Center for Business Practices Measurement Glossary and References
© 2005 Page 7 of 7
References Websites
• Center for Business Practices (www.cbponline.com) • Performance Measurement Association (www.som.cranfield.ac.uk/som/cbp/pma/) • American Productivity and Quality Center (www.apqc.com) • Benchmarking Performance Improvement Resources (www.bpir.com) • Performance-Measurement.net (www.performance-measurement.net) • Project Management Institute (www.pmi.org)
Books • Brown, M.G. (1996). Keeping score: Using the right metrics to drive world-class performance.
New York: Amacom. • Chang, R.Y. and Morgan, M.W. (2000). Performance scorecards: Measuring the right things in
the real world. San Francisco: Jossey Bass. • Devaraj, S. and Kohli, R. (2002). The IT payoff: Measuring the business value of information
technology investments. Upper Saddle River, NJ: Prentice Hall. • Epstein, M.J. and Birchard, B. (1999). Counting what counts: Turning corporate accountability
to competitive advantage. New York: Perseus Books. • Friedlob, G.T., Schleifer, L.F., and Plewa, F.J. (2002). Essentials of corporate performance
measurement. New York: John Wiley & Sons. • Harvard Business Review (1999). Measuring corporate performance. Boston: Harvard
Business School Press. • Kaplan, R.S. and Norton, D.P. (1996). The balanced scorecard: Translating strategy Into
action. Boston: Harvard Business School Press. • Kaplan, R.S. and Norton, D.P. (2000). The strategy focused organization: How balanced
scorecard companies thrive in the new business environment. Boston: Harvard Business School Press.
• Kaplan, R.S. and Norton, D.P. (2004). Strategy maps. Boston: Harvard Business School Press. • Kaydos, W.J. (1998). Operational performance measurement. CRC Press. • Neely, A. (2002). Business performance measurement. Cambridge: Cambridge University
Press. • Neely, A., Adams, C., and Kennerley, M. (2002). The performance prism: The scorecard for
measuring and managing business success. London: Pearson Education Limited. • Phillips, J.J., Snead, G.L., and Bothell, T. (2002). Project management scorecard: Measuring
the success of project management solutions. Elsevier Science and Technology Books. • Smith, D. (1999). Make success measurable. New York: John Wiley & Sons.

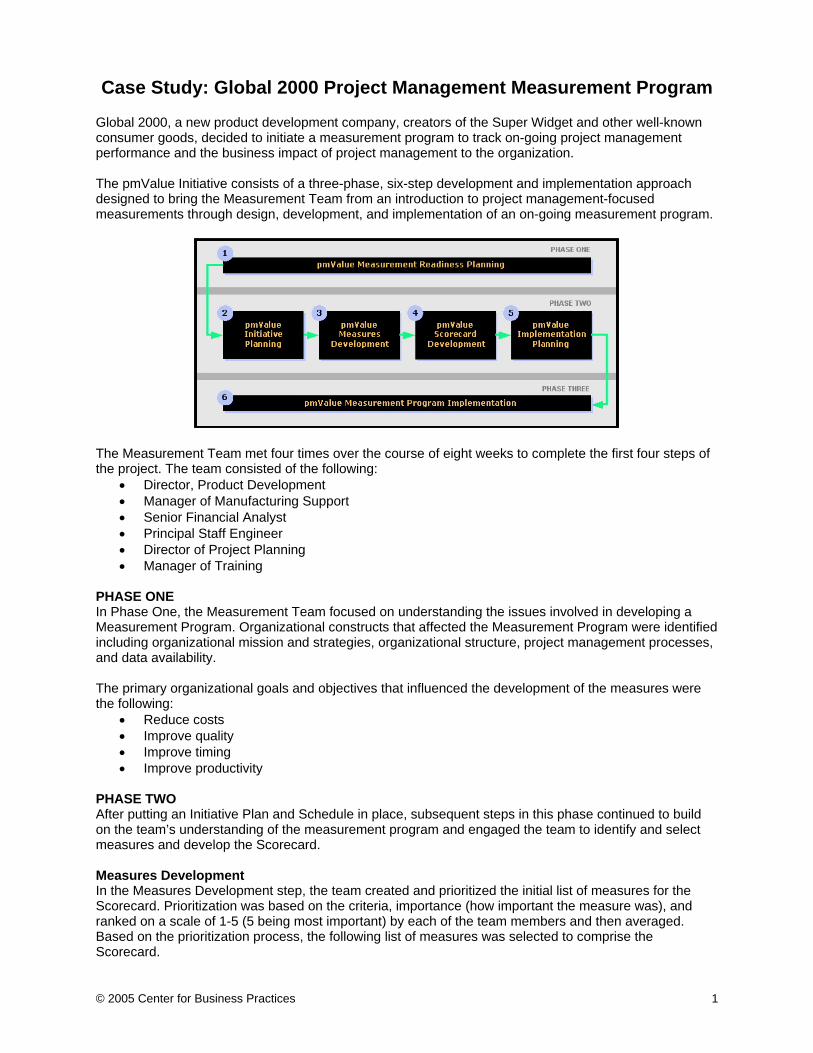
© 2005 Center for Business Practices 1
Case Study: Global 2000 Project Management Measurement Program Global 2000, a new product development company, creators of the Super Widget and other well-known consumer goods, decided to initiate a measurement program to track on-going project management performance and the business impact of project management to the organization. The pmValue Initiative consists of a three-phase, six-step development and implementation approach designed to bring the Measurement Team from an introduction to project management-focused measurements through design, development, and implementation of an on-going measurement program.
The Measurement Team met four times over the course of eight weeks to complete the first four steps of the project. The team consisted of the following:
• Director, Product Development • Manager of Manufacturing Support • Senior Financial Analyst • Principal Staff Engineer • Director of Project Planning • Manager of Training
PHASE ONE In Phase One, the Measurement Team focused on understanding the issues involved in developing a Measurement Program. Organizational constructs that affected the Measurement Program were identified including organizational mission and strategies, organizational structure, project management processes, and data availability. The primary organizational goals and objectives that influenced the development of the measures were the following:
• Reduce costs • Improve quality • Improve timing • Improve productivity
PHASE TWO After putting an Initiative Plan and Schedule in place, subsequent steps in this phase continued to build on the team’s understanding of the measurement program and engaged the team to identify and select measures and develop the Scorecard. Measures Development In the Measures Development step, the team created and prioritized the initial list of measures for the Scorecard. Prioritization was based on the criteria, importance (how important the measure was), and ranked on a scale of 1-5 (5 being most important) by each of the team members and then averaged. Based on the prioritization process, the following list of measures was selected to comprise the Scorecard.
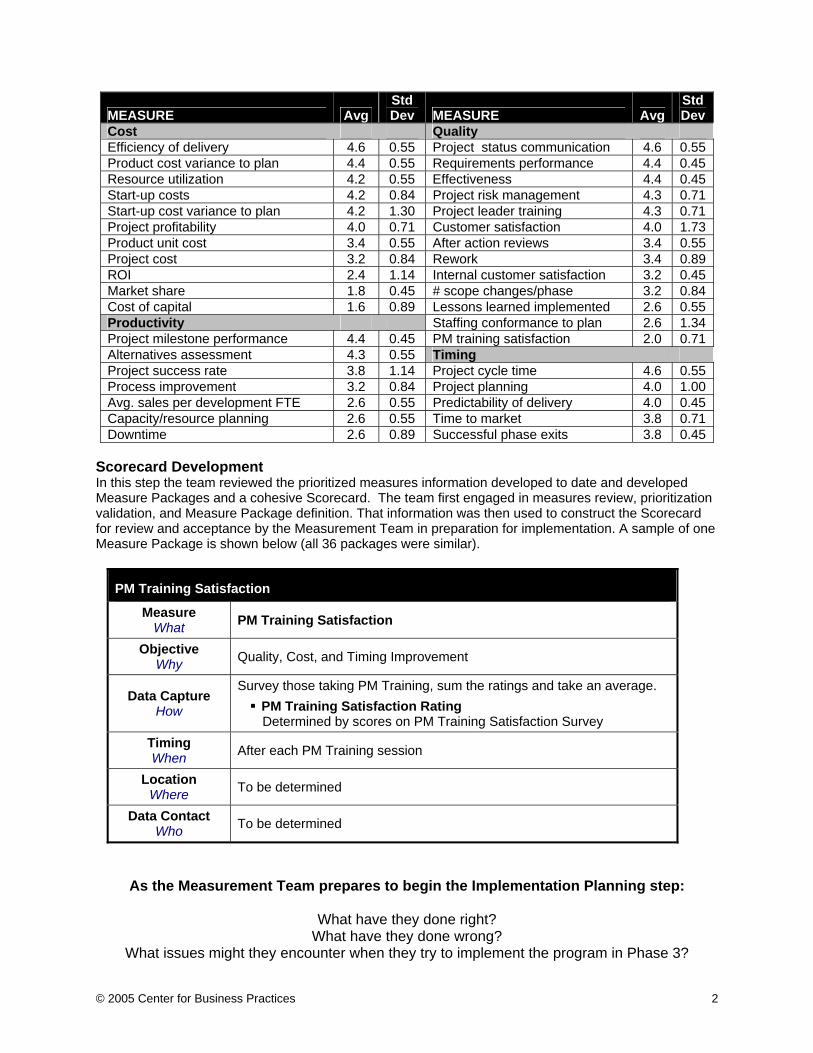
© 2005 Center for Business Practices 2
MEASURE Avg Std Dev MEASURE Avg
Std Dev
Cost Quality Efficiency of delivery 4.6 0.55 Project status communication 4.6 0.55 Product cost variance to plan 4.4 0.55 Requirements performance 4.4 0.45 Resource utilization 4.2 0.55 Effectiveness 4.4 0.45 Start-up costs 4.2 0.84 Project risk management 4.3 0.71 Start-up cost variance to plan 4.2 1.30 Project leader training 4.3 0.71 Project profitability 4.0 0.71 Customer satisfaction 4.0 1.73 Product unit cost 3.4 0.55 After action reviews 3.4 0.55 Project cost 3.2 0.84 Rework 3.4 0.89 ROI 2.4 1.14 Internal customer satisfaction 3.2 0.45 Market share 1.8 0.45 # scope changes/phase 3.2 0.84 Cost of capital 1.6 0.89 Lessons learned implemented 2.6 0.55 Productivity Staffing conformance to plan 2.6 1.34 Project milestone performance 4.4 0.45 PM training satisfaction 2.0 0.71 Alternatives assessment 4.3 0.55 Timing Project success rate 3.8 1.14 Project cycle time 4.6 0.55 Process improvement 3.2 0.84 Project planning 4.0 1.00 Avg. sales per development FTE 2.6 0.55 Predictability of delivery 4.0 0.45 Capacity/resource planning 2.6 0.55 Time to market 3.8 0.71 Downtime 2.6 0.89 Successful phase exits 3.8 0.45
Scorecard Development In this step the team reviewed the prioritized measures information developed to date and developed Measure Packages and a cohesive Scorecard. The team first engaged in measures review, prioritization validation, and Measure Package definition. That information was then used to construct the Scorecard for review and acceptance by the Measurement Team in preparation for implementation. A sample of one Measure Package is shown below (all 36 packages were similar).
PM Training Satisfaction
Measure What PM Training Satisfaction
Objective Why Quality, Cost, and Timing Improvement
Data Capture How
Survey those taking PM Training, sum the ratings and take an average. PM Training Satisfaction Rating Determined by scores on PM Training Satisfaction Survey
Timing When After each PM Training session
Location Where To be determined
Data Contact Who To be determined
As the Measurement Team prepares to begin the Implementation Planning step:
What have they done right? What have they done wrong?
What issues might they encounter when they try to implement the program in Phase 3?