Measurement and Monitoring of Net- centric Enterprise Systems
57
Page 1 Measurement and Monitoring of Net- centric Enterprise Systems Paul C. Hershey, Ph.D.
Transcript of Measurement and Monitoring of Net- centric Enterprise Systems

Page 1
Measurement and Monitoring of Net-centric Enterprise Systems
Paul C. Hershey, Ph.D.

Page 2
Agenda
• Introduction– Problem– Challenge – Definitions
• Framework for Enterprise Systems Measurement and Monitoring– ESMM Reference Architecture
• Metrics for Enterprise Systems Measurement and Monitoring– Metrics categories
• Enterprise Systems Measurement and Monitoring for SOA– SOA ESMM Reference Architecture
• Conclusions and Suggestions for Further Work

Page 3
Introduction

Page 4
Problem to Solve
• Global Internet vision is not presently realizable:– Provide end-user access to thoughts and ideas almost instantly with
respect to human perception• Complex high-speed, high-bandwidth enterprise systems process and
transport large quantities of data at rates that inhibit effective measurement and monitoring
– Amount of data exceeds processing capacity of components– Enterprise System Measurement and Monitoring (ESMM) capabilities fail to:
• Observe all required performance information• Meaningfully aggregate and synchronize metrics • Effectively correlate disparate failure-causing events • Provide comprehensive shared situational awareness
– Problem becomes more severe as simple networks evolve into complex, net-centric enterprise systems driven by methodologies such as service-oriented architecture (SOA) • Enables distribution of relevant data to all involved parties independent of time or
location
• Result– Commercial businesses, government agencies, and academic institutions
struggle to properly interpret enterprise system data content – Service providers finding it difficult to meet customer Service Level
Agreements (SLAs)

Page 5
Trace Approaches for ESMM
• Tracing actual data and collecting statistical information only
• Disk storage and processor speed limitations– OC192 SONET ring: Line rate of 10 Gbps
• Generates new 40-byte minimum size IP packet every 35 ns• Trace method 1: data collection fills ten 64 terabyte disks, each with 1 GHz
processor, in ≤ 10 minutes. • Trace method 2: 10,000 MIPS pre-processor has 35 instructions/packet.
– OC768 SONET ring: Line rate 40 Gbps• Generates new 40-byte minimum size IP packet every 8 ns• Trace method 1: data collection fills ten 64 terabyte disks, each with 1 GHz
processor, in ≤ 2.5 minutes • Trace method 2: 10,000 MIPS pre-processor has 8 instructions/packet

Page 6
Packet Classification and Pattern Matching Approaches
• Packet classification– Categorize packets into flows that obey predefined rules and are processed in a
similar manner, such as by a router – In complex networks, there exist multiple, different packet characterizations that
can be represented by algorithms for recognizing regular expressions – For high-speed networks, hardware-based algorithms can be implemented using
devices such as Ternary Content Addressable Memories (TCAM) – Issue:
• As network speed and complexity increase, TCAM technology suffers from lack of density, increasing power dissipation, and price sensitivity when compared with static RAM
• Scalable Pattern Matching– Use Field Programmable Gate Array (FPGA) designs that search packet payloads
for patterns, including those corresponding to regular expressions to be recognized– Implementations have been proven to support pattern matching at network rates of
1 Gbps to 100 Gbps – Issue
• Extreme processing rates and excessive storage requirements
• Needed Solution– Procedure to design cost-effective implementations of finite state machines (FSMs)
that recognize patterns of interest while processing channel symbols at the clock rate of the transmission media

Page 7
Enterprise Systems Measurement and Monitoring (ESMM) Challenge
Challenge:
End user reports an issue but help and support functions cannot provide timely resolutions.
Solution:
Identify measurement and monitoring capabilities and guidelines for end users that have visibility across traditional administrative domains through the use of recognized best practices methods, processes and techniques.

Page 8
Definitions
• Enterprise Systems Measurement and Monitoring (ESMM): the collection, measurement, correlation, analysis, dissemination, and instrumentation of usage, control, management, and security information for relevant computing and networking components that participate across all layers of the NetOps environment to deliver customer services.
• Net-centricity: the realization of a networked environment, including infrastructure, systems, processes, and people, that enables secure interconnection of people and systems independently of time or location.

Page 9
Framework for Enterprise Systems Measurement and Monitoring

Page 10
Definitions
• Service-based metric: an object that has a name (i.e., metric name), a definition, a value (i.e., measure), an observation time period, a computing or collection method (i.e., measurement), and one or more threshold values for setting alarms (e.g., minor, major, critical)– Example: number of cars that pass over a bridge
• Measure: a quantitative value of the metric object derived for the observation time interval– Example: value representing the counted number of cars per
observation time interval
• Measurement: the computing or collection process or method of determining the value of the metric object – Example: use of a sensor placed across the lanes of the bridge
that would advance a counter each time a car passed over

Page 11
Service-Based ESMM Framework
• Enterprise Service Areas: Applications, Network, Transport, and IA/Security
– Represent the unique perspectives of organizational elements supporting the enterprise system
– Set boundaries that help define the information sharing for situational awareness
• Monitoring Domains: Application, Network, Transport, and IA/Security
– Structure within which particular services are measured and monitored using similar techniques and instrumentation
• Monitoring Planes: Usage, Control, IA/Security, and Management – Structure within which particular end-to-end functions are measured
and monitored spanning multiple services, maintaining end-to-end coverage, and organizing measurement and monitoring activities by function
– Encompass all monitoring domains thereby enabling measurement and monitoring, event correlation and data sharing required for an enterprise systems solution

Page 12
ESMM Reference Architecture

Page 13
ESMM Framework Advantages
• Provides a disciplined approach to strategically evolve from the “as-is” measurement and monitoring environment towards the future “to-be” measurement and monitoring environmentto support continual improvements in mission effectiveness, customer service, process improvement, and IA
• Enables systematic and effective decision making for service level management
• Creates cross reference from which to identify gaps in the measurement and monitoring capabilities
• Defines a reusable design for multi-domain, multi-plane, and multi-vendor components
• Supports selection of tools and technologies for effective measurement and monitoring
• Provides set of “common terminology” (e.g., metrics)• Enables development of ESMM guidelines to meet customer
satisfaction and achieve mission effectiveness in a global service-based enterprise environment

Page 14
VoIP Service Measurement and Monitoring Scenario 1
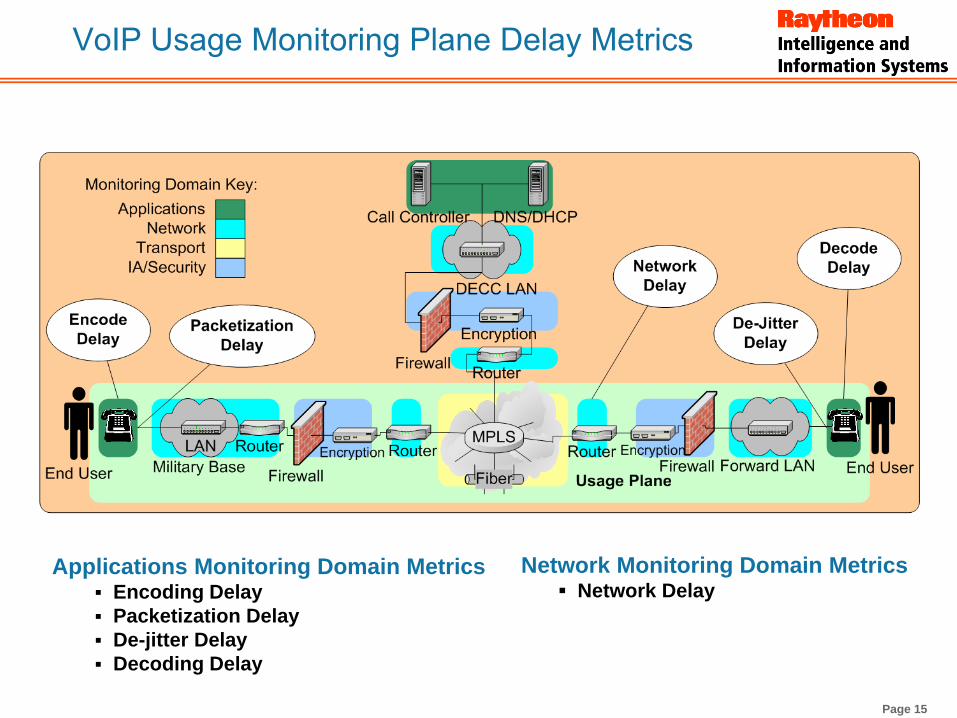
1. During a routine VoIP conversation, the end user observes a degradation of service.
2. Measurement and monitoring activity determines that end-to-end delay is too high.
3. Delay metrics are examined to identify a cause. – Metric category: end-to-end delay
• Total one-way delay from the sending end user, across the enterprise to the receiving end user
• Relevant Metrics
– Encoding Delay: time for conversion of analog voice to digital data at transmitter
– Packetization Delay: time to fill a UDP packet with a voice sample
– De-jitter Delay: processing time to manage the receiver buffer
– Decoding Delay: time for conversion of digital data back to analog at receiver
– Network Delay: time for packet to pass through network devices in the enterprise
Page 15
VoIP Usage Monitoring Plane Delay Metrics
Applications Monitoring Domain MetricsEncoding DelayPacketization DelayDe-jitter DelayDecoding Delay
Network Monitoring Domain MetricsNetwork Delay

Page 16
Monitoring Domain Problem
• Individual domain-based measurement and monitoring methodology cannot comprehensively identify and track end-to-end delay through multiple services
– Transport Monitoring Domain • Accounts for the time delay required to pass the data over the backbone
transmission media
• No knowledge of what applications or which users are being affected
– Network Monitoring Domain• Only monitoring domain to track the traffic associated with network transit delay
• Cannot place the data into a business context nor report on any activity beyond the interactions between various applications over the network
– Security Monitoring Domain• Examines the time delay required for such activities as ensuring that the
message is virus-free and is shared between the proper end users
• Lacks the capability to correlate security events between monitoring domains
– Applications Monitoring Domain• Observes and reports interactions between applications
• No visibility into transport or network activities

Page 17
Monitoring Domain Solution
• Use monitoring plane structure to encompass all relevant metrics that span multiple monitoring domains.
• Scenario 1 Solution: – Usage Monitoring Plane accounts for end-to-end delay metrics
– Network operators examine end-to-end delay from a Usage Monitoring Plane perspective• Enables faster understanding of the problem
• Permits timely resolution and restoration of quality to the end user

Page 18
VoIP Service Measurement and Monitoring Scenario 2
• During routine scan of network activity, a denial of service event is detected, and security engineers deactivate a link on the path of the VoIP call (event in the IA/security Monitoring Plane).
• The network responds by reconfiguring and routing over an alternate, possibly lower-speed set of links (event in the Control Monitoring Plane).
• The VoIP call continues, but, due to the decrease in bandwidth capacity, delay increases in the network transit and degrades the quality of service to the end user (event in the Usage Monitoring Plane).
• Management Monitoring Plane activities collect and measure the events in the security, control, and usage planes, plus generate help desk reports.

Page 19
VoIP Service Measurement and Monitoring Scenario 2
• Metric category: end-to-end delay– Total one-way delay from the sending end user, across the
enterprise to the receiving end user
– Control Monitoring Plane metrics
• Call Controller Discovery Delay: time for VoIP system to discover and connect to a call controller using TCP/IP
• Post Dial Delay: time interval from the completion of dialing to signaling a ring at the receiver
• Post Pick-up Delay: time interval from lifting the receiving handset to call commencement
• Network Delay: time for packet to pass through network devices in the enterprise.
– Usage Monitoring Plane metrics are same as for Scenario 1

Page 20
VoIP Control Monitoring Plane Delay Metrics
Applications Monitoring Domain MetricsCall Controller Discovery DelayPost Dial DelayPost Pick-up Delay
Network Monitoring Domain MetricsNetwork Delay

Page 21
Monitoring Plane Problem
• Individual plane-based monitoring methodology cannot comprehensively identify and track end-to-end delay through multiple services– Example: network delay appears in both control plane and usage
plane
• Single monitoring plane cannot effectively organize and report results for entire enterprise

Page 22
Monitoring Plane Solution
• Use all monitoring planes, paying attention to relevant metrics both within an individual monitoring plane and that span multiple monitoring planes.
• Scenario 2 Solution: – Multiple monitoring planes include metrics required to determine end-to-
end delay
– Network operators must share inter-monitoring-plane information and collaborate in order to account for the influence of events in one monitoring plane on those in another
• Enables faster understanding of the problem
• Permits timely resolution through provisioning of an alternate, higher bandwidth set of links to restore quality to the end user

Page 23
Metrics for Enterprise Systems Measurement and Monitoring
Page 24
Metrics Categories
• Refined and focused collection of service-based metrics to be measured and monitored– May have a different “metric name,” depending on the end user or
service provider, but provide the identical monitoring information – May be classified according to Performance, Fault, Configuration,
Security, and Capacity and Operational Planning

Page 25
Metrics Categories
PerformanceDelay
Delay Variation
Throughput
Information Overhead
Fault Availability
Information Loss
Configuration In Service/Out Of Service
Upgrade Service
Asset Inventory
Security Authentication
Authorization
Non-repudiation
Integrity
Information Availability
Certification & Accreditation
Physical Security
Capacity and Operational Planning Mean Time To Provision
Resource Consumption Rate

Page 26
Example 1: Enterprise System Complexity - BT MPLS1
• British Telecommunications (BT) Multi-protocol Label Switching (MPLS)– Supports applications that cross geographic and company boundaries– Available in over 115 countries– Greater than 2,000 clients and 43,000 ports connected to BT MPLS platform
globally – 1200 Points of Presence (PoPs) in Europe, the Americas and the Asia Pacific
Region• Advanced features
– Performance optimisation of network applications – Prioritisation
• Classification and prioritisation of applications into different Classes of Service (CoS)• Prioritisation of the transmission of different types of data applications
– Connectivity • Any-to-any connectivity - either through a meshed or partially-meshed network• LAN-to-LAN or WAN-to-WAN connectivity over private networks
– Quality of Service using a combination of Differential Services (DiffServ) and Traffic engineering techniques
• Priority Queuing Class Base Weighted Fair Queuing• Committed Access Rate • Weighted Random Early Detection (WRED)• Frame Relay and ATM traffic shaping
1 BT MPLS technical specification, www.BT.com, accessed June 13, 2008.

Page 27
Example 1: MPLS Network Components

Page 28
Example 1: MPLS Network Components
• Label Switches Routers (LSRs)– Customer Edge (CE) routers– Provider Edge (PE) routers
• Ingress Label Edge Router (I-LER) - (I-PE)• Egress Label Edge Router (E-LER) - (E-PE)
• Optical Node – Amplifier/Regenerator– Transponder– SONET Optical Carrier (OC)-3 through OC-192 – DWDM – Fast, Gigabit and 10Gigabit Ethernet – Digital Signal (DS)-3 – Multi-Service Provisioning Platform (MSPP) – Optical Digital Cross Connect (ODXC) – M13 multiplexer– HAIPE Cryptographic devices

Page 29
Example 1: MPLS Metrics and Locations

Page 30
Example 1: MPLS Metrics and Locations
• Delay and Delay Variation– Monitor at I-PE routers
• Asset Inventory– Monitor at E-PE routers
• In-Service/Out-of-Service, Information Overhead, Information Loss, Throughput, and Upgrade Service– Monitor at LSRs within the MPLS cloud
• Availability, Resource Consumption Rate, and Mean-Time-to-Provision– Monitor within optical cloud
• Security-related metrics– Monitor within optical node PE and P routers with various
security classification levels including Classified (C-PE), both Secret (S-PE) and Top Secret (T-PE), and unclassified (U-PE)

Page 31
Example 2: Typical Enterprise System

Page 32
Example 2: Enterprise System Components
• End user client machines– Run applications over base/camp/post/station network
• Routers– CE, PE, and DECC edge router (DE)
• High Assurance Internet Protocol Encryption (HAIPE)• Cache • MPLS • Optical transport
– Dense Wavelength Division Multiplexing (DWDM)– Synchronous Optical Network (SONET)
• Defense Enterprise Computing Center (DECC) • DECC Local Area Network (LAN) • Services
– Dynamic Host Configuration Protocol (DHCP), Distributed Names System (DNS), Discovery, Cluster, App Server, Portal, Message Queue, Web Server, Service Node, Message Queue, Security, and Database

Page 33
Example 2: Enterprise System User Communities
• End users shown with the client workstation
• Help desk shown with the trouble management system database
• Operations shown with the configuration management database
• Engineering shown with the project control and development tracking database

Page 34
Example 2: Applications Delay Measurement & Monitoring
Page 35
Example 2: Alternative Applications Delay Names
• Response time
• Server processing time
• Queuing time
• Query time
• Lookup time

Page 36
Example 2: Metrics and Locations
• One-way Delay and Round-Trip Delay– Monitor at network edges or at DECC LAN.
• Test Transaction Time– Monitor at cache using active testing techniques performed from agents deployed at or near
PE routers at critical network ingresses • Portal Response Time, Transaction Duration, DNS Lookup Time, Round-Trip Delay
– Monitor at DECC LAN ingress through passive monitoring techniques that use proxy or tap configuration
• Caches (Cache-hit Ratio) - service responses generated from caches may significantly reduce network traversal and increase server processing delays
– Monitor at cache within a device deployed on end-user side of network or within data center • Statement Wait Time - delay in gaining access to shared database objects to process
complex query– Monitor at Database
• Request Queue - delay due to client requests that occur more frequently than server can process
– Monitor at Web Server • Disk Busy Time - % of time that physical disk performs read and write operations
– Monitored at servers where there is a high storage input/output requirement • Client-side Delay - delay due to client-side processing instrumentation
– Monitor at client work station

Page 37
Areas for Further Investigation
• Use metrics terminology presented herein as a critical operational enabler for measurement and monitoring of Service Oriented Architecture (SOA)-base applications running over complex enterprise computing systems– SOA offers enhanced operational agility that spans multiple
applications and services across different administrative domains– A comprehensive measurement and monitoring capability is
required that can observe and correlate information from all relevant enterprise systems services

Page 38
Enterprise Systems Measurement and Monitoring for SOA

Page 39
Example: SOA Information Throughput ESMM

Page 40
Example: SOA Information Exchange to Support Throughput ESMM
• Five functions measured and monitored– Publish Service Function– Search Function– Post Content Function– Stage Function – Subscribe Function
• As the net-centric transformation advances, complexity increases– Additional administrative domains – Expanding set of end-users
• Challenge– How to measure and monitor this evolving net-centric system

Page 41
Metrics Categories and SOA Metrics Example
Metric Category Example SOA Metric
Delay Service responsiveness
Response time
Throughput Stage Function:Frequency of data refreshesSizes of data being stagedDuration of data transfers
Post Function:Number and size of post to databaseAverage age of postsNumber of revisions
Content Discovery:Number of results returnedNumber of follow-up or related queries
Information Overhead
Number of messages processed
Information Loss Central processing faults
Fault counts
Fault ratio
Warnings and alerts
Correlation and management events
Simple Network Management Protocol(SNMP) traps
Metric Category Example SOA Metric
Availability Service node availability
Server uptime
Server state
Network health
Hardware events
Cluster availability
Error Count
In Service / Out of Service
Display of network topology
Asset Inventory Discovery of TCP/IP networks
Upgrade Service Usage and behavior of a service over time
Impact of versioning or other changes on service network
Time To Provision Service level agreements
Customer / Customer class - monitor and report on SLAs for a specific customer or class of customer such as gold or silver.
Resource Consumption Rate
Central processing usage
Processing actions:TranslationsPerMinuteXQueriesPerMinute
Document actions:ArchivedPerMinuteGetsPerMinute (both from the document collections and the Inbox)PutsPerMinute (both to the document collections and the Outbox)RemovesPerMinute

Page 42
SOA ESMM Reference Architecture -Monitoring Domains and Planes
• Multi-dimensional– Comprehensive observation and analysis coverage for broad
enterprise-wide service areas• Horizontal dimension – monitoring domains
– Structure within which particular services are measured and monitored using similar techniques and instrumentation
– 4 monitoring domains (governance, business and collaboration, applications, infrastructure)
– Domain-based monitoring methodology is insufficient for identifying and tracking messages that use multiple services across multiple domains
• Vertical dimension - monitoring planes– Structure within which particular end-to-end functions are measured
and monitored, possibly spanning multiple services – 4 monitoring planes (usage, control, IA/security, management) – Each monitoring plane encompasses all monitoring domains
• Encompass all monitoring domains thereby enabling measurement and monitoring, event correlation and data sharing required for an enterprise systems solution

Page 43
SOA ESMM Reference Architecture

Page 44
SOA ESMM Reference Architecture –Enterprise Service Areas
• Governance services– Identify ownership, derive and institute policies, and influence
decisions
• Business and collaboration services– Derive business processes, share these processes with end-users,
and ensure their uniform implementation
• Applications services– Derive applications software, publish and subscribe, process
information, implement SOA components (e.g., registry, enterprise system bus (ESB), repository), and incorporate IA/Security
• Infrastructure services– Aggregate data, provide high-speed and long-distance transport
through media and network components, and incorporate IA/Security

Page 45
Net-Centric System

Page 46
Governance Services Monitoring Domain
• Governance Services Monitoring Domain Example: – Commander of the Joint task Force – for Global Network
Operations (CDRJTF-GNO), via delegated authority from Commander US Strategic Command (CDRUSSTRATCOM), will issue orders and direction to the administrative domains to ensure availability and integrity of the Global Information Grid (GIG)
• Usage Monitoring Plane Example:– General:
• Includes activities that filter, collect, analyze and disseminate information about the user data that is transferred end-to-end across the net-centric system
– With respect to Governance Services: • Includes activities that monitor the dissemination, implementation, and
assessment of operational polices that influence Business, Applications, and Infrastructure Services

Page 47
Business and Collaboration Services Monitoring Domain
• Business and Collaboration Services Monitoring Domain Example: – Federated system that depends on an infrastructure that spans
multiple heterogeneous administrative domains that cooperate to provide business and collaboration services
– Public telephone network – Federal Electronic Fund Transfer (EFT) network
• Management Monitoring Plane Example:– General:
• Encompasses an end-to-end view of the net-centric system that addresses a cross-cutting business concern regarding the management functions in OAM&P, planning, and engineering
– With respect to Business and Collaboration Services: • Ensures that activities affecting Business and Collaboration Services
can be observed throughout the Governance, Applications, and Infrastructure monitoring domains

Page 48
Applications Services Monitoring Domain
• Applications Services Monitoring Domain Example– Applications services that are developed for processes that
orchestrate a series of steps, each enabling a business service
• Control Monitoring Plane Example:– General:
• Observes the control and signaling information that accompanies the user data throughout the net-centric system
– With respect to Application Services: • Exchanges control messages between machines (such as routing
table updates) or applications (such as HTTP headers) to allow the machines or applications to determine the best way to offer the requested service

Page 49
Infrastructure Services Monitoring Domain
• Infrastructure Services Monitoring Domain Example: – Monitoring metrics (e.g., In-Service/Out-of-Service, Asset
Inventory, Upgrade Service) for use by network operations to support services from a collection of components built on different machines, running different operating systems, and developed in different programming languages
• IA/Security Monitoring Plane Example:– General:
• Encompasses IA/security monitoring both within and between monitoring domains
– With respect to Infrastructure Services: • Monitors activities for programs transferring data across one-way and
two-way cross domain solutions (CDSs)
• Provides network intrusion detection and prevention systems

Page 50
Conclusions and Suggestions for Further Work

Page 51
Conclusions (Framework)
• Challenge for ESMMEnd user reports problem but support functions don’t see it
• ESMM Framework and Reference ArchitectureClarifies and prioritizes ESMM requirements Enables identification of metrics within their respective monitoring domains Enables comprehensive evaluation of measurement and monitoring activities through monitoring planes (including inter-plane-domain dependencies)
• ESMM Framework Enables NetOpsTo focus decision-making for effective service managementTo address the pitfalls of service operation a priori and provide proactive management before problems arise

Page 52
Conclusions (Metrics)
• Identified, defined, and rationalized a set of service-based metrics categories – Consistent and meaningful terminology for network operators and
service providers to use for measurement and monitoring of complex enterprise systems
• Provided examples to show how these metric categories could be applied to an enterprise system and where in this system specific metrics within these categories should be measured and monitored

Page 53
Conclusions (SOA)
• Addressed problem of measurement and monitoring of SOA-based applications for enterprise systems and identified appropriate metrics categories and metrics
• Introduced new ESMM framework and reference architecture for enterprise systems SOA-based applications and presented advantages
• Applied ESMM reference architecture to net-centric systems realized through governance, business and collaboration, applications, and infrastructure services

Page 54
Areas for Future Investigation (SOA)
• Information Technology Infrastructure Library (ITIL) – Map ITIL processes into governance, business, applications, and
infrastructure processes; and categorize metrics
– Example, governance process metrics can be mapped to metrics of the ITIL Release Management process
• Business Process Execution Language (BPEL)– Measure and monitor BPEL-enabled processes and services according to
SOA ESMM reference architecture through the Business and Collaboration Monitoring Domain and the four monitoring planes
• Apply SOA ESMM reference architecture to Government and DoD programs participating in the enterprise computing transformation to net-centricity
– Example: Federated Development and Certification Environment (FDCE) program

Page 55
Key References
1. C.R. Clark and D.E. Schimmel, "Scalable Pattern Matching for high speed networks," Proc. IEEE Symposium on Field-Programmable Custom Computing Machines (FCCM), pp. 249-257, April 2004.
2. J. van Lunteren, "High-Performance Pattern-Matching for Intrusion Detection." Proc. of IEEE Infocom'06, Barcelona, Spain, April 23-29, 2006.
3. International Telecommunication Union, “Draft Recommendation X.805, Security Architecture for Systems Providing End-to-End Communications,” September 2003.
4. International Telecommunication Union, “Telecommunications, Recommendation M.3400, TMN Management Functions,” February 2000.
5. “Network Centric Operations Conceptual Framework,” Version 1.0, Evidence Based Research, Inc., November 2003.
6. W. Stallings, “ISDN & Broadband with Frame Relay & ATM,” 4th Edition, Prentice Hall, 1999.
7. “Information Technology – Open Systems Interconnection – Basic Reference Model: The Basic Model,” ISO/IEC 7498-1, Second edition, 1994-11-15, Ref. No. ISO.IEC 7498-1:1994(E).
8. Internet Engineering Task Force, “RTP Control Protocol Extended Reports (RTCP XR),” Standards Track RFC3830, November 2003.
9. K. Cabana, et al., “Enterprise Systems Engineering Theory and Practice,” Vol. 9: Enterprise Research and Development, MP05B0000043, ©2006 The MITRE Corp., Feb. 2006.
10. OASIS, “WSDM Management Using Web Services (MUWS 1.0),” Part 2, Draft, Dec. 2004
11. International Telecommunication Union, “Telecommunications, Recommendation M.3400, TMN Management Functions,” Feb. 2000.
12. IETF, RFC 2679, “A One-way Delay Metric for IPPM,” Sept. 1999.13. IETF, RFC 2681, “A Round-trip Delay Metric for IPPM,” Sept
1999.
14. N. Bieberstein, S. Bose, L. Walker, and A. Lynch, “Impact of Service-Oriented Architecture on Enterprise Systems, Organizational Structures, and Individuals,” IBM Systems Journal, Service-Oriented Architecture, Vol. 44, No. 4, 2005.
15. Roy W. Schulte and Yefim V. Natis, “Service Oriented Architecture,” Gartner, 12 Apr. 1996.
16. OASIS, “UDDI Version 3.0, UDDI Spec., Technical Committee Specification,” Jul. 2002.
17. TeleManagement Forum, SLA Management Handbook, GB 917-2, Apr. 2004.
18. D. Nadler, “SOA: How Does It Support My Business Processes?” Merlin, Inc., May 19, 2006.
19. K. Channabasavaiah, K. Holley, and E. Tuggle, Jr., “Migrating to a Service-Oriented Architecture, Part 2,” IBM Corp., 16 Dec. 2003.
20. ITIL - the Information Technology Infrastructure Library, Copyright ©1995-2003, ItilFoundations.com.
21. Business Process Execution Language for Web Services 2nd Edition, Packet Publishing Ltd, 2006.
22. M. Afshar; D. Shaffer; H. Hilderbrad; N. Kavantzas; and A. Surpur, “Process-Centric Realization of SOA, BPEL Moves Into the Limelight,” SOA World Magazine, Nov. 5, 2004, Copyright © 2007, SYS-CON Media.
23. “A Strategy for Managing the Development and Certification of Net-Centric Services within the Global Information Grid,” version 0.96, Defense Information Systems Agency, Sept. 27, 2005 (Unclassified).
24. P. Hershey, D. Runyon, and Y, Wang, “Metrics for End-To-End Monitoring of Enterprise System,” To Be Published Proc. of MILCOM 2007, Orlando, FL, Oct. 2007.
25. P. Hershey and D. Runyon, “SOA Monitoring for Enterprise Computing Systems,” Proc. of EDOC 2007, Annapolis, MD, Oct. 15-19, 2007.
26. P. Hershey, D. Runyon, and Y, Wang, “End-To-End Enterprise Monitoring Framework for NetOps,” Proc. of MILCOM 2006, Washington, DC, Oct. 25, 2006.

Page 56
Backup

Page 57
Example: SOA Information Exchange to Support Throughput ESMM
• Five functions to be monitored– Publish Service Function
• Measured at the discovery service using queries against the discovery service data store• Metrics include number of published services, publishing date, publisher, and service interface updates/upgrades
– Search Function• Service discovery
– Measured by log scanning the discovery service to track inquiries and follow-up activities– Metrics include rankings of similar services
• Content discovery– Measured by log scanning of the Enterprise Search Service– Metrics include tracking popular searches, number of results returned, and follow-up or related queries
– Post Content Function• Measured at the database that receives the post, or through the posting software• Metrics include number and size of posts per database, number of revisions, average age of posts, state of posts,
degree of collaboration (via links and associations)
– Stage Function • Measured at the cache or data destination • Associated metrics include frequency of data refreshes, sizes of data being staged, and durations of data transfers
– Subscribe Function• Measured at the discovery service • Use #1 function : accounts for subscriber data access to information that has been cached or staged in a beneficial
location in the network– Metrics include average number of content items served per minute, the number of bytes per second, the
number of requests per second, and the estimated bandwidth saving• Use #2 function: accounts for subscriber data access to a database where no staging is performed and is measured
at the data source– Metrics include frequency queries and volume of data returned