Measurement and Modeling of Eye-mouse Behavior … and Modeling of Eye-mouse Behavior in the...
11
Measurement and Modeling of Eye-mouse Behavior in the Presence of Nonlinear Page Layouts Vidhya Navalpakkam † LaDawn Jentzsch † Rory Sayres † Sujith Ravi † Amr Ahmed † Alex Smola †‡ † Google, Mountain View, CA {vidhyan,ladawn,sayres,sravi,amra}@google.com ‡ Carnegie Mellon University, Pittsburgh, PA [email protected] ABSTRACT As search pages are becoming increasingly complex, with images and nonlinear page layouts, understanding how users examine the page is important. We present a lab study on the effect of a rich informational panel to the right of the search result column, on eye and mouse behavior. Using eye and mouse data, we show that the flow of user attention on nonlinear page layouts is different from the widely be- lieved top-down linear examination order of search results. We further demonstrate that the mouse, like the eye, is sen- sitive to two key attributes of page elements – their position (layout), and their relevance to the user’s task. We identify mouse measures that are strongly correlated with eye move- ments, and develop models to predict user attention (eye gaze) from mouse activity. These findings show that mouse tracking can be used to infer user attention and information flow patterns on search pages. Potential applications include ranking, search page optimization, and UI evaluation. Categories and Subject Descriptors H.4.m [Informations Systems Applications]: Miscella- neous General Terms Design, Experimentation, Human Factors Keywords eye, mouse, web search, attention, measurement, prediction 1. INTRODUCTION A decade ago, search pages were simple, text only and contained a linear listing of documents. Today, search pages are increasingly complex, with interactive elements, images and text in multiple colors, font sizes, and varying inden- tation; they include new multi-column layouts, and contain various page elements drawn from news, images, documents, maps and facts. With multiple page elements competing for the user’s attention, and attention being a limited resource, understanding which page elements get more or less atten- Copyright is held by the International World Wide Web Conference Committee (IW3C2). IW3C2 reserves the right to provide a hyperlink to the author’s site if the Material is used in electronic media. WWW, ’13 ACM 978-1-4503-2035-1/13/05. tion is important, and has applications for ranking, search page optimization, and UI evaluation. Previous studies of attention on search pages focused on the linear page layout (containing a single column of search results) and showed a Golden Triangle [14] of user atten- tion 1 – where users pay most attention to the top-left of the page, and attention decreases as we move towards the right or bottom of the page. Related studies showed that users tend to scan the search page sequentially from top to bot- tom, giving rise to popular cascade models and their variants [6, 5]. Given that the search pages have become more com- plex since (both visually and content-wise), the question of whether the Golden Triangle and other previous findings on attention still hold is open. Eye tracking has been the favored methodology for study- ing user attention on the web [9, 8, 7, 2, 3, 20]. It offers rich details on user attention by sampling eye gaze positions every 20ms or more frequently, and providing fairly accu- rate estimates of user eye gaze (<0.5-1 ◦ error, just a few pix- els). On the flip side, commercial eye trackers are expensive ($15K upwards per piece), eye tracking is not scalable (typi- cally performed in the lab with 10-30 participants), and it is not clear to what extent findings from eye tracking studies in controlled lab settings can generalize to user attention in the wild. Recently, researchers have begun exploring whether a user’s mouse activity can provide approximations to where the user is looking on the search results page. Previous studies have shown reasonable correlations between the eye and mouse for linear page layouts 2 [22, 12, 15]. In this paper, we con- duct a lab study to test whether mouse tracks can be used to infer user attention on complex search pages with nonlinear page layouts. In particular, we test eye-mouse sensitivity to an element’s position on the search page, and its relevance to the user’s task. The main contributions of this paper are outlined below: 1. We present a lab study to test eye-mouse activity on linear search page layouts (containing one column of search results) and new nonlinear search page layouts 1 in this paper, we use the term “user attention” to refer to those aspects of users’ attention that can be measured by the eye. Note that attention itself is a more complex, cognitive process. 2 We ignore ads in this study, and focus only on search re- sults. Thus, linear layout here refers to a single column of search results.
Transcript of Measurement and Modeling of Eye-mouse Behavior … and Modeling of Eye-mouse Behavior in the...

Measurement and Modeling of Eye-mouse Behavior in thePresence of Nonlinear Page Layouts
Vidhya Navalpakkam† LaDawn Jentzsch† Rory Sayres†
Sujith Ravi† Amr Ahmed† Alex Smola†‡
†Google, Mountain View, CA{vidhyan,ladawn,sayres,sravi,amra}@google.com
‡Carnegie Mellon University, Pittsburgh, [email protected]
ABSTRACTAs search pages are becoming increasingly complex, withimages and nonlinear page layouts, understanding how usersexamine the page is important. We present a lab study onthe effect of a rich informational panel to the right of thesearch result column, on eye and mouse behavior. Using eyeand mouse data, we show that the flow of user attentionon nonlinear page layouts is different from the widely be-lieved top-down linear examination order of search results.We further demonstrate that the mouse, like the eye, is sen-sitive to two key attributes of page elements – their position(layout), and their relevance to the user’s task. We identifymouse measures that are strongly correlated with eye move-ments, and develop models to predict user attention (eyegaze) from mouse activity. These findings show that mousetracking can be used to infer user attention and informationflow patterns on search pages. Potential applications includeranking, search page optimization, and UI evaluation.
Categories and Subject DescriptorsH.4.m [Informations Systems Applications]: Miscella-neous
General TermsDesign, Experimentation, Human Factors
Keywordseye, mouse, web search, attention, measurement, prediction
1. INTRODUCTIONA decade ago, search pages were simple, text only and
contained a linear listing of documents. Today, search pagesare increasingly complex, with interactive elements, imagesand text in multiple colors, font sizes, and varying inden-tation; they include new multi-column layouts, and containvarious page elements drawn from news, images, documents,maps and facts. With multiple page elements competing forthe user’s attention, and attention being a limited resource,understanding which page elements get more or less atten-
Copyright is held by the International World Wide Web ConferenceCommittee (IW3C2). IW3C2 reserves the right to provide a hyperlinkto the author’s site if the Material is used in electronic media.WWW, ’13ACM 978-1-4503-2035-1/13/05.
tion is important, and has applications for ranking, searchpage optimization, and UI evaluation.
Previous studies of attention on search pages focused onthe linear page layout (containing a single column of searchresults) and showed a Golden Triangle [14] of user atten-tion1 – where users pay most attention to the top-left of thepage, and attention decreases as we move towards the rightor bottom of the page. Related studies showed that userstend to scan the search page sequentially from top to bot-tom, giving rise to popular cascade models and their variants[6, 5]. Given that the search pages have become more com-plex since (both visually and content-wise), the question ofwhether the Golden Triangle and other previous findings onattention still hold is open.
Eye tracking has been the favored methodology for study-ing user attention on the web [9, 8, 7, 2, 3, 20]. It offersrich details on user attention by sampling eye gaze positionsevery 20ms or more frequently, and providing fairly accu-rate estimates of user eye gaze (<0.5-1◦error, just a few pix-els). On the flip side, commercial eye trackers are expensive($15K upwards per piece), eye tracking is not scalable (typi-cally performed in the lab with 10-30 participants), and it isnot clear to what extent findings from eye tracking studiesin controlled lab settings can generalize to user attention inthe wild.
Recently, researchers have begun exploring whether a user’smouse activity can provide approximations to where the useris looking on the search results page. Previous studies haveshown reasonable correlations between the eye and mousefor linear page layouts2[22, 12, 15]. In this paper, we con-duct a lab study to test whether mouse tracks can be used toinfer user attention on complex search pages with nonlinearpage layouts. In particular, we test eye-mouse sensitivity toan element’s position on the search page, and its relevanceto the user’s task. The main contributions of this paper areoutlined below:
1. We present a lab study to test eye-mouse activity onlinear search page layouts (containing one column ofsearch results) and new nonlinear search page layouts
1in this paper, we use the term “user attention” to refer tothose aspects of users’ attention that can be measured by theeye. Note that attention itself is a more complex, cognitiveprocess.2We ignore ads in this study, and focus only on search re-sults. Thus, linear layout here refers to a single column ofsearch results.
(containing a rich informational panel on the top-rightof the page), and demonstrate that the mouse, like theeye, is sensitive to the element’s position on the searchpage in both layouts.
2. We demonstrate that both eye and mouse are sensitiveto the element’s relevance to the user’s task.
3. We identify mouse measures that are most correlatedwith eye gaze.
4. We develop models that predict users’ eye gaze reason-ably well from their mouse activity (67% accuracy inpredicting the fixated result element, with an error ofupto one element).
5. We conclude with limitations of mouse tracking andwhy it may be a weak proxy for eye tracking, but can-not substitute it.
2. RELATED WORK
2.1 Relationship of eye and mouse signalsThe relationship of eye and mouse movements have been
explored both in lab studies and at scale. Rodden and col-leagues [22] measured eye and mouse movements of 32 usersperforming search tasks in a lab setting. They identifiedmultiple patterns of eye-mouse coordination, including themouse following the eye in the x and y directions, markinga result, and remaining stationary while the eye inspectedresults. They found a general coordination between eye andmouse position, where the distribution of eye/mouse dis-tances centered close to 0 pixels in both x and y directions.
Huang et al [15] extended these findings by examiningvariations in eye-mouse distance over time. They found thateye-mouse distances peaked around 600 ms after page loadand decreased over time, and that the mouse tended to laggaze by ≈700 ms on average. They classified cursor behav-iors into discrete patterns – Inactive, Reading, Action, andExamining – and measured sizeable differences in mouse-cursor position and time spent engaging in different behav-iors.
Because mouse-position signals can be collected at scalemore readily than eye movements, recent work has focusedon relating large-scale mouse signals to eye movements. Oneapproach proposed by Lagun and Agichtein (“ViewSer”; [18])involves presenting a search result page in which all elementsare spatially blurred except the result containing the mousecursor. The resulting patterns of mouse movement acrossresults were found to correlate with eye tracking results ob-tained in a lab setting for the same queries.
Other work from Huang, Buscher and colleagues [17, 16, 4]compare eye and mouse tracking results from lab studies tolarge-scale logs data from a search engine, deployed both in-ternally [17] and on an external sample of users [16, 4]. Thiswork demonstrated that mouse-based data can be used toevaluate search result relevance, distinguish cases of “good”(user need-satisfying) and“bad”abandonment on web pages,and identify clusters of distinct search task strategies.
2.2 Predictive modelsSeveral studies have developed predictive models of user
attention, searcher behavior, or both, based on mouse data.Guo and Agichtein [10] collected mouse-movement data fromsearches at a university library, and were able to discrimi-nate navigational from informational task intent. The au-thors also built a binary classifier to distinguish whether the
mouse was within a specified radius from the eye (variedfrom 100 to 200 pixels), and showed that this model out-performed a simple baseline model which always guessedthe majority category [12]. Huang et al [15] used eye andmouse movement data from a lab study to fit eye positionsusing a linear model based on extracted mouse interactionfeatures. Their model demonstrated an improved eye gazeprediction (decreased RMS error in mouse-cursor distancein each direction, and Euclidean distance) over mouse dataalone.
Mouse behavior has been used to model patterns of usersearch goals and strategies. Huang et al [16] incorporatedmouse data from search logs into a Dynamic Bayesian Net-work model of searcher activity, using the positions of resultsthat were hovered over but not clicked to provide a more ro-bust measure of which results were evaluated. The searchermodel incorporating these signals performed better (lowerclick perplexity metrics, measuring unexpected click pat-terns) than models without the signals. Guo and Agichtein[11] used mouse movements to classify hidden states repre-senting searchers’ search goals (researching versus conduct-ing a purchase) or ad receptiveness (likely or unlikely to clickon a relevant ad) and tested the performance of their modelagainst data extracted from a user study, and user-provideddata from a library system. The authors also developeda model of document relevance based on a combination ofmouse activity on the search result page, and on subsequentpost-search pages [13].
2.3 Differences from our workTo summarize, previous research on attention and eye-
mouse behavior in search focused on linear page layouts con-taining a single column of search results, and demonstratedmouse sensitivity to position on page. Our work differs fromprevious work in at least 3 ways: 1) In addition to linearpage layouts, we explore nonlinear 2-column results layouts,with a rich information panel on the right hand side of thepage; 2) Apart from position on page, we test whether themouse is sensitive to important factors such as element’s rel-evance to user’s task; 3) We systematically compare varioususer-specific, global and hybrid models for predicting usereye gaze based on mouse signals.
3. EXPERIMENT DESIGNWe recruited 31 participants (15 male and 16 female; age
range 18-65, with a variety of occupations and self-reportedweb search expertise). Data from 5 participants was ex-cluded due to calibration problems with the eye tracker.
Participants were given 4 warm-up tasks to familiarizethemselves with the testing procedure. They were thenasked to describe all of the elements of the search resultspage to ensure they were aware of all elements on the page,including the relatively new Knowledge Graph (KG) resultsfeature on the top-right of the page.3 For example, a queryon an entity such as a famous celebrity or place triggers aresult page with an informational panel (KG) on the righthand side, containing images and facts about that entity.
Participants were provided a list of 24 search tasks. Eachtask was accompanied by a link to the search results pagewith a prespecified query (to ensure that all particpants saw
3http://googleblog.blogspot.com/2012/05/introducing-knowledge-graph-things-not.html
the same page). For consistency in results sets across users,users could not change the queries. Blocks of images andadvertisements were suppressed on the results pages.
We used a 2 x 2 within subject design with two factors:(1) KG present or absent, (2) KG relevant or irrelevant tothe user’s task. We varied task relevance of KG by design-ing 2 tasks for the same query, one for which the answerwas present in KG (e.g., ”find the names of Julia Robert’schildren”) and another for which the answer was present inweb results, but not KG (e.g. ”what does People magazinesay about Julia Roberts?”). Each user performed an equalnumber of tasks with KG present and absent, as well as withKG relevant and irrelevant. The order of tasks, KG pres-ence, and KG task relevance were all randomized within andacross users. 4
For the purposes for this study, we injected custom javascriptin search results pages to log mouse activity on search pageas users performed their search tasks. In particular, welogged the browser viewport, and sampled mouse x,y posi-tions every 20ms during mouse movements. Eye tracks weresimultaneously recorded using a Tobii TX300 eye trackerwith 300 Hz tracking frequency and an accuracy of 0.5◦ vi-sual angle on a 23”monitor (1880 x 1000 browser size). Botheye and mouse tracks were recorded with an origin at thetop-left of the document.
We considered data upto the first click on the search page,or until the user terminated the task (by clicking the back-button to revisit the task list). Raw eye and mouse trackswere of the form: <user, task, timestamp, x, y>. The raweye data was parsed to obtain a sequence of fixations (briefpauses in eye position for around 200-500ms) and saccades(sudden jumps in eye position) using standard algorithms[21, 23]. Eye fixations and their duration are thought to in-dicate attention and information processing [8]. Thus, oursubsequent analysis is performed using eye fixations data.We aligned eye fixation and mouse data using time frompage load. Since eye fixations occur every 200-500ms, whilemouse movements were logged every 20ms, we aligned themper user, task by assigning the most recently fixated eyeposition to each mouse event.
4. RESULTS
4.1 Correlations in pixel spaceTo test eye-mouse correlations in pixel space, we extract
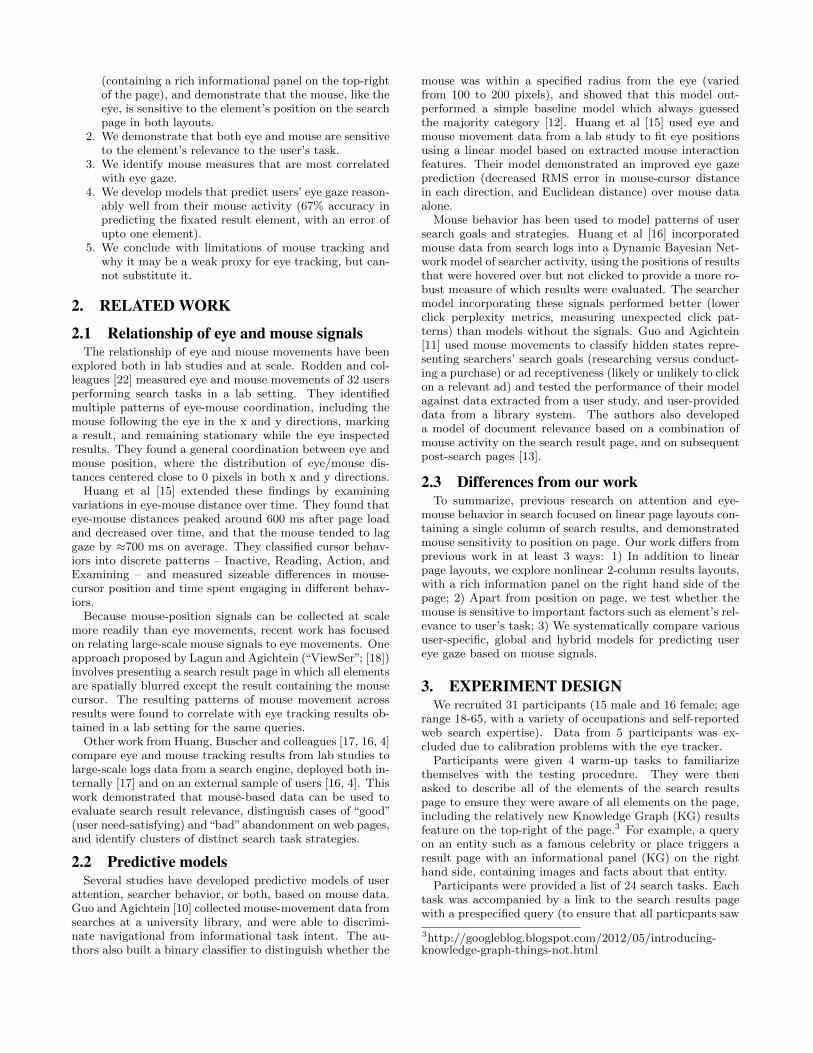
the following measures per user, per task: x,y positions ofeye and mouse, maximum x, maximum y, minimum x, andminimum y. The scatter plot in figure 1 shows that the max-imum y position shows reasonable correlation (r2=0.44).Other pixel measures such as instantaneous x,y positionsof eye-mouse, or minimum x, maximum x, and minimum yshow poor correlation between eye and mouse (r2<0.05).
4.2 Correlations in Area-of-Interest spaceThe pixel-level measures described above include eye-mouse
activity in white space, and other elements that are not webresults (e.g., search bar, navigation menu). Since we mainlycare about which result element the user is looking at, we
4Another example of a query from the study, along withtasks are: For search [hope floats]: ”Who directed the movie’Hope Floats’” (answer in KG); ”What does the Hope Floatswellness center do?” (answer not in KG)
Figure 1: Eye and mouse show correlations in themaximum cursor distance along the vertical axis (y).Each point in the scatter plot denotes a user, taskcombination.
proceed to analyze the data by defining meaningful areas-of-interest on the search page. We divide the page into Knowl-edge Graph results (KG), and divide result elements into3 roughly equal-sized parts (so that their size is similar toKG): Top 3 results (top), middle 3 results (mid), bottom4 results (bot). In addition, we consider the left naviga-tion menu (left), and group everything else under miscella-neous (misc). Thus, we define 6 areas-of-interest (AoI). Thebounding boxes of these AoIs are illustrated in Figure 3,which shows a heatmap visualization of user eye gaze whenKG is present and absent.
To analyze the data quantitatively, for each AoI, we ex-tract the following mouse measures: 1) #mouse hovers orvisits to the AoI, 2) time to first mouse visit on the AoI(in milliseconds), 3) dwell time (in milliseconds) per mouseposition within the AoI, 4) total mouse dwell time (in mil-liseconds) in the AoI, 5) fraction of page dwell on AoI, 6)fraction of tasks where the last mouse position occurs withinthe AoI. We also extract corresponding measures for the eye.
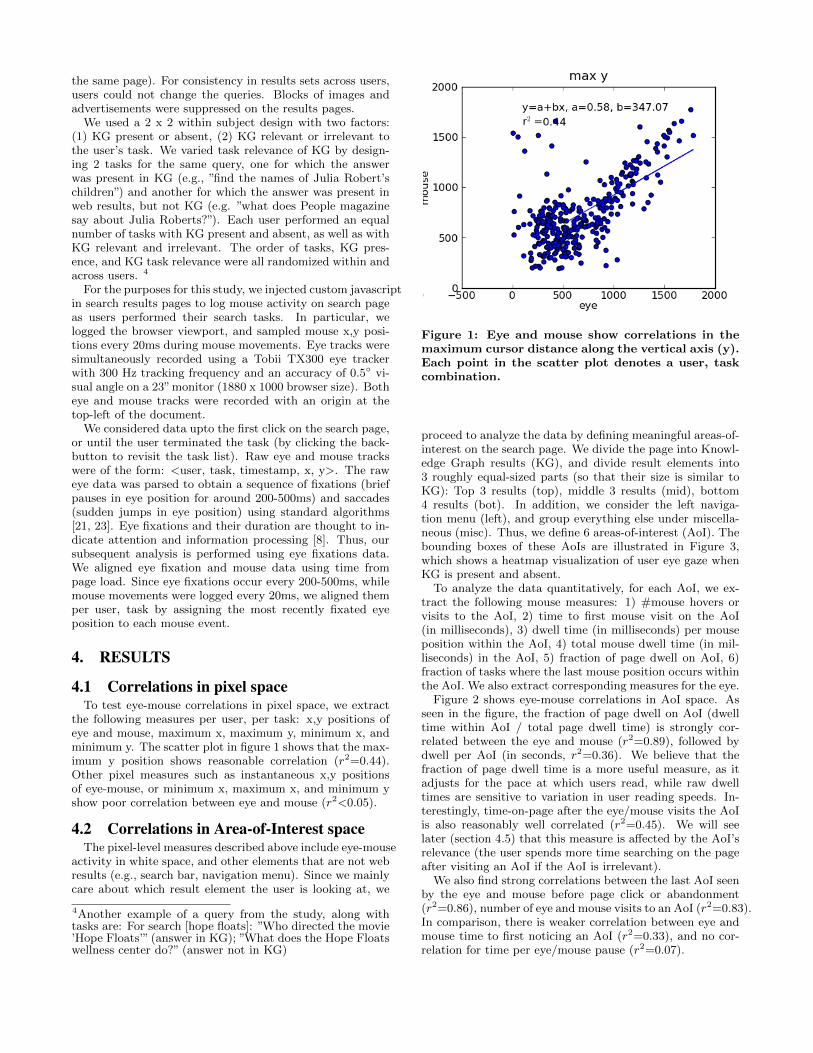
Figure 2 shows eye-mouse correlations in AoI space. Asseen in the figure, the fraction of page dwell on AoI (dwelltime within AoI / total page dwell time) is strongly cor-related between the eye and mouse (r2=0.89), followed bydwell per AoI (in seconds, r2=0.36). We believe that thefraction of page dwell time is a more useful measure, as itadjusts for the pace at which users read, while raw dwelltimes are sensitive to variation in user reading speeds. In-terestingly, time-on-page after the eye/mouse visits the AoIis also reasonably well correlated (r2=0.45). We will seelater (section 4.5) that this measure is affected by the AoI’srelevance (the user spends more time searching on the pageafter visiting an AoI if the AoI is irrelevant).
We also find strong correlations between the last AoI seenby the eye and mouse before page click or abandonment(r2=0.86), number of eye and mouse visits to an AoI (r2=0.83).In comparison, there is weaker correlation between eye andmouse time to first noticing an AoI (r2=0.33), and no cor-relation for time per eye/mouse pause (r2=0.07).
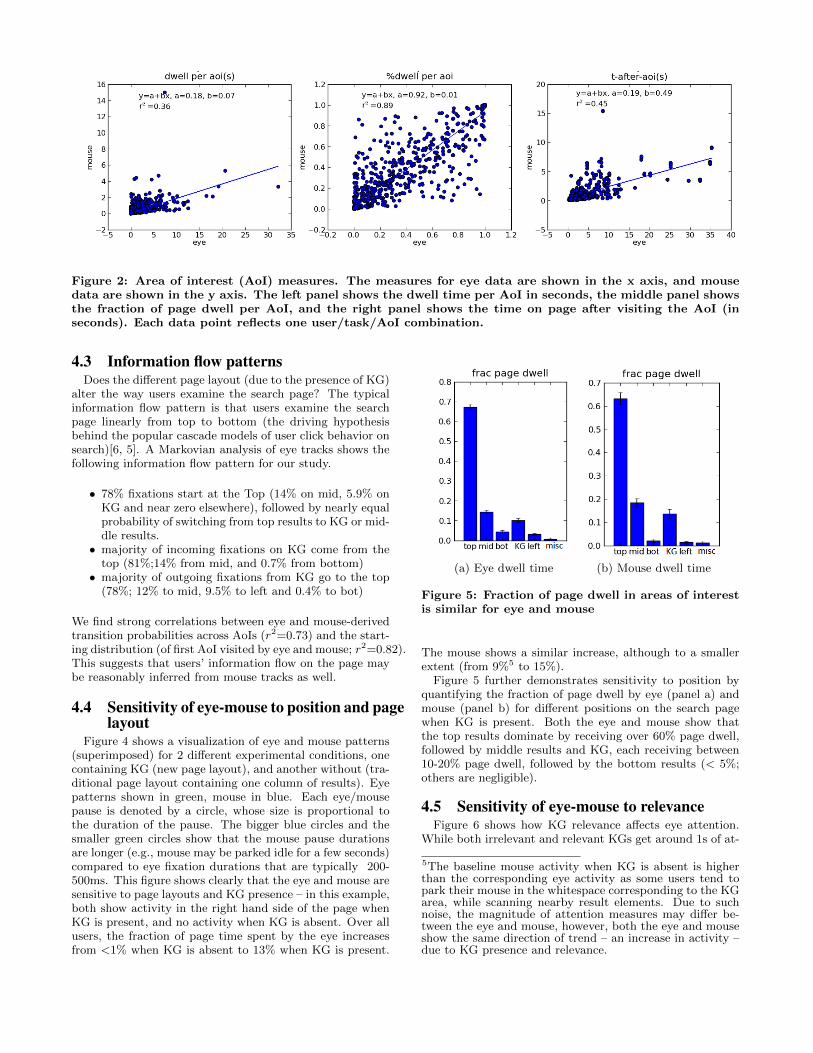
Figure 2: Area of interest (AoI) measures. The measures for eye data are shown in the x axis, and mousedata are shown in the y axis. The left panel shows the dwell time per AoI in seconds, the middle panel showsthe fraction of page dwell per AoI, and the right panel shows the time on page after visiting the AoI (inseconds). Each data point reflects one user/task/AoI combination.
4.3 Information flow patternsDoes the different page layout (due to the presence of KG)
alter the way users examine the search page? The typicalinformation flow pattern is that users examine the searchpage linearly from top to bottom (the driving hypothesisbehind the popular cascade models of user click behavior onsearch)[6, 5]. A Markovian analysis of eye tracks shows thefollowing information flow pattern for our study.
• 78% fixations start at the Top (14% on mid, 5.9% onKG and near zero elsewhere), followed by nearly equalprobability of switching from top results to KG or mid-dle results.• majority of incoming fixations on KG come from the
top (81%;14% from mid, and 0.7% from bottom)• majority of outgoing fixations from KG go to the top
(78%; 12% to mid, 9.5% to left and 0.4% to bot)
We find strong correlations between eye and mouse-derivedtransition probabilities across AoIs (r2=0.73) and the start-ing distribution (of first AoI visited by eye and mouse; r2=0.82).This suggests that users’ information flow on the page maybe reasonably inferred from mouse tracks as well.
4.4 Sensitivity of eye-mouse to position and pagelayout
Figure 4 shows a visualization of eye and mouse patterns(superimposed) for 2 different experimental conditions, onecontaining KG (new page layout), and another without (tra-ditional page layout containing one column of results). Eyepatterns shown in green, mouse in blue. Each eye/mousepause is denoted by a circle, whose size is proportional tothe duration of the pause. The bigger blue circles and thesmaller green circles show that the mouse pause durationsare longer (e.g., mouse may be parked idle for a few seconds)compared to eye fixation durations that are typically 200-500ms. This figure shows clearly that the eye and mouse aresensitive to page layouts and KG presence – in this example,both show activity in the right hand side of the page whenKG is present, and no activity when KG is absent. Over allusers, the fraction of page time spent by the eye increasesfrom <1% when KG is absent to 13% when KG is present.
(a) Eye dwell time (b) Mouse dwell time
Figure 5: Fraction of page dwell in areas of interestis similar for eye and mouse
The mouse shows a similar increase, although to a smallerextent (from 9%5 to 15%).
Figure 5 further demonstrates sensitivity to position byquantifying the fraction of page dwell by eye (panel a) andmouse (panel b) for different positions on the search pagewhen KG is present. Both the eye and mouse show thatthe top results dominate by receiving over 60% page dwell,followed by middle results and KG, each receiving between10-20% page dwell, followed by the bottom results (< 5%;others are negligible).
4.5 Sensitivity of eye-mouse to relevanceFigure 6 shows how KG relevance affects eye attention.
While both irrelevant and relevant KGs get around 1s of at-
5The baseline mouse activity when KG is absent is higherthan the corresponding eye activity as some users tend topark their mouse in the whitespace corresponding to the KGarea, while scanning nearby result elements. Due to suchnoise, the magnitude of attention measures may differ be-tween the eye and mouse, however, both the eye and mouseshow the same direction of trend – an increase in activity –due to KG presence and relevance.

Figure 3: Effect of KG presence on eye gaze heatmaps. Red hotspots indicate where the user spent mosttime looking. The left panel shows a heatmap of user eye gaze when KG is absent (the shape resembles aGolden Triangle focused on top-left of the page). The right panel shows the corresponding heatmap whenKG is present. The search pages have the page areas of interest (AoIs) outlined, and regions outside AoIsdimmed. For the actual result pages presented to users, the AoIs were not visually marked in this way. Notethe increased activity near KG, suggesting a potential second Golden Triangle focused on KG.
tention, there are significant differences in other measures:irrelevant KGs slow down the user by 3.5-4s on average (timeon page and time on task increase), while relevant KGs speedup the user by around 4s on average (users spend 2-2.5s lesson each of the top and mid as the answer is found in KG).Thus, relevant KGs get a higher fraction of page dwell (18%)than irrelevant KGs (8%), and search terminates faster onaverage after the user visits a relevant KG compared to anirrelevant KG (0.9 vs 2.8s). Clearly, task relevance is animportant factor affecting user attention and task perfor-mance.
We tested whether mouse activity is sensitive to changesin relevance. We observe similar trends as the eye, but to asmaller extent. Like the eye, the mouse shows that relevantKGs get a higher fraction of page dwell (17%) compared toirrelevant KGs (12%), and search terminates faster on aver-age after the user visits a relevant KG compared to an irrele-vant KG (2.9 vs 6.4s). Figure 7a shows sample mouse trackswhen KG is relevant – in this example, the task is “when wasthe sequel to Toy Story released?”, we find that the user findsthe answer in KG, hence search terminates soon after uservisits KG. Figure 7b shows sample mouse tracks when KGis irrelevant – in this example, the task is “find more aboutthe Let’s Move program by Michelle Obama”, we find thatthe user visits KG, and continues searching on the rest ofthe page 6. Thus, mouse activity, like eye gaze, is sensitiveto relevance.
6The figure shows two different queries to illustrate moreexamples of pages with KGs. However, for analysis, we usedthe same set of queries to compare KG-relevant and KG-irrelevant conditions.
5. PREDICTING EYE FROM MOUSEGiven the observed correlations between eye and mouse ac-tivity in some measures, we are motivated to ask the follow-ing questions:
• How well can we predict eye gaze from mouse activity?• Can we achieve higher accuracy by predicting elements
of interest on the screen rather than estimating theexact eye gaze coordinates?• To what extent is the relationship between eye gaze
and mouse position user-specific and how far can wegeneralize to unseen users?
To answer these questions we developed a set of regressionand classification models to predict the exact coordinatesof the eye gaze and the element of interest on the page,respectively. Before describing these models in detail weneed a formal definition of our learning problem: We dividedthe set of eye-mouse readings into a set of points, where eachpoint di = (yi, ei,vi) represents the eye gaze coordinates yi,a corresponding element of interest on the page ei, and acovariate vector vi comprising of a set of mouse features. Welet Du = {du1 , · · · , dunu
} be the set of nu points pertaining
to user u, and we let D = {D1, · · · , DU} be the set of alldata points across all U users.
5.1 Regression to predict the eye positionAs a first step consider the problem of estimating the y-
coordinate of eye-gaze directly from mouse activity7. This
7Predicting the y coordinate of eye gaze is more interestingthan the x coordinate, as it can reveal which result element

Figure 4: Examples of eye (green) and mouse (blue) tracks when KG is present (left) and absent (right)
Figure 6: Effect of KG relevance on eye. Considerthe left panel. The x axis shows the AoIs, and they axis shows, for each AoI, the difference in atten-tion (in seconds) when KG is present and relevantvs. when KG is absent (mean ± standard error).Right panel shows the corresponding plot for irrel-evant KG.
is a regression problem where we seek to find a functionf : v → y such that the discrepancy between f(v) and theobserved eye position y is minimized.
In the following we use a (generalized) linear model to rep-resent the mapping from attributes to eye positions. Thatis, we seek to learn a regression function
f(v) = 〈w, φ(vi)〉
Here f is parametrized by a weight vector w that we seekto estimate. When φ(vi) = vi we end up with a linearregression function in the input covariate space vi. When
the user is looking at. Thus we focus on y coordinate in thispaper.
φ(vi) comprises a nonlinear mapping, we obtain a nonlinearfunction in the input covariate space.
To assess the impact of a personalized model we comparethe following three models: a global model that estimatesthe parameter w common for all users. Secondly we infera user-specific model that provides an upper bound of howaccurately the model can estimate eye positions from mouseactivity. Finally, we infer a hybrid model that combinesglobal and user-specific components. This allows us to dis-sociate both parts, thus allowing us to generalize to userswhere only mouse movements are available while obtaininga more specific model whenever eye tracking is possible. Wedescribe these three approaches below:
Global model: In this setup we learn a global regressionfunction fg parametrized by a global weight vector wg.The learning goal is to find wg that minimize the av-erage prediction error on the whole dataset. More for-mally, our learning problem for the y-coordinate is:
minimizewg
∑di∈D
‖yi − 〈wg, φ(vi)〉‖22 + λ ‖wg‖22
where λ is a regularization parameter to prevent over-fitting. This model tests the hypothesis that eye-mousecorrelation is a global phenomenon and does not de-pend on the specific user behaviour.
User-specific models: In this setup we learn regressionfunctions fu independently for each user u. The learn-ing problem for the y-coordinate is:
minimizewu
∑di∈D
‖yui − 〈wu, φ(vui )〉‖22 + λ ‖wu‖22
This model tests the hypothesis that eye-mouse corre-lation is NOT a global phenomenon and depends onthe specific user behaviour.
Hierarchical model: In this setup we still learn a per-user regression model, however we decompose eachuser-specific regression weight additively into a user-dependent part wu and a global part wg. More for-
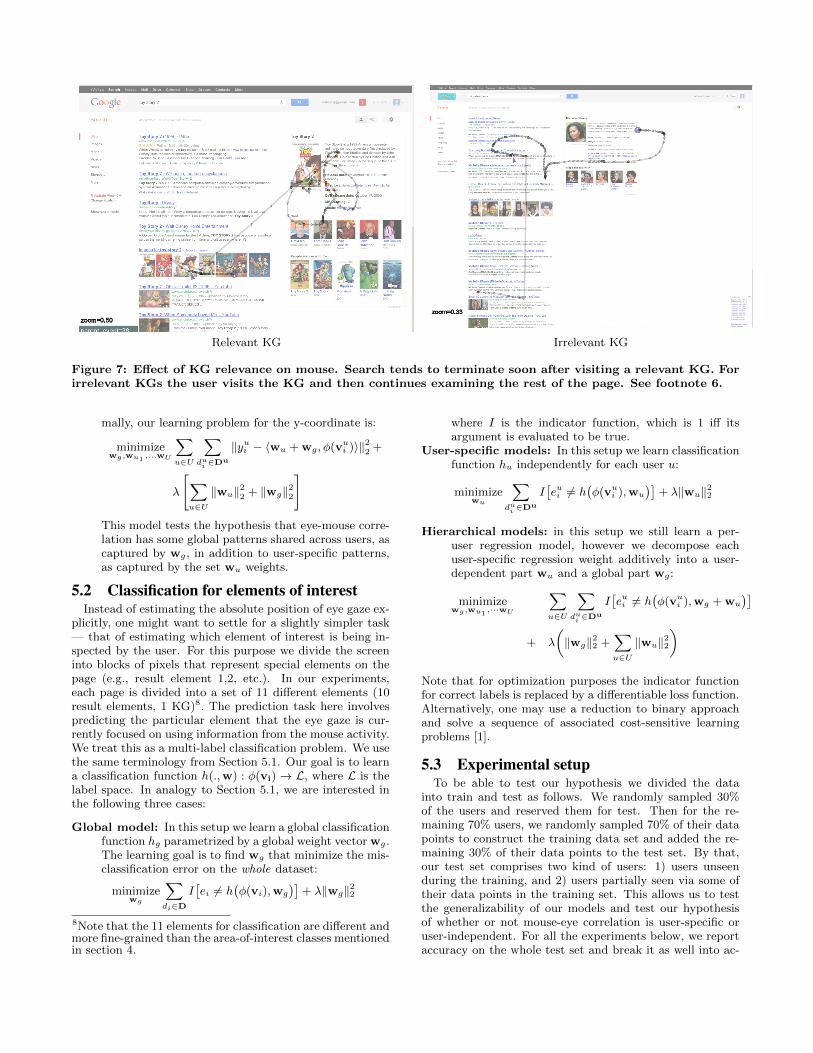
Relevant KG Irrelevant KG
Figure 7: Effect of KG relevance on mouse. Search tends to terminate soon after visiting a relevant KG. Forirrelevant KGs the user visits the KG and then continues examining the rest of the page. See footnote 6.
mally, our learning problem for the y-coordinate is:
minimizewg,wu1
,...wU
∑u∈U
∑dui ∈D
u
‖yui − 〈wu + wg, φ(vui )〉‖22 +
λ
[∑u∈U
‖wu‖22 + ‖wg‖22
]This model tests the hypothesis that eye-mouse corre-lation has some global patterns shared across users, ascaptured by wg, in addition to user-specific patterns,as captured by the set wu weights.
5.2 Classification for elements of interestInstead of estimating the absolute position of eye gaze ex-
plicitly, one might want to settle for a slightly simpler task— that of estimating which element of interest is being in-spected by the user. For this purpose we divide the screeninto blocks of pixels that represent special elements on thepage (e.g., result element 1,2, etc.). In our experiments,each page is divided into a set of 11 different elements (10result elements, 1 KG)8. The prediction task here involvespredicting the particular element that the eye gaze is cur-rently focused on using information from the mouse activity.We treat this as a multi-label classification problem. We usethe same terminology from Section 5.1. Our goal is to learna classification function h(.,w) : φ(vi)→ L, where L is thelabel space. In analogy to Section 5.1, we are interested inthe following three cases:
Global model: In this setup we learn a global classificationfunction hg parametrized by a global weight vector wg.The learning goal is to find wg that minimize the mis-classification error on the whole dataset:
minimizewg
∑di∈D
I[ei 6= h
(φ(vi),wg
)]+ λ‖wg‖22
8Note that the 11 elements for classification are different andmore fine-grained than the area-of-interest classes mentionedin section 4.
where I is the indicator function, which is 1 iff itsargument is evaluated to be true.
User-specific models: In this setup we learn classificationfunction hu independently for each user u:
minimizewu
∑dui ∈D
u
I[eui 6= h
(φ(vu
i ),wu
)]+ λ‖wu‖22
Hierarchical models: in this setup we still learn a per-user regression model, however we decompose eachuser-specific regression weight additively into a user-dependent part wu and a global part wg:
minimizewg,wu1
,···wU
∑u∈U
∑dui ∈D
u
I[eui 6= h
(φ(vu
i ),wg + wu
)]+ λ
(‖wg‖22 +
∑u∈U
‖wu‖22)
Note that for optimization purposes the indicator functionfor correct labels is replaced by a differentiable loss function.Alternatively, one may use a reduction to binary approachand solve a sequence of associated cost-sensitive learningproblems [1].
5.3 Experimental setupTo be able to test our hypothesis we divided the data
into train and test as follows. We randomly sampled 30%of the users and reserved them for test. Then for the re-maining 70% users, we randomly sampled 70% of their datapoints to construct the training data set and added the re-maining 30% of their data points to the test set. By that,our test set comprises two kind of users: 1) users unseenduring the training, and 2) users partially seen via some oftheir data points in the training set. This allows us to testthe generalizability of our models and test our hypothesisof whether or not mouse-eye correlation is user-specific oruser-independent. For all the experiments below, we reportaccuracy on the whole test set and break it as well into ac-

(a) (b)
Figure 8: Examples of eye-mouse time course in the y direction. y axis shows the vertical position of eye(green) and mouse (blue) (0 is page-top, and increasing values represent further down the page), and xaxis shows time in centiseconds (multiply by 10 to get time in milliseconds). The size of the blue blobs isproportional to the duration of mouse pause at that position. In the example on the left, the mouse is initiallyparked for around 20 seconds, while the eye examines the nearby elements carefully. The mouse then jumpsforward, and then on, correlates better with the eye (task was “Describe the Mozart programming system”).The example on the right shows that the mouse follows eye gaze (with a lag) as the user looks up and downthe search page (task was “Describe the koala library for facebook”).
curacy on seen user and accuracy on unseen users. 9 Weperform prediction as follows based on the model:
Global models: We use the same weight vector wg onboth seen and unseen users.
User-specific models: If the user was seen before we usehis own specific weight wu. For this model, we do notreport results over unseen users.
Hierarchical models: If the user was seen before we usewg + wu, otherwise we use wg.
We use the following information from mouse activity asfeatures in our prediction models for each time point t:
1. Time from page load (t)2. Cursor Position (xt,yt)3. Cursor Velocity: magnitude (vxt, vyt), and direction
(sxt, syt)4. Cursor Distance moved (dxt, dyt)5. Area-of-interest in which cursor lies (aoit)6. Corresponding page element (elmt)
In addition to computing these features at time t, we con-sider past and future values of features 2-4. e.g., we considerthe future cursor positions, average future velocities, totalcursor distance moved, and number of changes in mousemovement direction for time windows [t, t + k] where k ∈{1, 2, 4, 8, 16}; similarly for the past. This gives us a total of83 features by the above phase space embedding.
5.4 Eye Prediction ResultsNext, we show results from various prediction models on
different corpora under the various task settings described
9For seen users, it is possible that adjacent data points fromthe same user may end up being split across the train andtest datasets. However, all the methods compared here areprovided with identical train/test distributions and thereforethis does not introduce bias for any particular method. Inaddition (as mentioned earlier), we also report results whenpredicting on test data from completely unseen users thatdo not overlap with the train dataset.
above. Following Huang et al. [15], we use a baseline modelwhich predicts that the eye gaze is focused exactly at themouse position. We use two feature map functions φ(v):linear where φ(v) = v and nonlinear mapping using Nys-trom approximation for Gaussian RBF kernels [24].
Denote by k(v,v′) = exp(−γ ‖v − v′‖2) a Gaussian RBFkernel as it is commonly used in kernel methods. Then thiskernel can be approximated by the following feature map:
k(v,v′) =⟨φ(v), φ(v′)
⟩where
φ(v) = K− 1
2nn [k(v1,v), . . . , k(vn,v)]
Here v1, . . . ,vn are 1,000 random observations and Knn isan n × n matrix obtained by forming the inner products[Knn]ij = k(vi,vj). The advantage of the mapping φ(v) isthat it can be used to learn a linear function in the trans-formed feature space that is equivalent to learning a non-linear function in the input space. That is, in both cases weemploy the VW package [19] to solve all the optimizationproblems.
Results are shown in Table 1. We draw the followingconclusions:
• The observed mouse-eye correlation function is highlynonlinear and that is why nonlinear models outper-formed their linear counterparts especially in classifi-cation settings. For example, the best results achievedon unseen users using nonlinear features is 62.3% pre-diction error compared to 80.7% error for the linearcounterpart (which amounts to 23% reduction in clas-sification error). This is a natural consequence of thefact that we need to specify nonlinear boundaries inorder to distinguish between different blocks in the re-sult set. Here nonlinear basis functions are much moreadvantageous.• Our best model (nonlinear hierarchical) provides a 24.3%
improvement over the baseline (in RMSEy for pixelspace). In comparison, the best model from Huang et

al[15] achieved an improvement of 10.4% over the samebaseline.10
• The observed mouse-eye correlation function is clearlyuser-dependent because users exhibit different patternswhile navigating the page (for example some users tendto align the mouse with their gaze as their attentionshifts around the page, so called mouse readers). Fromour results, it is clear that the user-specific modelsoverwhelmingly outperform all other models.• While building a user-specific model is advised when-
ever abundant training data is available from individ-ual users, it is not a scalable approach. We hypothe-sized that hierarchical models would help in general-izing eye-gaze prediction to unseen users. As evidentfrom our experiments using a simple additive hierar-chical model, the results over unseen users slightly im-proved compared to the global models. The reasonis that additive models separate user-specific patterns(via the wu weight vector) from global patterns sharedacross users (captured via the wg vector) which arethen used in predicting eye-gaze from mouse activityover unseen users. We believe that this is a promisingdirection and we plan to investigate further into usingmore advanced transfer learning approaches for trans-ferring eye-mouse patterns from seen users to unseenusers.• Note that at a first glance, the total classification error
over seen and unseen users from our best model seemsrather high (nonlinear hierarchical, 60.3% error). How-ever, this impression is misleading: firstly, it amountsto a 14.8% reduction over its counterpart in the base-line (70.8%), and the error reduction is bigger (28%)for user-specific models on seen users. Secondly, thecurrent method of computing error penalizes adjacentelements as much as far away page elements, leadingto high values of error (for example, predicting thatthe user is looking at search result 1 while the groundtruth is that he is looking at search result 2 wouldresult in the same classification error as between re-sults 1 and 10). A cost sensitive loss function takingthe page layout into account could be used to addressthis issue. Indeed, we find that the result elementswere mostly confused with adjacent result elements,and KG was confused with the first result element. Ifwe ignore errors due to adjacent elements on the page,the total classifier error drops dramatically from 60.3%to 33.1% (nearly halved). For example, the error forthe first result element drops from 23 to 12% (91% ofthis error reduction was from ignoring result 1-2 con-fusion), the error for the second element drops from 79to 8% (97% error reduction was from ignoring result2-1, 2-3 confusion), the error for KG drops from 60 to12% (75% error reduction was from ignoring KG-result1 confusion). To summarize, these results suggest thatthe nonlinear hierarchical model can predict the result
10Huang et al. report results using a slightly different set offeatures which makes a direct comparison difficult for thisparticular study. However, we use the same baseline methodas theirs and although the feature sets may differ, our globallinear model simulates their method. The results presentedin this paper indicate that our best approach clearly outper-forms these methods and yields a significant improvement inprediction performance for different test settings.
element that the user is looking at (with an error ofupto one element) at reasonably high accuracy (67%)from mouse tracks only.
6. DISCUSSIONIn this paper, we demonstrate through carefully designed
experiments in the lab that the mouse, like the eye, is sensi-tive to two key attributes of page elements – their positionon the page, and their relevance to the user’s task. Using a2x2 within subject design, we systematically varied the pagelayout (2 column content layout – KG present on the top-right of the page, vs. linear 1 column content layout withweb results only and KG absent), and relevance (KG eitherrelevant or not to user task). Eye and mouse tracks wererecorded simultaneously as users performed the tasks. Wediscuss the key findings and potential applications.
6.1 Mouse tracking aids layout analysisOur analysis shows that the eye and mouse are strongly
correlated in some measures such as: 1) fraction of page timespent within the area-of-interest, 2) last area-of-interest vis-ited before user clicks/abandons, and 3) transition proba-bilities between areas of interest. The first measure is par-ticularly interesting as it is sensitive to both the positionand relevance of an AoI: comparing different experimentalconditions, we observe that like the eye, the fraction of pagetime on KG as measured by the mouse, is higher when KGis present vs. absent, and higher when KG is relevant vs.irrelevant. In addition, we find that the page time afterthe mouse visits KG is shorter when KG is relevant thanwhen it is irrelevant, suggesting that users terminate searchfaster after visiting a relevant KG. Together, these mousemeasures can provide useful signals about user attention to,and task relevance of, page elements even in the absence ofclicks. Potential applications of tracking these mouse mea-sures at scale include ranking, search page optimization andUI evaluation.
The second finding of strong eye-mouse correlations inthe last area-of-interest visited before click/abandonment isconsistent with Huang et al’s finding that eye and mouse arestrongly correlated at the time of click (user’s decision) thanat the beginning of the task (where users tend to explore thepage).
As search pages become increasingly complex (visuallyand content-wise), understanding how users consume thepage, or how information flows through the search page isan important question that has applications for ranking andimproving user satisfaction (by providing the high qualityanswers where they are most likely to look at). For ex-ample, in linear page layouts containing a single column ofsearch results, the dominant flow pattern is that users scanthe page from top to bottom. The corresponding eye gazeheatmaps resemble a Golden triangle with more attentionbeing paid to the top-left of the page, and decreasing atten-tion towards the right or bottom of the page. In contrast,in the new page layout containing 2 columns (one column ofsearch results, and a second column with visually attractivecontent on the top right of the page corresponding to theKnowledge Graph results), we find that while majority ofthe users start by viewing the top search results, as a nextstep, they are equally likely to see the KG on the right, ormiddle results below. The corresponding eye gaze heatmapsin Figure 3 have 2 Golden triangles, one focused at the top-

Model RMSEy (pixels) Classification Error (%)Total Seen users unseen users Total Seen users unseen users
Baseline mouse position 270.1 276.9 263.9 70.8 72.0 69.7
Linear Global 218.2 217.0 219.3 77.3 72.4 81.6Hierarchical 216.5 215.1 218.2 76.0 71.9 80.7User-specific – 193.8 – – 55.9 –
Nonlinear Global 211.7 210.0 213.2 63.9 64.8 63.0Hierarchical 204.5 201.3 207.5 60.3 58.7 62.3User-specific – 179.7 – – 51.8 –
Table 1: Comparison of models for predicting eye gaze from mouse activity. Size of training data mtrain = 20788,test data mtest = 19000 (comprised of 8899 points from previously seen users and 10101 points from new users).Our best model (nonlinear hierarchical) provides a 24.3% improvement over the baseline (in pixel space) and14.8% improvement in element space.
left of the search results, and a new triangle focused at thetop-left of the KG. Our finding of eye-mouse correlationsfor the starting distribution (first area-of-interest visited bythe eye and mouse), and transition probabilities betweenpairs of area-of-interest suggests that we may reasonably in-fer user information flow on search pages by analyzing theirmouse tracks. This could be potentially useful as searchpages evolve to new UIs, layouts, and richer results, whichmay not be parsed in a conventional linear manner.
There is also reasonable eye-mouse correlation on maxi-mum y distance on the page, which reflects how far downthe page did the user visit (with their eye or mouse). Thiscould be useful in inferring which page folds were attendedby the user, and how far down the page they read.
6.2 On mouse tracking as a proxy for eye track-ing
While mouse tracking is gaining in popularity, it remains apoorly understood science. Future work will involve analyz-ing mouse usage statistics, understanding how mouse usagebehavior varies as a function of users (intent, age, gender,reading fluency), page (UI, images, result quality) and de-vice properties (e.g., trackpad vs. traditional mouse).
In particular, there exists a rich body of statistical liter-ature to analyze models involving partially observed data,such as Hidden Markov Models and Conditional RandomFields. Analysis of users’ mouse activity (even in the ab-sence of eye data) can provide information about prototyp-ical mouse behaviors of users (e.g., parking, reading, skim-ming). In turn, such information can help us estimate eyepositions more accurately in spite of the paucity of eye track-ing data.
limitations of mouse tracking. Unlike eye gaze patterns,there is wide variability in mouse behavior between andwithin users. For example, some users read with their mouse,which as Rodden et al. [22] note is a rare event. Other userstend to park their mouse idle while scanning the page withtheir eye. Some users tend to mark interesting results withtheir mouse, others simply use their mouse for scrolling andclicking. Given the wide variability and noise in mouse usagebehavior, inferring attention from mouse is a hard problem.Further noise in mouse behavior may be introduced depend-ing on the type of mouse device (e.g., a trackpad may involvemore scrolling and smooth mouse movements than a linearmouse). Due to the above reasons, we need to rely on aggre-gate statistics of mouse behavior over several users to infer
their attention on page. In contrast, eye tracks from a singleuser can already reveal a lot about their attention on page.
This leads us to the conclusion that while mouse track-ing can offer valuable signals on user attention on areas-of-interest or page elements at an aggregate level, it cannot yetmatch the millisecond temporal and pixel-level spatial reso-lution of eye tracking on a per user, per page level. Despitethis limitation, mouse tracking has much promise as it offersa scalable methodology to infer user attention on web pages,especially when clicks are absent or few.
7. CONCLUSIONSWe demonstrate through carefully designed lab studies
that the mouse, like the eye, is sensitive to 2 key attributesof page elements – their position on page, and their relevanceto the user’s task – both for linear one-column page layoutsand increasingly popular two-column page layouts. Despitethe noise in mouse activity due to wide variability in mouseusage behavior within and between users, we find strongeye-mouse correlations in measures such as the fraction ofpage time on result elements, and transition probabilitiesbetween elements, suggesting that one may reasonably inferuser attention and information flow over elements on thesearch page, using mouse tracks. This is further validated bythe reasonably high accuracy (67%) in predicting the fixatedresult element from mouse activity (with an error of uptoone element). Potential applications include ranking, searchpage optimization, and UI evaluation both in the presence,and absence of clicks.
8. REFERENCES[1] N. Abe, B. Zadrozny, and J. Langford. An iterative
method for multi-class cost-sensitive learning. InKDD, pages 3–11, 2004.
[2] G. Buscher, E. Cutrell, and M. Morris. What do yousee when you’re surfing?: using eye tracking to predictsalient regions of web pages. In Proceedings of the 27thinternational conference on Human factors incomputing systems, pages 21–30. ACM, 2009.
[3] G. Buscher, S. Dumais, and E. Cutrell. The good, thebad, and the random: an eye-tracking study of adquality in web search. In Proceeding of the 33rdinternational ACM SIGIR conference on Research anddevelopment in information retrieval, pages 42–49.ACM, 2010.

[4] G. Buscher, R. W. White, S. Dumais, and J. Huang.Large-scale analysis of individual and task differencesin search result page examination strategies. InProceedings of the fifth ACM international conferenceon Web search and data mining, WSDM ’12, pages373–382, New York, NY, USA, 2012. ACM.
[5] O. Chapelle and Y. Zhang. A dynamic bayesiannetwork click model for web search ranking. InProceedings of the 18th international conference onWorld wide web, pages 1–10. ACM, 2009.
[6] N. Craswell, O. Zoeter, M. Taylor, and B. Ramsey. Anexperimental comparison of click position-bias models.In Proceedings of the international conference on Websearch and web data mining, pages 87–94. ACM, 2008.
[7] E. Cutrell and Z. Guan. What are you looking for?:an eye-tracking study of information usage in websearch. In Proceedings of the SIGCHI conference onHuman factors in computing systems, pages 407–416.ACM, 2007.
[8] A. Duchowski. Eye tracking methodology: Theory andpractice, volume 373. Springer, 2007.
[9] L. Granka, T. Joachims, and G. Gay. Eye-trackinganalysis of user behavior in www search. InProceedings of the 27th annual international ACMSIGIR conference on Research and development ininformation retrieval, pages 478–479. ACM, 2004.
[10] Q. Guo and E. Agichtein. Exploring mouse movementsfor inferring query intent. In Proceedings of the 31stannual international ACM SIGIR conference onResearch and development in information retrieval,SIGIR ’08, pages 707–708, New York, NY, USA, 2008.ACM.
[11] Q. Guo and E. Agichtein. Ready to buy or justbrowsing?: detecting web searcher goals frominteraction data. In Proceedings of the 33rdinternational ACM SIGIR conference on Research anddevelopment in information retrieval, SIGIR ’10, pages130–137, New York, NY, USA, 2010. ACM.
[12] Q. Guo and E. Agichtein. Towards predicting websearcher gaze position from mouse movements. In CHI’10 Extended Abstracts on Human Factors inComputing Systems, CHI EA ’10, pages 3601–3606,New York, NY, USA, 2010. ACM.
[13] Q. Guo and E. Agichtein. Beyond dwell time:estimating document relevance from cursor movementsand other post-click searcher behavior. In Proceedingsof the 21st international conference on World WideWeb, WWW ’12, pages 569–578, New York, NY, USA,2012. ACM.
[14] G. Hotchkiss, S. Alston, and G. Edwards. Eyetracking study. Research white paper, Enquiro SearchSolutions Inc, 2005.
[15] J. Huang, R. White, and G. Buscher. User see, userpoint: gaze and cursor alignment in web search. InProceedings of the SIGCHI Conference on HumanFactors in Computing Systems, CHI ’12, pages1341–1350, New York, NY, USA, 2012. ACM.
[16] J. Huang, R. W. White, G. Buscher, and K. Wang.Improving searcher models using mouse cursoractivity. In Proceedings of the 35th international ACMSIGIR conference on Research and development ininformation retrieval, SIGIR ’12, pages 195–204, NewYork, NY, USA, 2012. ACM.
[17] J. Huang, R. W. White, and S. Dumais. No clicks, noproblem: using cursor movements to understand andimprove search. In Proceedings of the SIGCHIConference on Human Factors in Computing Systems,CHI ’11, pages 1225–1234, New York, NY, USA, 2011.ACM.
[18] D. Lagun and E. Agichtein. Viewser: enablinglarge-scale remote user studies of web searchexamination and interaction. In Proceedings of the34th international ACM SIGIR conference onResearch and development in Information Retrieval,SIGIR ’11, pages 365–374, New York, NY, USA, 2011.ACM.
[19] J. Langford, L. Li, and A. Strehl. Vowpal Wabbit,2007.
[20] J. Nielsen and K. Pernice. Eyetracking web usability.New Riders Pub, 2010.
[21] A. Olsen. Tobii i-vt fixation filter - algorithmdescription white paper. 2012.
[22] K. Rodden, X. Fu, A. Aula, and I. Spiro. Eye-mousecoordination patterns on web search results pages. InCHI ’08 Extended Abstracts on Human Factors inComputing Systems, CHI EA ’08, pages 2997–3002,New York, NY, USA, 2008. ACM.
[23] D. Salvucci and J. Goldberg. Identifying fixations andsaccades in eye-tracking protocols. In Proceedings ofthe 2000 symposium on Eye tracking research &applications, pages 71–78. ACM, 2000.
[24] A. J. Smola and B. Scholkopf. Sparse greedy matrixapproximation for machine learning. In ICML, pages911–918, 2000.


![Gene expression in the mouse eye: an online resource for ... · function, and pathology of the eye and visual system [1-9]. An inevitable side effect of this relentless progress is](https://static.fdocuments.in/doc/165x107/5ed492ecf853a82c567bc310/gene-expression-in-the-mouse-eye-an-online-resource-for-function-and-pathology.jpg)