MDS A Hematopoietic Disorder of the Elderly - bhs.be · Secondary MDS Prior chemo- or radiation...
77
MDS – A Hematopoietic Disorder of the Elderly
Transcript of MDS A Hematopoietic Disorder of the Elderly - bhs.be · Secondary MDS Prior chemo- or radiation...

MDS – A Hematopoietic Disorder of the Elderly

Myelodysplastic Syndrome and Juvenile Myelomonocytic Leukemia
in Children and Adolescents
Charlotte M. Niemeyer MD
Professor of Pediatrics
Department of Pediatrics
University Medical Center
Freiburg im Breisgau
Germany

• Infections
• Nutritional deficiencies
• Metabolic disorders
• Mitochondrial deletion
(Pearson syndrome)
• Inherited bone marrow
failure disorders
Myelodysplasia in Childhood
Most commonly seen in:


Annamaria Cseh
Alexandra Fischer
Wilfried Truckenmüller
Peter Nöllke
Irith Baumann,
Stephan Schwarz-Furlan
Gitte Kerndrup
Jan van der Tweed
Pascale de Paepe
Vit Campr
Ingrid Simonitsch-Klupp
Rita Devito
Michael Mc Dermott
Jean Philippe
Susanna Fenu
Valerie de Haas
Charlotte Niemeyer
Austria
Belgium
Czech Republic
Germany
Italy
Nordic Countries
Switzerland
The Netherlands
Ireland
Michael Dworzak
Barbara de Moerloose
Jan Starý
Charlotte Niemeyer
Marco Zecca
Henrik Hasle
Markus Schmugge
Marry v.d. Heuvel-Eibrink
Owen Smith
Brigitte Schlegelberger
Kyra Michalova
Gitte Kerndrup
Berna Beverloo
David Betts
Oskar Haas
Laura Sainati
Natalie van Roy
Regional Coordinators
Oncogenetics
Histopathology, Morphology
Coordinating Study Center
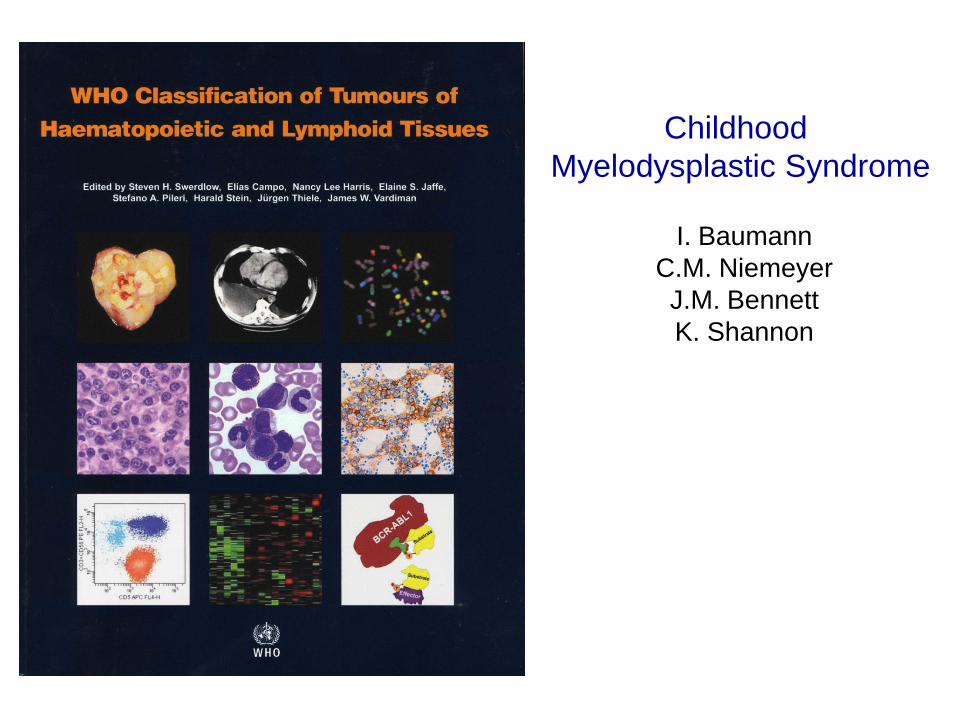
Childhood
Myelodysplastic Syndrome
I. Baumann
C.M. Niemeyer
J.M. Bennett
K. Shannon
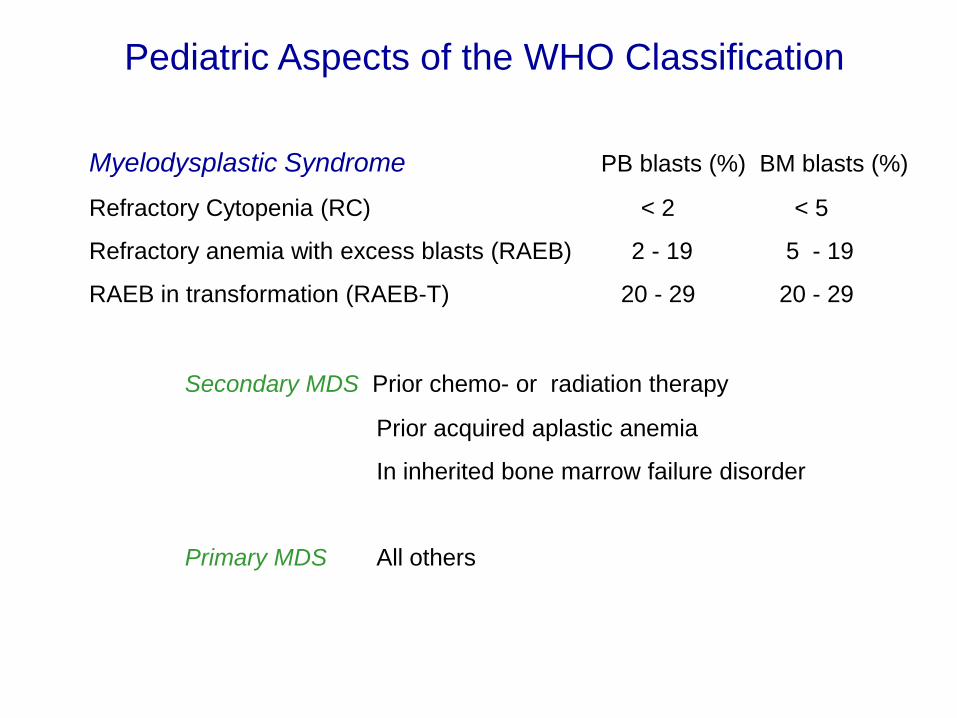
Pediatric Aspects of the WHO Classification
Myelodysplastic Syndrome PB blasts (%) BM blasts (%)
Refractory Cytopenia (RC) < 2 < 5
Refractory anemia with excess blasts (RAEB) 2 - 19 5 - 19
RAEB in transformation (RAEB-T) 20 - 29 20 - 29
Secondary MDS Prior chemo- or radiation therapy
Prior acquired aplastic anemia
In inherited bone marrow failure disorder
Primary MDS All others

RCC 60%
RAEB 31%
RAEB-T 9%
All Patients
Morphological Subtypes of Primary MDS (EWOG-MDS 98 and EWOG-MDS 2006 interim)

de novo AML
100 %
20 %
Separation of MDS from de novo AML
RAEB
MDS after exclusion of
• AML specific translocations
• Clinically leukemic presentation
• Rapid progression of disease
30 % RAEB-T
Bla
st
(%)
Time (months)
Threshold
(20 % or 30 %)
de novo AML
MDS
Modified from Head, Curr Opin Oncol 2002, 14:19
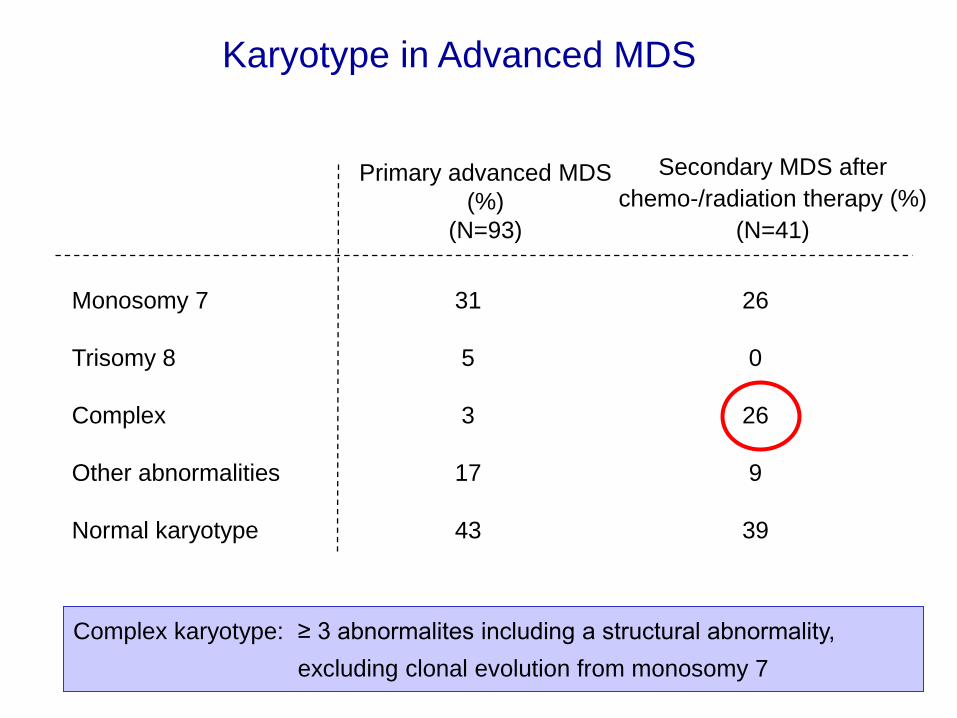
Karyotype in Advanced MDS
Monosomy 7 31 26
Trisomy 8 5 0
Complex 3 26
Other abnormalities 17 9
Normal karyotype 43 39
Primary advanced MDS
(%)
(N=93)
Secondary MDS after
chemo-/radiation therapy (%)
(N=41)
Complex karyotype: ≥ 3 abnormalites including a structural abnormality,
excluding clonal evolution from monosomy 7

1. Can chemotherapy alone cure the patient ?
• Two Questions for Therapy of Advanced MDS

1. Can chemotherapy alone cure the patient ?
2. Can cytoreductive therapy prior to HSCT
improve EFS ?
• Two Questions for Therapy of Advanced MDS

Inclusion Criteria
Diagnosis: Primary advanced MDS < 30% BM blast at diagnosis
Evaluation according to highest WHO-type
Date of diagnosis: 7/1998 – 12/2006
Conditioning: Bu/Cy/Mel
Donor: MSD, MUD
MMUD (1 Ag +/- 1 Al MM or 2 Al MM)
HLA-typ.: HLA A, B, C, DRB1
(without HLA C in 7 patients)
Transplantat: unmanipulated BM, PBSC
HSCT in advanced primary MDS

Patients
HSCT in advanced primary MDS
Number of patients 97
Sex (M / F) 65 / 32
Age at HSCT (years) 11.1 (1.4 -19)
Time interval between diagnosis -HSCT (mo) 3.9 (1 – 31.2)
Highest WHO type prior to HSCT
RAEB 53 (55%)
RAEB-T 29 (30%)
MDR-AML 15 (15%)

HSCT in advanced primary MDS
Transplantation
Donor
HLA-identical sibling 39 (40%)
HLA-compatible unrelated donor 58 (60%)
Source of stem cells
Bone marrow 69 (71%)
Peripheral blood 28 (29%)
Conditoning day -8 -7 -6 -5 -4 -3 -2 -1 0
Busulfan (4 mg/kg/d)
Cyclophosphamide (60 mg/kg/d)
Melphalan (140 mg/m2/d)

12 10 8 6 4 2 0
1.0
0.8
0.6
0.4
0.2
0.0
5-yrs.-SURV: 0.63 [0.53-0.73]
5-yrs.-EFS: 0.59 [0.49-0.69]
SURV: N =97, E=33, Follow-Up: 3.7 yrs. (0.1-10.9)
EFS: E=38, Follow-Up: 3.1 yrs. (0.1-10.9)
PR
OB
AB
ILIT
Y
Survival and Event-Free Survival
HSCT in advanced primary MDS
YEARS AFTER TRANSPLANTATION

Relapse/TRM Incidence
12 10 8 6 4 2 0
1.0
.8
.6
.4
.2
0.0
P
12 10 8 6 4 2 0
1.0
.8
.6
.4
.2
0.0
CU
MU
LA
TIV
E I
NC
IDE
NC
E
Relapse TRM
YEARS AFTER TRANSPLANTATION YEARS AFTER TRANSPLANTATION
N=97, E=18
0.21 [0.14-0.32]
HSCT in advanced primary MDS
N=97, E=20
0.21 [0.14-0.31]

12 10 8 6 4 2 0
1.0
0.8
0.6
0.4
0.2
0.0
PR
OB
AB
ILIT
Y
HSCT in advanced primary MDS
YEARS AFTER TRANSPLANTATION
Log Rank: p=0.07
Event-free Survival nach MDS Subtyp
RAEB, p=0.63 [0.59-0.77] N=53, E=18
RAEB-T, p=0.64 [0.46-0.82]
N=29, E=10
MDR-AML, p=0.32 [0.08-0.56]
N=15, E=10

12 10 8 6 4 2 0
1.0
0.8
0.6
0.4
0.2
0.0
PR
OB
AB
ILIT
Y
HSCT in advanced primary MDS
YEARS AFTER TRANSPLANTATION
EFS according to Blast Percentage at SCT
Log Rank: p=0.11
>= 20 %, p=0.45 [0.23-0.67]
N=20, 11 events
5-19 %, p=0.65 [0.50-0.80]
N=46, 15 events
< 5 %, p=0.62 [0.41-0.83]
N=22, 8 events

12 10 8 6 4 2 0
1.0
0.8
0.6
0.4
0.2
0.0
PR
OB
AB
ILIT
Y
HSCT in advanced primary MDS
YEARS AFTER TRANSPLANTATION
Log Rank: p=n.s.
Event-free Survival according to Therapy
None or low-dose therapy,
p=0.58 [0.46-0.70]
N=73, 29 events
AML-like chemotherapy,
p=0.62 [0.42-0.82]
N=24, 9 events

Incidence of Relapse
Increased at
- higher WHO subtype of MDS
- complex karyotype ( ≥ 3 aberrations with at least one structural abnormality)
- higher percentage of blast in BM at HSCT (not significant)
Decreased at
- presence of acute or chronic GvHD (not significant)
Independent of
- donor (MSD vs UD)
- application of intensive chemotherapy prior to HSCT
HSCT in advanced primary MDS

12 10 8 6 4 2 0
1.0
0.8
0.6
0.4
0.2
0.0
PR
OB
AB
ILIT
Y
HSCT in advanced primary MDS
YEARS AFTER TRANSPLANTATION
Log Rank: p=0.11
Event-free Survival according to Age at HSCT
< 12 yrs.: p=0.67 [0.53-0.81]
N=51, E=16
≥ 12 yrs.: p=0.50 [0.35-0.65]
N=46, E=22
12 10 8 6 4 2 0
1.0
0.8
0.6
0.4
0.2
0.0
HSCT in advanced primary MDS
YEARS AFTER TRANSPLANTATION
CU
MU
LA
TIV
E IN
CID
EN
CE
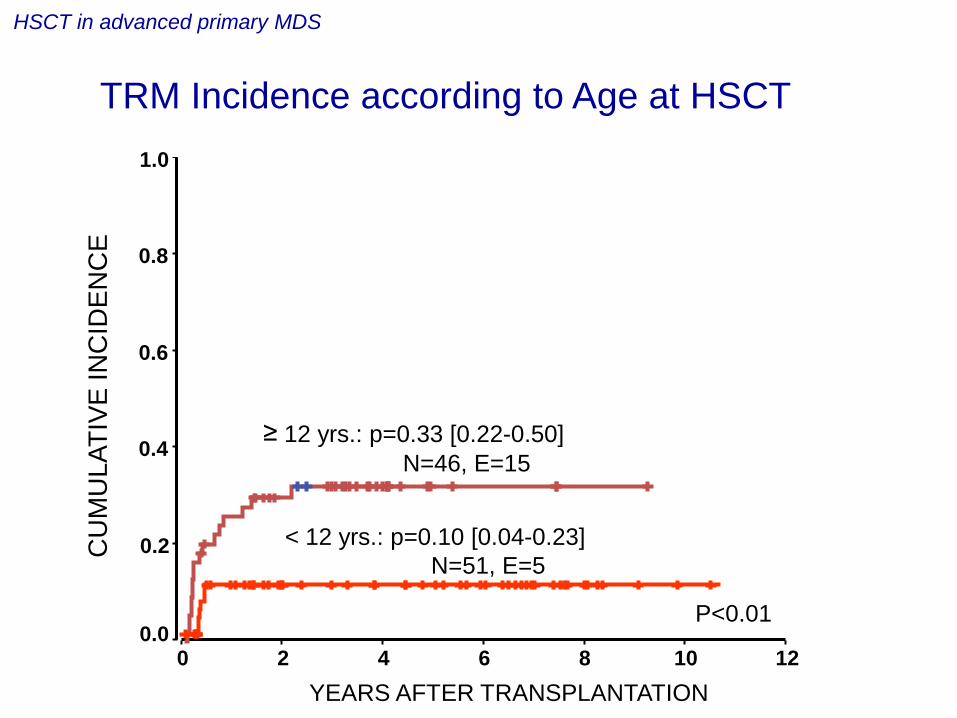
TRM Incidence according to Age at HSCT
< 12 yrs.: p=0.10 [0.04-0.23]
N=51, E=5
≥ 12 yrs.: p=0.33 [0.22-0.50]
N=46, E=15
P<0.01

12 10 8 6 4 2 0
1.0
0.8
0.6
0.4
0.2
0.0
HSCT in advanced primary MDS
YEARS AFTER TRANSPLANTATION
CU
MU
LA
TIV
E IN
CID
EN
CE
TRM Incidence according to time
diagnosis of advanced MDS to HSCT
< 4 mths.: p=0.10 [0.04-0.23]
N=49, E=5
≥ 4 mths.: p=0.31 [0.21-0.48]
N=48, E=15
P=0.01

Relapse / TRM Incidence according to Acute GvHD
12 10 8 6 4 2 0
1.0
.8
.6
.4
.2
0.0
P
12 10 8 6 4 2 0
1.0
.8
.6
.4
.2
0.0
CU
MU
LA
TIV
E I
NC
IDE
NC
E
Relapse TRM
YEARS AFTER TRANSPLANTATION YEARS AFTER TRANSPLANTATION
P=n.s.
P<0.01 III-IV: 0.10 [0.03-0.36]
0-II: 0.24 [0.16-0.38]
Grade 0-II, 9 events
Grade III-IV, 11 events
III-IV: 0.48 [0.31-0.74]
0-II: 0.12 [0.07-0.23]
Grade 0-II, N=74, 16 events
Grade III-IV, N=23, 2 events
HSCT in advanced primary MDS

Incidence of transplant associated mortality
increased at
- older patients (≥ 12 years at HSCT)
- longer time interval between diagnosis and HSCT (≥ 4 mo)
- presence of acute or chronic GvHD (not signifikant)
HSCT in advanced primary MDS
EWOG-MDS Consensus in Pavia 2006:
…it may be indicated to intensify GVHD prophylaxis with the aim of
reducing TRM in patients > 12 years…
MSD ≥ 12 y at HSCT: CSA 3 mg/kg/d + short course MTX

Relapse/ TRM Incidence according to
GvHD Prophylaxis, Sibling Donor only
12 10 8 6 4 2 0
1.0
.8
.6
.4
.2
0.0
P
12 10 8 6 4 2 0
1.0
.8
.6
.4
.2
0.0
CU
MU
LA
TIV
E I
NC
IDE
NC
E
Relapse TRM
YEARS AFTER TRANSPLANTATION YEARS AFTER TRANSPLANTATION
P=0.09
P=n.s.
CSA only, 6 events
CSA+MTX, 1 events
CSA only, N=27, 2 events
CSA+MTX, N=12, 3 events
HSCT in advanced primary MDS
CSA only: 0.22 [0.11-0.45]
CSA+MTX: 0.08 [0.01-0.54] CSA only: 0.08 [0.02-0.32]
CSA+MTX: 0.32 [0.12-0.86]

RCC 60%
RAEB 31%
RAEB-T 9%
Hypocellular 82%
Normo- 9% Hyper-
9%
All Patients RCC
Morphological Subtypes of Primary MDS (EWOG-MDS 98 and EWOG-MDS 2006 interim)
Hb F, prior to Tx, age adjusted: 91% elevated
MCV, prior to Tx, age adjusted: 64% elevated

other
no result
Increased or normal cellularity
(19% of patients, N=67)
Decreased cellularity
(81% of patients, N=288)
67% 9%
8%
16%
61% 19%
12%
8%
Karyotype in Primary RCC
(EWOG-MDS 98 and EWOG-MDS 2006 interim)
normal karyotype normal karyotype
- 7
other
no result
-7
EWOG-MDS May 2011

Dysplastic Megakaryocytes
Granulopoiesis
Erythropoiesis
Normocellular Hypocellular
Histopathological Pattern in RCC

chloracetate-esterase staining
Patchy Erythropoietic Pattern in RCC

Histopathology of RCC
chloracetate-esterase staining

Left Shifted Erythroid Hyperplasia in RCC
Giemsa staining
mitosis
proerythroblasts
proerythroblasts
mature erythroblasts

anti-CD61-staining
Micromegakaryocytes on Immunohistochemistry in RCC
micromegakaryocyte
micromegakaryocyte

Histopathology of RCC

Biopsy Diagnostic of RCC

Biopsy in RCC Mimicking Acquired Aplastic Anemia

Histopathology of Acquired Aplastic Anemia

Acquired Severe Aplastic Anemia
Giemsa staining
0 2 4 6 8 10
Years after IST
0 . 0
0 . 2
0 . 4
0 . 6
0 . 8
1 . 0
Cu
mu
lati
ve in
cid
ence
N=123, E=3, 0.03 (0.01-0.08)
Study SAA 94: Clonal evolution in patients
registered following introduction of reference review
12 14
Baumann I. et al. Histopathology in press

Inter observer reliability of 79%
Reproducability of Histopathological Diagnostic Criteria in RCC
Accordance among 7 pathologists
7 of 7 6 of 7 5 of 7 4 of 7
RCC (N=67) 72% 13% 12% 3%
SAA (N=33) 85% 12% 0% 3%
Baumann I. et al. Histopathology in press
7 pathologists from 6 countries
100 cases of RCC or SAA previously reviewed by one of them
BM biopsies (HE, Giemsa, cloracetate-esterase, anti-CD61)
Double blind, same set of slides
Method
Results

Inherited Bone Marrow Failure Disorders
and RCC Show Overlapping Morphological Features
Hematopoietic stem cell
Radio- ulnar synostosis DBA
CAMT
DC
SCN SDS
FA
15% of RCC Yoshimi et al. ASH 2011
7% of BMF Pinto et al, Haematologica 2009

12 10 8 6 4 2 0
1.0
.8
.6
.4
.2
0.0
years
Monosomy 7 = 80% (62-98) (N=32, 15 events)
Normal karyotype = 27% (5-49) (N=22, 4 events)
Trisomy 8 = 30% (0-84) (N=12, 1 event)
log rank: p<0.01
Progression of Primary Refractory Cytopenia
to Advanced MDS
Kardos et al. Blood 2003;102:1997
PR
OB
AB
ILIT
Y (9
5%
CI)

MFD
Transfusion dependent or
ANC < 1000/µL
No transfusion and
ANC >1000/µL
HSCT watch and wait BM aspiration 6-12 mo
HSCT
IST
hypocellular BM + normal karyotype or trisomy 8
MUD
Rational Approach to Therapy for RCC
Karyotype
-7, 7q-, ≥ 3 abnormalities HSCT as soon as possible
all other

years from HSCT
8 6 4 2 0
1.0
0.8
0.6
0.4
0.2
0.0
HSCT in RCC: Standard Myeloablative Regimen with Busulfan, Cyclophosphamide, +/- Melphalan
5-yrs. CI TRM: 0.17 [0.09-0.32]
5-yrs. CI Relapse: 0.03 [0.00-0.15]
Pro
bab
ility
(9
5%
CI)
5-yrs. EFS MFD 0.78 [0.58-0.98], N =19, E=4 MUD 0.76 [0.60-0.92], N =29, E=7
Locatelli et al. Blood 2007; 110: 251
Karyotype - 7/other abnormalities 13/4 Normal / not available 27/4
BM cellularity Reduced/normal/increased 34/8/6
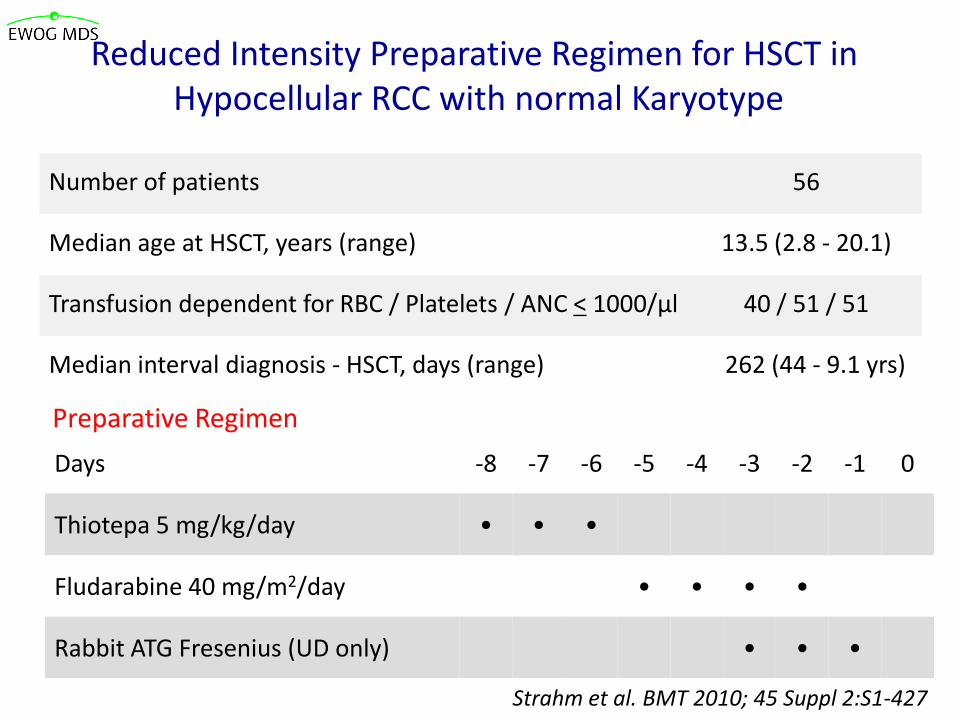
Number of patients 56
Median age at HSCT, years (range) 13.5 (2.8 - 20.1)
Transfusion dependent for RBC / Platelets / ANC < 1000/µl 40 / 51 / 51
Median interval diagnosis - HSCT, days (range) 262 (44 - 9.1 yrs)
Preparative Regimen
Days -8 -7 -6 -5 -4 -3 -2 -1 0
Thiotepa 5 mg/kg/day • • •
Fludarabine 40 mg/m2/day • • • •
Rabbit ATG Fresenius (UD only) • • •
Strahm et al. BMT 2010; 45 Suppl 2:S1-427
Reduced Intensity Preparative Regimen for HSCT in Hypocellular RCC with normal Karyotype

Years from HSCT
0 . 0
0 . 2
0 . 4
0 . 6
0 . 8
1. 0
Log Rank: p=n.s.
MSD 1.00 MFD 0.95 (0.88-1.00)
0 2 4 6 8 10
MSD 0.76 (0.52-1.00)
MFD 0.84 (0.72-0.96)
OS EFS MSD N=15, event=0, event=3
MFD N=41, event=2, event=6
Events: graft failure, platelet non-engraftment, TRM
Strahm et al. BMT 2010; 45 Suppl 2:S1-427
OS
EFS
HSCT: Reduced Intensity Preparative Regimen in Hypocellular RCC with normal Karyotype
Pro
bab
ility
(9
5%
CI)

Patient characteristics (N = 32)
Median age at diagnosis (years) 10 (1.8 - 17.2)
Median ANC at IST (/µl) 600 (0 - 1300)
Transfusion dependent at IST PLT 32/32
RBC 29/32
Karyotype: normal/ abnormal / no result 14/ 1/ 17
Median interval diagnosis – IST (days) 70 (7 - 304)
Immunosuppressive Therapy in RCC Yoshimi et al. Haematologica 2007; 92: 397
Therapy according to study SAA 94 (Führer et al, Blood 2005; 106:2102)
• Horse ATG (Lymphoglobulin): 15 mg/kg/days x 8 days
• CSA: 5 mg/kg/day adjusted by blood levels
• G-CSF: 5 µg/kg/day for patients with ANC < 0.5x10 9 /L
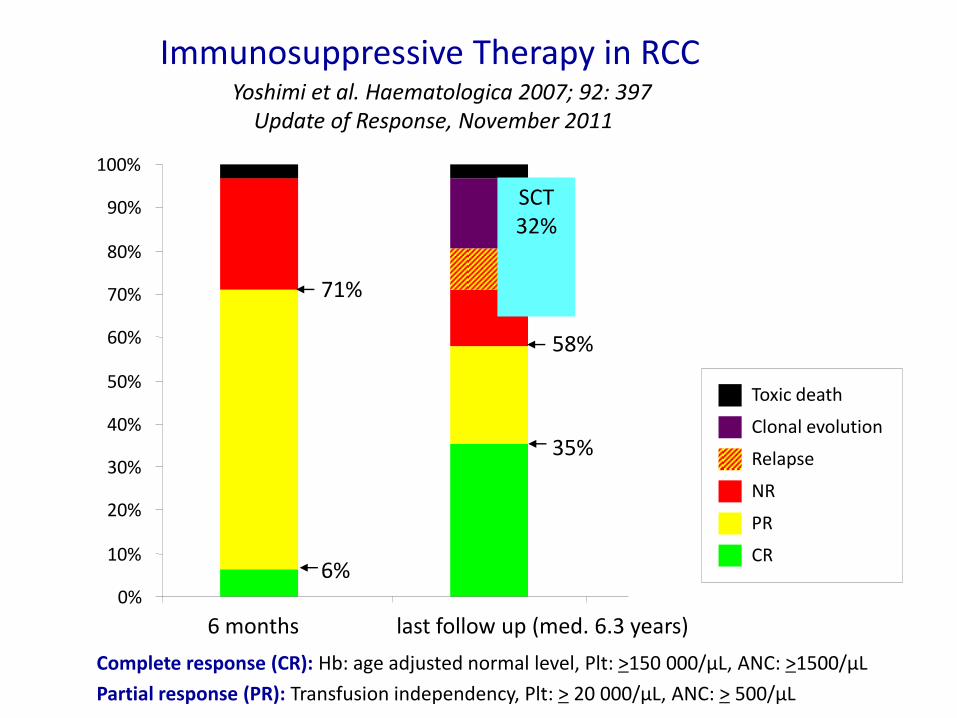
Complete response (CR): Hb: age adjusted normal level, Plt: >150 000/µL, ANC: >1500/µL
Partial response (PR): Transfusion independency, Plt: > 20 000/µL, ANC: > 500/µL
0%
10%
20%
30%
40%
50%
60%
70%
80%
90%
100%
6 months last follow up (med. 6.3 years)
Toxic death
Clonal evolution
Relapse
NR
PR
CR
SCT 32%
71%
58%
35%
6%
Immunosuppressive Therapy in RCC Yoshimi et al. Haematologica 2007; 92: 397 Update of Response, November 2011

Overall and Failure Free Survival after IST
Failure : death, no response at 6 months, relapse, clonal evolution, 2nd IST, HSCT
Years from IST
0 2 4 6 8 10 12
1.0
0
5-yrs OS: 86.8%
5-yrs FFS: 47.7%
Median time of follow-up 6.3 years
Pro
bab
ility
(9
5%
CI)
Yoshimi et al. Haematologica 2007; 92: 397 Update of Response, November 2011
0.8
0.6
0.4
0.2

Summary and Conclusion
Refractory cytopenia of childhood (RCC) is characterized by a distinct
morpholocial and histopathological pattern.
RCC can be separated from acquired SAA at diagnosis in a reproducible
and reliable fashion.
Prior to the establishment of a diagnosis of RCC inherited bone marrow failure
disorders need to be excluded. Chromosomal breakage test (FA)and telomere
length measurements (DC) are strongly recommended.
Cross-continental collaboration is required to analyze and classify pediatric
cohorts with bone marrow failure.
Genomic studies will help to eventually unravel the nature of disorders
currently best classified as RCC.

Juvenile Myelomonocytic Leukemia
Courtesy of The JMML Foundation

Splenomegaly 93%
Lymphadenopathy 59%
Skin infiltration 25%
WBC (med.) 33 x 109/l
Monocytes (med.) 5.4 x 10⁹/l
Platelets (med.) 54 x 109/l
Precursors in PB 90 % of patients
Clinical Presentation
Niemeyer et al. Blood 89: 3534, 1997

P. Emanuel, 2003
% m
axim
al C
FU
-GM
co
lony g
row
th
GM-CSF (ng/ml)
0 0.01 0.02 0.04 0.08 0.16 0.32 2
0
10
20
30
40
50
60
70
80
90
100 Normal
JMML (n=186)
GM-CSF Hypersensitivity in JMML

RAS GDP SHC
GRB2
SHP-2 (PTPN11)
growth factor cell membrane
SOS1 NRAS GTP
RAF1
MEK2
ERK1
ERK1/2
nucleus
CBL
KRAS GTP
HRAS GTP
BRAF
MEK1
ERK2
ERK1/2
cytosol
SPRED1
P
P
neurofibromin
NF1
RAS MAPK Pathway

Neurofibromatosis Type I JMML

Desktop anzeigen.scf
Loss of Heterozygosity – Uniparental Disomy
Steinemann et al. Haematologica 2010
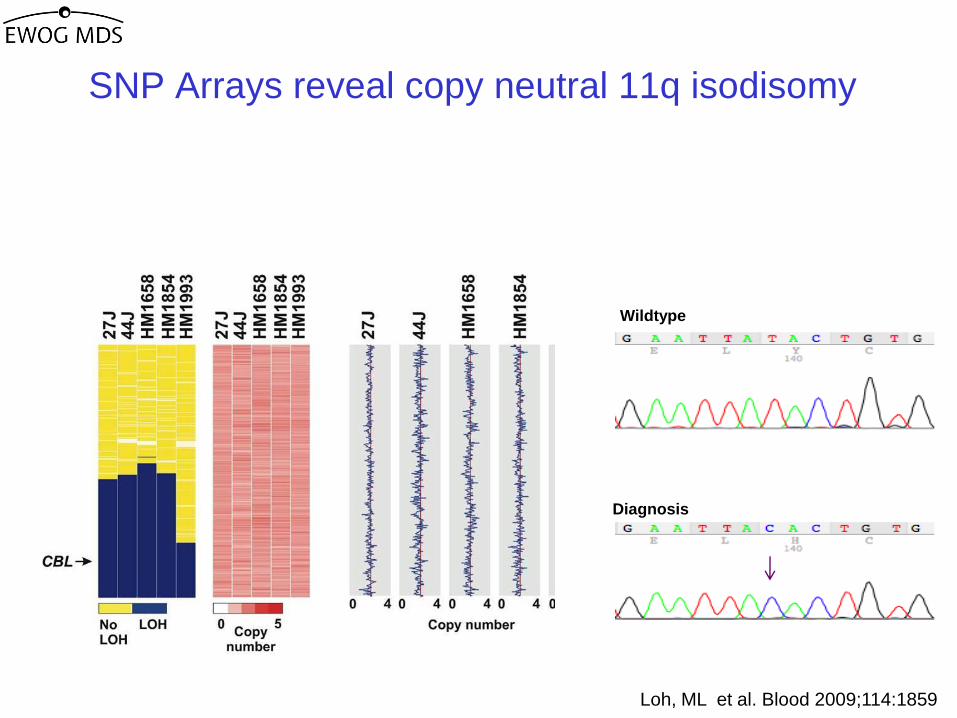
Loh, ML et al. Blood 2009;114:1859
SNP Arrays reveal copy neutral 11q isodisomy
Wildtype
Diagnosis
Analysis of the commonly involved region identified CBL
as the candidate gene

CBL encodes c-Cbl, a Protein with Complex Functions
• involved in many signaling pathways, including Ras signaling
• E3 ubiquitin ligase: degrades activated RTKS via ubiquitylation
• also functions as an adaptor protein

Clinical Features of JMML Patients with CBL Mutation
Dysmorphic facial features
Growth < 3rd percentile
Developmental delay
Cryptorchism
Hearing loss
1-2 café au lait spots
juvenile xanthogranuloma
Niemeyer et al. Nat Genet, 2010

ID Optic
atrophy
Hyper-
tension
Cardio-
myopathy
Status/
Age (yrs)
A053 + + + A 18.2
A054 A 17.7
D256 + + A 13.0
D048 + + + D 9.9
D389 + + + A 7.5 D088 D 7.3
Follow-up of JMML Patients with CBL Mutation
no HSCT:
HSCT:
6 patients aged 7-19 years
died of JMML
8 / 11 patients with mixed chimerism,
resolution of JMML
spontaneous
resolution of MPD

Radiographic Evidence of Vasculitis
Aorta Aorta Left subclavian artery
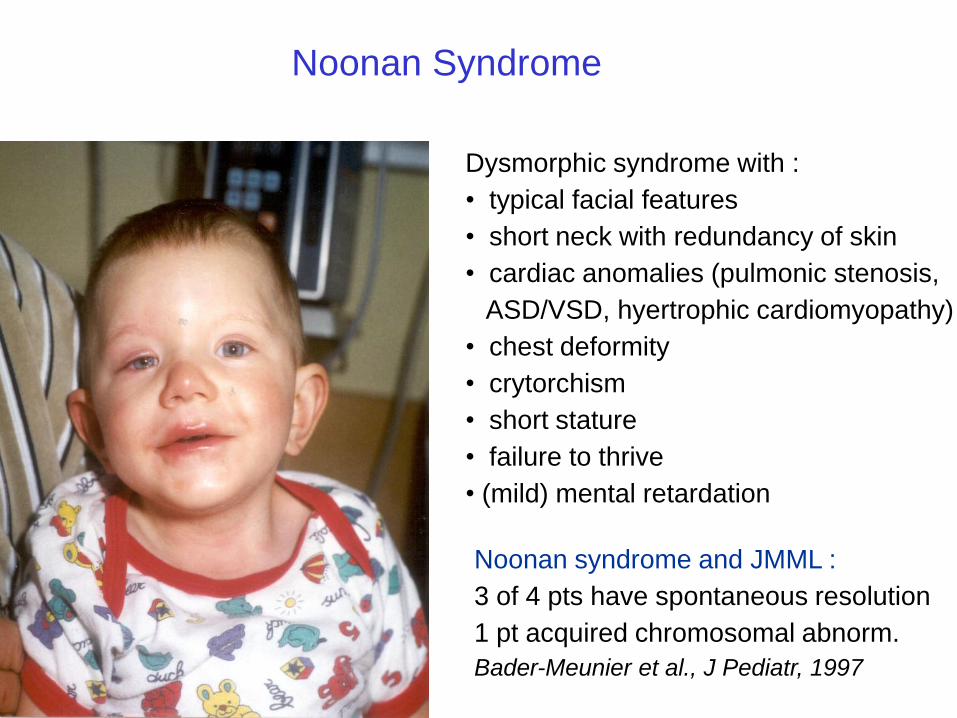
Noonan Syndrome
Dysmorphic syndrome with :
• typical facial features
• short neck with redundancy of skin
• cardiac anomalies (pulmonic stenosis,
ASD/VSD, hyertrophic cardiomyopathy)
• chest deformity
• crytorchism
• short stature
• failure to thrive
• (mild) mental retardation
Noonan syndrome and JMML :
3 of 4 pts have spontaneous resolution
1 pt acquired chromosomal abnorm.
Bader-Meunier et al., J Pediatr, 1997

RAS GDP SHC
GRB2
SHP-2 (PTPN11)
growth factor cell membrane
SOS1 NRAS GTP
RAF1
MEK2
ERK1
ERK1/2
nucleus
CBL
KRAS GTP
HRAS GTP
BRAF
MEK1
ERK2
ERK1/2
cytosol
neurofibromin
Noonan
LEOPARD
Costello
SPRED1 Legius
NF1 CFC
P
P
Genetic syndromes of the RAS-MAPK Pathway: “RASopathies”
Modified from Tidyman
Current Opinion in Genetics & Development 2009
Noonan-like

RAS GDP SHC
GRB2
SHP-2 (PTPN11)
growth factor cell membrane
SOS1 NRAS GTP
RAF1
MEK2
ERK1
ERK1/2
nucleus
CBL
KRAS GTP
HRAS GTP
BRAF
MEK1
ERK2
ERK1/2
cytosol
neurofibromin
Noonan
Noonan-like
LEOPARD
Costello
SPRED1 Legius
NF1 CFC
P
P
JMML and the “RASopathies”
Modified from Tidyman
Current Opinion in Genetics & Development 2009
RAS GDP SHC
GRB2
SHP-2 (PTPN11)
growth factor cell membrane
SOS1 NRAS GTP
RAF1
MEK2
ERK1
ERK1/2
nucleus
CBL
KRAS GTP
BRAF
MEK1
ERK2
neurofibromin SPRED1
P
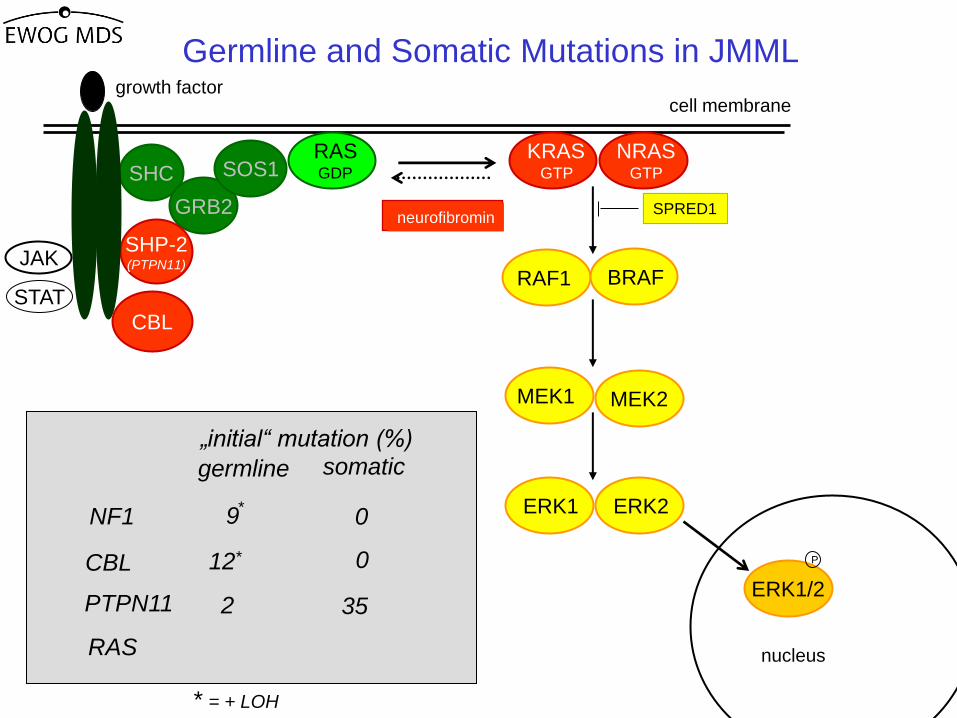
JAK
STAT
germline somatic
„initial“ mutation (%)
CBL
PTPN11
RAS
NF1
12*
9
35 2
0
0
*
* = + LOH
Germline and Somatic Mutations in JMML

Germline Somatic
Mild effects on
cell growth
Strong effects
on cell growth
Tolerated in the
germline
Not tolerated in
the germline
Noonan JMML
cell
Some develop
JMML
PTPN11
mutation
Tartaglia, Niemeyer et al. Nat Genet 2003

RAS GDP SHC
GRB2
SHP-2 (PTPN11)
growth factor cell membrane
SOS1 NRAS GTP
RAF1
MEK2
ERK1
ERK1/2
nucleus
CBL
KRAS GTP
BRAF
MEK1
ERK2
neurofibromin SPRED1
P
JAK
STAT
germline somatic
„initial“ mutation (%)
CBL
PTPN11
RAS
NF1
12*
9
35
25
2
1
0
0
*
* = + LOH
Germline and Somatic Mutations in JMML

(Blood 2008)
(Blood 2007)
(PBC 2008)
A Favorable Outcome In Children with Juvenile Myelomonocytic Leukemia (JMML) with RAS Mutations
Sayoko Doisaki, MD*, Hideki Muramatsu, MD, PhD*, Asahito Hama, MD, PhD*, Akira Shimada, MD, PhD, Yoshiyuki Takahashi, MD, PhD* and Seiji Kojima, MD, PhD*
(ASH 2010)
Spontaneous improvement of JMML with RAS Mutations

Autoimmune lymphoproliferative like disease
with somatic KRAS and NRAS Mutations
• Disorder characterized by :
hepatosplenomegaly, lymphadenopathy, autoimmune cytopenia
and other autoimmune disease
• Disorder does neither fit criteria for ALPS nor JMML
Masatoshi Takagi, et al. Blood 2020
• Clonality? Which cell lines at which progenitor precursor stage involved?

Therapeutic Options for JMML
PTPN11 RAS NF1 CBL
Germline (-/+ LOH)
Somatic HSCT
HSCT w+w
cytoreduction
w+w
cytoreduction
35%
w+w
HSCT
w+w
HSCT?
2%
25%
1% 9% 12%
0% 0%
-- --

Overall survival from diagnosis
24 20 16 12 8 4 0
1.0
0.8
0.6
0.4
0.2
0.0
YEARS FROM Diagnosis
PRO
BABIL
ITY
28
5-year OS: All negative: 0.79 (0.64-0.94)
Clinical NF-1: 0.37 (0.21-0.53)
PTPN11: 0.46 (0.34-0.58)
RAS: 0.58 (0.46-0.70)
Log Rank: p=0.02 ( 5-yrs.)
No mutation: N=31; E= 7 RAS: N=76; E=30 PTPN11: N=90; E=45 NF 1: N=39; E=25
10.11.2011

Overall survival from diagnosis regarding HSCT, stratum mutational group
SCT: n=78
No HSCT: n=12
PTPN11 RAS
NF1 No mutation
PRO
BABIL
ITY
PRO
BABIL
ITY
PRO
BABIL
ITY
PRO
BABIL
ITY
SCT: n=57
No HSCT: n=19
SCT: n=29
No HSCT: n=10
SCT: n=28
No HSCT: n= 3
10.11.2011

CDKN1C
CDKN2B
DAPK1
MGMT
MLH1
RARB
TP73
CALCA
RASSF1
BMP4
PAWR
RECK
PTEN
RASA1
SOCS1
hypermethylation associated with hyperactive RAS
regulatory function in RAS pathway
hypermethylation in other leukemias
Aberrant DNA Methylation
Candiate genes
Quantitative measurements using mass spectrometry (MassARRAY) Olk-Batz et al, Blood 117:4871ff, 2011

Aberrant DNA Methylation is the most important
Risk Faktor for Relapse after HSCT
Overall survival, multivariate analysis
Sex: F vs. M
Age: <3 years vs. >=3 years
Platelets: 33x109/L vs. > 33 x109/L
Mutation vs. no mutation
High methylation vs. no methylation
N.S.
N.S.
N.S.
N.S.
N.S.
N.S.
PTPN11
RAS
NF1
CBL N.S.
0.013
p<0.01
Years from diagnosis
40 26 16 7 4 no methylation
29 13 7 3 2 intermediate methylation
18 4 3 0 0 high methylation
Number of patients
Years from HSCT
Number of patients
31 20 12 8 3 no methylation
19 10 8 4 2 intermediate methylation
16 5 3 0 0 high methylation
Pro
ba
bili
ty
121086420
1.0
0.8
0.6
0.4
0.2
0.0
Pro
ba
bili
ty
Years from HSCT
p<0.01
Pro
ba
bili
ty
p<0.01
121086420
1.0
0.8
0.6
0.4
0.2
0.0
Years from HSCT
Cum
ula
tive
incid
ence
p<0.01
121086420
1.0
0.8
0.6
0.4
0.2
0.0
P
Relative risk (95% confidence interval)
1 2 3 4 5 6 7 8
E
Overall survivalA Overall survival after HSCT
Event-free survival after HSCTC Relapse after HSCT
121086420
1.0
0.8
0.6
0.4
0.2
0.0
31 16 10 7 3 no methylation
19 10 8 4 2 intermediate methylation
16 0 0 0 0 high methylation
Number of patients Number of patients
31 17 12 8 4 no methylation
19 12 9 6 3 intermediate methylation
16 1 1 1 1 high methylation
B
D
Overall survival, multivariate analysis
Sex: F vs. M
Age: <3 years vs. >=3 years
Platelets: 33x109/L vs. > 33 x109/L
Mutation vs. no mutation
High methylation vs. no methylation
N.S.
N.S.
N.S.
N.S.
N.S.
N.S.
PTPN11
RAS
NF1
CBL N.S.
0.013
p<0.01
Years from diagnosis
40 26 16 7 4 no methylation
29 13 7 3 2 intermediate methylation
18 4 3 0 0 high methylation
Number of patients
Years from HSCT
Number of patients
31 20 12 8 3 no methylation
19 10 8 4 2 intermediate methylation
16 5 3 0 0 high methylation
Pro
ba
bili
ty
121086420
1.0
0.8
0.6
0.4
0.2
0.0
121086420
1.0
0.8
0.6
0.4
0.2
0.0
Pro
ba
bili
ty
Years from HSCT
p<0.01
Pro
ba
bili
ty
p<0.01
121086420
1.0
0.8
0.6
0.4
0.2
0.0
Years from HSCT
Cum
ula
tive
incid
ence
p<0.01
121086420
1.0
0.8
0.6
0.4
0.2
0.0
P
Relative risk (95% confidence interval)
1 2 3 4 5 6 7 8
E
Overall survivalA Overall survival after HSCT
Event-free survival after HSCTC Relapse after HSCT
121086420
1.0
0.8
0.6
0.4
0.2
0.0
121086420
1.0
0.8
0.6
0.4
0.2
0.0
31 16 10 7 3 no methylation
19 10 8 4 2 intermediate methylation
16 0 0 0 0 high methylation
Number of patients Number of patients
31 17 12 8 4 no methylation
19 12 9 6 3 intermediate methylation
16 1 1 1 1 high methylation
B
D
Sex: F vs M
Age: < 3 years vs. > 3 years
Platelets: < 33x109/L vs > 33x109/L
Mutation vs no Mutation
PTPN11 RAS
NF1 CBL
High methylation vs no methylation
Olk-Batz et al, Blood 117:4871ff, 2011

Olk-Batz et al, Blood 117:4871ff, 2011

diagnosis
Jan 07Nov 07 Dec 07 Jan 08 Feb 08 Mar 08 Apr 08 May 08 Jun 08
Azacitidine 1st cycle2nd
cycle3rd cycle 4th cycle 5th cycle 6th cycle 7th cycle 8th cycle
Liver [cm] 2 2 1 1 normal normal normal normal normal
Spleen [cm] 10 6 3 2 1 normal normal normal normal
Spleen volume
[mL]> 280 178 136 138 115 80 82
% Blasts PB 0 1 0 1 0 0 0 0 0
% Blasts BM 5 7 2 2 1
Platelets [G/L] 18 30 53 68 66 100 151 227 255
Monocytes [/µL] 2260 1270 220 790 270 148 45 130 160
Monosomy 7
(FISH)72% 58% 0% 0%
KRAS Mutation c.38 G>A c.38 G>A c.38 G>Anot
detected
Case: Disease Activity during Azazytinde Therapy
Furlan et al, Blood 2009