MDR0763Rp00011a Synopsis Technical Assessment Report D01
58
Expert Evaluation Panel – Synopsis Technical Assessment Report European Green Capital Award 2014 April 2012 www.europeangreencapital.eu
Transcript of MDR0763Rp00011a Synopsis Technical Assessment Report D01

Expert Evaluation Panel – Synopsis Technical Assessment
Report
European Green Capital Award 2014
April 2012
www.europeangreencapital.eu

TABLE OF CONTENTS
1 INTRODUCTION........................................................................................................................ 1
1.1 NEW APPROACH - ANNUAL AWARD.................................................................................... 2
1.2 AIM OF THIS REPORT ........................................................................................................ 3
2 EVALUATION PROCEDURE ............................... ..................................................................... 4
2.1 APPLICANT CITIES FOR 2014 AWARD................................................................................ 4
2.2 TWELVE INDICATOR AREAS............................................................................................... 6
2.3 APPLICATION FORM .......................................................................................................... 7
2.4 EXPERT EVALUATION PANEL ............................................................................................ 7
2.5 TECHNICAL EVALUATION PROCEDURE .............................................................................. 9
3 EVALUATION RESULTS ................................. ....................................................................... 11
3.1 BRISTOL ........................................................................................................................ 12
3.2 COPENHAGEN................................................................................................................ 13
3.3 FRANKFURT................................................................................................................... 14
4 DETAILED EVALUATION OF APPLICATIONS ................ ..................................................... 15
4.1 BRISTOL ........................................................................................................................ 15
4.1.1 Local contribution to global climate change ................................................... 15
4.1.2 Local Transport............................................................................................... 15
4.1.3 Green Urban areas Incorporating Sustainable land use................................ 16
4.1.4 Nature and biodiversity................................................................................... 16
4.1.5 Quality of local ambient air ............................................................................. 17
4.1.6 Noise pollution ................................................................................................ 17
4.1.7 Waste production and management .............................................................. 18
4.1.8 Water consumption ........................................................................................ 18
4.1.9 Waste water treatment ................................................................................... 19
4.1.10 Eco-innovation and sustainable employment................................................. 19
4.1.11 Environmental management of the local authority ......................................... 20
4.1.12 Energy performance....................................................................................... 20
4.2 COPENHAGEN................................................................................................................ 22
4.2.1 Local contribution to global climate change ................................................... 22
4.2.2 Local Transport............................................................................................... 22
4.2.3 Green Urban areas Incorporating Sustainable land use................................ 23
4.2.4 Nature and biodiversity................................................................................... 23
4.2.5 Quality of local ambient air ............................................................................. 23
4.2.6 Noise pollution ................................................................................................ 24
4.2.7 Waste production and management .............................................................. 24
4.2.8 Water consumption ........................................................................................ 25
4.2.9 Waste water treatment ................................................................................... 26

4.2.10 Eco-innovation and sustainable employment................................................. 26
4.2.11 Environmental management of the local authority ......................................... 27
4.2.12 Energy performance....................................................................................... 27
4.3 FRANKFURT................................................................................................................... 29
4.3.1 Local contribution to global climate change ................................................... 29
4.3.2 Local Transport............................................................................................... 29
4.3.3 Green Urban areas Incorporating Sustainable land use................................ 30
4.3.4 Nature and biodiversity................................................................................... 30
4.3.5 Quality of local ambient air ............................................................................. 30
4.3.6 Noise pollution ................................................................................................ 31
4.3.7 Waste production and management .............................................................. 31
4.3.8 Water consumption ........................................................................................ 32
4.3.9 Waste water treatment ................................................................................... 32
4.3.10 Eco-innovation and sustainable employment................................................. 33
4.3.11 Environmental management of the local authority ......................................... 34
4.3.12 Energy performance....................................................................................... 34
APPENDICES
APPENDIX A 2014 Application Form
APPENDIX B Expert Evaluation Panel Profiles
APPENDIX C Technical Ranking of 18 Applicant Cities for the European Green
Capital Award 2014 Title - Final Combined ranking by the EGC
Secretariat

European Green Capital Award Expert Evaluation Panel – Synopsis Technical Assessment
1
1 INTRODUCTION
The European Green Capital Award is the result of an initiative taken by 15 European cities (Tallinn, Helsinki, Riga, Vilnius, Berlin, Warsaw, Madrid, Ljubljana, Prague, Vienna, Kiel, Kotka, Dartford, Tartu & Glasgow) and the Association of Estonian cities on 15 May 2006 in Tallinn, Estonia. Their green vision was translated into a joint Memorandum of Understanding establishing an award to recognise cities that are leading the way with environmentally friendly urban living.
The establishment of this award is timely since Europe is now an essentially urban society, with three out of four1 Europeans living in towns and cities. Most of the environmental challenges facing our society derive from urban areas but it is also these urban communities that create and mobilise the commitment and innovation needed to resolve them. The European Green Capital Award aims to promote and reward these efforts.
It is important to reward cities which are making efforts to improve the urban environment and move towards healthier and sustainable living areas. Progress is its own reward, but the satisfaction involved in winning a prestigious European award spurs cities to invest in further efforts and boosts awareness within the city as well as in other cities. The award enables cities to inspire each other and share examples of good practices in situ. The winning cities to date include: Stockholm in 2010, Hamburg in 2011, Vitoria-Gastiez in 2012 and Nantes for 2013. All are recognised for their consistent record of achieving high environmental standards and commitment to ambitious goals.
It is important to note that the policy background of the European Green Capital Award is the Thematic Strategy on the Urban Environment (11th January 2006), which outlines the European Commission’s commitment to support and encourage Europe’s towns and cities to adopt a more integrated approach to urban management. This will ensure that Europe’s towns and cities become better places to live and reduce their environmental impact on the wider environment. The strategy also invites local and regional authorities to exploit the opportunities offered at EU level.
As the Thematic Strategy on the Urban Environment does not contain legislative measures, and because incentives are important, the European Green Capital Award can play a useful role here.
Similarly, the renewed Sustainable Development Strategy building on the Europe 2020 Strategy for an enlarged European Union aims to identify and develop actions that will enable the EU to achieve continuous improvement of the quality of life of both current and future generations. This can be done through the creation of sustainable urban communities which is precisely what the European Green Capital Award is promoting.
The objectives of the European Green Capital Award are to:
a) Reward cities that have a consistent record of achieving high environmental standards;
b) Encourage cities to commit to ongoing and ambitious goals for further environmental improvement and sustainable development;
c) Provide a role model to inspire other cities and promote best practice and experiences in all other European cities.
The overarching message that the award scheme aims to communicate to the local level is that Europeans have a right to live in healthy urban areas. Cities should therefore strive to improve the
1 As of 2012

European Green Capital Award Expert Evaluation Panel – Synopsis Technical Assessment
2
quality of life of their citizens and reduce their impact on the global environment. This message is brought together in the Award's slogan “Green cities – fit for life ”.
1.1 NEW APPROACH - ANNUAL AWARD
The European Green Capital award commenced in 2008 when the first cycle of the competition led to the inaugural award for 2010 going to Stockholm and Hamburg as the 2011 Green Capital. The second cycle completed in 2010 resulted in the Spanish City Vitoria Gasteiz becoming the 2012 Green Capital and Nantes in France becoming Green Capital in 2013.
For this third cycle of the European Green Capital Award, the approach has been revised to become an annual call to find one new Green Capital each year i.e. this cycle 2011 – 2012 will find the 2014 Award Winning City.
The evaluation format has also been modified in order to streamline the entire process whilst giving the Jury a more significant role in the process.
The Expert Evaluation Panel will now evaluate each of the 12 indicator areas and provide a ranking together with qualitative comments on each cities application. This ranking will be derived as a result of primary expert evaluation review, clarification from the cities and peer review from another expert (more details on this procedure in Section 2). This information is then presented to the Jury in the form of this report together with a number of proposed shortlisted cities. The number and list of shortlisted cities chosen to proceed to the next stage will be the ultimate decision of the Jury.
The shortlisted cities are invited to present their vision, action plans and communication strategy to the Jury. The Jury will assess the shortlisted cities based on the following evaluation criteria:
1) The city’s overall commitment, vision and enthusiasm as assessed by the expert panel and conveyed through the presentation
2) The city’s communication actions including:
• What has the city done to communicate to its citizens on various environmental issues in relation to the 12 indicators?
• Measurement of effectiveness of communication actions. Quantification of any changes in attitude, citizen behaviour, resource use etc.
• Revision to or proposed revision to certain aspects of the communication actions, including stakeholder comments and lessons learned.
• The extent of the cities local partnering to gain maximum social and economic leverage.
3) The city’s capacity to act as a role model to inspire other cities, promote best practices and spread the EGC model further – bearing in mind city size and location – including the city’s EGC communication strategy if they are to win.
European Green Capital Award Expert Evaluation Panel – Synopsis Technical Assessment
3
Based on the proposals from the expert panel & information presented to the Jury, the Jury will make the final decision and select the city to be awarded the title of European Green Capital 2014. The winner will be announced at an award ceremony in Vitoria-Gasteiz on the 29th June 2012 .
1.2 AIM OF THIS REPORT
This Technical Assessment report provides an overview of the new approach to this award. It presents the technical evaluation of the Expert Evaluation panel for each of the 3 shortlisted cities. This is presented per indicator per city for transparency of the overall process.
A Supplementary Report presents examples of good practice across all 12 indicators via examples taken directly from the Cities applications. Ideally both of these reports should be read in tandem.
Both of these reports are compiled and edited by RPS Group, Ireland, acting as Secretariat for the European Green Capital Award.
European Green Capital Award Expert Evaluation Panel – Synopsis Technical Assessment
4
2 EVALUATION PROCEDURE
2.1 APPLICANT CITIES FOR 2014 AWARD
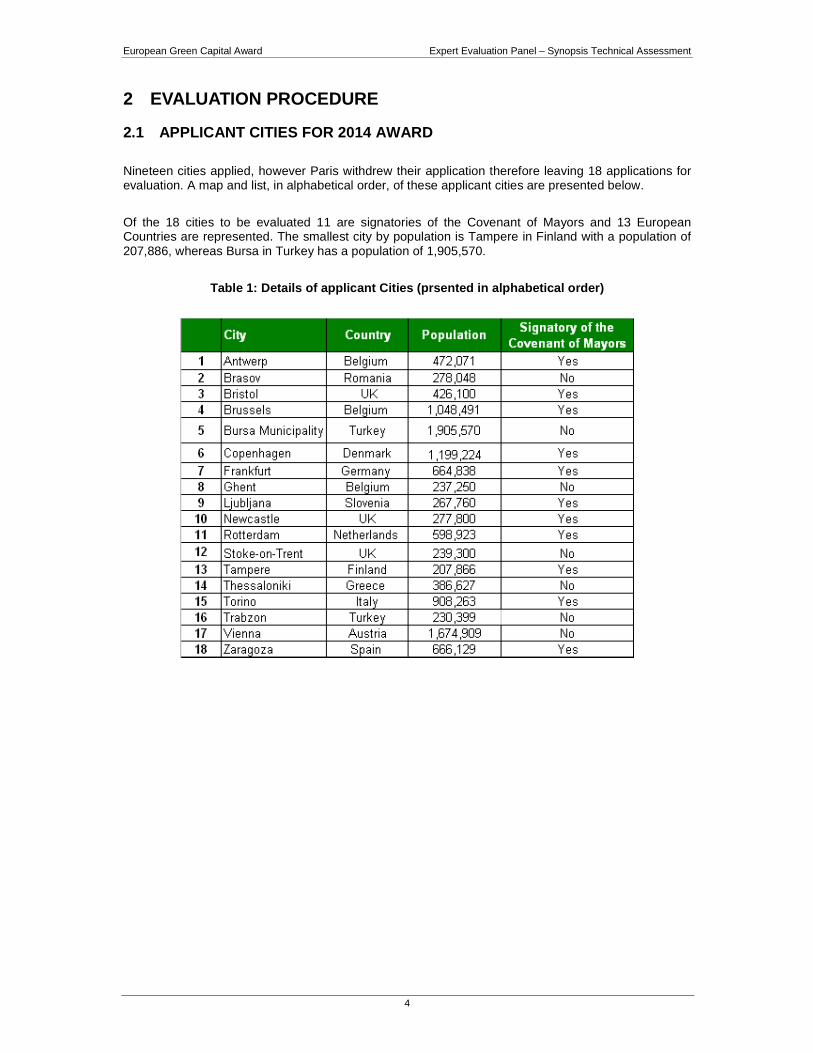
Nineteen cities applied, however Paris withdrew their application therefore leaving 18 applications for evaluation. A map and list, in alphabetical order, of these applicant cities are presented below.
Of the 18 cities to be evaluated 11 are signatories of the Covenant of Mayors and 13 European Countries are represented. The smallest city by population is Tampere in Finland with a population of 207,886, whereas Bursa in Turkey has a population of 1,905,570.
Table 1: Details of applicant Cities (prsented in a lphabetical order)

European Green Capital Award Expert Evaluation Panel – Synopsis Technical Assessment
5
European Green Capital Award Expert Evaluation Panel – Synopsis Technical Assessment
6
2.2 TWELVE INDICATOR AREAS
The selection of the European Green Capital 2014 is based on the following 12 environmental indicator areas:
1. Local contribution to global climate change
2. Local Transport
3. Green Urban areas Incorporating Sustainable land use*
4. Nature and biodiversity
5. Quality of local ambient air
6. Noise pollution
7. Waste production and management
8. Water consumption
9. Waste water treatment
10. Eco-innovation and sustainable employment**
11. Environmental management of the local authority
12. Energy performance***
* Previous stand alone indicators “Green urban areas” and “Sustainable land use” were merged into one key indicator “Green urban areas incorporating sustainable land us e”.
** New indicator “Eco-innovation and Sustainable Em ployment” was implemented as this combines a number of European initiatives to improve sustainability. Details of Technological innovations and sustainable employment from “Making our cities attractive and sustainable2”, a European Commission, Environment report.
“Technological innovation and creativity are indispensable for ensuring the sustainable future of cities. The promotion of creativity and innovation are central to the Europe 2020 strategy. The European Commission has supported programmes to integrate science and technology into all cities. These include RuNuP (“Role of universities in urban poles”) projects for small and medium-sized cities without university centers. Under the Environmental Technologies Action Plan (ETAP), the EU is promoting the adoption of eco-friendly technology projects such as recycling plants for wastewater from baths, showers and washing machines.
2http://ec.europa.eu/environment/europeangreencapital/wp-content/uploads/2011/04/Making-our-cities-attractive-and-sustainable.pdf

European Green Capital Award Expert Evaluation Panel – Synopsis Technical Assessment
7
Many of these initiatives are creating green jobs, ranging from mechanics trained to repair low emission vehicles to new enterprises building solar panels. The EU is supporting this type of job creation by providing €105b in green projects under its Cohesion Policy funds (2007 – 2013). The EU 2020 Strategy also puts innovation and green growth at the heart of its blueprint for competitiveness.”
It must be noted “green public procurement” (gpp) comes under indicator No. 11 Environmental management of the municipality.
***It was proposed to introduce an “Energy Performance ” indicator area. Cities make demands on a wide range of resources, from energy and water to minerals and metals. The EU’s Thematic Strategy on the Sustainable use of Natural Resources highlights the danger of using natural resources at a rate that exceeds their regeneration capacity. Green buildings that require less energy for lighting, heating and cooling through clever use of glass and innovative air flow systems, are an important component of the effort to achieve efficient and sustainable European cities.
Under this proposed indicator EU measures including the Energy Performance of Buildings Directive (2010/31/EC), which sets minimum standards requiring Member States to make new and existing buildings more energy efficient, and the EU’s Green Building Programme which encourages renewable energy to be integrated into non-residential buildings. Use of renewable energy in general could be benchmarked against The Renewable Energy Directive (2009/28/EC) which requires 20% of energy across the EU to come from renewable sources by 2020.
2.3 APPLICATION FORM
The format of the Application Form has been modified to ask cities to provide the following information for each of the 12 indicator areas. A copy of the Application Form is attached in Appendix A . The information requested is based on the EMS principles: plan, do, check and act.
Plan: Present details of the original and/or most recent Action Plan, including any relevant disadvantages resulting from historical and/or geographical factors which may have influenced this indicator area negatively.
Do & Check: Details of those targets achieved or not, to date (within the last 5 – 10 years). Provide
a review of how both situations occurred and lessons learned.
Act: Plans to meet or revise key targets for the future and proposed approach to achieve these.
2.4 EXPERT EVALUATION PANEL
The evaluation panel consists of experts who bring internationally recognised expertise within each of the areas covered by the indicators to the process. Profiles for each of the experts can be found in Appendix B
1. Local contribution to global climate change
Mr. Chris Bremmer, Business Line Manager ‘Sustainable Cities’, TNO (Netherlands Organisation for Applied Scientific Research), Utrecht, The Netherlands. [email protected]

European Green Capital Award Expert Evaluation Panel – Synopsis Technical Assessment
8
2. Local transport
Dr. Henrik Gudmundsson, Senior Researcher, Department of Transport, Technical University of Denmark. [email protected]
3. Green urban areas incorporating Sustainable land use
Ms Ir. Hedwig van Delden, Director, Research Institute for knowledge systems (RIKS), Maastricht, The Netherlands. [email protected]
4. Nature and biodiversity
Mr Stamatis Chondrogiannis, Expert at the Commission on Ecosystem Management, IUCN, Greece. [email protected]
5. Quality of local ambient air
Dr. Steen Solvang Jensen, Senior Scientist, Department of Environmental Science, Aarhus University, Denmark. [email protected]
6. Noise pollution
Mr. J. Luis Bento-Coelho, Professor, Instituto Superior Técnico, Lisbon, Portugal. [email protected]
7. Waste production and management
Mr Larry O’Toole, Director, Waste and Energy Division, RPS Consulting Engineers, Dublin, Ireland. [email protected]
8. Water consumption
Mr Giovanni Bidoglio, Head of Water Resources Unit, Institute for Environment and Sustainability, Joint Research Centre, European Commission, Italy. [email protected]
9. Waste water treatment
Ms Eduarda Beja Neves, Principal Researcher, Hydraulic and Environment Department, National Laboratory of Civil Engineering, Lisbon, Portugal. [email protected]
10. Eco-innovation and sustainable employment
Mr. Lars Mortensen, Head of Group, Sustainable Consumption & Production and Waste, European Environment Agency, Denmark. [email protected]
11. Environmental management of the municipality
Ms Maria Berrini, Director, Ambiente Italia, Milan, Italy. [email protected]
12. Energy performance
Mr Per G Berg, Professor in Landscape planning with a special focus on Sustainable Community Development at the Swedish University of Agricultural Sciences in Uppsala.

European Green Capital Award Expert Evaluation Panel – Synopsis Technical Assessment
9
2.5 TECHNICAL EVALUATION PROCEDURE
2.5.1 Primary Technical Review
The Experts were asked to evaluate each application based on its own merit and then benchmark all applications against each other within each indicator area. Each indicator area has three component parts as per the EMS principles. Each part carries equal consideration by the expert .
2.5.2 Clarifications
The Expert Evaluation Panel members were given the opportunity to ask clarifications of the applicant cities on the basis that questions could only be asked on information already received i.e. no new information could be requested from the applicant cities.
2.5.3 Ranking Criteria
A new ranking system was introduced this cycle for use by the experts.
Under this ranking system a rank of 1st, 2nd, 3rd etc is applied to each city per indicator. Since there are 18 applications to be evaluated then each city must be ranked from 1st as the best to 18th the weakest. Note: these are not quantitative scores but ranking s.
2.5.4 Peer Review
It is important to note that a peer review was carried out for the technical evaluation round. All evaluation panel members assessed their respective primary indicator, and each indicator was also assessed by a second panel member (co-evaluator). This peer review excercise ensures a quality check of the evaluation process. Where the two experts differ radically on a ranking, they must work together to reach a consensus. The final ranking is a combination of both reviewers evaluations.

European Green Capital Award Expert Evaluation Panel – Synopsis Technical Assessment
10
Table 2: Indicators and corresponding Main Evaluato rs & Co-Evaluators
Indicator Main Evaluator Co-Evaluator
1. Local contribution to global climate change
Mr. Chris Bremmer
Dr. Henrik Gudmundsson
2. Local transport
Dr. Henrik Gudmundsson Mr J. Luis Bento Coelho
3. Green urban areas Incorporating Sustainable land use
Ms Ir. Hedwig van Delden Mr Stamatis Chondrogiannis
4. Nature and biodiversity
Mr Stamatis Chondrogiannis Ms Ir. Hedwig van Delden
5. Quality of local ambient air
Dr. Steen Solvang Jensen Mr. Chris Bremmer
6. Noise pollution Mr J. Luis Bento Coelho Dr. Steen Solvang Jensen
7. Waste production and management
Mr Larry O’Toole Ms Maria Berrini
8. Water consumption
Mr Giovanni Bidoglio Ms Eduarda Beja Neves
9. Waste water treatment
Ms Eduarda Beja Neves Mr Giovanni Bidoglio
10. Eco-innovation and sustainable employment
Mr. Lars Mortensen Mr. Per Berg
11. Environmental management of the municipality
Ms Maria Berrini Mr Larry O’Toole
12. Energy Performance
Mr. Per Berg Mr Lars Mortensen

European Green Capital Award Expert Evaluation Panel – Synopsis Technical Assessment
11
3 EVALUATION RESULTS
Based on the technical evaluation results, the Evaluation Panel would like to propose to shortlist the following three cities (in alphabetical order) for the title of European Green Capital 2014:
Bristol - Copenhagen - Frankfurt
It must be noted that all of the shortlisted cities show excellence across all of the 12 indicator areas. The other applicant cities also display excellence in many areas, but none as consistently as the three shortlisted ones.
The Evaluation Panel’s detailed ranking for all indicator areas for all of the applicant cities including the three shortlisted ones is provided in Appendix C.
It is the recommendation of the Evaluation Panel that the July takes the Panel’s rankings into consideration as it represents the most condensed expression of the Evaluation Panel’s joint assessment efforts.

European Green Capital Award Expert Evaluation Panel – Synopsis Technical Assessment
12
3.1 BRISTOL
Bristol is located in South West England and has a population of 441,300 (as of 2011). It is England's sixth and the United Kingdom's eighth most populous city.
Despite the absence of statutory responsibility, Bristol has been working to reduce the city’s contribution to climate change since 2000 and it has developed and delivered a series of strategies and action plans in order to achieve this.
Bristol demonstrates its cutting edge commitment to reducing climate change through UK pilot of the Local Governments for Sustainability (ICLEI)’s Cities for Climate Protection programme in 2000. The Council prepared an emission inventory and developed the Bristol Climate Protection and Sustainable Energy Strategy that set a target to reduce emissions by 60% by 2050 from a 1990 baseline. Bristol was one of the first UK Councils to adopt such a strategy. And then in 2009 Bristol joined the Covenant of Mayors and set more ambitious CO2 reduction targets than the EU and UK, to reduce emissions by 40% by 2020 and 80% by 2050 from a 2005 baseline. To meet these commitments Bristol created the current strategy and action plan – The Climate Change and Energy Security Framework.
Clean air is essential for healthy citizens, as such Bristol has one of the most comprehensive air quality monitoring networks in the UK. It is now focussed on monitoring the key road traffic pollutants of nitrogen dioxide and PM10. Monitoring sites are located in worst–case locations where there is residential exposure, in line with national guidance. During the period 2006 – 2011 traffic flows in the central area declined and congestion reduced. These achievements should have resulted in improved air quality. However, national factors such as the increased penetration of diesel in the fleet and the under–performance of EURO standards for specific engine types means that NO2 levels have been static in the city. Bristol has plans to manage transport to improve air quality. These are set out in the Joint Local Transport Plan that plans transport across the city region to 2026.
Bristol has been actively managing noise for over 10 years, which is very impressive. It has created a series of plans to manage noise through land use, pollution control and transport improvements. Bristol undertakes a statistically robust annual survey of the population asking about noise, as part of its Quality of Life Survey. This allows data to be produced for the city as a whole and at neighbourhood (ward) level.
Last but not least, the 2002 action plan for environmental management system implementation began with those departments with the most significant operational environmental impacts and risks, such as transport, catering, cleaning, grounds maintenance and joinery. The first EMAS registration was achieved in 2004. Bristol is one of only three City Councils in the UK that have an EMAS registration.

European Green Capital Award Expert Evaluation Panel – Synopsis Technical Assessment
13
3.2 COPENHAGEN
The City of Copenhagen covering an area of 74.4 km2 is the capital of Denmark and its most populous city, with a city population of 541,989 (as of 1 January 2011).
In terms of Energy Performance, an estimated 75% of the CO2 reductions will come from initiatives in relation to the city’s energy system. The main tool will be to increase the share of renewable energy in the City’s district heating. This will primarily be done by switching fuel from coal to biomass at the major combined heat and power plants in the City. By 2025 the district heating is expected to be almost entirely based on renewables.
The City of Copenhagen has set itself the overall goal to be the world’s best city for cyclists! Since 2007 this has set the framework for measures in the cyclist area. The goal is to have 50% of people cycling to work or their place of education in Copenhagen in 2015 (in 2010 there was 35%), thereby contributing to meeting the goal of CO2 neutrality by 2025. This initiative shows excellent “buy-in” from all City stakeholders, as does the Cities pedestrian strategy, which aims to encourage more people to walk more. The vision is “we will organise the city so that people choose to walk, and this will contribute to a living city with good city life and a good urban environment (...)”. The goal is that in 2015 pedestrian traffic will have increased by 20% compared to 2009.
Public-private partnerships are at the core of the City’s approach to eco-innovation and sustainable employment. Through dedicated forums the City is working with green companies, universities and organisations on developing and implementing green growth. An important partner in this regard is the Copenhagen Clean-tech Cluster, which works to create continuous growth for existing clean-tech companies, support new clean-tech companies and attract more foreign cleantech companies to Copenhagen.
It is official municipal policy in Copenhagen that all citizens by 2015 must be able to reach a park or beach on foot in less than 15 minutes. In line with this policy, several new parks are under development in areas lacking green spaces.
In terms of Environmental Management, Copenhagen City is very advanced with organic food accounting for the largest market share currently amounting to 68%. It is estimated that one in every ten purchases is organic in Copenhagen. Under the cities environmental strategy a target has been set for solely organic food to be served in 90% of old-age homes and residential homes for children and young persons by 2015.
Copenhagen has repeatedly been recognised as one of the cities with the best quality of life. It is also considered one of the world's most environmentally friendly cities.
European Green Capital Award Expert Evaluation Panel – Synopsis Technical Assessment
14
3.3 FRANKFURT
Frankfurt, is the largest city in the German state of Hesse and the fifth-largest city in Germany, with a 2011 population of 664,838. The city is at the centre of the larger Frankfurt Rhine-Main Metropolitan Region which is Germany's second-largest metropolitan region.
Frankfurt demonstrates a commitment to energy performance via long-term development of energy production efficiency, the continuous development of co-generation plants, the implementation of the Energy Act coupled with municipal and private investments in energy conservation.
The City authorities are also rising to the challenges of global climate change and are pursuing climate protection and adjustment strategies. They contribute actively to numerous networks and cooperation projects. An important part of many Frankfurt projects is public relations work, the aims being to encourage the Cities stakeholders to participate in climate protection activities and to enhance public awareness of the issues.
In working towards a sustainable, efficient recycling system, Frankfurt has achieved a great deal. Total volumes of waste have been decreasing for years. The share of residual waste requiring removal has almost halved in the past two decades. The introduction of light packaging and biowaste bins has had a substantial impact. The city has invested heavily in modern waste sorting, processing and recycling equipment within the city area, thus cutting down on transport costs.
The decrease of water consumption by households and small businesses of 14% over the period 1990 – 2010, despite an 8.5% growth in population, is a remarkable achievement by Frankfurt. Key water targets are reviewed annually to ensure continuity of objectives, as initially established in the Action Plan on “Sensible Water Use in Frankfurt”, towards a further reduction of water consumption. Future climate change impacts on groundwater resources are considered in Frankfurt’s climate adjustment strategy, which includes measures to counteract estimated seasonal changes of rainwater precipitation trends.
Interestingly, Frankfurt residents prefer to travel by bus, train or bike or to walk. They use buses and trains for 24% of all journeys in the city area and complete 35% of their journeys on foot. Bicycle use has more than doubled to 15% in the past ten years.
Citizens of Frankfurt have access to numerous green open areas and expanses of water which cover roughly half the overall City area, inlcuding palm trees beside the River Main, sand dunes in the GreenBelt, wilderness areas at the former military airfield, play areas, large woodland areas, orchard meadows, the broad Nidda valley with its fields and meadows and the well-tended banks of the Main are all attractive leisure areas. There is also access to the GreenBelt around Frankfurt’s core which accounts for one third of the overall city area. It has a variety of landscapes and a wide range of natural species. The GreenBelt stands for a high quality of living and is a popular leisure area. The total share of public green areas is 47% and that of expanses of water 2%, when private areas are inlcuded these figures increase dramatically.
European Green Capital Award Expert Evaluation Panel – Synopsis Technical Assessment
15
4 DETAILED EVALUATION OF APPLICATIONS
Final ranking in tabular form for current applicant cities can be found in Appendix C
4.1 BRISTOL
4.1.1 Local contribution to global climate change
Main evaluator: Mr. Chris Bremmer
Co-evaluator: Dr. Henrik Gudmundsson
Ranking: 1st
Comments: Bristol demonstrates moderately low emissions per capita with a strong decreasing trend from 2005 – 2009 of 20%. The Climate Change and Security Framework commits Bristol to 40% reduction of emissions by 2020 and 80% by 2050 from a 2005 baseline. Bristol has clear targets and current progress is on track. These targets are supported by allocated funds.
There is a clear focus on energy efficiency and savings in the built environment in Bristol. Planning for renewable energy production has just begun and focuses on wind, solar and biomass for public energy demand and district heating opportunities. Detailed information on funding is provided along with details of the current action plan.
4.1.2 Local Transport
Main evaluator: Dr. Henrik Gudmundsson
Co-evaluator: Mr. J. Luis Bento Coelho
Ranking: 4th
Comments: Documented performance for the four local transport indicators in Bristol is not (yet) very high compared with leading European cities, partly due to difficult starting conditions, but Bristol's efforts to plan for and implement improvements of its transport system appear comprehensive, well documented, and highly successful in several areas. Even with limited control over local public transport, the city has still contributed to improve the systems' patronage and performance in several dimensions; results in the area of traffic safety and cycling seem also particularly impressive, whereas air pollution is not improving.
The planning framework, which includes quantitative performance targets, extensive monitoring, coordination with land-use planning and with neighbour municipalities is excellent, and certainly among the most advanced and well described anywhere. Future broad range of investments and measures partly depending on central government support (applied for). An ability to critically reflect and learn valuable lessons is evident, which demonstrates Bristol’s potential as inspiration for other cities struggling with transformations of its local transport system.

European Green Capital Award Expert Evaluation Panel – Synopsis Technical Assessment
16
4.1.3 Green Urban areas Incorporating Sustainable l and use
Main evaluator: Ms. Ir. Hedwig van Delden
Co-evaluator: Mr. Stamatis Chondrogiannis
Ranking: 5th
Comments: The city's green areas have been fragmented by historical development. Bristol City Council has adopted a new land use policy (the Core Strategy) that identifies a Strategic Green Infrastructure Network and aims to link green spaces and to protect, enhance and where possible extend the network.
The original Bristol Local Plan has successfully promoted brownfield developments and densification of the city centres, and avoided development on greenfields. Planning of high quality, mixed use developments in the city centre have attracted large numbers of residents into the city centre.
Bristol has been improving the quality of the public realm across the city through the Legible City project which included a pedestrian signage and mapping system to help residents and visitors to use the urban environment with confidence and pleasure, neighbourhood identity markers and public art installations to create a sense of place, and high quality street furniture and public realm designs.
Bristol has actively engaged with communities in planning land use and green areas and for the future aims to enhance local decision making on green areas. Bristol adopts an integrated approach to spatial planning in which green urban areas, quality of life and coping with climate change are included. Flood maps are thus being used to influence spatial planning decisions, the management of critical assets, raising community awareness and emergency preparedness.
4.1.4 Nature and biodiversity
Main evaluator: Mr. Stamatis Chondrogiannis
Co-evaluator: Ms. Ir. Hedwig van Delden
Ranking: 4th
Comments: There is a set of plans including a Biodiversity Action Plan that covers many areas and species while working positively on cross cutting themes. The Wildlife Network including sites and corridors that provides a link between the city and the wider countryside is very well planned. Protection of nature is also offered in other open spaces outside of designated wildlife spaces.
The Parks and Green Space Strategy, adopted in 2008, is a good initiative that encourages people to visit the natural green spaces of the city. Interesting promotional activities, connected also with tourism, involve large groups of volunteers and members but could extend more to young people and school children.
Concrete future plans are presented together with targets for the years 2013, 2015 and 2020, along with concrete plans for the protection of biodiversity in other open spaces.

European Green Capital Award Expert Evaluation Panel – Synopsis Technical Assessment
17
4.1.5 Quality of local ambient air
Main evaluator: Dr. Steen Solvang Jensen
Co-evaluator: Mr. Chris Bremmer
Ranking: 1st
Comments: Bristol has a long historic tradition for air quality management. Recent plans are the Bristol Air Quality Action Plan (2004) and the Joint Local transport plan 2005-2011, updated with 2011-2026. There are fixed continuous sites and many NO2 passive sites within the designated Air Quality Management Area (AQMA).
Targets are to improve air quality in the AQMA and to ensure that air quality in all other areas remains better than the national standards by means of reduction of congestion by reducing demand for and promoting alternatives to the private car, and improvement of the accessibility to employment, education and services. The geographic location of the city is a disadvantage for air quality due a "bowl" effect on cold clear winter days.
All targets are achieved except annual and hourly NO2. This is due to increased penetration of diesel cars in the fleet and the underperformance of EURO standards for specific engine types leading to static NO2 levels in the city.
The Air Quality Management Plan is now part of the Joint Local Transport Plan, and covers the whole of Bristol City. Several measures within traffic management and congestion management are listed and comprehensive public information is available.
The Joint Local Transport Plan 2011-2026 has many traffic measures to improve air quality and dedicated funds. UK Government air quality plan aims to secure compliance with NO2 limit values in 2015 also considering Low Emission Zone as new measure.
4.1.6 Noise pollution
Main evaluator: Mr. J. Luis Bento Coelho
Co-evaluator: Dr. Steen Solvang Jensen
Ranking: 1st
Comments: Bristol states a belief in the rights of the citizens to a healthy life. Municipal strategies include a database on residents’ complaints, annual survey, noise management and control practices with education and enforcement, and a proactive control of licenced premises.
Records of exposure to noise are good. The "resident’s perception of noise" is a factor on the municipal policies. Data on population concerns on noise is provided with a continuous drop from 49% in 2005 to 39% in 2009, though an increase to 46% in 2010 was reported.
Mobility is managed with consultation with residents. A model for quiet areas is being prepared. Bristol integrates all noise sources except noise at the workplace and searches for an active improvement of the urban soundscape with the involvement of the citizens and most players. The strategies seem to follow the best practices.

European Green Capital Award Expert Evaluation Panel – Synopsis Technical Assessment
18
4.1.7 Waste production and management
Main evaluator: Mr. Larry O’Toole
Co-evaluator: Ms. Maria Berrini
Ranking: 7th
Comments: Bristol has a strong recycling performance and has implemented a good rollout of the collection network for source separation of recyclables.
There is a good reduction in waste generation per capita which may be attributable, in part, to good awareness campaigns in place within the City with emphasis on being proactive on prevention/awareness with schools, businesses, householders etc.
Use related charges are only referenced for green waste. Education programmes appear to be led by the waste contractor so this could impact on effectiveness. Recent data shows a high % of waste (62%) and in particular biodegradable municipal waste (BMW) (50%) being disposed of to landfill although a new Mechanical Biological Treatment (MBT) plant will address the BMW fraction. Solid Recovered Fuel (SRF) is currently exported to Holland although a new Waste to Energy plant is currently being built in the City.
4.1.8 Water consumption
Main evaluator: Mr. Giovanni Bidoglio
Co-evaluator: Ms. Eduarda Beja Neves
Ranking: 7th
Comments: Bristol has quite a low level of domestic water metering (35% against 85% for non-domestic properties). Efforts by the City Council and the water company to limit consumption are however evident, as shown by the initiatives for leakage prevention and repair. The sustainable level of leakage is estimated on a yearly basis taking into consideration the full life-cycle and relative costs of saved water and costs necessary to achieve further reduction of losses. In 2010 water loss was in the order of 18%. 50 million pounds will be invested during the next 5 years for renovation of pipes and other water infrastructure.
Bristol does not have problems with water supply to date. Annual ad-hoc awareness campaigns backed up by advice provided on a continuous basis through web-services, educational programmes for children and free distribution of water-efficient equipment helped reduce water use. Per capita consumption decreased from a peak value of 158 l/inhabitant/day in 2004 to 146 l/inhabitant/day in 2010. No exact target has been set for further water reduction.
The value of the recreational service provided by water ecosystems in the Bristol area is appreciated and citizens appear to be willing to subsidise their management through their water bills.
Bristol Water has developed a strategic business plan addressing impacts of climate change using as reference a report on water resources from DEFRA. Investments have been made to implement initiatives up to the year 2017 which are intended to secure good quality water for an increased number of residents.

European Green Capital Award Expert Evaluation Panel – Synopsis Technical Assessment
19
4.1.9 Waste water treatment
Main evaluator: Ms. Eduarda Beja Neves
Co-evaluator: Mr. Giovanni Bidoglio
Ranking: 8th
Comments: The water supply system is owned and operated by Bristol Water plc, which is a subsidiary of Sociedad General de Aguas de Barcelona S.A. (Agbar). The sewerage and sewage treatment systems are owned and operated by Wessex Water Services Ltd (WWSL) witch is a subsidiary of YTL Corporation Berhad (Malaysia). Ofwat (the water sector’s economic regulator in England and Wales) determines investment with representations from the Drinking Water Inspectorate, the Environment Agency and Natural England. These three quality regulators oversee compliance with European and UK water and wastewater regulation. Protection against fluvial and coastal flooding is the responsibility of the Environment Agency.
WWSL developed a high level waste water plan for collecting and treating sewage accommodating all demands for new connections and; full compliance with all European and UK wastewater regulation; co-operating with others on a sustainable way to meet the objectives of the Water Framework Directive; and working towards carbon neutrality.
In what relates to access to service, 100% of the city’s population is connected to mains sewerage, and the to Avonmouth sewage treatment works.
In what relates to flood occurrences and management, Wessex Water owns and maintains the 2000 km of public sewers in the Bristol City Council area. Around 50% of this is foul / combined sewerage and 50% surface sewerage (i.e. rainwater only). Half of the surface sewerage drains into combined sewers and the other half drains to watercourses. During the last 50 years more than £300m has been invested in Bristol’s sewerage system, partly to avoid flooding of properties and certain outside areas.
Reference is made to economic sustainability. WWSL claims to be one of the best performing water companies in the UK.
In reference to environmental sustainability, WWSL and BCC both work to improve the quality of the city’s watercourses, through management of sewerage and drainage and raising awareness among water users.
Bristol is informative and shows an experienced and structured performance.
4.1.10 Eco-innovation and sustainable employment
Main evaluator: Mr. Lars Mortensen
Co-evaluator: Mr. Per Berg
Ranking: 7th
Comments: Bristol’s commitment to eco-innovation and sustainable employment has been a core tenant of the Bristol Community Strategy, adopted in 2003 and updated in 2010. The current version is Bristol’s 2020 Plan identifying climate change as the biggest challenge facing the city region.
European Green Capital Award Expert Evaluation Panel – Synopsis Technical Assessment
20
Bristol has one of the largest emission trading scheme (ETS) sectors in the UK, with 3.2% of jobs in the sector compared to other major English cities having 2.5% and the UK average 2.7%.
Since 2005 the city has worked together with universities to establish Low Carbon South West - a trade network involving 3000 businesses and organizations.
Bristol has successfully improved its carbon efficiency by 40% from 2005 to 2009.
Bristol has an ambitious and innovative transport strategy including intelligent transport systems, hydrogen technology and water taxi. The city also has active bottom-up community led innovation initiatives, including for example markets, a local exchange and trading (LET) currency system, festivals and an energy co-operative.
4.1.11 Environmental management of the local author ity
Main evaluator: Ms. Maria Berrini
Co-evaluator: Mr. Larry O’Toole
Ranking: 2nd
Comments: Environmental Management has been in use for a long time in Bristol and is well supported by 5 dedicated members of staff. Audit and improvement programmes are set for water saving and waste treatment. A dedicated website informs citizens and stakeholders about achievements to date.
Bristol is encouraging schools to follow the international Eco Schools programme. Currently 16 of the 120 schools in Bristol hold the top award, the “Green Flag”, and increase from 13 in 2010. Energy use reduction in schools is also a main aim of Bristol.
Bristol has a number of initiatives to reduce carbon, for fleet and business mileage, from waste production and the carbon footprint of corporate procurement.
Bristol is the first Council in the UK to have undertaken a detailed assessment of the carbon footprint of all its procurement activities. Using this information BCC is targeting key contracts and procurement areas. Priorities include:
• The reductions in emissions (32%) in the municipal waste contract described above.
• Initiatives to increase the use of locally-produced food
• Assessment of the carbon footprint of future contracts as part of the procurement process.
4.1.12 Energy performance
Main evaluator: Mr. Per Berg
Co-evaluator: Mr. Lars Mortensen
Ranking: 5th
European Green Capital Award Expert Evaluation Panel – Synopsis Technical Assessment
21
Comments: From a very modest situation with high-energy demanding houses and quite small renewable energy sources’ contribution, Bristol exemplifies an ambitious self-initiative based start of a fairly quick transformation of the community to a sustainable energy economy.
An interesting example on the re-assessment of energy goals: the first modest goals were launched 1996, the second - much more ambitious - during 2009. On the planning side the development is encouraging and a good example for other municipalities how to act independently in Britain. Bristol have discovered the economic potential in energy saving, energy efficiency and long-term economic benefits of renewable energy.
The dynamics of the future renewable mix is still not clear since Bristol is still in the planning stage and a realistic forecast requires real examples and real achievements in the area. The range and content of the planning is really inspiring.
Coming from a late start and low performance energy situation, Bristol is likely to lead the development in Britain over the coming decades.
Bristol has also mentioned important aspects of energy use with their technical interest in energy-efficient and environmentally friendly cars and in their commitment to use the already historically compact city for an improved public transport, bicycle traffic and – in conjunction with that – also improvement of the capacity to become a walkable city.

European Green Capital Award Expert Evaluation Panel – Synopsis Technical Assessment
22
4.2 COPENHAGEN
4.2.1 Local contribution to global climate change
Main evaluator: Mr. Chris Bremmer
Co-evaluator: Dr. Henrik Gudmundsson
Ranking: 2nd
Comments: Copenhagen has moderately low per capita emissions in 2010, with a decreasing trend since 2005. There is a decreasing trend in the emission factor for electricity (5%) and district heating (16%) over the same period. The city is strong on district heating and achievements on improved energy efficiency in new and existing buildings, transport and building the necessary public engagement.
Copenhagen adopted the Copenhagen Climate Plan in 2009, which has the objective to reduce GHG emissions by 20% by 2015 when compared to 2005 levels and sets the goal that Copenhagen is to be carbon neutral by 2025 (full compensation of use of fossil fuels by renewable energy). Necessary funding has been secured, including a loan guarantee for a wind turbine park. Monitoring of the plan is secured through the Climate Secretariat.
4.2.2 Local Transport
Main evaluator: Dr. Henrik Gudmundsson
Co-evaluator: Mr. J. Luis Bento Coelho
Ranking: 1st
Comments: Copenhagen has a comprehensive series of adopted and emerging plans to improve the transport system and its environmental performance. Copenhagen has population growth but has managed to stabilise car traffic levels and enhance other modes. Cycling and public transport are areas for strategic intervention, where Copenhagen starts from an already accomplished level, for example with further substantial expansions of its Metro.
Copenhagen performs well in all four indicators of current local transport, although data for two of the indicators do not match the required information exactly. The City's achievements and plans are particularly impressive in the area of cycling, while Copenhagen has come far and now aims to become the world’s best, no less, with 50% of all work/education trips to be done by this mode by 2025, possibly the most ambitious target for a comparable city anywhere.
The existing and new plans under preparation are rather comprehensive with regard to the areas required to be an environmentally leading city in the area of local transport, with goals, targets and measures in several areas being adopted, monitored and reported on. Details on how much the proposed measures (e.g. electric vehicle promotion) will help to reach the most ambitious targets (e.g. with regard to carbon neutrality) are not provided, and there is limited information on committed funding.

European Green Capital Award Expert Evaluation Panel – Synopsis Technical Assessment
23
4.2.3 Green Urban areas Incorporating Sustainable l and use
Main evaluator: Ms. Ir. Hedwig van Delden
Co-evaluator: Mr. Stamatis Chondrogiannis
Ranking: 2nd
Comments: In 2007, the City of Copenhagen adopted "Eco-metropolis - our vision for Copenhagen 2015", which aims among other things to reduce the average distance to green areas and stimulate that Copenhagen citizens use the city's green areas for longer periods.
In 2004, the City of Copenhagen published the "Park Policy - The Green Copenhagen" which aims to create a common foundation for the city's management of the green areas and to create a solid base for incorporating development and management of green areas in other municipal planning. Planning for new and renewed urban areas is focused on mixed areas with housing and other functions such as workplaces, institutions and shops. Besides creating recreation possibilities in the green areas, there is also a focus on using the beaches and bathing in the clean sea water in the ports.
All green areas in Copenhagen are protected and nothing can be built there. Copenhagen is also covered by the national planning directive for the planning of the Greater Copenhagen area (Finger Plan 2007). To meet the needs of future generations, the City of Copenhagen has drawn up urban life accounts and a catalogue of recreational trends emphasising life-style values of Copenhageners, how Copenhageners use green areas as well as their wishes and needs.
4.2.4 Nature and biodiversity
Main evaluator: Mr. Stamatis Chondrogiannis
Co-evaluator: Ms. Ir. Hedwig van Delden
Ranking: 2nd
Comments: Copenhagen provides a strategy of continuous, interesting and effective activities for the public and especially for young people in relation to nature and biodiversity.
There is an update of the “Room for Nature – A Strategy for Biodiversity” every four years and the revision of the activities each year to ensure the continuation of plans. Similar is the adoption in 2007 of a revised “Finger Plan”.
Citizen’s participation in the development of green areas through the parks users council is an excellent initiative, important also for the protection of nature in these spaces.
4.2.5 Quality of local ambient air
Main evaluator: Dr. Steen Solvang Jensen
Co-evaluator: Mr. Chris Bremmer

European Green Capital Award Expert Evaluation Panel – Synopsis Technical Assessment
24
Ranking: 5th
Comments: The Copenhagen NO2 annual limit value is exceeded at one measurement station and modelled to be exceeded in 29 out of the 138 selected busy streets in 2010. The Danish Environmental Protection Agency has a NO2 Air Quality Plan from 2011 to be able to meet NO2 limit value in 2015 in Copenhagen. It includes measures like Low Emission Zone (LEZ) from 2008, new green taxis, energy labelling of cars, exemption from taxes for electric cars, and fuel consumption taxes for cars and vans. The effects of the measures are quantified. LEZ is the most efficient measure followed by green taxies. One of the only plans that specifically relate to compliance to EU limit values by 2015.
Copenhagen aims to be the capital city with the best urban environment in the world by 2015, and among other things a clean and healthy big city (Eco-metropolis). One of the goals is that by 2015 the air should be so clean that Copenhagen’s citizens’ health will not be damaged. A number of initiatives have been implemented to improve air quality. The city is in flavour of introduction of a congestion charging scheme in Copenhagen and more stringent LEZ that not only includes heavy-duty vehicles as at present but also older vans and petrol cars. Both measures require national legislation to be passed. Future implementation of congestion charges and strengthen of LEZ are very likely to ensure compliance of the limit value for annual NO2 in 2015.
4.2.6 Noise pollution
Main evaluator: Mr. J. Luis Bento Coelho
Co-evaluator: Dr. Steen Solvang Jensen
Ranking: 4th
Comments: The goals of the city for a low noise environment are well laid out. Figures for exposure of population to noise show high values, though possibly due to the calculation procedures to assign population to noise. A noise action plan was adopted in 2010, it has a number of measures directed to traffic: traffic management, low noise pavements, speed reduction, improvement of public transportation, improvement of conditions for cyclists, initiatives on electric and hydrogen cars.
Other items of note include the full renovation of schools with noise considerations "where necessary and possible", noise insulating windows in existing houses, and noise constraints in new housing developments with limit values. Targets are not specified. Involvement of citizens is not clear.
4.2.7 Waste production and management
Main evaluator: Mr. Larry O’Toole
Co-evaluator: Ms. Maria Berrini
Ranking: 3rd
Comments: Copenhagen demonstrates a strong recycling performance and excellent diversion of BMW from landfill with a good rollout of the collection network for source separation of wastes including bulky wastes and difficult wastes.

European Green Capital Award Expert Evaluation Panel – Synopsis Technical Assessment
25
There is a good performance on waste generation per capita at 380kg/year and there is a very strong commitment shown to waste prevention/reduction through awareness campaigns and initiatives with an increased focus on managing waste as a resource.
Reuse facilities are located at most recycling centres which is a positive initiative. Incineration plants are connected to the district heating scheme thereby maximising efficiency. Whilst a commitment to source separation is mentioned throughout the application however, there is perhaps a slight over-reliance on incineration - recycling rates could be higher (currently 27% for household waste) reflecting the fact that the separate collection of organic waste does not appear to be widespread. The City has not demonstrated that this is to be addressed in a significant manner and an absolute commitment to significantly increasing recycling rates through specific initiatives has not been shown. Overall however a very strong performance.
4.2.8 Water consumption
Main evaluator: Mr. Giovanni Bidoglio
Co-evaluator: Ms. Eduarda Beja Neves
Ranking: 2nd
Comments: Domestic water consumption in Copenhagen decreased from 170 l/inhabitant/day in 1987 to 108 l/inhabitant/day in 2010. Pro-active initiatives have been taken for replacement of old pipes in areas where excavations are planned. All households and companies are metered. Interestingly, the installation of individual water meters in multi-apartment properties was found to result in a decrease of 20% of water consumption with respect to shared metering. Some projects for green roofs and collection of rainwater for recycling have been implemented.
As the water tariff system is based on the “no-profit” principle, either the present price for cubic meter is already high to motivate people or awareness campaigns have been very effective so far in driving the decrease of water consumption.
Copenhagen has demonstrated a solid management approach and has implemented a successful range of plans and initiatives. The city has access to groundwater of high quality that comes from a very large area in Denmark. The tendency is to reduce the extent of this catchment area and promote groundwater extraction to the city area, thus limiting the carbon footprint of water transport. To this end and to protect the quality of the local groundwater resources, initiatives were taken to adopt environmental friendly gardening and agricultural practices. Afforestation and soil remediation projects have also been started. Measures include financial support to reuse treated wastewater for industrial purposes.
By 2017, the target for household water consumption has been fixed to 100 l/inhabitant/day (and to 30 litres for business, which is the same as the current consumption of 29 l/inhabitant/day reported for 2010). Funding has been made available to test new solutions for water management in Nordhavn, an urban development area. Plans for the future are visible, but the application does not to give an integrated view on how the different initiatives will be connected each others. This might be related to the fact that water management plans under the Water Framework Directive have not been fully adopted yet, thus affecting also municipal action plans. Regarding adaptation to climate change, concern seems to be more on overflow of the sewage system during heavy rains and groundwater contamination aspects than availability of water.

European Green Capital Award Expert Evaluation Panel – Synopsis Technical Assessment
26
4.2.9 Waste water treatment
Main evaluator: Ms. Eduarda Beja Neves
Co-evaluator: Mr. Giovanni Bidoglio
Ranking: 1st
Comments: In what relates to access to service, wastewater from households and enterprises is managed in closed pipes underground. Most of the City has a joint system where storm water and household waste water is discharged for treatment in central treatment plants. Separate sewer systems only exist in the part of the city which is close to the ports. The of sewer system type choice has an historical basis, which also applies to the service offered by the City to its citizens and enterprises. The main principle is for wastewater from ground floors to be drained to sewers by gravitation. The sewers are designed so that statistically overflow ground level only takes place once every ten years in joint sewer system areas, whereas separate storm water pipes are designed so that overflow at ground level only takes place once every five years. The sewer systems are furnished with pumping stations and reservoirs for waste water storage during rainfalls. All waste water is treated at two treatment plants.
Increasing urban development with accompanying expansion of the sewer system, as well as increased rainfalls intensity have resulted increased pressure on central treatment plants.
To minimise this pressure, storm water draining in new urban development areas and in major renovation work is to be carried out according to the SUDS principles (Sustainable Urban Drainage Systems). For instance, the new Ørestad district which was founded in 1996 and today is an area of 150 hectares was established with a three-stringed system. In the three-stringed system, household wastewater is discharged to a central treatment plant; roof water is discharged to recreational canals whereas road water is treated locally before being discharged to the recreational canals.
4.2.10 Eco-innovation and sustainable employment
Main evaluator: Mr. Lars Mortensen
Co-evaluator: Mr. Per Berg
Ranking: 2nd
Comments: Copenhagen is determined to grow in a green way according to the application. The city’s strategy for creating employment opportunities and achieving the necessary economic growth is included in the current Municipal Plan which focuses on green growth. Strengthening the clean-tech sector is part of its green growth strategy
The City has developed and promoted a catalogue of innovative solutions for the green development of Copenhagen and public-private partnerships are at the core of the city’s approach to eco-innovation and sustainable employment.
Since 2009 the city is establishing an infrastructure for electric cars. Since autumn 2009, 50 charging points have been set up. By 2015, 85% of the total municipal car fleet is expected to be electric or hybrid vehicles. Other remarkable initiatives include the hydrogen initiative and especially the already very advanced bicycle infrastructure and very high share of bicycling in the city (50% of the people in

European Green Capital Award Expert Evaluation Panel – Synopsis Technical Assessment
27
Copenhagen bike to work or school every day) which can serve as an innovative role model for other cities.
In 2010 just under a quarter of electricity consumption in Copenhagen was generated from biomass and wind. In the future, this could possibly be improved with a more ambitious energy conservation roadmap (energy efficiency and sustainable lifestyles).
980 companies joined in 2011 Green Businesses - a network for companies that want to be part of the green growth of the city. Approximately 200 companies have received free energy counselling from 2009. Between 2004 and 2009 the turnover generated in the green sector increased by 55% in the greater Copenhagen area.
4.2.11 Environmental management of the local author ity
Main evaluator: Ms. Maria Berrini
Co-evaluator: Mr. Larry O’Toole
Ranking: 1st
Comments: A comprehensive, visionary and consolidated Strategy is in place (Agenda 21 and Ecometropolis - our vision for 2015) in the city of Copenhagen.
A systematic audit and "Green account" reporting (annually) is in use, showing goals, efforts, results, improvement potential. Same data are summarised in booklets and City web site. The EMS is funded regularly (335,000 Euro/year). An environmental expert is a compulsory member of the work group set up before any tendering procedure for GPP.
Six of the seven administrations of the City are environmentally certified (ISO14001/EMAS), therefore 66% of the 43,000 employees are involved, along with 264 of 550 schools in the city. Organic food presence in public places increased up to 68%.
Copenhagen has a goal of 20% CO2 reduction by 2015, this is also the goal for the cities internal operations too, both goals are strongly promoted. Green purchasing (2015 target (90% on a total food of 8.000 tons) is promoted by a specific policy, described in detail. The cities vehicle fleet is planned to be electrically and hydrogen driven by the end of 2015. Plans to meet all of the 2015 ambitious targets are in place.
4.2.12 Energy performance
Main evaluator: Mr. Per Berg
Co-evaluator: Mr. Lars Mortensen
Ranking: 1st
Comments: Copenhagen has been developing a modal shift in energy from non- renewable to renewable since the end of the 1970’s and today has reached 55% renewable energy in the city. This means that Copenhagen also has a long record of actually transforming according to plans.

European Green Capital Award Expert Evaluation Panel – Synopsis Technical Assessment
28
This long experience which has lead to unique competences on district heating with Combined Heat and Power with a high level of connection in central Copenhagen (98%) and also of greater Copenhagen communities. Also the co-ordination and efficient organisation of the district heating has a long and mature history.
Copenhagen has one of the most ambitious and credible roadmaps for the completion of the renewable transition. With the help of a huge investment program in new wind power, more efficient bio-energy based Combined Heat and Power plants and retrofitting of houses, the program is very ambitious. In only 13 years, the city is committed to become CO2 neutral with only renewable energy and even function as a net producer. There is, however, no explicit program for reducing the energy demand.
The energy mix includes bioenergy, biogenic waste, condensation processes, wind power, PV, solar heat collectors, and geothermal sources and there is a continuously updated plan for the transformation of the energy mix.
Copenhagen also has a basically dense and green structure supporting an efficient urban energy use. The vast pedestrian network inside Copenhagen makes it one of the world’s most walkable cities. Also the county-wide and city-wide complete bicycle networks have enriched the city with one of the top-ranked and most advanced well-functioning micro-infrastructures across of the urban world. The compact bike-pedestrian city has a very low carbon footprint and a particularly low energy need in the metropolitan transport sector.
European Green Capital Award Expert Evaluation Panel – Synopsis Technical Assessment
29
4.3 FRANKFURT
4.3.1 Local contribution to global climate change
Main evaluator: Mr. Chris Bremmer
Co-evaluator: Dr. Henrik Gudmundsson
Ranking: 7th
Comments: Frankfurt shows high per capita emissions with a slight decreasing trend since 1995. Frankfurt is a major commercial centre with a large financial and IT-sector. It experiences severe levels of transport use from commuters. Taking this into account, Frankfurt has moderately high emissions per capita.
The city aims to have a 50% reduction in GHG emissions by 2030. Plans and funding are in place to secure passive house standards to all new properties and upgrade old ones and to invest in renewable energy, efficient gas and steam power plant extend district heating. Little information on counteracting measures for transport related emissions is provided.
4.3.2 Local Transport
Main evaluator: Dr. Henrik Gudmundsson
Co-evaluator: Mr. J. Luis Bento Coelho
Ranking: 6th
Comments: Frankfurt performs very well on most of the four Local Transport Indicators (except for the share of car traffic for short trips, where performance is more average), and demonstrates a broad and solid approach to manage different aspects of mobility within a very well described context.
Frankfurt impresses less with regard to demonstrating specific achievements apart from a quite successful cycling strategy. The further planned and proposed measures in the mobility area seem comprehensive in scope and appear well conceived; however the description generally include few specific outstanding or bold initiatives, clearly verifiable targets (apart from requirements regarding air quality), dedicated financial commitments, or particularly explicit programs to monitor, and learn from experienced environmental performance results or ongoing implementation efforts.
Some partly innovative aspects are included such as efforts to change former office areas to mixed residential use; efforts to promote various forms of electro mobility, and various efforts to involve businesses and other stakeholder groups actively in mobility improvement schemes; however the efforts and commitments are not very detailed described.

European Green Capital Award Expert Evaluation Panel – Synopsis Technical Assessment
30
4.3.3 Green Urban areas Incorporating Sustainable l and use
Main evaluator: Ms. Ir. Hedwig van Delden
Co-evaluator: Mr. Stamatis Chondrogiannis
Ranking: 9th
Comments: Frankfurt's Greenbelt accounts for 1/3 of the overall city area and is a landscape protection area (Greenbelt Constitution 1991) and a popular leisure area. From 1999-2009 there has been a 16.5% increase in leisure areas and new green spaces came into being as former industrial or military areas were converted.
Disadvantages from historic factors are well-known and addressed by various planning and management tools at various administrative levels. Examples include the Greenbelt development, but also the conversion of former riverside industrial sites and shipyards into residential and business districts with adjacent green areas and the redesign of the entire inner-banks of the River Main as a leisure area.
In 2007, the city authorities launched the "Neighbourhood forum" series in an effort to encourage more personal discussions. Politicians and planners from Frankfurt's 21 neighbouring communities took part. Positive experiences have led these forums to continue in the future. Frankfurt has a number of clear targets for the future, mainly dealing with green areas, climate adaptation and converting industrial wasteland. It would be beneficial for Frankfurt to include more information on targets relating to the quality of life and recreation as well as the indicators to measure them.
4.3.4 Nature and biodiversity
Main evaluator: Mr. Stamatis Chondrogiannis
Co-evaluator: Ms. Ir. Hedwig van Delden
Ranking: 11th
Comments: From 1985 on the systematical monitoring of species has been in place and several measures have been implemented as a result of this monitoring.
Many protected areas exist; individual monuments of nature, redevelopment of nature, and a lot about the green belt which has a positive influence also as an element of protection of the landscape .
Many concrete plans exist and a declaration that the centre of the city will in the future be connected to the green belt. More measures need to be taken for the centre of the city.
4.3.5 Quality of local ambient air
Main evaluator: Dr. Steen Solvang Jensen
Co-evaluator: Mr. Chris Bremmer

European Green Capital Award Expert Evaluation Panel – Synopsis Technical Assessment
31
Ranking: 3rd
Comments: The limit value of annual NO2 is exceeded in both street and urban background stations and PM10 daily is exceeded in 2005, 2006 and 2009 for Frankfurt. The Clean Air Plan for the Rhine-Main conurbation from 2005 aims to comply with EU limit values in the entire area, including Frankfurt. Action Plan Frankfurt am Main 2005 includes measures on congestion-free Friedberger Landstrasse, ramp metering on the Friedberger Landstrasse, the introduction of low-exhaust buses, natural gas powered vehicles, public information, lorry ban, a low emission zone from 2008 onwards. Action Plan Frankfurt am Main 2008 with Low emission Zone (LEZ) that progressively tightens access criteria.
Targets set aim to comply with EU limit values although these targets have not yet been achieved. The target to comply with the NO2 annual limit in the long term will require a comprehensive package of measures. Measures considered are: Extension of LEZ to nearby cities, speed limits, transit bans on lorries on high NO2 streets that require national and regional regulation. TiO2 paving stones for the photocatalytic degradation of NO2 in pilot project, mobility management, more pedestrian, bicycle and public traffic, green municipal fleet, electromobility, and climate protection.
4.3.6 Noise pollution
Main evaluator: Mr. J. Luis Bento Coelho
Co-evaluator: Dr. Steen Solvang Jensen
Ranking: 5th
Comments: Frankfurt is assumed to be Germany's central traffic hub, therefore noise from traffic is the main contributor to the urban acoustic climate, though noise exposure figures show low values, possibly due to the calculation procedure to assign population to noise.
Noise protection is a key topic in the municipal strategies with the public being involved in the noise abatement plan. The Noise action plan of 2010 concerns mostly mobility, with the goals established at "reducing noise pollution so as to maintain and improve the city's residential quality". Measures include low noise road surfaces, upgrade of rail routes, increase of share of bicycles, and traffic management including an impressive catalogue of aircraft procedures for air traffic noise abatement. No information on noise awareness campaigns was provided.
4.3.7 Waste production and management
Main evaluator: Mr. Larry O’Toole
Co-evaluator: Ms. Maria Berrini
Ranking: 1st
Comments: Frankfurt demonstrates a strong commitment to the waste hierarchy with an emphasis on waste reduction, materials recycling and energy recovery. There is a clear commitment to source separation of waste streams and the application outlines comprehensively how different waste streams are collected.
European Green Capital Award Expert Evaluation Panel – Synopsis Technical Assessment
32
An excellent household recycling performance is achieved although the municipal recycling rate is not provided. Separate collection of kitchen waste is widespread and treatment includes anaerobic digestion producing biogas which currently produces electricity and will produce heat for the district heating scheme. Heat from the Waste to Energy (WtE) facility feeds into the district heating network.
Use related charges are structured to encourage waste separation. Waste reduction is a key issue for the City and includes a target of 160kg per inhabitant and there is also a very clear commitment to increasing waste recycling rates by the further rollout of biowaste bins and improved packaging waste and plastics collection. Overall Frankfurt demonstrates a very strong performance in waste management.
4.3.8 Water consumption
Main evaluator: Mr. Giovanni Bidoglio
Co-evaluator: Ms. Eduarda Beja Neves
Ranking: 3rd
Comments: Frankfurt has a high number of daily visitors and commuters from neighbouring towns. As a rough estimation, present water consumption is in the order of 140 l/person/day, which decreases to about 102 l/inhabitant/day if we consider also the daily commuters. Taking into account that Frankfurt population has increased of 8.5% from 1990 to 2010, the observed decrease of water consumption by households and small businesses of 14% over the same period is a remarkable achievement.
Water saving targets have been reached using promotional measures backed up by a linear tariff system for consumed drinking water to which 1.76 EURO per cubic meter is added for wastewater treatment charges assuming discharged wastewater to be of the same total volume as that of the consumed drinking water. This is a good example of how the tariff system can help trigger virtuous behaviours.
Key targets are reviewed annually to ensure continuity of objectives, as initially established in the Action Plan on “Sensible Water Use in Frankfurt”, towards a further reduction of water consumption. Future climate change impacts on groundwater resources are considered in the Frankfurt’s climate adjustment strategy, which includes measures to counteract estimated seasonal changes of rainwater precipitation trends.
4.3.9 Waste water treatment
Main evaluator: Ms. Eduarda Beja Neves
Co-evaluator: Mr. Giovanni Bidoglio
Ranking: 4th
Comments: Frankfurt and the surrounding towns and communities connected to the waste water treatment plants operated by the city’s Waste Water Department produce around 300 million litres of waste water each day. The City target is to comply with all legal requirements for waste water treatment below the limit values, including cleansing waste water of harmful substances, and systematically checking treatment results, it is also determined to maintain the highest possible technical standards and to bring as soon as possible the plants into line with new requirements.

European Green Capital Award Expert Evaluation Panel – Synopsis Technical Assessment
33
Industrial waste water discharging into the sewers is regularly analysed and companies are forced to take corrective measures when necessary. Frankfurt’s network of sewers is some 1,600 km long. Around 75% consists of a mixed system and around 25% of a separate system, with rainwater being collected separately. State-of-the-art technology is used to treat the rainwater in the sewers.
In what relates access to service, connection and use of Frankfurt’s waste water system is compulsory. The connection rate is over 99.9%. Only extremely few places still have separate waste water collection pits emptied regularly and its contents transported to a waste water treatment plant.
In what concerns flood management, Frankfurt’s City authorities are currently working on a flood protection concept for the River Main and the streams in the Taunus area. Flood risk mapping for the Main is virtually complete. Water gauges are currently being installed along some Taunus streams to gather data for an early warning system. Flood protection and operational management at Frankfurt’s two waste water treatment plants are designed to cope with at least HQ100 flooding in the Main. There are specific instructions for dealing with flooding at the waste Water plants and in the sewers.
Reference is made to infrastructure and economic sustainability. The facilities are referred to be well maintained and sufficient in size. They already boasted cutting-edge technology 10 years ago and ongoing investment ensures that they are continuously being upgraded. Intense monitoring of the waste water discharged by business enterprises avoids damage being caused by aggressive substances. Economic advantages are referred to be achieved by operating only two very large waste water treatment plants, whose geographical location in the sewer network means that they can operate largely without pumping stations and can also service communities in the area around Frankfurt.
Reference is made to environmental sustainability, namely new compressors are currently being procured for the main energy consumers at the waste water treatment plants, and the sludge is drained of water and burned at a central sludge drying and incineration plant by which means toxic persistent pollutants in the sludge are destroyed and do not contaminate the environment.
4.3.10 Eco-innovation and sustainable employment
Main evaluator: Mr. Lars Mortensen
Co-evaluator: Mr. Per Berg
Ranking: 5th
Comments: In 1996 Frankfurt began work on “Frankfurt Agenda 21 – ways to sustainability” and Frankfurt has had ecological targets for more than 20 years. In 2009, Mainova AG and Frankfurt's housing company established Germany's first cooperative venture between the housing and energy sectors.
Frankfurt has one of the best energy-innovations known: the combined heat and power plant with its accompanying logistics – a new and fast system used for regulating windpower and photovoltaic electricity production.
In June 2010, 2.7% of employees subject to social insurance contributions were working in the green sector. Currently in Frankfurt, some 500 electric or Hybrid vehicles have been licensed.
Frankfurt is introducing a School year of sustainability – as an activity within the decade of Education for Sustainability proclaimed by UNESCO 2014 – with the aim of all primary school pupils in the city to

European Green Capital Award Expert Evaluation Panel – Synopsis Technical Assessment
34
know what sustainable development means when they finish primary school – and how they can contribute, by 2013.
4.3.11 Environmental management of the local author ity
Main evaluator: Ms. Maria Berrini
Co-evaluator: Mr. Larry O’Toole
Ranking: 6th
Comments: Environmental reporting and a City Agenda are published regularly by Frankfurt. Guidelines have been adopted to drive decision makers and to encourage municipal employees. Guidelines for Municipal Buildings, new construction stipulates passive house (as standard) and other environmental criteria. Binding environmental procurement rules have been adopted e.g. a ban of tropical wood and PVC, use of recycled paper etc. Local utilities have adopted guidelines following ISO 14001 or similar and are regularly audited.
Frankfurt is one of the most certified passive houses cities. School catering provides 19% organic food and includes mainly local/seasonal vegetables. Frankfurt was nominated “Fairtrade Town” by TransFair. City owned property and city trains and trams have been fully converted to energy generated by renewable sources (50%) and by local combined heat and power.
The Frankfurt Citizens Fund for Climate Protection is a very interesting way to promote environmental good practices in the City.
4.3.12 Energy performance
Main evaluator: Mr. Per Berg
Co-evaluator: Mr. Lars Mortensen
Ranking: 3rd
Comments: Frankfurt exhibits a long-term planning for an ambitious reduction of energy use, for two decades, and continuation of energy efficiency plans into the future. A long-term development of energy production efficiency, a continuous development of co-generation plants, the implementation of the Energy Act and municipal and private investments in energy conservation shows a consequent and clear ambition to reduce the energy demand.
The City displays an ambitious program for introducing passive and plus energy houses – particularly in municipal buildings.
An early start, Frankfurt introduced short-term radical goals and a long-term lower but realistic goal to introduce renewable energy (earlier using biomass energy, bio-waste energy, Photo voltaic power, and in the future including a large development of wind energy and other new renewable energy sources).

European Green Capital Award Expert Evaluation Panel – Synopsis Technical Assessment
35
The roadmap shows that Frankfurt wishes to power down coal and uranium and through higher efficiency and saving energy, introduction of local and domestic renewable energy complete the transition before 2050.

APPENDIX A
Application Form for EGC 2014 Title

Application form for the European Green Capital Awa rd 2014
Municipality
Name of municipality:
Country:
Size of municipality (km2):
Signatory of the Covenant of Mayors: Yes No
Number of inhabitants in municipality:
Name & Address of Mayor:
Contact
Name and contact details of the person to be contacted in relation to this application.
Name:
Address:
Telephone:
Fax:
E-mail:
Present details of the original and/or most recent Action Plan, including any relevant disadvantages or constraints resulting from historical and/or geographical factors which may have influenced this indicator area negatively.
Include details of:
1. Total CO2 equivalent per capita, including emissions resulting from use of electricity;
2. CO2 per capita resulting from use of natural gas; 3. CO2 per capita resulting from transport; 4. Grams of CO2 per kWh used.
(max. 1,000 words)
Details of those targets achieved or not, to date (within the last 5 – 10 years). Provide a review of how both situations occurred and lessons learned.
(max. 800 words)
1. Local contribution to global climate change
Plans to meet or revise key targets for the reduction of GHG emissions for the future and proposed approach to achieve these.
(max. 800 words)
2. Local
transport
Present details of the original and/or most recent Action Plan, including any relevant disadvantages or constraints resulting from historical and/or geographical factors which may have influenced this indicator area negatively.
Including:
1. Length of designated cycle lanes in relation to total number of inhabitants in the city;
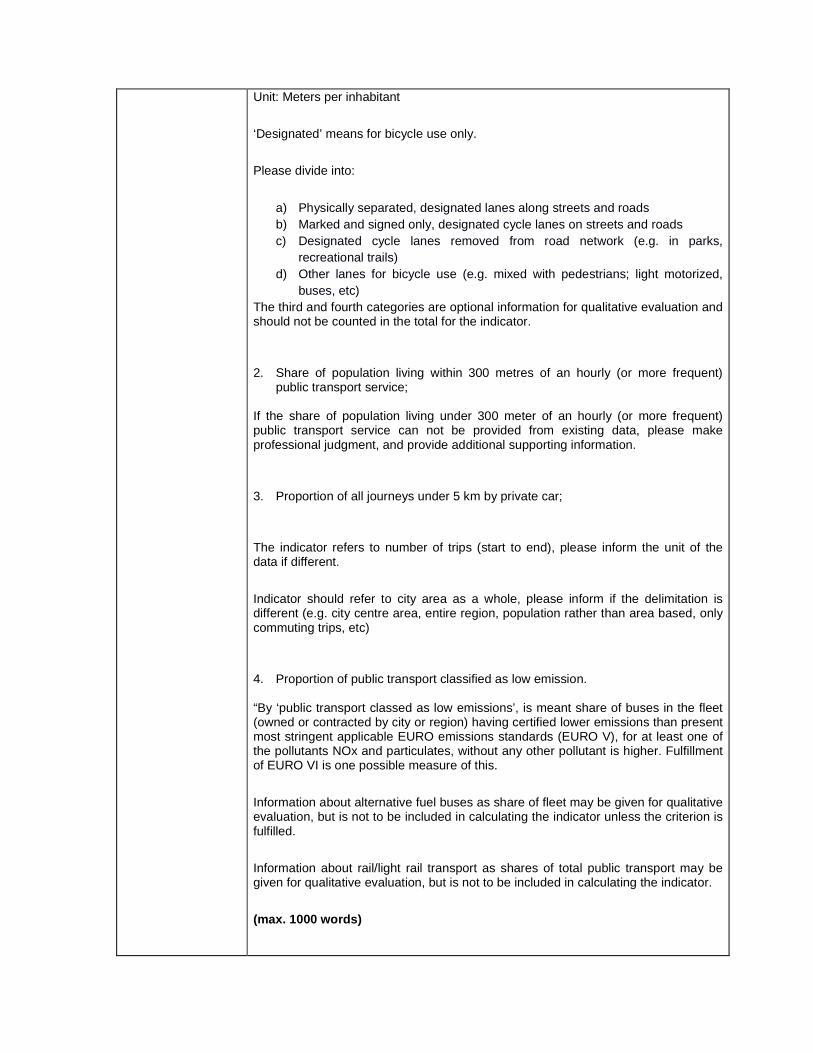
Unit: Meters per inhabitant
‘Designated’ means for bicycle use only.
Please divide into:
a) Physically separated, designated lanes along streets and roads b) Marked and signed only, designated cycle lanes on streets and roads c) Designated cycle lanes removed from road network (e.g. in parks,
recreational trails) d) Other lanes for bicycle use (e.g. mixed with pedestrians; light motorized,
buses, etc) The third and fourth categories are optional information for qualitative evaluation and should not be counted in the total for the indicator.
2. Share of population living within 300 metres of an hourly (or more frequent)
public transport service; If the share of population living under 300 meter of an hourly (or more frequent) public transport service can not be provided from existing data, please make professional judgment, and provide additional supporting information.
3. Proportion of all journeys under 5 km by private car;
The indicator refers to number of trips (start to end), please inform the unit of the data if different.
Indicator should refer to city area as a whole, please inform if the delimitation is different (e.g. city centre area, entire region, population rather than area based, only commuting trips, etc)
4. Proportion of public transport classified as low emission. “By ‘public transport classed as low emissions’, is meant share of buses in the fleet (owned or contracted by city or region) having certified lower emissions than present most stringent applicable EURO emissions standards (EURO V), for at least one of the pollutants NOx and particulates, without any other pollutant is higher. Fulfillment of EURO VI is one possible measure of this.
Information about alternative fuel buses as share of fleet may be given for qualitative evaluation, but is not to be included in calculating the indicator unless the criterion is fulfilled.
Information about rail/light rail transport as shares of total public transport may be given for qualitative evaluation, but is not to be included in calculating the indicator.
(max. 1000 words)

Details of those targets achieved or not, to date (within the last 5 – 10 years). Provide a review of how both situations occurred and lessons learned.
Particular reference should be given to the reduction of total transport volume and encouraging a shift away from transport by car.
(max. 800 words)
Plans to meet or revise key targets for the future and proposed approach to achieve these.
Refer to:
1. Reduction of overall demand for transport; 2. Reduction of individual motorised transport; 3. Promotion of less environmentally damaging modes of transport.
(max. 800 words)
Provide the percentage of green and water areas (public and private) and soil sealing in relation to the overall city area, including trends over the past five to ten years.
Add a map indicating :
• The proportion of areas located within the inner city / on city boundaries;
• The distribution across the city;
• Size of areas;
• Fragmentation;
• Soil sealing (m2) per capita.
(max. 500 words plus map)
3. Green urban areas incorporating sustainable land use
Present details of the original and/or most recent Action Plan, including any relevant disadvantages or constraints resulting from historical and/or geographical factors which may have influenced this indicator area negatively.
Including:
• The percentage of citizens living within 300m of public green urban areas,
• Percentage of green areas, water areas, residential areas, industrial / economic areas, mixed areas, brownfields (this will provide important background information on the character of the city and is not an evaluation criterion in itself);
• New developments: proportion of brownfield sites, densification in the inner-city or urban cores, on greenfields;
• Population density in built-up areas in inhabitants per hectare (city area minus green and water areas);
• Population density for new developments in inhabitants per hectare.

(max. 1000 words)
Details of those targets achieved or not, to date (within the last 5 – 10 years). Provide a review of how both situations occurred and lessons learned.
Make reference to:
1. Minimising the total area of derelict and contaminated land;
2. Increasing or sustaining population density in built-up areas while protecting green areas and providing a high quality of life within densely populated areas;
3. Renovating urban land and renewing urban design to make city living attractive and enable a more sustainable lifestyle (e.g. short distances to services and facilities reduce the transport demand and promote walking and cycling; multi-apartment houses save energy for heating, cooling, reduce infrastructural needs);
4. Limiting urban sprawl by cooperating with the neighbouring municipalities;
5. Integrating current and future changes such as economic growth, demographic or climate change through sustainable land use planning.
(max. 800 words)
Plans to meet or revise key targets for the future and proposed approach to achieve these.
With particular reference to the establishment and management of green urban areas (public and privately owned) taking into consideration their function:
• People’s quality of life and recreation; • Additional ecosystem services and functions such as regulating water
balance, balancing climate extremes, filtering air pollution, education, etc. • Rehabilitation of brown field sites, derelict and/ or contaminated land
(max. 800 words)
Present details of the original and/or most recent Action Plan, including any relevant disadvantages or constraints resulting from historical and/or geographical factors which may have influenced this indicator area negatively.
(max. 1000 words)
Details of those targets achieved or not, to date (within the last 5 – 10 years). Provide a review of how both situations occurred and lessons learned.
Make reference to:
1. Managing areas designated for nature protection and biodiversity as described above;
2. Protecting nature in other open spaces; 3. Promotion of public knowledge and understanding of nature and
biodiversity, particularly among young people. (max. 800 words)
4. Nature and biodiversity
Plans to meet or revise key targets for the future and proposed approach to achieve these.

(max. 800 words)
Present details of the original and/or most recent Action Plan, including any relevant disadvantages or constraints resulting from historical and/or geographical factors which may have influenced this indicator area negatively.
Make reference to:
1. Number of days per year on which EU limit values were exceeded for PM10 (daily mean of 50µg/m3);
2. Number of days per year on which EU limit value/long term objective for ozone was exceeded (8h mean of 120µg/m3) ;
3. Annual mean concentration of NO2 PM10 and PM2.5.
(max. 1000 words)
Details of those targets achieved or not, to date (within the last 5 – 10 years). Provide a review of how both situations occurred and lessons learned.
Include:
1. Existence and implementation status of an air quality management plan;
2. Local measures taken to improve air quality and their effect on air quality
3. Information to the public (both inhabitants and tourists) on air quality levels (e.g. web pages, information screens) in order to increase public awareness and change behaviour.
(max. 800 words)
5. Quality of local ambient air
Plans to meet or revise key targets for the future and proposed approach to achieve these.
Please provide details on assigned budgets
(max. 800 words)
Present details of the original and/or most recent Action Plan, including any relevant disadvantages or constraints resulting from historical and/or geographical factors which may have influenced this indicator area negatively.
Provide details on:
1. Share of population exposed to noise values of L (day) above 55 dB(A);
2. Share of population exposed to noise values of L (night) above 45 dB (A).
(max. 1000 words)
6. Noise pollution
Details of those targets achieved or not, to date (within the last 5 – 10 years). Provide a review of how both situations occurred and lessons learned.
(max. 800 words)
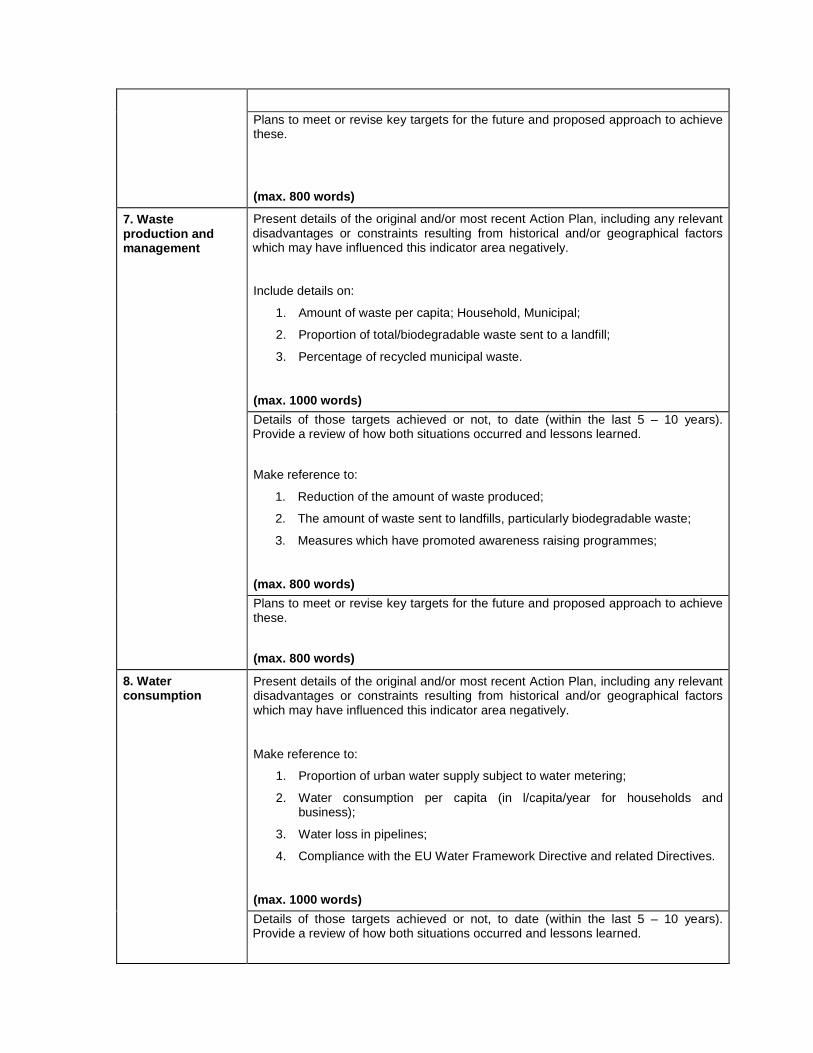
Plans to meet or revise key targets for the future and proposed approach to achieve these.
(max. 800 words)
Present details of the original and/or most recent Action Plan, including any relevant disadvantages or constraints resulting from historical and/or geographical factors which may have influenced this indicator area negatively.
Include details on:
1. Amount of waste per capita; Household, Municipal;
2. Proportion of total/biodegradable waste sent to a landfill;
3. Percentage of recycled municipal waste.
(max. 1000 words)
Details of those targets achieved or not, to date (within the last 5 – 10 years). Provide a review of how both situations occurred and lessons learned.
Make reference to:
1. Reduction of the amount of waste produced;
2. The amount of waste sent to landfills, particularly biodegradable waste;
3. Measures which have promoted awareness raising programmes;
(max. 800 words)
7. Waste production and management
Plans to meet or revise key targets for the future and proposed approach to achieve these.
(max. 800 words)
Present details of the original and/or most recent Action Plan, including any relevant disadvantages or constraints resulting from historical and/or geographical factors which may have influenced this indicator area negatively.
Make reference to:
1. Proportion of urban water supply subject to water metering;
2. Water consumption per capita (in l/capita/year for households and business);
3. Water loss in pipelines;
4. Compliance with the EU Water Framework Directive and related Directives.
(max. 1000 words)
8. Water consumption
Details of those targets achieved or not, to date (within the last 5 – 10 years). Provide a review of how both situations occurred and lessons learned.

Make reference to:
1. Proactive leakage management; 2. Network rehabilitation; 3. Non-domestic metering; 4. Byelaw implementation in relation to efficiency in water usage;
5. Main efforts to use the tariff system to improve water supply;
6. Awareness raising campaigns. (max. 800 words) Plans to meet or revise key targets for the future and proposed approach to achieve these, including measures incorporating preparedness of water infrastructure to deal with future impacts of climate change.
(max. 800 words)
Present details of the original and/or most recent Action Plan, including any relevant disadvantages or constraints resulting from historical and/or geographical factors which may have influenced this indicator area negatively.
Make reference to waste water services quality, focusing on:
1. Access to service; 2. Flood occurrences and management;
3. Economic sustainability;
4. Infrastructures sustainability (treatment capacity, treatment level; drainage systems rehabilitation);
5. environmental sustainability (energy efficiency, renewable energy, pollution prevention efficiency; sludge treatment and final disposal, public health;
6. Integration into water management in general closing the cycle (efficient water use, treated waste water reuse).
Make particular reference to the Urban Waste Water Directive.
(max. 1000 words)
Details of those targets achieved or not, to date (within the last 5 – 10 years). Provide a review of how both situations occurred and lessons learned.
(max. 800 words)
9. Waste water treatment
Plans to meet or revise key targets for the future and proposed approach to achieve these.
(max. 800 words)
10. Eco-innovation and sustainable employment
Present details of the original and/or most recent Action Plan, including any relevant disadvantages or constraints resulting from historical and/or geographical factors which may have influenced this indicator area negatively.
Make reference to:
1. Innovations that address material security and/or resource efficiency (substitution, minimisation of material use, closing loops, etc) and reduce environmental impacts;
2. Awareness raising and training to encourage the development and take-up

of environmentally friendly technologies, particularly through training in industrial and business settings.
3. Social innovation, including for example community programmes, that shows entrepreneurship and new ways of organisation in order to promote sustainable development and protect the environment locally and globally
4. Number of jobs created in green sectors such as renewable energy and waste recycling, in total and as share of total jobs in the city and total jobs created during a period of one year.
5. Share of energy provided in the city that is sourced from renewable energy sources. Rnewable energy sources to be specified.
6. Share of hybrid or fully electric cars sold in total car sale
(max. 1000 words)
Details of those targets achieved or not, to date (within the last 5 – 10 years). Provide a review of how both situations occurred and lessons learned.
Make reference to initiatives aimed at increasing eco-innovation and sustainable employment. E.g. projects under Cohesion Policy funds, LIFE, Environmental Technologies Action Plan (ETAP) etc
(max. 800 words)
Plans to meet or revise key targets for the future and proposed approach to achieve these.
(max. 800 words)
Present details of the original and/or most recent Action Plan, including any relevant disadvantages or constraints resulting from historical and/or geographical factors which may have influenced this indicator area negatively.
Make reference to:
1. Number of municipal departments with certified environmental management systems (ISO 14001/EMAS);
2. Percentage of consumed eco-labelled and organic products by municipalities, measured as a share of the total product consumption within similar category;
(max. 1000 words)
11. Environmental management of the local authority
Details of those targets achieved or not, to date (within the last 5 – 10 years). Provide a review of how both situations occurred and lessons learned.
Make reference to:
1. Developing an overall policy for environmental management of municipal activities;
2. Increasing the share of the total consumption of eco-labelled, organic and energy-efficient products;
(max. 800 words)
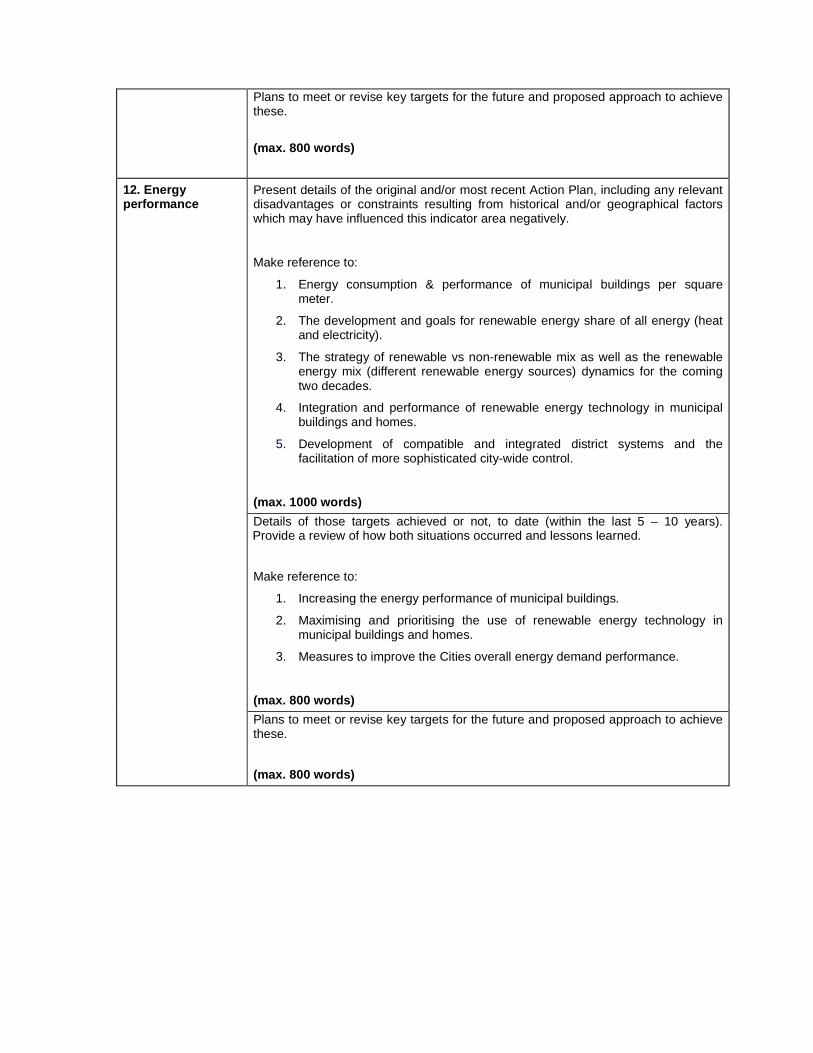
Plans to meet or revise key targets for the future and proposed approach to achieve these.
(max. 800 words)
Present details of the original and/or most recent Action Plan, including any relevant disadvantages or constraints resulting from historical and/or geographical factors which may have influenced this indicator area negatively.
Make reference to:
1. Energy consumption & performance of municipal buildings per square meter.
2. The development and goals for renewable energy share of all energy (heat and electricity).
3. The strategy of renewable vs non-renewable mix as well as the renewable energy mix (different renewable energy sources) dynamics for the coming two decades.
4. Integration and performance of renewable energy technology in municipal buildings and homes.
5. Development of compatible and integrated district systems and the facilitation of more sophisticated city-wide control.
(max. 1000 words)
Details of those targets achieved or not, to date (within the last 5 – 10 years). Provide a review of how both situations occurred and lessons learned.
Make reference to:
1. Increasing the energy performance of municipal buildings.
2. Maximising and prioritising the use of renewable energy technology in municipal buildings and homes.
3. Measures to improve the Cities overall energy demand performance.
(max. 800 words)
12. Energy performance
Plans to meet or revise key targets for the future and proposed approach to achieve these.
(max. 800 words)

A1
APPENDIX B
Experts Pen Profiles

A1
Indicator No. 1 - Local contribution to global clim ate change.
Mr. Chris Bremmer, Business Line Manager ‘Sustainable Cities’, TNO (Netherlands Organisation for Applied Scientific Research), Utrecht, The Netherlands. [email protected]
Chris Bremmer is Manager of the Business Line “Sustainable Cities” at TNO, the Netherlands Organisation for Applied Scientific Research. He holds an MSc in Geosciences with 21 years experience of environmental and geoscience studies for industry and National and European governments. He is currently responsible for TNO’s programme ‘Sustainable Cities’ which includes national and international strategic studies and innovation projects related to emissions and air quality monitoring, water technology, Life-cycle assessments and climate adaptation and mitigation, focusing on the Built Environment.
Indicator No. 2 - Local transport.
Expert: Dr. Henrik Gudmundsson, Senior Researcher, Department of Transport, Technical University of Denmark.
Henrik Gudmundsson has been a Senior Researcher in Sustainable Transport at the Technical University of Denmark since 2006. He is educated as Environmental planner and has a PhD in Business Economics from Copenhagen Business School. His main area of research is sustainable transport policy analysis, including the use of knowledge and indicators in the design, implementation and monitoring of transport policies and plans. Henrik is the National Principle Contact Point (PCP) on transport indicators in Denmark for the European Environment Agency (EEA), and a member of the scientific advisory board for the Swedish government’s Transport Analysis agency. Henrik is currently involved in five major research projects, two of which are funded by the 7th Framework Program of the European Union. He is a member the Committees on ‘Performance Measurement’ and ‘Transportation and Sustainability’ of the US Transportation Research Board.
Before assuming his current position Henrik has been involved in State of the Environment Reporting for Denmark at the National Environmental Research Institute (1993- 2006) and prior to that he was a Head of Section in the Danish Environmental Protection Agency (1988-2003).
Indicator No. 3 - Green Urban areas Incorporating S ustainable land use.
Expert: Ms Ir. Hedwig van Delden, Director, Research Institute for Knowledge Systems (RIKS), Maastricht, The Netherlands.
Hedwig van Delden holds a Master of Science degree in Civil Engineering with a specialisation in Water Resource Management and Environmental Sciences from the University of Twente, the Netherlands. Since 2005 she holds the position of Director of the Research Institute for Knowledge Systems (RIKS), Maastricht, the Netherlands. Hedwig works in model integration, land use modelling and scenario studies, especially on the integration of and interaction between socio-

A2
economic and biophysical processes on which she frequently publishes. Her research on the integration of spatially explicit models frequently leads to teaching and speaking assignments in universities and scientific and policy-oriented congresses and events worldwide. Besides her research, in her role as Managing and Scientific Director of the RIKS, she manages and provides scientific leadership to national and international projects of various sizes that focus on the design, development and use of integrated models for policy support.
Indicator No. 4 - Nature and biodiversity.
Expert: Mr Stamatis Chondrogiannis, Expert, Commission on Ecosystem Management, International Union for Conservation of Nature (IUCN), Greece.
Stamatis Chondrogiannis is an architect and town planner. He has designed many “green” projects such as schools, museums, theaters as well as private housing and alternative tourism resorts. In his town planning projects he investigated the relation between built space and nature and the adaptation of big public works, such as roads, harbors and waste treatment installations to their natural environment. He prepared co-planning programs for the management of environmentally sensitive areas, e.g. the biotopes of the sea turtle and the monk seal in Western Greece.
He is involved with projects on monuments of cultural and architectural inheritance in Greece and other Countries, also concerning their connection with their natural environment, working closely with local and central government authorities as well as with universities, institutes and other organizations. He carried out programs for Greenpeace and WWF. He is a member of the Commission on Ecosystem Management of IUCN (The International Union for the Conservation of Nature)
Indicator No. 5 - Quality of local ambient air.
Expert: Dr. Steen Solvang Jensen, Senior Scientist, Department of Environmental Science, Aarhus University, Denmark.
Steen Solvang Jensen is Senior Scientist, PhD at the Department of Atmospheric Environment at the National Environmental Research Institute under Aarhus University in Denmark. He is a civil engineer with a specialization in planning with 22 years of experience within traffic planning and urban air quality assessment and management. He has worked as project manager within research, consultancy and administration, and has acted as an advisor for the Danish Environmental Protection Agency and international development agencies. His main experience is within research and development of integrated modelling systems for air pollution and human exposures for application in decision-support systems in urban air quality management and in air pollution epidemiological studies. These studies include mapping, impact assessment, scenario analysis, and policy options within emission, air quality, human exposures, health and external costs of air pollution as well as environmental impacts of renewable energy systems and technologies (hydrogen, biofuels, biomass).

A3
He has published 27 peer reviewed journal articles; 2 contributions to books; 72 presentations at international conferences and seminars, 46 proceedings and other scientific papers; 51 consultancy reports, 34 popular articles & reports; and 29 popular presentations.
Indicator No. 6 - Noise pollution.
Expert: Mr. J. Luis Bento-Coelho, Professor, Instituto Superior Técnico, Lisbon, Portugal.
J. Luis Bento Coelho is an Electrical Engineer with a MSc. and a PhD. in Acoustics and is a Fellow of the International Institute of Acoustics and Vibration (IIAV). He is a Professor of Acoustics at Instituto Superior Tecnico (IST), TULisbon, Portugal, where he is the Head of the Group of Acoustics and Noise Control and the Director of the Diploma on Advances Studies on Acoustical Engineering post-graduate course. He is the Immediate Past President of the IIAV, is a member of the Expert Panel on Noise (EpoN) of the European Environmental Agency and a member of the EU-CNOSSOS Technical Committee. He is a Chartered Acoustical Engineer with a large experience on environmental noise, transportation noise and urban acoustics. He has been involved with noise mapping and action plans, being responsible for projects in large cities in Portugal and in Brazil, and for many transport infra-structures. He has published more than 200 technical and scientific papers, is the author of a chapter in the “Handbook of Acoustics & Vibration Control” (John Wiley & Sons, 2007) and is the co-author of a number of recent international technical reports.
Indicator No. 7 - Waste Production and management.
Expert: Mr. Larry O’Toole, Director, Waste and Energy Division, RPS Consulting Engineers, Dublin, Ireland.
Larry O’Toole is Director of the Waste and Energy Division at RPS Consulting Engineers. He is a Chartered Civil Engineer with 24 years experience of civil and environmental engineering and waste strategy and planning in Ireland and in the UK. He has been Project Manager for a broad range of waste and energy projects and is currently responsible for a team of engineers, scientists and waste planners providing a wide range of services to both the public and private sectors in UK and Ireland. These include national strategic studies, regional waste plans, siting studies, feasibility, design and procurement of recycling, recovery and disposal facilities and renewable energy projects including wind energy, anaerobic digestion and biofuels.
is a chartered member of Engineers Ireland and was their representative on the National Construction & Demolition Waste Council. He has presented widely on waste management including at the EU-Asia Solid Waste Management Conference in Ipoh, Malaysia in 2008 and at the International Conference on Cities and Climate Change, New Delhi, India, in 2011.
A4
Indicator No. 8 - Water consumption.
Expert: Mr. Giovanni Bidoglio, Head of Water Resources Unit, Institute for Environment and Sustainability, Joint Research Centre, European Commission, Italy.
Giovanni Bidoglio is Head of Unit at the Joint Research Centre of the European Commission where he provides science-based support to the implementation of EU Directives and Action Plans related to water resources, nature, regional and agricultural policies, and he interfaces research networks with EU policy making. His research interests include the sustainable management of water and ecosystem resources, mapping of ecosystem services, modelling of bio-geochemical fate and hydrological processes of pollutants, environmental risk assessment and environmental monitoring. His previous work included research on soil and groundwater protection and greenhouse gas emissions from natural ecosystems, and assessments of impacts of agri-environmental and rural development measures. He is member of various advisory boards and has published widely in the scientific press.
Indicator No. 9 - Waste water treatment.
Expert: Ms Eduarda Beja Neves, Principal Researcher, Hydraulic and Environment Department, National Laboratory of Civil Engineering, Lisbon, Portugal.
Eduarda Beja Neves is Senior Researcher at the Environment and Water Department of the National Laboratory of Civil Engineering in Lisbon, Portugal (since 2003). She graduated in Chemical Engineering (1976) and specialized in Sanitary Engineering (1977). From 1986 to 1990, she got her PhD at Purdue University Civil Engineering School (environment department) (USA). From1995 to 1999 she was Associate Professor at the Civil Engineering Department of Instituto Superior Técnico in Lisbon where she graduated. Her research interests include water quality, water and wastewater treatment, performance indicators for urban waste services and, more recently, strategic environmental assessment, and water governance (in a changing world). She is author and co-author of a significant number of a broad range of publications including Technical Reports, Communications and Papers (to national and international meetings), Articles in books and in journals, Books, and Technical Advices.
She is Member and current Vice-President of the Water Resources Portuguese Association (APRH), she is Member of the Sanitary and Environmental Engineering Portuguese Association (APESB), and Member of the Engineers Professional Association, both under the Chemical Engineering and the Environmental Engineering Colleges.

A5
Indicator No. 10 - Eco-innovation and sustainable e mployment.
Expert: Mr. Lars Mortensen, Head of Group, Sustainable Consumption & Production and Waste, European Environment Agency, Denmark.
Lars Fogh Mortensen has since 2006 been heading the work of the European Environment Agency (EEA) on sustainable consumption and production, including resource use and waste. His current responsibilities include providing analytical inputs to the EU road map on resource efficiency, the review of the EU action plan on sustainable consumption and production (including eco-innovation), various EU waste directives and to the EU and UN policy processes on green economy towards Rio+20. Previously, his responsibilities in the EEA included integrated environmental assessments, policy effectiveness evaluations and sustainable consumption. He is a trained economist from the University of Copenhagen and has over 15 years of experience on analytical and policy aspects of sustainable development from various international organisations. Prior to joining the EEA in 2003, Lars has worked at the OECD Environment Directorate, the secretariat of the UN Commission on Sustainable Development, the Danish Ministry of Environment and the European Topic Centre on Waste and Material Flows.
Lars has written and co-written a large number of reports and articles on various aspects of sustainable development. Highlights include the 2010 EEA assessment on consumption and the environment; the 2005 EEA report on household consumption and the environment; the 2001 OECD environmental outlook; the 2001 OECD environment strategy; the 1998 UN report on measuring sustainable consumption and production; and the 1995 UN report on indicators of sustainable development. He regularly makes keynotes and presentations on various aspects of sustainable development sustainable consumption and production, and he currently sits in various European and global advisory boards and panels.
Indicator No. 11 - Environmental management of the local authority.
Expert: Ms Maria Berrini, Director, Ambiente Italia, Milan, Italy.
Born in Milan in 1956, she graduated in architecture at Politecnico di Milano. From 1981 she worked as a consultant, previously with Cooperativa Ecologia and then with Ambiente Italia of which she is President since the foundation. She coordinated dozens of European projects and hundreds of professional activities on local sustainability and environmental planning, spatial assessment, urban indicators, integrated environmental management. She has been for ten years the Italian member of the “Urban Environment Experts” Group of the European Commission and speaker in all conferences organized by the European Sustainable Cities Campaign. Since 2008 she is a member of the evaluation panel for the European Green Capital Award. In 2009 she was elected to the Board of Architects of Milan. Since 2011 she is a member of the Expert Group for the Reference Framework for Sustainable Cities and has been elected to the Board of Trustees of the Green Building Council Italy. She cared the exhibition and the catalogue "Green Life, build sustainable cities" (2010 La Triennale, Milan), co-author of "European Common Indicators“ (DGENV 2003); "Ensuring quality of life in Europe's cities and towns" (EEA, 2009) and “Measuring urban sustainability” (CE –DGENV, 2010).

A6
Indicator No. 12 - Energy performance.
Expert: Mr. Per Berg, Professor in Landscape planning with a special focus on Sustainable Community Development at the Swedish University of Agricultural Sciences, Uppsala.
Per G. Berg is professor in Landscape Planning with a special focus on Sustainable Community Development in Urban and Rural settings. He has been Research Director for local community studies in 11 cities in the Baltic Sea region for 20 years and is at present investigating functional densification in Swedish townscapes in three cities. He has recently taken the initiative to study Sustainable Cities in a Research consortium including 12 European cities from north-Eastern St Petersburg to Southern Milan as a lead partner in a FP7 EU application currently under full evaluation. The Research of sustainable cities and local communities is done theoretically drawing from the cutting-edge policy documents of the UN Habitat agenda, in practical case studies and in leading a practical implementation project in Uppsala Sweden. With a background in Biology and Chemistry he has for 30 years had a particular interest in renewable energy issues.
Per G. Berg is member of the ICE Engineering Sustainability Journal and Journal of Environmental Quality Editorial Advisory Board and currently organiser of the 4th international landscape architecture conference in St. Petersburg in June 2011.

A1
APPENDIX C
Technical Ranking of 18 Applicant Cities for the European Green Capital Award 2014 Title –
Final Combined ranking by the EGC Secretariat

A1
Technical Ranking of 18 Applicant Cities for the Eu ropean Green Capital Award 2014 Title
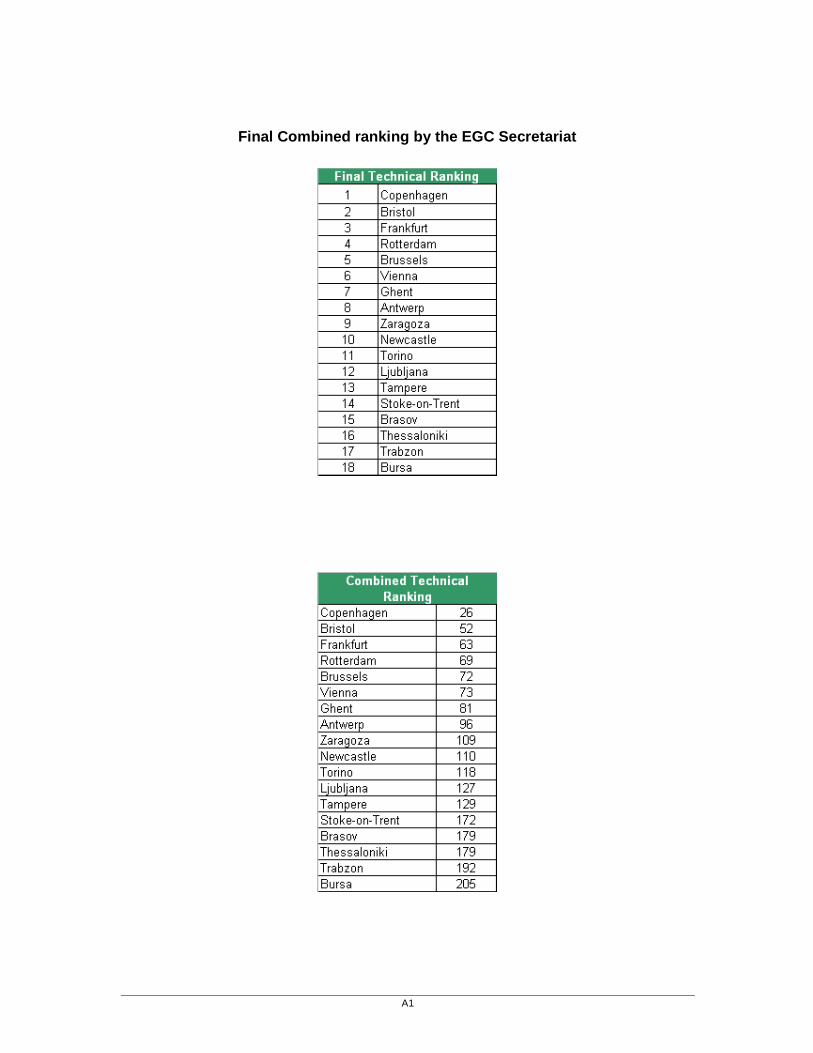
A1
Final Combined ranking by the EGC Secretariat