Mba Guide Presentation
32
MBA Guide-Part 1
-
Upload
anuppresentations -
Category
Data & Analytics
-
view
20 -
download
0
Transcript of Mba Guide Presentation

MBA Guide-Part 1

Indian Households(Study based on 121311 individuals spread across all States & Union Territories in India)

Types of House Holds in IndiaFree Birds
Single Independents
Nest BuildersYoung Married couples without
Children
Baby SittersMarried Couple with
eldest child below 12 years
Maturing MentorsMarried Couple with
youngest child above 12 years
Vintage Wines/Empty Nesters
Middle aged or elderly married couples without
children living in
Lone familiesDivorcee/widow/
widower
DynastiesJoint families
Early StageNest builders & baby sitters together

87.9% of Indian households has income from Rs.1-18000
11.21% has income from Rs.18001-100000
0.14% has income above Rs.100000

Asset Ownership Penetration
The most common physical asset owned by Indian Households is a Bicycle followed by Food processor/Mixer Grinder/Juicer/Hand BlenderIn terms of financial asset ownership, chit fund ownership penetration is far more than ownership of shares, Mutual Funds & Govt or RBI Bonds

Working women State Wise
Puducherry has the highest % of women who work & is only state to have more than 30% of women population
States like Madhya Pradesh, Bihar & Orissa have a greater % of women population working than developed states like Maharashtra, Karnataka &
Gujarat

How the Rich Spend in India

Survey with 150 Ultra High Net Worth Individuals revealed the following

UHNI’s continue to spend mainly on Gold & Jewellery
followed by cars & clothes(i.e, Others)
In addition to luxury watches, mobiles are becoming
increasingly popular as gifts to close friends
Majority of the respondents stated the preferred vacation
destination are beaches followed by Weekend Getaway & Mountain/Trek/Islands
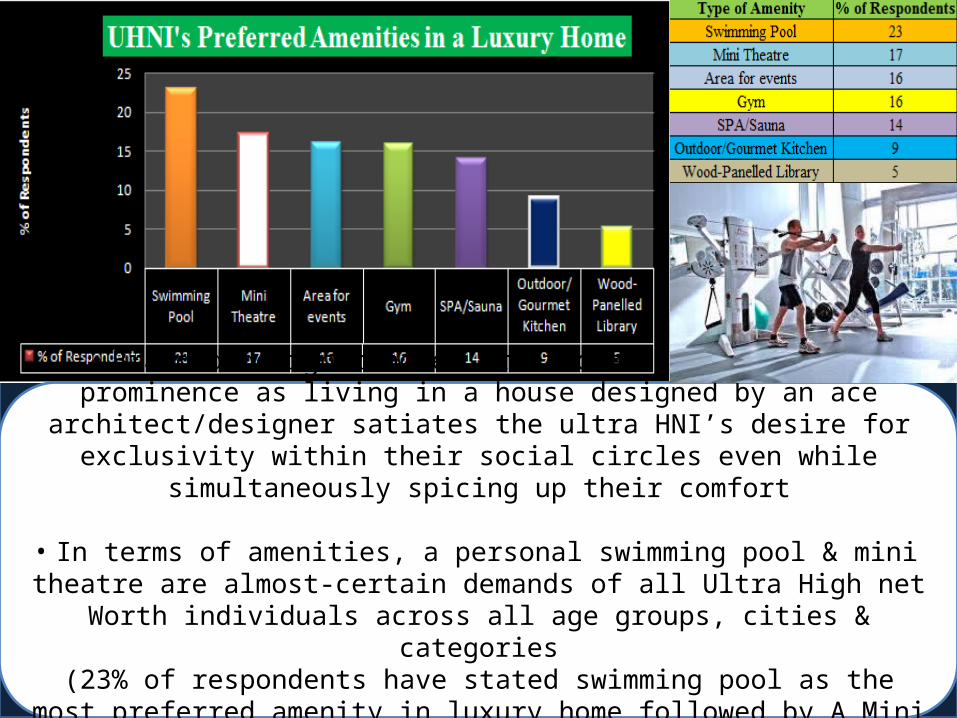
• Branded designer homes are increasingly gaining prominence as living in a house designed by an ace architect/designer satiates the ultra HNI’s desire for exclusivity
within their social circles even while simultaneously spicing up their comfort
• In terms of amenities, a personal swimming pool & mini theatre are almost-certain demands of all Ultra High net Worth individuals across all age groups, cities &
categories(23% of respondents have stated swimming pool as the most preferred amenity in
luxury home followed by A Mini Theatre )
The dynamics of eating Out(Survey conducted among 1,200 SEC A & B consumers across 24 cities in India followed by 8 focused groups
discussion across 6 cities)

Aspiring AdolescentsAged between 14 &
17 Years of Age financially dependent
on their parents
Mimic BeginnersCollege students between 18 & 21
years of age highly aware of the latest options & trends
Newbie ShopaholicsPeople aged 22-25
years, either enrolled in Post
Graduate/embarked on a professional
career
Responsibly Spendthrift
Age Group 26-30,focused heavily on professional growth &
possibly recently married
Cautious SpendersPeople between 30-40
years of age with large financial &
social commitments usually towards their growing children &
ageing parents
Consumer Segmentation for eating-out Behavior
Nonchalant IndulgersConsumers in the age group of 40-45 years
who have by and large fulfilled their financial & social responsibility

Frequency of Eating-Out
o Aspiring Adolescents-22% of this group eats out more than twice a week while 61% eat out once a week. This frequency of eating out is similar in Metros, Mini-Metros & Tier 1 cities
o Mimic Beginners-In this Group, the frequency of eating out is weekly for nearly 55% with over 21% eating out 2-3 times a week

Newbie Shoaholics-60% of his Group engages in eating out weekly. The nature of eating out is transitioning from impulsive to planned visits as the group has recently started earningResponsibility Spendthrift-This group has a high frequency of eating out with nearly 57% eating out on a weekly basis due to both personal & professional commitments

Cautious Spenders-The overall regularity of eating out is moderate wit over 51% of the respondents eating out on a weekly basis. The remaining respondents comprise of
mix of nearly 27% who indulge 2-3 times a week & 18% with passive eating out behavior(not more than twice a month
Nonchalant Indulgers-Nearly 57% of the consumers eat out weekly

Reasons for Eating Out
• All figures are in % of respondents preferences

Average Spends (in Rs) at each Format by Consumer Groups

Education: The Business Lessons


Indian Higher Education Market Sizeo Market Size-$ 11 Billion
o Graph Analysiso It is evident from the graph that although Arts contributes the maximum in terms of no. of students(37%),its contribution in terms of market size is < 1 %
o Engineering & Technology comprising of 16% of the
enrolled students, accounts for over 82% of the market
o Indian higher education segment is overregulated & yet
under-governed. There are multiple regulatory bodies with
overlapping roles & responsibilities.
(Further education is included in he concurrent list of the constitution which implies that its is under the purview of both Central as well as
State Govt)


Gross Enrollment Ratio (GER) is a statistical measure used in the education sector and by the UN in its Education Index to determine the number of students enrolled in school at
several different grade levels
Formulae for calculating GER = Number of students enrolled in educational sector of different levels / Population of school age children of these levels.
Ex: If a nation has 900,000 people enrolled in school in the academic year 2005/06, this number is divided by the total number of school-age individuals. Suppose this number is
1,000,000. This means 90 percent of the people are enrolled or that 90 percent is the Gross Enrollment Ratio of that nation
Indian Govt has set an aggressive target of
achieving a GER of 30% by 2020

Media & Entertainment

Media & Entertainment-Industry Size & Projections

Advertising Revenue for Media & Entertainment

Desktop Internet Advertising
Mobile Advertising
CAGR of 32%
Analysis of the below Grapho Growing at close to 40%,the online ad market(excluding Mobile)in India touched
Rs.2000 Cr in 2012 & is expected to grow at a 32% CAGR to reach Rs.7400 Cr in 2017
o Mobile advertising accounts for a small share of the market estimated at Rs.170 Cr

Print Industry Overview(in INR Billion)

Indian Population Viewership Share of Regional Channels
Top 10 categories advertising on television

Market Size of Regional Channels
Bhojpuri Market consist of the
States of Eastern UP, Bihar &
Jharkand Top Three
regional channels by market size;
1)Tamil2)Telugu3)Bangla


Anup George Rebello
Asst.Manager
The Catholic Syrian Bank Ltd