Matrilineal evidence for demographic expansion, low diversity and ...
14
ORIGINAL ARTICLE Matrilineal evidence for demographic expansion, low diversity and lack of phylogeographic structure in the Atlantic forest endemic Greenish Schiffornis Schiffornis virescens (Aves: Tityridae) G. S. Cabanne • E. H. R. Sari • D. Meyer • F. R. Santos • C. Y. Miyaki Received: 14 January 2012 / Revised: 19 August 2012 / Accepted: 24 September 2012 Ó Dt. Ornithologen-Gesellschaft e.V. 2012 Abstract Studies of Atlantic forest (AF) organisms sug- gest that the historical dynamics of the forest cover pro- duced demographically stable populations in its central region and unstable populations in the southern regions. We studied the mitochondrial phylogeographic structure of an AF passerine, the Greenish Schiffornis Schiffornis virescens (Tityridae), and evaluated questions related to the history of the AF. We analyzed cytochrome b and control region sequences of the mitochondrial genome by traditional phylogenetic and population genetic methods based on summary statistics. In addition, we used coalescent simu- lations to evaluate specific models of evolution of the populations of S. virescens. The results did not support phylogeographic partitions of the genetic variability of S. virescens. The overall Ust was = 0.32 and gene flow between regions was moderate to high. The analyses sug- gested that the total population of S. virescens suffered a bottleneck followed by a demographic expansion in the late Pleistocene. The bottleneck might have contributed to the extinction of intraspecific lineages, and hence to the observed lack of a strong phylogeographic pattern and low genetic diversity. Our results suggest that some AF taxa have had all their populations similarly affected by the recent history of the biome, contrary to what has been revealed from most of the other phylogeographic studies in the region and as suggested by a model of AF refuges (the Carnaval–Moritz model). We suggest that the response of organisms to common histories may be idiosyncratic, and predictions about the history of the biome should take into account ecological characteristics and distribution of each specific taxa. Keywords Atlantic forest Phylogeography mtDNA Schiffornis Historical demography Zusammenfassung Matrilineare Hinweise auf demografische Expansion, geringe genetische Diversita ¨t und fehlende phylogeogr- afische Struktur bei der Olivtrauerkotinga Schiffornis virescens (Aves: Tityridae), einer endemischen Vogelart der Mata Atlantica Untersuchungen an Organismen der Mata Atlantica deuten darauf hin, dass die historische Dynamik der Waldbedeckung dort demografisch stabile Populationen in den inneren Bereichen und instabile Populationen in den su ¨dlichen Regionen hervorgebracht hat. Wir betrachteten Communicated by J. Fjeldsa ˚. Electronic supplementary material The online version of this article (doi:10.1007/s10336-012-0901-8) contains supplementary material, which is available to authorized users. G. S. Cabanne D. Meyer C. Y. Miyaki Departamento de Gene ´tica e Biologia Evolutiva, Instituto de Biocie ˆncias, Universidade de Sa ˜o Paulo, Rua do Mata ˜o 277, Sa ˜o Paulo, SP 05508-090, Brazil G. S. Cabanne CONICET, Av. Rivadavia 1917, C1033AAJ Ciudad de Buenos Aires, Argentina G. S. Cabanne (&) Divisio ´n de Ornitologı ´a, Museo Argentino de Ciencias Naturales ‘‘B. Rivadavia’’, A ´ ngel Gallardo 470, C1405DJR Ciudad de Buenos Aires, Argentina e-mail: [email protected] E. H. R. Sari F. R. Santos Departamento de Biologia Geral, Instituto de Cie ˆncias Biolo ´gicas, Universidade Federal de Minas Gerais, Av. Anto ˆnio Carlos 6627, Belo Horizonte, MG 31270-901, Brazil 123 J Ornithol DOI 10.1007/s10336-012-0901-8
Transcript of Matrilineal evidence for demographic expansion, low diversity and ...

ORIGINAL ARTICLE
Matrilineal evidence for demographic expansion, low diversityand lack of phylogeographic structure in the Atlantic forestendemic Greenish Schiffornis Schiffornis virescens(Aves: Tityridae)
G. S. Cabanne • E. H. R. Sari • D. Meyer •
F. R. Santos • C. Y. Miyaki
Received: 14 January 2012 / Revised: 19 August 2012 / Accepted: 24 September 2012
� Dt. Ornithologen-Gesellschaft e.V. 2012
Abstract Studies of Atlantic forest (AF) organisms sug-
gest that the historical dynamics of the forest cover pro-
duced demographically stable populations in its central
region and unstable populations in the southern regions. We
studied the mitochondrial phylogeographic structure of an
AF passerine, the Greenish Schiffornis Schiffornis virescens
(Tityridae), and evaluated questions related to the history of
the AF. We analyzed cytochrome b and control region
sequences of the mitochondrial genome by traditional
phylogenetic and population genetic methods based on
summary statistics. In addition, we used coalescent simu-
lations to evaluate specific models of evolution of the
populations of S. virescens. The results did not support
phylogeographic partitions of the genetic variability of
S. virescens. The overall Ust was = 0.32 and gene flow
between regions was moderate to high. The analyses sug-
gested that the total population of S. virescens suffered a
bottleneck followed by a demographic expansion in the late
Pleistocene. The bottleneck might have contributed to the
extinction of intraspecific lineages, and hence to the
observed lack of a strong phylogeographic pattern and low
genetic diversity. Our results suggest that some AF taxa
have had all their populations similarly affected by the
recent history of the biome, contrary to what has been
revealed from most of the other phylogeographic studies in
the region and as suggested by a model of AF refuges (the
Carnaval–Moritz model). We suggest that the response of
organisms to common histories may be idiosyncratic, and
predictions about the history of the biome should take into
account ecological characteristics and distribution of each
specific taxa.
Keywords Atlantic forest � Phylogeography � mtDNA �Schiffornis � Historical demography
Zusammenfassung
Matrilineare Hinweise auf demografische Expansion,
geringe genetische Diversitat und fehlende phylogeogr-
afische Struktur bei der Olivtrauerkotinga Schiffornis
virescens (Aves: Tityridae), einer endemischen Vogelart
der Mata Atlantica
Untersuchungen an Organismen der Mata Atlantica
deuten darauf hin, dass die historische Dynamik der
Waldbedeckung dort demografisch stabile Populationen in
den inneren Bereichen und instabile Populationen in den
sudlichen Regionen hervorgebracht hat. Wir betrachteten
Communicated by J. Fjeldsa.
Electronic supplementary material The online version of thisarticle (doi:10.1007/s10336-012-0901-8) contains supplementarymaterial, which is available to authorized users.
G. S. Cabanne � D. Meyer � C. Y. Miyaki
Departamento de Genetica e Biologia Evolutiva, Instituto de
Biociencias, Universidade de Sao Paulo, Rua do Matao 277,
Sao Paulo, SP 05508-090, Brazil
G. S. Cabanne
CONICET, Av. Rivadavia 1917, C1033AAJ Ciudad de Buenos
Aires, Argentina
G. S. Cabanne (&)
Division de Ornitologıa, Museo Argentino de Ciencias Naturales
‘‘B. Rivadavia’’, Angel Gallardo 470, C1405DJR Ciudad de
Buenos Aires, Argentina
e-mail: [email protected]
E. H. R. Sari � F. R. Santos
Departamento de Biologia Geral, Instituto de Ciencias
Biologicas, Universidade Federal de Minas Gerais, Av. Antonio
Carlos 6627, Belo Horizonte, MG 31270-901, Brazil
123
J Ornithol
DOI 10.1007/s10336-012-0901-8

die mitochondriale phylogeografische Struktur bei der
Olivtrauerkotinga S. virescens (Tityridae), einem Sper-
lingsvogel der Mata Atlantica, und untersuchten Fragen im
Zusammenhang mit der Geschichte dieses atlantischen
Waldes. Wir analysierten Sequenzen von Cytochrom b und
von Kontrollregionen des mitochondrialen Genoms unter
Anwendung der gebrauchlichen phylogenetischen und
populationsgenetischen Methoden auf der Grundlage
statistischer Parameter. Zusatzlich verwendeten wir Coa-
lescent Simulations, um spezifische Evolutionsmodelle fur
die Populationen von S. virescens zu testen. Die Ergebnisse
konnten keine phylogeografischen Untereinheiten in der
genetischen Variabilitat von S. virescens belegen. Der
Gesamtwert fur Ust betrug 0,32 und der Genfluss zwischen
den Regionen war maßig bis hoch. Die Analysen deuten
an, dass die gesamte Population von S. virescens zunachst
durch einen genetischen Flaschenhals ging, worauf an-
schließend im Oberen Pleistozan eine demografische
Expansion erfolgte. Dieser Flaschenhals konnte zum Aus-
sterben intraspezifischer Abstammungslinien und somit
zum beobachteten Mangel an deutlichen phylogeografi-
schen Mustern und zu der geringen genetischen Diversitat
beigetragen haben. Unsere Ergebnisse legen nahe, dass bei
manchen Taxa der Mata Atlantica alle Populationen durch
die jungere Geschichte dieses Bioms ahnlich beeinflusst
wurden. Dies steht im Gegensatz zu den Erkenntnissen der
meisten anderen phylogeografischen Studien aus dieser
Region und zu einem Modell atlantischer Waldrefugien
(Carnaval–Moritz-Modell). Wir vermuten, dass verschie-
dene Organismen selbst auf eine gemeinsame Geschichte
in ihrer ganz eigenen Weise reagieren. Prognosen uber die
Geschichte des Bioms sollten daher immer auch die oko-
logischen Eigenschaften und die Verbreitung jedes ein-
zelnen Taxons berucksichtigen.
Introduction
The Atlantic forest (AF) of Brazil, northeastern Argentina
and eastern Paraguay is amongst the richest and most
endangered rainforests in the world (Galindo Leal and de
Gusmao Camara 2003) (Fig. 1). Congruence among paly-
nological studies (i.e. Behling 2002; Behling and Negrelle
2001; Ledru et al. 2005), and models of paleo-distribution
of forests and of some species of frogs (Carnaval and Moritz
2008; Carnaval et al. 2009), suggest that during the late
Pleistocene the southern AF was strongly fragmented by the
advance of grasslands and of other savanna-like vegetation.
In contrast, the central and northern AF were relatively
stable. More precisely, during the last glacial maximum
(between 24,000 to 18,000 before present; Anderson et al.
2007), the southern grassland–forest ecotone seemed to
have shifted 750 km north from its current location, which
was possibly established in the late Holocene (Behling
2002). Under the former scenario of temporal and geo-
graphic stability–instability of the AF (Carnaval and Moritz
(2008), hereafter the Carnaval–Moritz model, the majority
of the forest-dependent taxa should have been similarly
affected by the retraction and fragmentation of forests
during the Pleistocene, and therefore the existence of shared
phylogeographic patterns is expected.
The Carnaval–Moritz model has received particular
support from some phylogeographic studies with forest
birds (i.e. Maldonado-Coelho 2012; Cabanne et al. 2008;
d’Horta et al. 2011), frogs (Carnaval et al. 2009) and bees
(Batalha-Filho et al. 2010). But, on the other hand, the
model has been recently challenged by a phylogeographic
study of the Rhinella crucifer group of toads (Thome et al.
2010) and by a study of planarians (Alvarez-Presas et al.
2011), which did not find support for a southern AF Holo-
cene colonization and therefore suggest persistence of for-
ested habitats in the south (a southern refuge). In addition,
the existence of a southern refuge is further supported by a
recent study with species distribution models of several
endemic taxa (Porto et al. 2012).
In the present study, we used sequence data derived from
mitochondrial DNA (mtDNA) to explore the population
genetic structure of the Greenish Schiffornis Schiffornis
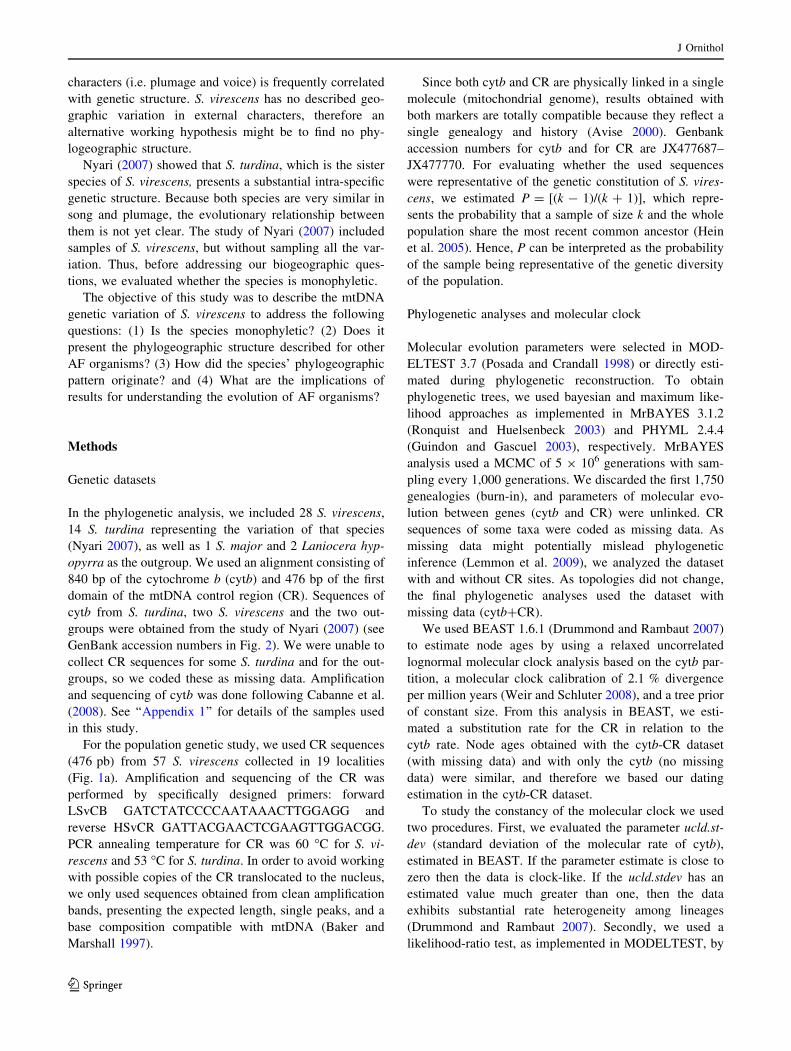
virescens (Tityridae; Remsen et al. 2009) (Fig. 1a) and to
address questions of the AF history. S. virescens is a good
model to address issues related to the AF history because it
is endemic to the biome and occurs with low to medium
density in well-preserved forests (Stotz et al. 1996). The
species does not present geographic variation in plumage,
song or morphometry (Ridgely and Tudor 1996). Since it
inhabits the understory of preserved forests and is sensitive
to forest fragmentation (Anjos et al. 2011; Stotz et al. 1996),
chances to have been affected by Pleistocene fragmentation
of habitat, and therefore to present a strong population
genetic structure, are high (Burney and Brumfield 2009).
Assuming that most AF organisms were affected similarly
by the Pleistocene forest dynamics, we expected to find in
S. virescens results similar to those obtained by other
studies of AF organisms, which apparently revealed a
shared phylogeographic pattern (Maldonado-Coelho 2012;
Batalha-Filho et al. 2010; Grazziotin et al. 2006; Cabanne
et al. 2007, 2008; Mustrangi and Patton 1997; Carnaval
et al. 2009; d’Horta et al. 2011; Pessoa 2007). This shared
pattern for each species consists of the existence of two
main mtDNA clades south of the Doce river that come into
contact in south-central Sao Paulo where no barrier to gene
flow is evident (Fig. 1a, b). In addition, some species
present a third lineage north of the Doce river (Cabanne
et al. 2008; d’Horta et al. 2011; Maldonado-Coelho 2012).
Another characteristic of the shared phylogeographic pat-
tern is that the corresponding southern clades present
J Ornithol
123

evidence of population expansion, differently to clades
north of the Doce river. These shared phylogeographic
features could be the product of alterations in the forest
cover that occurred during the late Pleistocene, as would be
expected from the Carnaval–Moritz model.
Phylogeographic studies of AF organisms are still scant
and a robust synthetic hypothesis about the evolution of AF
organisms is not yet possible (but see Carnaval et al. 2009;
Martins et al. 2011). Up to now, the selection of AF species
for phylogeographic studies was not only driven by bio-
geographic questions but also by systematic issues in
polymorphic taxa (i.e. Cabanne et al. 2008). This aspect
may have biased the possibility of finding complex phy-
logeographic patterns because variation in external
1
910 11
12,13,14
16
15
17
19
18
IIIII
IV
0 400
kilometers
S.virescens ’distribution
Hypothetical phylogeographicbarriers for S.virescens
Phylogeographic gaps in otherorganisms (I,II,III,IV).
Atlantic Forest
Doce river
2,3
4,5
6,7
8
I
Genetic samples and regions
Southeastern Atlantic Forest (SEAF)
Southern Atlantic Forest (SAF)
Central Atlantic Forest (CAF)
CentralSão Paulo
a
b Predicted phylogeographic pattern
With demographicexpansion
Expected structureamong regions: >0.2Φct
Fig. 1 a Distribution of the
Atlantic forest (AF), of
Schiffornis virescens and of the
sampling localities for the
genetic study. See ‘‘Appendix
1’’ for details of sampling
localities. Phylogeographic
barriers observed in other AF
organisms are: barrier I, the
passerine Sclerurus scansor(d’Horta et al. 2011), the
passerine Xiphorhynchus fuscus(Cabanne et al. 2008), the
passerine Pyriglena leucoptera(Maldonado-Coelho 2012),
frogs of the genus Hypsiboas(Carnaval et al. 2009), and the
toad Rhinella crucifer (Thome
et al. 2010); barrier II, opossum
Marmosops incanus (Mustrangi
and Patton 1997), the passerines
Sclerurus scansor (d0Horta
2009) and Conopophaga lineata(Pessoa et al. 2006; Pessoa
2007); barrier III, the passerines
Xiphorhynchus fuscus (Cabanne
et al. 2007, 2008) and Sclerurusscansor (d’Horta et al. 2011),
frogs of the genus Hypsiboas(Carnaval et al. 2009), and
monkeys of genus Alouatta(Martins et al. 2011); barrier IV,
the passerine Dendrocolaptesplatyrostris (Cabanne et al.
2011), the bee Meliponaquadrifasciata (Batalha-Filho
et al. 2010), the viper Bothropsjararaca (Grazziotin et al.
2006), the frogs Hypsiboasfaber (Carnaval et al. 2009),
Proceratophrys boiei (Amaro
et al. 2012) and another frog of
the genus Thoropa (Fitzpatrick
et al. 2009). b Predicted
phylogeographic pattern in
S. virescens based on the
genetic constitution of other AF
species (see a). The predicted
genetic structure among regions
(Uct [ 0.2) is related to a level
of gene flow that is not
sufficient to avoid allele fixation
and strong divergence (Wang
2004)
J Ornithol
123
characters (i.e. plumage and voice) is frequently correlated
with genetic structure. S. virescens has no described geo-
graphic variation in external characters, therefore an
alternative working hypothesis might be to find no phy-
logeographic structure.
Nyari (2007) showed that S. turdina, which is the sister
species of S. virescens, presents a substantial intra-specific
genetic structure. Because both species are very similar in
song and plumage, the evolutionary relationship between
them is not yet clear. The study of Nyari (2007) included
samples of S. virescens, but without sampling all the var-
iation. Thus, before addressing our biogeographic ques-
tions, we evaluated whether the species is monophyletic.
The objective of this study was to describe the mtDNA
genetic variation of S. virescens to address the following
questions: (1) Is the species monophyletic? (2) Does it
present the phylogeographic structure described for other
AF organisms? (3) How did the species’ phylogeographic
pattern originate? and (4) What are the implications of
results for understanding the evolution of AF organisms?
Methods
Genetic datasets
In the phylogenetic analysis, we included 28 S. virescens,
14 S. turdina representing the variation of that species
(Nyari 2007), as well as 1 S. major and 2 Laniocera hyp-
opyrra as the outgroup. We used an alignment consisting of
840 bp of the cytochrome b (cytb) and 476 bp of the first
domain of the mtDNA control region (CR). Sequences of
cytb from S. turdina, two S. virescens and the two out-
groups were obtained from the study of Nyari (2007) (see
GenBank accession numbers in Fig. 2). We were unable to
collect CR sequences for some S. turdina and for the out-
groups, so we coded these as missing data. Amplification
and sequencing of cytb was done following Cabanne et al.
(2008). See ‘‘Appendix 1’’ for details of the samples used
in this study.
For the population genetic study, we used CR sequences
(476 pb) from 57 S. virescens collected in 19 localities
(Fig. 1a). Amplification and sequencing of the CR was
performed by specifically designed primers: forward
LSvCB GATCTATCCCCAATAAACTTGGAGG and
reverse HSvCR GATTACGAACTCGAAGTTGGACGG.
PCR annealing temperature for CR was 60 �C for S. vi-
rescens and 53 �C for S. turdina. In order to avoid working
with possible copies of the CR translocated to the nucleus,
we only used sequences obtained from clean amplification
bands, presenting the expected length, single peaks, and a
base composition compatible with mtDNA (Baker and
Marshall 1997).
Since both cytb and CR are physically linked in a single
molecule (mitochondrial genome), results obtained with
both markers are totally compatible because they reflect a
single genealogy and history (Avise 2000). Genbank
accession numbers for cytb and for CR are JX477687–
JX477770. For evaluating whether the used sequences
were representative of the genetic constitution of S. vires-
cens, we estimated P = [(k - 1)/(k ? 1)], which repre-
sents the probability that a sample of size k and the whole
population share the most recent common ancestor (Hein
et al. 2005). Hence, P can be interpreted as the probability
of the sample being representative of the genetic diversity
of the population.
Phylogenetic analyses and molecular clock
Molecular evolution parameters were selected in MOD-
ELTEST 3.7 (Posada and Crandall 1998) or directly esti-
mated during phylogenetic reconstruction. To obtain
phylogenetic trees, we used bayesian and maximum like-
lihood approaches as implemented in MrBAYES 3.1.2
(Ronquist and Huelsenbeck 2003) and PHYML 2.4.4
(Guindon and Gascuel 2003), respectively. MrBAYES
analysis used a MCMC of 5 9 106 generations with sam-
pling every 1,000 generations. We discarded the first 1,750
genealogies (burn-in), and parameters of molecular evo-
lution between genes (cytb and CR) were unlinked. CR
sequences of some taxa were coded as missing data. As
missing data might potentially mislead phylogenetic
inference (Lemmon et al. 2009), we analyzed the dataset
with and without CR sites. As topologies did not change,
the final phylogenetic analyses used the dataset with
missing data (cytb?CR).
We used BEAST 1.6.1 (Drummond and Rambaut 2007)
to estimate node ages by using a relaxed uncorrelated
lognormal molecular clock analysis based on the cytb par-
tition, a molecular clock calibration of 2.1 % divergence
per million years (Weir and Schluter 2008), and a tree prior
of constant size. From this analysis in BEAST, we esti-
mated a substitution rate for the CR in relation to the
cytb rate. Node ages obtained with the cytb-CR dataset
(with missing data) and with only the cytb (no missing
data) were similar, and therefore we based our dating
estimation in the cytb-CR dataset.
To study the constancy of the molecular clock we used
two procedures. First, we evaluated the parameter ucld.st-
dev (standard deviation of the molecular rate of cytb),
estimated in BEAST. If the parameter estimate is close to
zero then the data is clock-like. If the ucld.stdev has an
estimated value much greater than one, then the data
exhibits substantial rate heterogeneity among lineages
(Drummond and Rambaut 2007). Secondly, we used a
likelihood-ratio test, as implemented in MODELTEST, by
J Ornithol
123

comparing the log-likelihood values of maximum likeli-
hood trees with and without enforcing a molecular clock.
Lastly, visualization of relationships among CR haplo-
types was done by a median-joining network constructed in
NETWORK 4.1.0.8 (http://www.fluxus-engineering.com).
Population genetic analysis
All the population genetic analyses used only the CR
dataset because this marker was more variable than the
cytb. To test the existence of phylogeographic barriers
(gene flow barriers between populations), we used analyses
of molecular variance (AMOVA) in ARLEQUIN 3.1 (Ex-
coffier et al. 2006) based on uncorrected distances. Spe-
cifically, we evaluated the Uct statistic, which represents the
proportion of the total molecular diversity variance that is
explained by genetic differences among geographic regions.
These regions were delimited by the hypothetical phylog-
eographic barriers (Fig. 1a). Uct = Va/Vt, where Va is the
molecular variance among groups and Vt is the total
molecular variance (Excoffier et al. 1992). We also
evaluated Ust = (Va ? Vb)/Vt, where Vb is the molecular
variance among populations within groups (Excoffier et al.
1992). Significance and confidence intervals of fixation
indices were calculated based on 20,000 permutations.
We estimated the parameter H by a maximum likelihood
coalescent method as implemented in LAMARC 2.1.2b
(Kuhner 2006). We also used LAMARC to evaluate the
demographic signature by estimating the exponential pop-
ulation growth rate g of the model Ht = Hnowe-gt, where
Hnow is the current H and Ht is the value of the parameter
t time ago. Positive g values indicate population growth and
negative values indicate population decline. Runs used the
F84 model of sequence evolution with empirical base fre-
quencies and transition/transversion ratios, and default
characteristics of the Markov Chain Montecarlo.
We also evaluated the historical demography using the
neutrality tests of Tajima (1989) and of Fu (1997) in
DNAsp 5.1 (Librado and Rozas 2009). If the marker is
selectively neutral (not positively selected), significant
negative values of the test statistics suggest demographic
expansion. In addition, to evaluate the hypothesis of
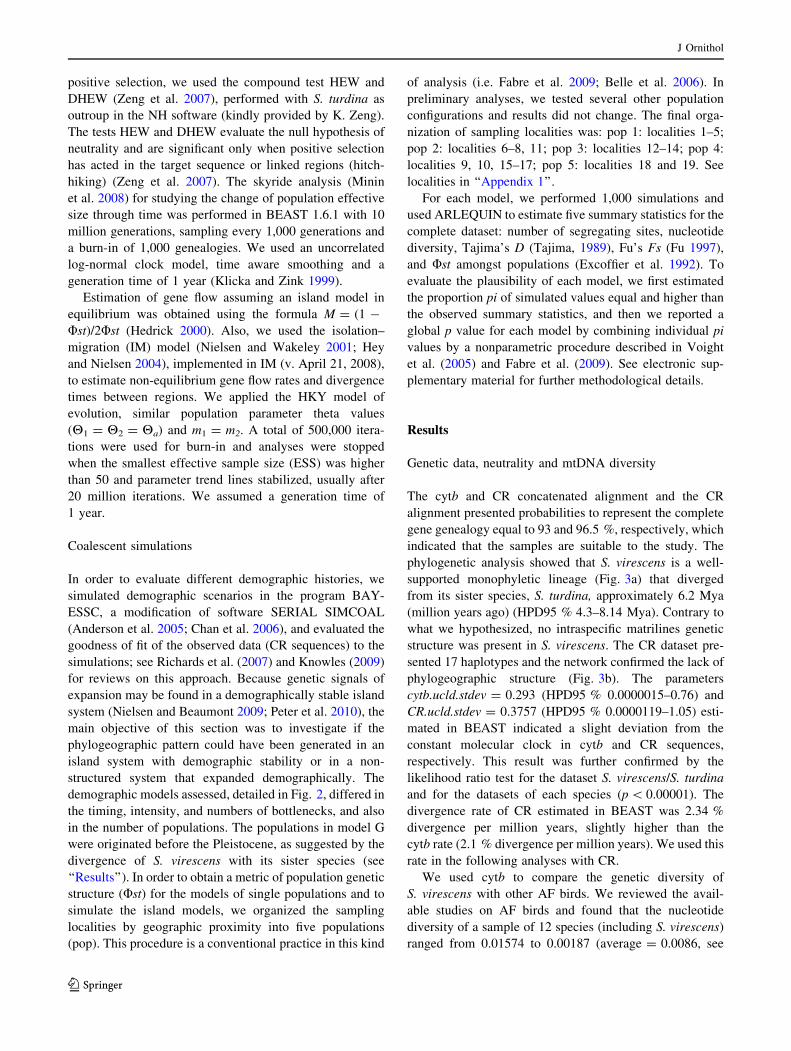
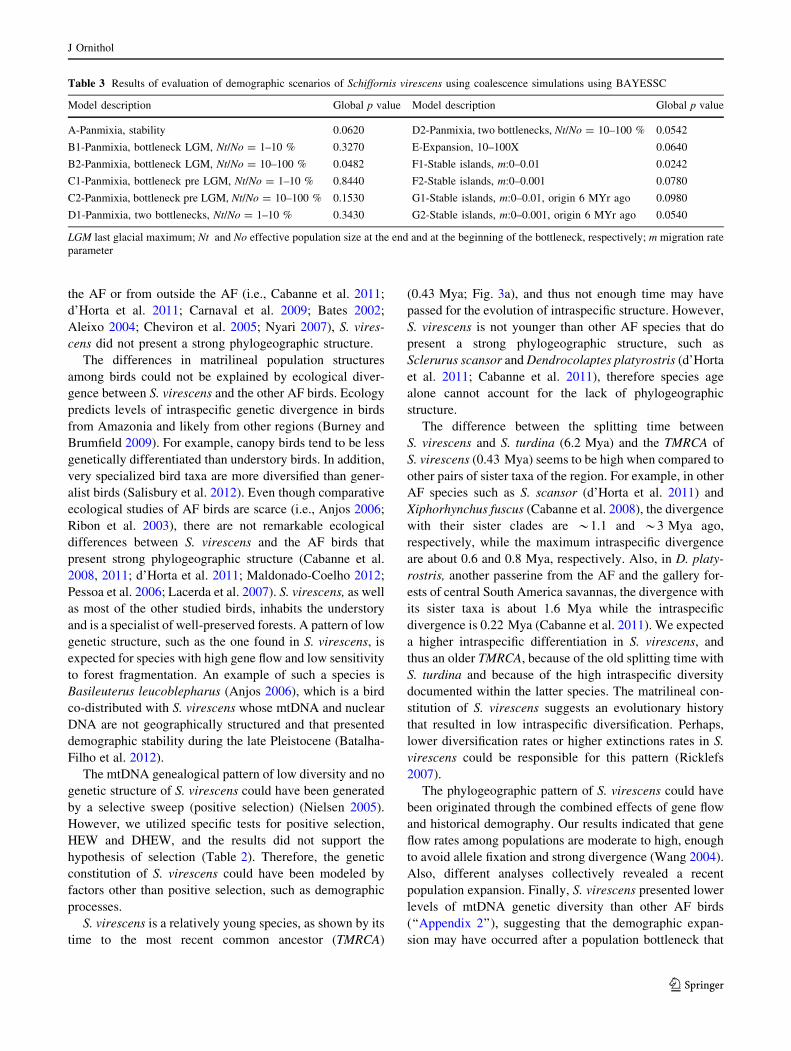
a
b
Fig. 2 a Demographic models of Schiffornis virescens evaluated by
coalescent simulations in BAYESSC. We simulated populations
(shown in black) that suffered different historical events (He):
stability (A), bottlenecks (B–D), expansion (E), and the evolution in
an island system (F, G). b Details of historical events and population
parameters used in simulations. The prior distribution of time of
events (t), migration (m) and of the demographic growth rate (r) are
specified. Continuous priors are denoted between parentheses.
Normally distributed priors are denoted by their mean and standard
distribution (SD). Intensities of bottlenecks are indicated by the
proportion of the current effective size (Ne) that persisted during the
bottleneck. Time is expressed in kilo-years (ky). LGM last glacial
maximum
J Ornithol
123
positive selection, we used the compound test HEW and
DHEW (Zeng et al. 2007), performed with S. turdina as
outroup in the NH software (kindly provided by K. Zeng).
The tests HEW and DHEW evaluate the null hypothesis of
neutrality and are significant only when positive selection
has acted in the target sequence or linked regions (hitch-
hiking) (Zeng et al. 2007). The skyride analysis (Minin
et al. 2008) for studying the change of population effective
size through time was performed in BEAST 1.6.1 with 10
million generations, sampling every 1,000 generations and
a burn-in of 1,000 genealogies. We used an uncorrelated
log-normal clock model, time aware smoothing and a
generation time of 1 year (Klicka and Zink 1999).
Estimation of gene flow assuming an island model in
equilibrium was obtained using the formula M = (1 -
Ust)/2Ust (Hedrick 2000). Also, we used the isolation–
migration (IM) model (Nielsen and Wakeley 2001; Hey
and Nielsen 2004), implemented in IM (v. April 21, 2008),
to estimate non-equilibrium gene flow rates and divergence
times between regions. We applied the HKY model of
evolution, similar population parameter theta values
(H1 = H2 = Ha) and m1 = m2. A total of 500,000 itera-
tions were used for burn-in and analyses were stopped
when the smallest effective sample size (ESS) was higher
than 50 and parameter trend lines stabilized, usually after
20 million iterations. We assumed a generation time of
1 year.
Coalescent simulations
In order to evaluate different demographic histories, we
simulated demographic scenarios in the program BAY-
ESSC, a modification of software SERIAL SIMCOAL
(Anderson et al. 2005; Chan et al. 2006), and evaluated the
goodness of fit of the observed data (CR sequences) to the
simulations; see Richards et al. (2007) and Knowles (2009)
for reviews on this approach. Because genetic signals of
expansion may be found in a demographically stable island
system (Nielsen and Beaumont 2009; Peter et al. 2010), the
main objective of this section was to investigate if the
phylogeographic pattern could have been generated in an
island system with demographic stability or in a non-
structured system that expanded demographically. The
demographic models assessed, detailed in Fig. 2, differed in
the timing, intensity, and numbers of bottlenecks, and also
in the number of populations. The populations in model G
were originated before the Pleistocene, as suggested by the
divergence of S. virescens with its sister species (see
‘‘Results’’). In order to obtain a metric of population genetic
structure (Ust) for the models of single populations and to
simulate the island models, we organized the sampling
localities by geographic proximity into five populations
(pop). This procedure is a conventional practice in this kind
of analysis (i.e. Fabre et al. 2009; Belle et al. 2006). In
preliminary analyses, we tested several other population
configurations and results did not change. The final orga-
nization of sampling localities was: pop 1: localities 1–5;
pop 2: localities 6–8, 11; pop 3: localities 12–14; pop 4:
localities 9, 10, 15–17; pop 5: localities 18 and 19. See
localities in ‘‘Appendix 1’’.
For each model, we performed 1,000 simulations and
used ARLEQUIN to estimate five summary statistics for the
complete dataset: number of segregating sites, nucleotide
diversity, Tajima’s D (Tajima, 1989), Fu’s Fs (Fu 1997),
and Ust amongst populations (Excoffier et al. 1992). To
evaluate the plausibility of each model, we first estimated
the proportion pi of simulated values equal and higher than
the observed summary statistics, and then we reported a
global p value for each model by combining individual pi
values by a nonparametric procedure described in Voight
et al. (2005) and Fabre et al. (2009). See electronic sup-
plementary material for further methodological details.
Results
Genetic data, neutrality and mtDNA diversity
The cytb and CR concatenated alignment and the CR
alignment presented probabilities to represent the complete
gene genealogy equal to 93 and 96.5 %, respectively, which
indicated that the samples are suitable to the study. The
phylogenetic analysis showed that S. virescens is a well-
supported monophyletic lineage (Fig. 3a) that diverged
from its sister species, S. turdina, approximately 6.2 Mya
(million years ago) (HPD95 % 4.3–8.14 Mya). Contrary to
what we hypothesized, no intraspecific matrilines genetic
structure was present in S. virescens. The CR dataset pre-
sented 17 haplotypes and the network confirmed the lack of
phylogeographic structure (Fig. 3b). The parameters
cytb.ucld.stdev = 0.293 (HPD95 % 0.0000015–0.76) and
CR.ucld.stdev = 0.3757 (HPD95 % 0.0000119–1.05) esti-
mated in BEAST indicated a slight deviation from the
constant molecular clock in cytb and CR sequences,
respectively. This result was further confirmed by the
likelihood ratio test for the dataset S. virescens/S. turdina
and for the datasets of each species (p \ 0.00001). The
divergence rate of CR estimated in BEAST was 2.34 %
divergence per million years, slightly higher than the
cytb rate (2.1 % divergence per million years). We used this
rate in the following analyses with CR.
We used cytb to compare the genetic diversity of
S. virescens with other AF birds. We reviewed the avail-
able studies on AF birds and found that the nucleotide
diversity of a sample of 12 species (including S. virescens)
ranged from 0.01574 to 0.00187 (average = 0.0086, see
J Ornithol
123

‘‘Appendix 2’’ for details). S. virescens presented the
smallest diversity (cytb nucleotide diversity = 0.00187)
among the 12 species considered.
The AMOVA results did not support any of the
hypothesized genetic barriers (Table 1). All Uct values
were small and not significant, which indicates that most of
the variation in the mtDNA of S. virescens was organized
among and within populations, and not among regions
separated by the tested barriers. In addition, the global Ust
value (Ust = 0.3184) indicated a moderate population
genetic structure among localities, which corresponded to
moderate equilibrium gene flow of *1.1 females per gen-
eration among populations. The analysis in IM indicated
moderate to high gene flow between regions separated by
the putative phylogeographic barriers (Fig. 1a): MCAF–SAF:
0.8 females (HPD95 % 0–6.5), MCAF–SEAF: 5.5 females
(HPD95 % 1.6–42.7); and MSAF–SEAF: 10.4 females
(HPD95 % 1.7–?). All divergence times correspond to the
late Pleistocene: TCAF–SAF: 0.16 MYA (HPD95 %
0.04–0.7), TCAF–SEAF: 0.1 MYA (HPD95 % 0.0014–0.5);
and TSAF–SEAF: 0.06 MYA ([0.012). However, as all
posterior distributions of divergence estimations are very
wide (results not shown), populations cannot be considered
as independent, which confirms the absence of population
structure in S. virescens.
The summary statistics tests collectively suggested a
demographic expansion in S. virescens (Table 2). The
neutrality–demographic tests suggested a demographic
expansion because Fu’s tests were significant. Results of
the test of Tajima were borderline but compatible with the
Fu’s tests because the D statistics were negative. Results of
the positive selection tests did not support the action of
positive selection; however, some p values are borderline
significant. The demographic analysis in LAMARC further
corroborated that S. virescens expanded recently (positive
g = 932, HPD95 % CI: 367–1966). The Skyride plot
analysis showed the existence of a moderate expansion
during the late Pleistocene, near 21 times the initial Ne
(Fig. 3c). The region of origin of the demographic expan-
sion should present the highest level of genetic diversity.
However, because the three regions into which we divided
the study area (Fig. 1a; CAF, SEAF and SAF) presented
a
c
b
Fig. 3 a Bayesian phylogenetic tree based on 1,533 bp of the
cytb and control region of the mtDNA of Shiffornis virescens and
closely related species. Each gene partition used the model of
molecular evolution GTR?I?G with parametes specifically esti-
mated. Posterior probability obtained in MrBAYES (Bay. prob) and
maximum likelihood bootstrap (ML Boot, 500 replicates) are
presented at nodes. Divergence dates were obtained in BEAST based
in the cytb molecular clock (Weir and Schluter 2008). b Median
joining network based on 476 bp of the mtDNA control region of
S. virescens. c Skyride plot showing the variation in population
effective (Ne) size through time
J Ornithol
123

similar levels of genetic diversity (results not shown), the
origin of the expansion was not detected.
Simulations results
Results of the evaluation of demographic models by
coalescent simulations are presented in Table 3. The
model A of panmixia and demographic stability, the
model E of panmixia and expansion, and the models of
islands and demographic stability F and G obtained low
global probabilities, indicating they all have low plausi-
bility. All the models with high global probability (p value
[0.1: models B, C, and D) suggest that S. virescens
suffered bottlenecks during the glacial maxima followed
by posterior recovering of the population effective size. In
particular, the model with highest p value (model C1,
p = 0.84) suggests that S. virescens is conformed by a
single population that suffered an intense bottleneck
before the last glacial maxima.
The results of these simulations are compatible with the
analysis performed in LAMARC, as well as with the
demographic summary statistics and the skyride plot, col-
lectively suggesting that the species suffered an expansion
during the late Pleistocene. A genetic pattern compatible
with demographic expansion could also result from an
island system with demographic stability, but our simula-
tions did not support this situation (models F and G).
Discussion
Schiffornis virescens was found to be monophyletic, and
presented low mtDNA genetic diversity and a weak pop-
ulation genetic structure. In addition, the genetic partitions
across genetic barriers important for other organisms were
not found to be influential for S. virescens. These results
are in contrast to what was found in its sister species,
S. turdina, and in other AF taxa dependent on preserved
forests. S. turdina has high genetic diversity and substantial
phylogeographic structure (Nyari 2007). Within the lineage
S. virescens/S. turdina, the most ancient split separated
birds from the AF (S. virescens) from birds associated
primarily to the Amazon and Central America forests
(S. turdina). Interestingly, and as observed in some other
taxa (i.e. Cabanne et al. 2008; Ribas et al. 2005), the AF
lineage showed shorter branches and lower genetic dis-
tances among terminals (Fig. 3a), a pattern that suggests
different evolutionary dynamics in both Schiffornis species
(Ricklefs 2007). Also, contrary to what was expected
according to other Neotropical rainforest organisms from
Table 1 Analyses of molecular variance of Schiffornis virescens based on the mtDNA control region and the testing of phylogeographic barriers
Tested
barrieraPopulation structureb Ust (95 % c.i.) Ust p
value
Uct (95 % c.i.) Uct pvalue
No barrier [(2–3), (4–5), (6–7), 10, 11, (12–13), 14,
9, (15–15), 17, 18, 19]
0.3185 (0.0710–0.4717) \0.00001 – –
CSP [(2–3), (4–5), (6–7), 10, 11, (12–13), 14]
[9, (15–15), 17, 18, 19]
0.3348 (0.0911–0.4825) \0.00001 0.0528 (0.0148–0.0896) 0.0733
DR [(2–3), (4–5)] [(6–7), 10, 11, (12–13), 14,
9, (15–15), 17, 18, 19]
0.3367 (0.0513–0.5044) \0.00001 0.0405 (0.1253–0.2871) 0.2308
CSP and DR [(2–3), (4–5)] [(6–7), 10, 11, (12–13), 14]
[9, (15–15), 17, 18, 19]
0.3227 (0.0766–0.4720) \0.00001 0.0220 (0.0627 –0.1598) 0.1899
a See Fig. 1a for localities and tested phylogeographic barriers (CSP, Central-Sao Paulo, and DR Doce riverb Numbers represent localities from Table 1. Specific structures indicated by samples within square brackets. Localities within parenthesis were
pooled to form a new sample. Localities 1 and 8 were excluded due to small sample sizes
Table 2 Diversity indices and test of significance of neutrality–demography in Shiffornis virescens
Alignmenta n Number of
segregating sites
Nucleotide
diversity
Neutrality–demographic test p values Positive
selection test
p values
Tajima’s test (statistic) Fu’s test (statistic) HEW DHEW
cytb and CR (1533 pb) 28 13 0.00272 (SE 0.00059) 0.04 (D = -1.578) 0.001** (Fs = -8.484) 0.0706 0.0425
CR (476pb) 57 13 0.0041 (SE 0.0013) 0.038 (D = -1.47) 0.002** (Fs = -7.5) 0.027 0.0178
a cytb cytochrome b, CR control region
** Significant test at 1 % level after Bonferroni correction for four tests
J Ornithol
123
the AF or from outside the AF (i.e., Cabanne et al. 2011;
d’Horta et al. 2011; Carnaval et al. 2009; Bates 2002;
Aleixo 2004; Cheviron et al. 2005; Nyari 2007), S. vires-
cens did not present a strong phylogeographic structure.
The differences in matrilineal population structures
among birds could not be explained by ecological diver-
gence between S. virescens and the other AF birds. Ecology
predicts levels of intraspecific genetic divergence in birds
from Amazonia and likely from other regions (Burney and
Brumfield 2009). For example, canopy birds tend to be less
genetically differentiated than understory birds. In addition,
very specialized bird taxa are more diversified than gener-
alist birds (Salisbury et al. 2012). Even though comparative
ecological studies of AF birds are scarce (i.e., Anjos 2006;
Ribon et al. 2003), there are not remarkable ecological
differences between S. virescens and the AF birds that
present strong phylogeographic structure (Cabanne et al.
2008, 2011; d’Horta et al. 2011; Maldonado-Coelho 2012;
Pessoa et al. 2006; Lacerda et al. 2007). S. virescens, as well
as most of the other studied birds, inhabits the understory
and is a specialist of well-preserved forests. A pattern of low
genetic structure, such as the one found in S. virescens, is
expected for species with high gene flow and low sensitivity
to forest fragmentation. An example of such a species is
Basileuterus leucoblepharus (Anjos 2006), which is a bird
co-distributed with S. virescens whose mtDNA and nuclear
DNA are not geographically structured and that presented
demographic stability during the late Pleistocene (Batalha-
Filho et al. 2012).
The mtDNA genealogical pattern of low diversity and no
genetic structure of S. virescens could have been generated
by a selective sweep (positive selection) (Nielsen 2005).
However, we utilized specific tests for positive selection,
HEW and DHEW, and the results did not support the
hypothesis of selection (Table 2). Therefore, the genetic
constitution of S. virescens could have been modeled by
factors other than positive selection, such as demographic
processes.
S. virescens is a relatively young species, as shown by its
time to the most recent common ancestor (TMRCA)
(0.43 Mya; Fig. 3a), and thus not enough time may have
passed for the evolution of intraspecific structure. However,
S. virescens is not younger than other AF species that do
present a strong phylogeographic structure, such as
Sclerurus scansor and Dendrocolaptes platyrostris (d’Horta
et al. 2011; Cabanne et al. 2011), therefore species age
alone cannot account for the lack of phylogeographic
structure.
The difference between the splitting time between
S. virescens and S. turdina (6.2 Mya) and the TMRCA of
S. virescens (0.43 Mya) seems to be high when compared to
other pairs of sister taxa of the region. For example, in other
AF species such as S. scansor (d’Horta et al. 2011) and
Xiphorhynchus fuscus (Cabanne et al. 2008), the divergence
with their sister clades are *1.1 and *3 Mya ago,
respectively, while the maximum intraspecific divergence
are about 0.6 and 0.8 Mya, respectively. Also, in D. platy-
rostris, another passerine from the AF and the gallery for-
ests of central South America savannas, the divergence with
its sister taxa is about 1.6 Mya while the intraspecific
divergence is 0.22 Mya (Cabanne et al. 2011). We expected
a higher intraspecific differentiation in S. virescens, and
thus an older TMRCA, because of the old splitting time with
S. turdina and because of the high intraspecific diversity
documented within the latter species. The matrilineal con-
stitution of S. virescens suggests an evolutionary history
that resulted in low intraspecific diversification. Perhaps,
lower diversification rates or higher extinctions rates in S.
virescens could be responsible for this pattern (Ricklefs
2007).
The phylogeographic pattern of S. virescens could have
been originated through the combined effects of gene flow
and historical demography. Our results indicated that gene
flow rates among populations are moderate to high, enough
to avoid allele fixation and strong divergence (Wang 2004).
Also, different analyses collectively revealed a recent
population expansion. Finally, S. virescens presented lower
levels of mtDNA genetic diversity than other AF birds
(‘‘Appendix 2’’), suggesting that the demographic expan-
sion may have occurred after a population bottleneck that
Table 3 Results of evaluation of demographic scenarios of Schiffornis virescens using coalescence simulations using BAYESSC
Model description Global p value Model description Global p value
A-Panmixia, stability 0.0620 D2-Panmixia, two bottlenecks, Nt/No = 10–100 % 0.0542
B1-Panmixia, bottleneck LGM, Nt/No = 1–10 % 0.3270 E-Expansion, 10–100X 0.0640
B2-Panmixia, bottleneck LGM, Nt/No = 10–100 % 0.0482 F1-Stable islands, m:0–0.01 0.0242
C1-Panmixia, bottleneck pre LGM, Nt/No = 1–10 % 0.8440 F2-Stable islands, m:0–0.001 0.0780
C2-Panmixia, bottleneck pre LGM, Nt/No = 10–100 % 0.1530 G1-Stable islands, m:0–0.01, origin 6 MYr ago 0.0980
D1-Panmixia, two bottlenecks, Nt/No = 1–10 % 0.3430 G2-Stable islands, m:0–0.001, origin 6 MYr ago 0.0540
LGM last glacial maximum; Nt and No effective population size at the end and at the beginning of the bottleneck, respectively; m migration rate
parameter
J Ornithol
123

reduced genetic diversity. This bottleneck might have
contributed to the extinction of intraspecific mtDNA lin-
eages, leading to the observed lack of a strong phylogeo-
graphic pattern and low genetic diversity in S. virescens.
Different effective population sizes, demography, or the
lack of recognition of different species in S. turdina might
be responsible for the differences in mtDNA genetic
diversity and structure between S. virescens and S. turdina.
S. turdina inhabits all the Amazonian basin forests, part of
Central America forests, and part of northeastern AF. Thus,
its geographic range is nearly five times larger than that of
S. virescens, which may imply a larger population and
therefore higher genetic diversity for S. turdina. In addi-
tion, S. turdina has several highly divergent phylogroups
that, with further study, might be considered as good spe-
cies (Nyari 2007).
The phylogeographic pattern of a species can be
shaped by the history of the biome in which it is found
(Hewitt 2000, 2004). Our results, specifically the lack of a
strong phylogeographic structure, the low genetic diver-
sity, a most recent common ancestor in the mid-Pleisto-
cene, and the evidence of demographic expansion for the
whole species, suggest that the Ne of S. virescens was
reduced greatly during the late Pleistocene, likely to a
population restricted to a single continuous forest (refuge)
of uncertain location. Interestingly, the magnitude of the
demographic expansion of S. virescens (*21 9 initial
Ne; Fig. 3c) is similar to that described for some taxa
from the northern hemisphere that were highly affected by
the cycles of forest shrinkage—expansion that occurred
during global glaciations (e.g., Catharus ustulatus; Ruegg
et al. 2006).
Most populations of S. virescens inhabit a region whose
rainforest coverage fluctuated during the Pleistocene,
which could be the reason why they presented a shared
demographic history. Specifically, the majority of the range
of the bird is located in the southern portion of the AF,
which was the most affected by natural fragmentation and
expansion of savanna-like vegetation during the global
glaciations (Carnaval et al. 2009; Behling 2002; Behling
et al. 2002). This is different from those taxa that persisted
in the same period in more than one population, and whose
geographic ranges also span historically stable forests in
central and northern AF (e.g., d’Horta et al. 2011; Cabanne
et al. 2008, 2011; Thome et al. 2010).
Our results were not fully compatible with the predic-
tions derived from the Carnaval–Moritz model (Fig. 1b),
but they were still in accordance with some aspects of the
hypotheses of the AF history. Most published studies on
AF organisms suggest that the Pleistocene dynamics pro-
duced stable populations in the central region and unstable
populations in the southern portion. We did not recover this
pattern in S. virescens, but rather documented that its
association to the southern AF and relatively short age was
crucial for this resulting pattern. The Carnaval–Moritz
model is not powerful enough to predict the distribution of
Pleistocene refugia of organisms restricted to the south-
east–south portion of the AF (Porto et al. 2012), and our
results suggested that its power to predict phylogeographic
patterns of those organisms is also low. Independent of the
origin of the phylogeographic structure within S. virescens,
our results indicated that some AF taxa have had all their
extant populations similarly affected by the recent history
of the biome, contrary to what has been revealed from most
of the other phylogeographic studies of species from the
region. Therefore, the response of organisms to common
histories may be idiosyncratic, and predictions about the
history of the biome should take into account ecological
characteristics and distribution of each specific taxa.
Acknowledgments We thank R.G. Lima, A. Martensen, M. Marini,
A. Uezu and J.P. Metzger for providing us with some tissue samples.
We also thank IBAMA, Instituto Florestal (SP, Brazil), Instituto Es-
tadual de Florestas (MG, Brazil) and the Ministerio de Ecologıa de
Misiones (Argentina) for the appropriate permits. We are also grateful
to Conservacion Argentina (G. Zurita and D. Varela), J. Albuquerque,
F. d0Horta, R. Pessoa, F. Nodari and T. Matsumoto for assistance
during fieldwork. V.A. Ellis, L. Calderon and L. Campagna provided
useful comments that improved an early version of the manuscript.
Finally, we thank J. Fjeldsa and the Associate Editor F. Bairlein for
the revision and comments that helped to improve the manuscript.
This study was funded by Coordenacao de Aperfeicoamento de
Pessoal de Nıvel Superior (Brazil), Consejo Nacional de Investigac-
iones Cientıficas y Tecnicas (Argentina, grant PIP 276), Agencia
Nacional de Promocion Cientıfica y Tecnologica (Argentina, grant
PICT 805), Fundacao de Amparo a Pesquisa do Estado de Minas
Gerais (Brazil), Fundacao de Amparo a Pesquisa do Estado de Sao
Paulo (Brazil) and WWF (USA). All experiments comply with the
current laws of the country in which they were performed. The
authors declare that they have no conflict of interest.
J Ornithol
123

Appendix 1
See Table 4.
Table 4 Schiffornis virescens and S. turdina sampling localities and sample information used in the present study
Taxa Locality Sample
size
Tissue IDTISSUE
S.virescens
1-Bonito, Bahia. 11�56’S, 41�150W (pop1) 1 LGEMA P2263b
2-Ecological station Acaua, Leme do Prado, Minas
Gerais (MG). 17�40S, 42�400W1 B2284b
3-Turmalina, MG. 17�160S, 42�430W 7 B1990b, B1989b, B2279b, B2280b, B2281b, B2282b, B2283b
4-Jequitinhonha (Mata Escura), MG. 16�200S,
41�000W1 B1091b
5-Jose Goncalves de Minas, MG. 15�000S, 40�250W 1 B2285b
6-Nova Lima, MG, 19�500S, 43�490W 1 B1570b
7-Sao Bartolomeu (Grande Mata), MG, 20�170S,
43�350W1 B1022b
8-Santa Teresa, Espırito Santo (ES). 19�560S,
40�340W1 B1711b
9-Morro do Diabo State Park, Sao Paulo (SP).
22�300S, 52�180W10 All from LGEMA: P1965b, P1867b, P1957b, P1960b, P1959b,
P1973b, P2158b, P1494b, P1989b, P1388b
10-Barreiro Rico, SP. 22�380S, 48�130W 2 LGEMA P1703M, LGEMA P1686M
11-Itatiaia Natl. Park, Rio de Janeiro. 22�250S,
44�360W.
5 Al from LGEMA: P1322b, P1346b, P1339b, P1332b, P1333b
12-Piedade, SP. 1 LGEMA P681M
13-Morro Grande State Park, SP. 23�420S, 46�590W 10 All from LGEMA: P519b, P493b, P542b, P463b, P435b, P448b,
P461b, P544b, P618b, P518b
14-Juquitiba, SP, 23�530S, 47�000W 3 LGEMA P714M, LGEMA P773M, LGEMA P713M
15-Pinhalao, Parana (PR). 23�460S, 50�30W 1 LGEMA P869M
16-Wenceslau Braz, PR. 22�50S, 48�470W 2 LGEMA P958M, LGEMA P980M
17-PETAR, Caboclos station, SP, 24�280S, 48�350W 3 LGEMA P1211b, LGEMA P1220b, LGEMA P1221b
18-State Park Urugua-ı, Misiones, Argentina,
25�510S, 53�550W5 All from LGEMA: 10369M, 10341M, 10348M, 10359M, 10370M
19-Rancho Queimado, Santa Catarina. 27�400S,
49�10W2 LGEMA P1753b, LGEMA P1756b
S. turdina Novo Airao, Amazonas. 1�570S 62�210W LGEMA 9705M
Samples have been deposited at the Laboratorio de Genetica e Evolucao Molecular de Aves (LGEMA), Instituto de Biociencias, Univ. de Sao
Paulo, Brazil, and at the Departamento de Biologia Geral, Instituto de Ciencias Biologicas, Univ. Federal de Minas Gerais, Brazil (B). All
samples are from Brazil, except when otherwise indicated
TISSUE tissue type, b blood, M muscle
J Ornithol
123

Appendix 2
See Table 5.
References
Aleixo A (2002) Molecular systematics and the role of the ‘‘varzea’’ -
‘‘terra-firme’’ ecotone in the diversification of Xiphorhynchuswoodcreepers (Aves : Dendrocolaptidae). Auk 119(3):621–640
Aleixo A (2004) Historical diversification of a Terra-firme forest bird
superspecies: a phylogeographic perspective on the role of
different hypotheses of Amazonian diversification. Evolution
58(6):1303–1317
Alvarez-Presas M, Carbayo F, Rozas J, Riutort M (2011) Land
planarians (Platyhelminthes) as a model organism for fine-scale
phylogeographic studies: understanding patterns of biodiversity
in the Brazilian Atlantic Forest hotspot. J Evol Biol 24(4):
887–896
Amaro RC, Carnaval AC, Yonenaga-Yassuda Y, Trefaut Rodrigues
M (2012) Demographic processes in the montane Atlantic
rainforest: molecular and Cytogenetic evidence from the
endemic frog Proceratophrys boiei. Mol Phylogenet Evol 63:
880–888
Anderson CNK, Ramakrishnan U, Chan YL, Hadly EA (2005) Serial
SimCoal: a population genetics model for data from multiple
populations and points in time. Bioinformatics 21(8):1733–1734
Anderson D, Goudie A, Parker A, Goudie A (2007) Global
environments through the Quaternary: exploring environmental
change. Oxford University Press, Oxford
Anjos L (2006) Bird Species Sensitivity in a Fragmented Landscape
of the Atlantic Forest in Southern Brazil1. Biotropica 38(2):
229–234
Anjos L, Collins CD, Holt RD, Volpato GH, Mendonca LB, Lopes
EV, Bocon R, Bisheimer MV, Serafini PP, Carvalho J (2011)
Bird species abundance-occupancy patterns and sensitivity to
forest fragmentation: implications for conservation in the
Brazilian Atlantic forest. Biol Conserv 144:2213–2222
Avise JC (2000) Phylogeography: the history and formation of
species. Harvard University Press, Cambridge
Baker AJ, Marshall HD (1997) Mitochondrial control region
sequences as tools for understanding evolution. In: Mindell DP
(ed) Avian molecular evolution and systematics. Academic, San
Diego, pp 51–82
Batalha-Filho H, Waldschmidt AM, Campos LAO, Tavares MG,
Fernandes-Salomao TM (2010) Phylogeography and historical
demography of the Neotropical stingless bee Melipona quadri-fasciata (Hymenoptera, Apidae): incongruence between mor-
phology and mitochondrial DNA. Apidologie 41(5):534–547
Batalha-Filho H, Cabanne GS, Miyaki CY (2012) Phylogeography of
an Atlantic forest passerine reveals demographic stability through
the last glacial maximum. Mol Phylogenet Evol. http://dx.doi.org/
10.1016/j.ympev.2012.08.010
Bates JM (2002) The genetic effects of forest fragmentation on five
species of Amazonian birds. J Avian Biol 33(3):276–294
Behling H (2002) South and southeast Brazilian grasslands during
Late Quaternary times: a synthesis. Palaeogeogr Palaeoclimatol
Palaeoecol 177(1–2):19–27
Behling H, Negrelle RRB (2001) Tropical rain forest and climate
dynamics of the Atlantic lowland, Southern Brazil, during the
late Quaternary. Quat Res 56(3):383–389
Behling H, Arz HW, Patzold J, Wefer G (2002) Late Quaternary
vegetational and climate dynamics in southeastern Brazil,
inferences from marine cores GeoB 3229–2 and GeoB 3202–1.
Palaeogeogr Palaeoclimatol Palaeoecol 179(3–4):227–243
Belle EM, Ramakrishnan U, Mountain JL, Barbujani G (2006) Serial
coalescent simulations suggest a weak genealogical relationship
between Etruscans and modern Tuscans. Proc Natl Acad Sci
USA 103(21):8012–8017
Burney CW, Brumfield RT (2009) Ecology predicts levels of genetic
differentiation in Neotropical birds. Am Nat 174(3):358–368
Cabanne GS, Santos FR, Miyaki CY (2007) Phylogeography of
Xiphorhynchus fuscus (Passeriformes, Dendrocolaptidae): vicar-
iance and recent demographic expansion in southern Atlantic
forest. Biol J Linn Soc 91(1):73–84
Table 5 Nucleotide diversity of cytochrome b (mtDNA) from studies of Atlantic forest passerines
Species P—nucleotide diversity Sample size Length alignment (bp) Reference
Xiphorhynchus fuscus 0.01574 (SD = 0.0022) 35 1,110 Cabanne et al. (2008); Aleixo (2002);
Irestedt et al. (2004)
Dendrocolaptes platyrostris 0.004454 (SD = 0.0012) 34 1,006 Cabanne et al. (2011); Irestedt et al. (2004)
Automolus leucophtalmus 0.00242 (SD = ?) 22 900 D0Horta (2009)
Sclerurus scansor 0.01044 (SD = 0.0020) 47 1,046 d’Horta et al. (2011)
Thamnophilus ambiguus 0.005 (SD = 0.002) 22 837 Lacerda et al. (2007)
Thamnophilus pelzelni 0.003 (SD = 0.002) 21 837 Lacerda et al. (2007)
Scytalopus speluncae 0.0395 (SD = 0.006) 31 357 Mata et al. (2009)
Scytalopus pachecoi 0.0056 (SD = 0.0023) 14 344 Mata et al. (2009)
Scytalopus petrophilus 0.0039 (SD = 0.0019) 12 344 Mata et al. (2009),
Whitney et al. (2010)
Schiffornis virescens 0.00187 (SD = 0.00062) 28 840 This study
Tachyphonus coronatus 0.00512 (SD = 0.00042) 50 990 Cabanne and Miyaki, unpublished
Basileuterus leucoblepharus 0.0058 (SD = 0.0010) 55 914 Batalha-Filho et al. (2012)
J Ornithol
123

Cabanne GS, d’Horta FM, Sari EHR, Santos FR, Miyaki CY (2008)
Nuclear and mitochondrial phylogeography of the Atlantic forest
endemic Xiphorhynchus fuscus (Aves: Dendrocolaptidae): bio-
geography and systematics implications. Mol Phylogenet Evol
49:760–773
Cabanne GS, D’Horta FM, Meyer D, Silva JMC, Miyaki CY (2011)
Evolution of Dendrocolaptes platyrostris (Aves: Furnariidae)
between the South American open vegetation corridor and the
Atlantic forest. Biol J Linn Soc 103(4):801–820
Carnaval AC, Moritz C (2008) Historical climate modeling predicts
patterns of current biodiversity in the Brazilian Atlantic forest.
J Biogeogr 35:1187–1201
Carnaval AC, Hickerson MJ, Haddad CFB, Rodrigues MT, Moritz C
(2009) Stability predicts genetic diversity in the Brazilian
Atlantic forest hotspot. Science 323(5915):785–789
Chan YL, Anderson CNK, Hadly EA (2006) Bayesian estimation of
the timing and severity of a population bottleneck from ancient
DNA. PLoS Genet 2(4):451–460
Cheviron ZA, Hackett SJ, Capparella AP (2005) Complex evolution-
ary history of a Neotropical lowland forest bird (Lepidothrixcoronata) and its implications for historical hypotheses of the
origin of Neotropical avian diversity. Mol Phylogenet Evol
36(2):338–357
d0Horta FM (2009) Filogenia molecular e filogeografia de passerifor-
mes (Aves): historia biogeografica da regiao Neotropical com
enfase na Floresta Atlantica. PhD Thesis. Universidade de Sao
Paulo, Sao Paulo
d’Horta F, Cabanne GS, Meyer D, Miyaki CY (2011) The genetic
effects of Late Quaternary climatic changes over a tropical
latitudinal gradient: diversification of an Atlantic Forest passer-
ine. Mol Ecol 20:1923–1935
Drummond A, Rambaut A (2007) BEAST: Bayesian evolutionary
analysis by sampling trees. BMC Evol Biol 7:214
Excoffier L, Smouse PE, Quattro JM (1992) Analysis of molecular
variance inferred from metric distances among DNA haplo-
types—application to human mitochondrial-DNA restriction
data. Genetics 131(2):479–491
Excoffier L, Laval G, Schneider S (2006) Arlequin ver. 3.1. an
integrated software package for population genetics data anal-
ysis. Computational and molecular population genetics Lab
(CMPG), Inst. of Zoology, Univ. of Berne
Fabre V, Condemi S, Degioanni A (2009) Genetic evidence of
geographical groups among Neanderthals. PLoS ONE
4(4):e5151
Fitzpatrick SW, Brasileiro CA, Haddad CFB, Zamudio KR (2009)
Geographical variation in genetic structure of an Atlantic Coastal
Forest frog reveals regional differences in habitat stability. Mol
Ecol 18(13):2877–2896
Fu YX (1997) Statistical tests of neutrality of mutations against
population growth, hitchhiking and background selection.
Genetics 147(2):915–925
Galindo Leal C, Camara I de G (2003) The Atlantic forest of South
America: biodiversity status, threats, and outlook. State of the
Hotspots. Island Press, Washington
Grazziotin FG, Monzel M, Echeverrigaray S, Bonatto SL (2006)
Phylogeography of the Bothrops jararaca complex (Serpentes:
Viperidae): past fragmentation and island colonization in the
Brazilian Atlantic Forest. Mol Ecol 15(13):3969–3982
Guindon S, Gascuel O (2003) A simple, fast, and accurate algorithm
to estimate large phylogenies by maximum likelihood. Syst Biol
52(5):696–704
Hedrick PW (2000) Genetics of populations, 2nd edn. Jones and
Bartlett, Boston
Hein J, Schierup MH, Wiuf C (2005) Gene genealogies, variation and
evolution : a primer in coalescent theory. Oxford University
Press, Oxford
Hewitt G (2000) The genetic legacy of the Quaternary ice ages.
Nature 405(6789):907–913
Hewitt GM (2004) Genetic consequences of climatic oscillations in
the Quaternary. Philos Trans R Soc Lond B 359(1442):183–195
Hey J, Nielsen R (2004) Multilocus methods for estimating popula-
tion sizes, migration rates and divergence time, with applications
to the divergence of Drosophila pseudoobscura and D. persim-ilis. Genetics 167(2):747–760
Irestedt M, Fjeldsa J, Ericson PGP (2004) Phylogenetic relationships of
woodcreepers (Aves: Dendrocolaptinae) incongruence between
molecular and morphological data. J Avian Biol 35(3):280–288
Klicka J, Zink RM (1999) Pleistocene effects on North American
songbird evolution. Proc R Soc Lond B 266:695–700
Knowles LL (2009) Statistical phylogeography. Annu Rev Ecol Evol
Syst 40:593–612
Kuhner MK (2006) LAMARC 2.0: maximum likelihood and Bayesian
estimation of population parameters. Bioinformatics 22(6):768–
770
Lacerda DR, Marini MA, Santos FR (2007) Mitochondrial DNA
corroborates the species distinctiveness of the Planalto (Tham-nophilus pelzelni Hellmayr, 1924) and the Sooretama (T.ambiguus Swainson, 1825) Slaty-antshrikes (Passeriformes:
Thamnophilidae). Braz J Biol 67:873–882
Ledru MP, Rousseau DD, Cruz FW, Riccomini C, Karmann I, Martin
L (2005) Paleoclimate changes during the last 100,000 yr from a
record in the Brazilian Atlantic rainforest region and interhemi-
spheric comparison. Quat Res 64(3):444–450
Lemmon AR, Brown JM, Stanger-Hall K, Lemmon EM (2009) The
effect of ambiguous data on phylogenetic estimates obtained by
maximum likelihood and Bayesian inference. Syst Biol 58(1):
130–145
Librado P, Rozas J (2009) DnaSP v5: a software for comprehensive
analysis of DNA polymorphism data. Bioinformatics 25(11):
1451–1452
Maldonado-Coelho M (2012) Climatic oscillations shape the phylo-
geographical structure of Atlantic Forest fire-eye antbirds (Aves:
Thamnophilidae). Biol J Linn Soc 105:900–924
Martins FM, Gifalli-Iughetti C, Koiffman C, Harris E (2011)
Coalescent analysis of mtDNA indicates Pleistocene divergence
among three species of howler monkey (Alouatta spp.) and
population subdivision within the Atlantic Coastal Forest
species, A. guariba. Primates 52(1):77–87Mata H, Fontana CS, Maurıcio GN, Bornschein MR, de Vasconcelos
MF, Bonatto SL (2009) Molecular phylogeny and biogeography
of the eastern Tapaculos (Aves: Rhinocryptidae: Scytalopus,
Eleoscytalopus): cryptic diversification in Brazilian Atlantic
Forest. Mol Phylogenet Evol 53(2):450–462
Minin VN, Bloomquist EW, Suchard MA (2008) Smooth skyride
through a rough skyline: Bayesian coalescent-based inference of
population dynamics. Mol Biol Evol 25(7):1459–1471
Mustrangi MA, Patton JL (1997) Phylogeography and systematics of
the Slender Mouse Opossum Marmosops (Marsupialia: Didel-
phidae). University of CaliforniaPublications in Zoology 130
Nielsen R (2005) Molecular signatures of natural selection. Annu Rev
Genet 39(1):197–218
Nielsen R, Beaumont MA (2009) Statistical inferences in phyloge-
ography. Mol Ecol 18(6):1034–1047
Nielsen R, Wakeley J (2001) Distinguishing migration from isolation:
a Markov chain Monte Carlo approach. Genetics 158(2):885–
896
Nyari AS (2007) Phylogeographic patterns, molecular and vocal
differentiation, and species limits in Schiffornis turdina (Aves).
Mol Phylogenet Evol 44(1):154–164
Pessoa RO (2007) Sistematica e Biogeografia Historica da Famılia
Conopophagidae (Aves: Passeriformes): Especiacao nas Flores-
tas da America do Sul. Universidade de Sao Paulo, Sao Paulo
J Ornithol
123

Pessoa RO, Cabanne GS, Sari EH, Santos FR, Miyaki CY (2006)
Comparative phylogeography of the Rufous Gnateater (Conop-
ophagidae) and Lesser Woodcreeper (Dendrocolaptidae): con-
gruent history of two passerines from the south American
Atlantic forest. J Ornithol 147(5):227–228
Peter BM, Wegmann D, Excoffier L (2010) Distinguishing between
population bottleneck and population subdivision by a Bayesian
model choice procedure. Mol Ecol 19(21):4648–4660
Porto TJ, Carnaval AC, da Rocha PLB (2012) Evaluating forest
refugial models using species distribution models, model filling
and inclusion: a case study with 14 Brazilian species. Divers
Distrib. doi:10.1111/j.1472-4642.2012.00944.x
Posada D, Crandall KA (1998) MODELTEST: testing the model of
DNA substitution. Bioinformatics 14(9):817–818
Remsen JV, Cadena CD, Jaramillo A, Nores M, Pacheco JF, Robbins
MB, Schulenberg TS, Stiles FG, Stotz DF, Zimmer KJ (2009) A
classification of the bird species of South America. American
Ornithologists’ Union. http://www.museum.lsu.edu/*Remsen/
SACCBaseline.html. Accessed 29 Jan 2009
Ribas CC, Gaban-Lima R, Miyaki CY, Cracraft J (2005) Historical
biogeography and diversification within the Neotropical parrot
genus Pionopsitta (Aves: Psittacidae). J Biogeogr 32(8):1409–1427
Ribon R, Simon JE, De Mattos GT (2003) Bird extinctions in Atlantic
forest fragments of the Vicosa region, southeastern Brazil.
Conserv Biol 17(6):1827–1839
Richards CL, Carstens BC, Knowles LL (2007) Distribution model-
ling and statistical phylogeography: an integrative framework for
generating and testing alternative biogeographical hypotheses.
J Biogeogr 34(11):1833–1845
Ricklefs RE (2007) Estimating diversification rates from phylogenetic
information. Trends Ecol Evol 22(11):601–610
Ridgely RS, Tudor G (1996) The birds of South America: the
Suboscine Passerines, 1st edn. University of Texas Press, Austin
Ronquist F, Huelsenbeck JP (2003) MrBayes 3: Bayesian phyloge-
netic inference under mixed models. Bioinformatics 19(12):
1572–1574
Ruegg KC, Hijmans RJ, Moritz C (2006) Climate change and the
origin of migratory pathways in the Swainson’s thrush, Catharus
ustulatus. J Biogeogr 33(7):1172–1182
Salisbury CL, Seddon N, Cooney CR, Tobias JA (2012) The latitudinal
gradient in dispersal constraints: ecological specialization drives
diversification in tropical birds. Ecol Lett 15:847–855
Stotz DF, Fitzpatrick JW, Parker TA III, Moskovits DK (1996)
Neotropical birds: ecology and conservation. University of
Chicago Press, Chicago
Tajima F (1989) Statistical-method for testing the neutral mutation
hypothesis by DNA polymorphism. Genetics 123(3):585–595
Thome MTC, Zamudio KR, Giovanelli JGR, Haddad CFB, Baldiserra
FA, Alexandrino J (2010) Phylogeography of endemic toads and
post-Pliocene persistence of the Brazilian Atlantic Forest. Mol
Phylogenet Evol 55:1018–1031
Voight BF, Adams AM, Frisse LA, Qian Y, Hudson RR, Di Rienzo A
(2005) Interrogating multiple aspects of variation in a full
resequencing data set to infer human population size changes.
Proc Natl Acad Sci USA 102(51):18508–18513
Wang JL (2004) Application of the one-migrant-per-generation rule
to conservation and management. Conserv Biol 18(2):332–343
Weir JT, Schluter D (2008) Calibrating the avian molecular clock.
Mol Ecol 17(10):2321–2328
Whitney BM, Vasconcelos MF, Silveira LF, Pacheco JF (2010)
Scytalopus petrophilus (Rock Tapaculo): a new species from
Minas Gerais, Brazil. Rev Bras Ornitol 18:73–88
Zeng K, Shi S, Wut CI (2007) Compound tests for the detection of
hitchhiking under positive selection. Mol Biol Evol 24(8):1898–
1908
J Ornithol
123