Mathematics Placement at a Community College
180
Grand Valley State University ScholarWorks@GVSU Masters eses Graduate Research and Creative Practice Winter 1995 Mathematics Placement at a Community College Bonnie E. Morris Grand Valley State University Follow this and additional works at: hp://scholarworks.gvsu.edu/theses Part of the Science and Mathematics Education Commons is esis is brought to you for free and open access by the Graduate Research and Creative Practice at ScholarWorks@GVSU. It has been accepted for inclusion in Masters eses by an authorized administrator of ScholarWorks@GVSU. For more information, please contact [email protected]. Recommended Citation Morris, Bonnie E., "Mathematics Placement at a Community College" (1995). Masters eses. 242. hp://scholarworks.gvsu.edu/theses/242
Transcript of Mathematics Placement at a Community College

Grand Valley State UniversityScholarWorks@GVSU
Masters Theses Graduate Research and Creative Practice
Winter 1995
Mathematics Placement at a Community CollegeBonnie E. MorrisGrand Valley State University
Follow this and additional works at: http://scholarworks.gvsu.edu/theses
Part of the Science and Mathematics Education Commons
This Thesis is brought to you for free and open access by the Graduate Research and Creative Practice at ScholarWorks@GVSU. It has been acceptedfor inclusion in Masters Theses by an authorized administrator of ScholarWorks@GVSU. For more information, please [email protected].
Recommended CitationMorris, Bonnie E., "Mathematics Placement at a Community College" (1995). Masters Theses. 242.http://scholarworks.gvsu.edu/theses/242
MATHEMATICS PLACEMENT ATA
COMMUNITY COLLEGE
Bonnie E. Morris
Winter, 1995
MASTERS PROJECT
Submitted to the graduate faculty at Grand Valley State University
in partial fulfillment of the Masters of Education Advisor: Dr. Dorothy Armstrong

Mathematics Placement at a Community College
There are few recently documented effectiveness studies of locally designed math
placement tests, while there are many that utilize a professionally designed test. All tests that
are used in placement whether professionally designed or created by faculty need to conform to
the same standards.
This research assimilates the current best knowledge of the qualities required of a math
placement test. It delineates the procedures required in the creation and evaluation of a valid
and reliable mathematics placement test by addressing a variety of issues. These include
calculating difficulty and discrimination indexes, validating and setting cut scores, and
evaluating test validity and effectiveness. The current effects of math education reform on
college placement and math remediation are also studied. The final chapter utilizes this
information as a guide to evaluate a locally designed math placement test.
Contents
CHAPTER ONEProblemImportance and Rationale Background .Purpose
1224
CHAPTER TWO Standardized Assessments History 6
Standardized Assessments TodayCharacteristics. . . . . . . . . 8Disadvantages .
Group Testing. . . . . . . . 9Computer Adaptive Testing . . . . . . 1 0Multiple Choice Problem . . . . . . 1 2
Placement Test CriteriaAchievement or Aptitude? . . . . . . . 1 4Predictive Achievement Test . . . . . . . 1 6Purchased versus Locally Designed
Advantages: Locally Designed . . . . . 1 7Advantages: Professionally Created . . . . . 1 8Disadvantages: Locally Designed . . . . . 20Summary . . . . . . . . 22Examples of Professionally Designed Mathematics Placement Tests 23
Construction and Evaluation of a Math Placement Test Sources . . . . . . . . . 24Procedures . . . . . . . . . 24Test Purpose . . . . . . . . . 25Specifications . . . . . . . . . 26
Calculator Usage . . . . . . . 27Creating Test Questions
Content . . . . . . . . 29Distractors . . . . . . . . 30Pool of Questions . . . . . . . 3 1
Item AnalysisContent Judgment . . . . . . . 3 2Content Bias . . . . . . . . 32Statistical Analysis . . . . . . . 33
Difficulty Index . . . . . . . 3 4Item Discrimination . . . . . . 34Item Response Theory. . . . . . 3 5

Construction and Evaluation of a Math Placement Test Cont.’Judgmental Overview . . . . . . . 36Distractor Analysis . . . . . . . 37
Test AssimilationProblem Order . . . . . . . 3 7Test Length . . . . . . . . 38Power versus Speed Tests . . . . . . 40Test Bias . . . . . . . . 41
Required Data Type . . . . . . . . 4 1Setting Performance Standards
Test Difficulty. . . . . . . . 42Cut Score Determination . . . . . . 42
Determination of Validity . . . . . . . 46Face Validity . . . . . . . . 47Content Validity . . . . . . . 47Criterion-Related Validity . . . . . . 50Concurrent Validity . . . . . . . 5 1Predictive Validity . . . . . . . 52Construct-Related Validity . . . . . . 53
Assessing Test ReliabilityDetermination of Test Reliability . . . . . 5 4
Assurance of Reliability . . . . . . . 5 5Scorer Reliability . . . . . . 5 5
Interpretation . . . . . . . . 56Test Administration
Test Anxiety . . . . . . . . 57Mandatory versus Recommended . . . . . 5 7
Math Education ReformNCTM Standards . . . . . . . . 63
NCTM - Equity Principle . . . . . 64NCTM - Calculators . . . . . . . 65NCTM - Mathematics Remediation . . . . . 6 6
Local Status of Math Education Grades 9-12Mathematics Remediation . . . . . . 66Calculator . . . . . . . . 67
Current Status of College Level Mathematics Placement and Remediation . 67Mathematics Remediation Without a Calculator . 6 8Mathematics Remediation With a Calculator . . 6 9Testing with Calculators . . . . . . 70Placement Test Reform . . . . . . 70
Potential Problem? . . . . . . 70
Summary . 71

Ill
CHAPTER THREETest Background
The College . . . . . .Math Courses . . . . . .The Purpose of Placement Test
General Test InformationPlacement
Mandatory Testing . . . .Mandatory versus Recommended Placement .
Math Anxiety . . . . . .Calculators . . . . . .
7576 79
80808182
Test StructurePower versus Speed Tests Length and Organization Test Difficulty
Overall Assessment Problem Efficiency
Statistical AnalysisSubjective Item Difficulty AnalysisDistractors
8486
88
9091 93
Assessment and ReportingCut Scores . . . . . .
Course Recommendations Data Type . . . . . .
959598
ValidationFaceContent
Item Validity .Sampling Validity Item BiasTest Effectiveness Measure
Student Demographics Basic Math Difficulty Assessment Evaluation of Recommendation Process
99102102105108108109111114
ReliabilityAssessmentAssurance
118119
IV
Conclusion . . . . 1 2 0
Dissemination . . 1 2 1
References . . . . 122
AppendicesAppendix A - Definitions . . . . . . . 1 2 9Appendix B - Item Analysis - CC Math Placement Test . . . 1 4 0Appendix C - Summary of Subjective Difficulty Ratings
CC Math Placement Test . . . . . 169Appendix D - Item Content Summary - CC Math Placement Test . . 171

CHAPTER ONE
A placement test in mathematics, given prior to enrollment, is one of the primary tools
used by two-year community colleges in student placement in the appropriate math class (Akst
& Hirsch, 1991). New enrollees at community colleges have a wide variety of mathematics
backgrounds and ability levels. Few have recent American College Test (ACT) or Scholastic
Aptitude Test (SAT) scores available for interpretation by a counselor or advisor. Many are not
recent high school graduates, and all have completed various levels of mathematics course
work. Merely reviewing a high school transcript does not adequately determine the appropriate
level of mathematics class for this type of new student.
A community college can either create a placement test of its own design or purchase an
externally developed test (Gay, 1992, McDonald, 1989; Truman, 1992). (Refer to definition in
Appendix A.) Ten years ago, a midwestem community college began using a locally developed
math placement exam since it was unable to find a purchased instrument that would satisfy all of
its needs The college presently uses the results of this to recommend student placement from
pre-algebra through trigonometry.
Problem
In the ten years that this college has used this locally developed test instrument, this
institution has not conducted any studies to verify that this instrument reflects current best
practice. No systematic statistically based studies have been conducted to confirm its ability to
successfully place students at all appropriate levels of mathematics classes.

Importance and Rationale
The college requires that most credit earning students take the math placement test prior
to enrolling in any math class. This test is given to a significant number of students each year.
For example, in the 1993-94 school year, 1,206 students had completed this test. The results
from this test are interpreted and recommendations are made for course placement. It is felt
that many students follow these recommendations, though the exact number is unknown.
Using an appropriate locally developed test instrument in math placement is not just a
local concern. Even though there are many externally produced placement tests designed,
created and tested by professional test writers, a number of community colleges in Michigan use
locally developed assessment instruments. Fifteen community colleges or 52% of the
respondents in a 1990 survey conducted by the Michigan State Board of Education used
placement tests of their own design. Eleven used their tests in various levels of mathematics
placement Only three colleges reported any dissatisfaction with their current assessment
practices, and these were primarily related to the use of the ACT Asset placement test On a
broader scale, according to a 1986 study of developmental mathematics courses, “the primary
tool for placement purposes is a departmentally developed placement test” (McDonald, 1988, as
cited in McDonald, 1989, p. 20).
Background
“Designing or selecting the appropriate instruments that will measure the full range of
student competencies at several levels is not easy” (McDonald, 1989, p. 20). A mathematics

assessment that is be utilized as a tool for placement must be a valid instrument for placing
students in the appropriate class.
Problems arise due to the basic structural differences between tests used in placement and
those used in the corresponding mathematics class. Most mathematics placement tests are
composed of a limited number of multiple-choice problems that need to be completed in a set
period of time without the aide of a calculator (Appendix A). The numerical score achieved
with this test is designed to predict with some level of accuracy the student’s potential
achievement level in a specified class. Yet, in many cases, a student’s grade in a mathematics
class is determined by scores earned with multiple assessments composed of open-ended
problems where work is shown and partial credit is possible. Class tests, in many cases, may be
completed with the aide of a calculator.
Test design and construction are also areas of concern. The development of a “good”
placement instrument requires considerable time, effort, and skill. If one mathematics placement
test is used as a screening tool, it has to test a wide variation of corresponding skill levels. This
assessment needs to be content valid yet not too long. Also, this instrument needs to have face
validity, criterion-related validity, and must have reliability (Anastasi, 1988). Related issues
such as avoiding test bias, increasing scorer reliability, setting cut score levels, and discerning
problem difficulty levels for use and positioning in the test need to be addressed in test
construction, requiring a great deal of time and effort (Appendix A).
Purchased standardized assessments are developed by experts (Appendix A) These
assessments are analyzed, revised and tested until they meet given standards of quality (Gay,
1992). Standards of administration are well defined and data regarding validity and reliability is
specified with each test. Many test manufacturers supply alternate test forms that can be used

in related correlation studies (Appendix A); yet, a number of community colleges design their
own mathematics placement assessments.
As stated previously, creating a mathematics placement test that attempts to evaluate a
full spectrum of required skills of each student at multiple levels o f course work is a difficult
task. Faculty who design placement tests are knowledgeable of mathematics but in many cases
are not knowledgeable of test design, construction, and validation (McDonald, 1989). The
process required to design, construct, and continually utilize a locally developed test needs to be
delineated.
Due to increased availability of calculators and computers, the level and type of
mathematical literacy required has changed significantly. “To be well educated mathematically
does not mean the same thing as it did 50 years ago or even ten years ago” (Schoen, 1993, p.
9) Since 1989, there has been a strong movement in mathematics education reform. Many
elementary and secondary schools have radically changed how mathematics is being taught.
These changes will affect how colleges assess student skills and the methods they use in
providing the required higher levels of mathematics education; therefore, these current issues of
mathematics reform should be incorporated in any study of current mathematics assessments.
Purpose
Since “any assessment that supports decisions of consequence must provide
commensurately dependable evidence” (Mathematical Sciences Education Board, 1993, p. 134),
this researcher will provide the following:
1. An assimilation of the current best knowledge of qualities required of mathematics
assessments that are utilized as placement tests.
2. A qualitative and quantitative descriptive study of the development, composition,
and administration of the locally developed mathematics placement test currently used at
a midwestem community college.
This study will include but not be limited to; (a) an evaluation of current content validity
related to stated curriculum, (b) an analysis of item difficulty levels and positioning in the test
instrument, (c) a study of the correlation between success on the test and success in the
corresponding class, and (d) an evaluation of success and failure rates oïfalse negatives and
false positives (Appendix A). This researcher will utilize currently computerized results of
student records pertaining to math placement test results and corresponding mathematics class
grades but will limit this study to new enrollees for the school year 1993-94.
Few recently documented effectiveness studies of college level math placement
instruments have involved a locally developed test. Most involved a criterion-related validity
study of a purchased instrument. A study that explores the steps a college should take in the
design, creation, and continual administration of an effective and reliable locally developed
instrument will be worthwhile since few existing studies evaluate the entire spectrum of
standards required of a math placement instrument designed by mathematics faculty

CHAPTER TWO
In order to assimilate the current best knowledge o f the qualities required for a
mathematics assessment used in placement decisions, the following areas will be studied: (a)
standardized assessment history, (b) standardized assessments today, (c) placement test criteria,
(d) construction and evaluation of a math placement test, and (e) the effect of current
mathematics education reform. Since the information that is available on this subject matter is
extensive, this researcher will limit the scope of this paper to an overview of these various
components.
Standardized Assessment History
The written assessment given to large numbers of people has been highly visible in
American education for most of the last century (Schoen, 1993). The first written essays were
given to students in 1845 when Boston Schools changed from the oral examination format.
When Horace Mann wrote in fa 'or of these written exams, the arguments he used resembled
those of later supporters of standardized assessments with multiple choice problems (Appendix
A) “Putting all students in a uniform situation permitted a wider coverage of content, reduced
the chance element in question choice and eliminated the possibility of favoritism on the
examiner’s part” (Anastasi, 1988, p. 15).
The evolution towards standardized assessments grew further with E. L. Thorndike’s
release of his 1904 book on mental, social, and educational measurements (Anastasi, 1988).
Thorndike and his students developed a series of achievement quality numerical scales for such
areas as handwriting (1910), arithmetic reasoning (1908), and drawing (1913). He established
reliability for his scaling techniques by obtaining several expert opinions for rating the same

specimen. The data collected was then used to create a numerical rating scale with each value
directly associated with one or more actual samples. For example, the scales used for writing
evaluations ranged from almost illegible to close to perfect (Romberg, 1992; Nitko, 1984).
Psychometrics evolved during this period of time (Appendix A).
Group testing and multiple choice problems, the two basic components of large scale
standardized testing, evolved out of necessity in the aptitude testing arena when the United
Stated entered World War I in 1917 (Anastasi, 1988). (Refer to definitions in Appendix A.)
Prior to this, most intelligence testing was conducted on an individualized basis requiring
lengthy test sessions and subjective judgments by highly trained scorers. This method was no
longer feasible when hundreds of new recruits had to be immediately classified according to
intelligence level. The use of the multiple choice problem was another technique incorporated
into the army’s group intelligence test as a method to improve efficiency. This type of problem
was introduced by A. S. Otis, in an unpublished group intelligence test he designed as a
graduate student (Anastasi).
In the educational arena, T. L. Kelley, G. M. Ruch, and L. M. Terman created a series of
achievement batteries called the Stanford Achievement Test in 1923. These early tests provided
data that compared student performance in different school subjects to that of a norm-group
(Anastasi, 1988). It satisfied the definition of being a norm-referenced (Appendix A) in
that it determined the examinee’s relative position to others. Most early tests were of this type
(Nitko, 1984).
Romberg (1992) indicated that these early tests had three basic characteristics: (a) Each
generated a single score which compared individuals on what was assumed to be a fixed one
dimensional trait, (b) Each question had only one correct answer, making evaluation objective.

8
(c) All subjects received the same directions, the same test, and had the same amount of time for
completion. This methodology “grew out of the machine age thinking of the industrial
revolution of the last century when speed and efiBciency were the primary concern” (pp. 17-18).
This format continues in many standardized assessments used today.
As stated previously most of the early tests were norm-referenced because the primary
concern was identifying the relative differences among individuals. As Nitko (1984) stated, by
1962 R. Glaser and D. Klaus had determined that norm-referenced testing was not enough.
Scoring higher than 98% of those taking a mathematics test does not explain what type of
mathematics problems were completed successfully nor does it state what concepts have been
learned. Glaser and Klaus developed the first criterion-referenced tests (Appendix A) for
military and industrial training and by 1963 expanded this technique into the school education
arena.
Standardized Assessments Today
Characteristics
According to Anastasi (1988), there are two basic ways to interpret raw test scores. The
score is either reported as a determination of criterion-referenced level attained or by the
relative position within a specified population group or norm The first test is termed criterion-
referenced, while the second is termed norm-referenced. As stated by Glaser and Nitko (1971),
“a criterion-referenced test is one that is deliberately constructed to yield measurements that are
directly interpretable in terms of specified performance standards'^ (as cited in Nitko, 1984, p.
12). (Refer to definition in Appendix A) Criterion-referenced tests are suggested when making
decisions of mastery or minimum competency (Nitko, 1984).

Since the results of placement tests are used to place a student in the appropriate
mathematics class and the determination of necessary skills is pertinent, placement tests are
primarily designed as criterion-referenced tests. Although as Nitko (1970) stated, norm-
referenced test data in combination with criterion-referenced test data would be helpful in
determining a more accurate picture of the examinee, “it is unlikely that the same test can
provide optimal information in both arenas” (as cited in Nitko, 1984).
We still use many varieties of standardized assessments today because these tests are the
most efficient method to test large numbers of people, in the shortest period of time and at the
lowest cost. As Anastasi (1988) described, in a group testing environment, the number of
individuals tested is only limited by the size of the room. By using printed booklets with
multiple choice problems and separate answer sheets, answers are easily recorded with no
interaction required between examiner and examinee. Because the same instructions are given
to each group, sometimes even pre-recorded instructions are used. Costs are saved because
minimal training of scorers is required with multiple choice problems scored dichotomously
(Appendix A).
Disadvantages
Group Testing
Some of the benefits gained in efficiency can be losses in important areas of individual
differences. The examiner cannot detect temporary conditions such as anxiety, frustration,
fatigue, illness, and worry; and these factors can adversely affect the examinee’s score
(Anastasi, 1988, Gay, 1992). Students who are uncomfortable in a testing arena often find a
group testing environment even more threatening. Studies of the adverse effect of math anxiety
on student performance levels are well documented As Tobias (1993) has shown more

10
specifically, the performance of female students is highly affected by various levels of anxiety in
mathematics. Combining this with a genuine fear o f testing and a dislike of mathematics, the
scores that students receive in standardized mathematics tests will not necessarily be accurate
for every student (McDonald, 1989). Measurements obtained in this manner should be
interpreted with caution.
Another limitation to the group-administered standardized assessment is that there is no
provision given for individual ability. This difficulty becomes very apparent when a wide range
of knowledge, skills and abilities is being tested. Boredom can result from working on too
many easy problems and, on the other extreme, frustration and anxiety result from working on
problems that are too difficult (Anastasi, 1988).
In order to avoid this problem, some test manufacturers have designed locator or router
tests that are used to route the examinee to the proper level test (Millman, 1984). This two-
level testing process requires that the examinee take the first usually shorter test, which covers a
broader content area. The resulting score determines the appropriate level of testing required
for the next test. This is an elementary approach for the type of testing provided in computer
adaptive testing (Appendix A).
Computer adaptive testing fCATl. Since group standardized testing is still the most
efficient method for testing large numbers of people, and since individualized testing is still the
most beneficial to the examinee, computer adaptive testing is the newest development that tries
to combine the benefits of the two methods.
Anastasi (1988) has indicated that the same levels of reliability and validity (Appendix A)
achieved with group administered standardized testing can be achieved with individualized
adaptive testing, [such as that provided in CAT], but with more direct benefits. These include

I l
(a) less testing time, (b) smaller number of items, (c) more rapid scoring, (d) less threatening
time constraints with students operating at their own pace, (e) less resultant boredom or anxiety
with students staying challenged, yet not discouraged, and (f) scheduling flexibility with testing
allowed at any time (Akst & Hirsch, 1991).
Many professional test writers are creating tests in the CAT format, and studies continue.
Wood, Kline and Flaugher (1986) studied the predictive validity of the College Board’s new
(CAT) placement battery (as cited in Akst & Hirsch, 1991). They found favorable correlations
between math end-of-term grades and math (CAT) test scores of 2,500 students from seven
colleges. They also found that most examinees felt positive about the testing, including those
who had not previously used a computer. In 1986, the Educational Testing Service (ETS)
completed the initial testing of its CAT placement battery, the Computerized Placement Test
(Rounds, Kanter & Blumin, 1987). This test offered learning skills, mathematics and writing
modules In 1992, the American College Testing (ACT) program initiated the design of a CAT
mathematics placement program in algebra and calculus (Noble & Mullen, 1992).
Researchers and test designers are even expanding the CAT arena to that of self-adaptive
testing or SAT The self-adaptive version of the CAT allows the examinee to choose the level
of difficulty instead of having the level computer assigned. Wise et al. (1993) studied the effect
on student test scores when given a choice between SAT or CAT. Students were each
randomly assigned to one of three groups that were (a) tested using CAT, (b) tested using SAT,
or (c) allowed the choice of SAT or CAT, which was termed CHOICE. These students were
also tested for mathematics anxiety and situation specific anxiety levels before and after the
testing. Wise et al. (1993) had a three-part conclusion from this study. The researchers found
that students with high anxiety who were in the CHOICE group usually chose SAT, while those

12
with low anxiety chose CAT. Post-test anxiety only decreased for those students in the
CHOICE group who chose the SAT version. Their final determination was “for examinees
reporting high math anxiety, providing a choice between CAT and SAT led to significantly
higher mean proficiency estimates” (p. 13). The researchers theorized that those with high
anxiety can more effectively cope with a stressful situation if they have some control over the
possible source of their stress.
There are disadvantages for the CAT approach. As cited by Akst and Hirsch in 1991 and
Rounds et al. in 1987, every student needs a computer; therefore, cost may be prohibitive.
Also, the approach is still new and continually being researched.
Although not an example of a formal study, a local community college faculty member
tested the American College Testing (ACT) version of this program with a placement test in
mathematics. The experience was not positive. In theory each time an examinee answers a
problem correctly, the computer is programmed to generate a more difficult item, when the
examinee misses a problem, an easier problem is generated This process is supposed to
continue until an accurate assessment can be made of the examinee’s knowledge level. In this
particular case, the program would not make an assessment of this faculty member’s level and
kept generating problems. She could only stop it by shutting off her computer
Multiple Choice Problem
A primary component of the standardized assessment is the multiple choice problem. The
benefits of using this type of problem relate to the ease of correction, with the problem being
either right or wrong.
There have been many criticisms directed against this type of problem. It allows the
unprepared student to “guess” and obtain the correct answer, resulting in an inaccurate score

13
(Baker, 1992; Morante, 1987). Guessing also encourages the students to “devalue their own
reasoning and problem-solving ability” (Cobb, Pereira, Krishnamachari, & Solo, 1990, as cited
in Akst & Hirsch, 1991). To counter guessing, some tests include a scoring factor that
systematically lowers scores as problems are attempted and missed (Morante, 1987), but in
most cases, multiple choice tests tend to be scored dichotomously.
Others criticize the multiple choice problem because it is more likely to evaluate recall and
application of facts and formulas in routine problems instead of assessing higher order thinking
and problem solving skills (Akst & Hirsch, 1991; Anastasi, 1988; Mathematical Science
Education Board, 1993; Webb & Romberg, 1992). Problems that are supposed to measure
synthesis and evaluation actually result in formula application (Wilson, 1992). Webb and
Romberg ( 1992) continued this discussion by suggesting that multiple choice problems with one
right answer are designed to “measure independent partitioning of mathematics rather than
knowledge and inter-relationships among math ideas” (p. 39).
Romberg, Wilson, Khaketla, and Chavarria (1992) studied a variety of standardized
assessments in the United States and England, searching for those that assessed higher order
thinking skills as opposed to primarily testing computational ability. They concluded that (a)
many of the tests they found that met this criterion were used in England and (b) most used
open-ended questions as opposed to multiple choice. They found that the open ended problem
could assess more easily process areas such as problem solving, reasoning, and communication.
Designers of standardized assessments in the United States have begun to incorporate the
open-ended problem in new test design. Starting in spring 1994, the Scholastic Aptitude Test
(SAT) offered a section in its mathematics component that allowed students to enter their
answers in a machine-scorable grid Acceptable answers could be in either fraction or decimal

14
form. In this way, the guessing factor is eliminated, resulting in a more accurate measure o f the
examinee’s ability (Braswell, 1991).
Gender differences may also affect the outcome of multiple choice tests. Meyer (1992)
cited studies that compared male and female success rates in multiple choice versus essay tests
in a variety of subject areas and grade levels. The conclusions were mixed; however, it was felt
that “guessing and answer changing might be associated with gender differences in multiple
choice exams” (p. 176), with males generally being less likely to waste time changing their
answers. Since there is a concern about the gender issue with multiple choice problems,
consideration should be given to utilizing a variety of assessment methods (Clarkson, 1992).
Placement Test Criteria
Achievement or Aptitude?
Aptitude tests are used to predict the examinee’s likelihood of success by utilizing a
variety of skill and ability assessments. These tests are validated by predictive correlation
studies; while achievement tests measure strictly defined areas o f knowledge and are validated
by content validity studies. Anastasi (1988) also stated that aptitude tests are sometimes used
as achievement tests; and the reverse holds as well, with the primary difference being how the
scores are interpreted and used.
The Scholastic Aptitude Test (SAT) and the American College Test (ACT) are two
examples of professionally designed standardized aptitude tests that are designed to predict
likelihood of success in college level course work Jacobi, Astin, and Ayala (1987) defined the
various components of each. The ACT generates scores in math and English usage, with
reading scores in social studies and science. The SAT provides two general scores in
mathematics and verbal skills, and provides subscores for reading and vocabulary.

15
If ACT or SAT scores are considered in isolation, they do not make good placement
instruments, particularly at the basic skill level. As Morante (1987) indicated, in 1978 and
1986, the Basic Skills Council (BSC) compared SAT results with the results of the New Jersey
College Basic Skills Placement Test. In both studies, the BSC found that many students who
had above average scores on the SAT were not able to pass this basic skills placement
instrument. Berenson, Carter, and Norwood ( 1992) conducted a study of students who failed a
mathematics basic skills assessment at North Carolina State University. They found that many
of these students had scores higher than 500 in both the SAT mathematics (37%) and verbal
areas (23%). Some of these students even had SAT-M scores above 600 and still could not
pass the placement test.
Morante (1987) found that the ACT and SAT had distinct differences from tests in
placement. These tests are contrasted with placement test characteristics in the following table
(p. 57): (For definitions of speed test and power test, refer to Appendix A.)
SAT and ACT PLACEMENT TESTTime: Speed test Power test
Purpose: Determine level of student’s Measures proficiency, notproficiency and speed of performance.
aptitude.
Reasoning. Speed and knowledge predicts college success
Not used to predict success
Anastasi (1988) and Truman (1992) also stated that one additional characteristic of a
placement test is that problems tend to be arranged from easy to difficult. In this way, the SAT
and ACT math tests differ from placement tests again in that the problems in each are randomly
distributed according to difficulty levels.

16
Braswell (1991) indicated that the current goal for the SAT is to assist colleges in their
selection process by serving as a standard measure of ability. He also stated that computational
ability has never been stressed in the mathematics portion of the test. The calculations have
been relatively easy to complete, rewarding those students who have “good number sense and
estimation skills” (p. 18).
Noble and Mullen (1992) stated that the ACT was originally created to measure a
student’s ability to perform college level tasks. In the mathematics arena, the test was designed
to strongly correlate with the secondary mathematics outcomes required for successful
completion of college level mathematics. They described it also as an achievement test with
problems similar to those experienced at the high school level.
In coi elusion, the SAT and the ACT are aptitude tests because the scores of each are
used to predict college success. They are achievement tests to a degree because of their close
correlation to secondary education level course work. The consensus is that scores from both
are most effective if used in combination with placement test scores or other student
background information, and least effective in basic skills assessment. Morante (1987) stated
that the ACT and the SAT are primarily used to select those students who are most likely to
succeed in the college arena, while a placement test is primarily used to select those who need
remediation. In studies cited, there was little correlation between the two.
Predictive Achievement Test
Anastasi (1988) stated that certain tests that have been designed for use in education are
essentially predictive instruments, but since these tests were created with a very high correlation
to curriculum, they actually satisfy the definition of being achievement tests. These tests have to

17
be validated in two ways: (a) content validity studies and (b) criterion^related validation studies
(Appendix A).
Mathematics placement tests are utilized to place students in the appropriate level of a
beginning math course. They are achievement tests in that they are designed with a high
correlation to course content. As stated in the first chapter of this study, there have been many
predictive correlation studies conducted on purchased mathematics placement tests, where the
criterion selected has been student success in the appropriate class. In conclusion, a placement
test seems to satisfy Anastasi’s definition of a predictive achievement test.
Purchased versus Locally Designed
As discussed previously, a local college has two decisions to make regarding the selection
of a mathematics placement test. The mathematics faculty may decide to design their own, or
they may decide to purchase a professionally designed mathematics placement test.
Community colleges have made a variety of decisions in this area. Of the 29 community
colleges who responded to the Michigan State Department of Education (1990) survey, four or
13 .8% used the College Board Multiple Assessment Programs and Service (MAPS) and 22 or
75.9% utilized the ACT Asset placement test at some level of mathematics placement. Six of
the eleven colleges that used a locally designed math placement were in this group. Only five
out of 29 or 17.2% of the surveyed community colleges relied on just a test of their own design.
Advantages: Locally Designed
A mathematics placement assessment that has been developed by college faculty can more
closely reflect the individual characteristics of the college, including course content and
administrative needs (McDonald, 1989; Truman, 1992). The development and continual
validation of the instrument “allow faculty to examine their curriculum and to share criteria for

18
assessing students” (McDonald, p. 20).
Though the diflference in cost was not mentioned in any of the research, evidently this
would have to be a consideration. Using a professionally created test instrument requires an
initial purchase.
Advantages: Professionally Created
Professionally designed standardized assessments are developed by experts and have been
analyzed, piloted and revised until they meet the required standards of quality (American
Psychological Association, 1985; Gay, 1992; McDonald, 1989). Through item analysis,
individual problems are extensively studied, evaluated, and appropriately positioned on the test
(Braswell, 1991; McDonald; Millman & Greene, 1988). The total scores generated, as well as
an item-by-item analysis, provide the opportunity for more accurate determination of the level
of knowledge or skill achieved by each examinee (Jacobi et al., 1987). Issues such as test bias
and item bias (Appendix A) have been studied and evaluated using expert judgment and more
objective mathematical calculations (Angoff, 1982; Ironson, 1982; Shepard, 1982).
With stated rules for administration and scoring, these tests are objective, no matter who
scores the test (Anastasi, 1988). Test manufacturers provide procedure manuals that specify
how the test should be administered, scored and interpreted and provide the results of validity
and reliability studies (American Psychological Association, 1985). Many provide alternate test
forms (Appendix A) for in-house reliability studies or for pre- and post-testing (McDonald,
1989). Many purchased tests provide norm-referenced and criterion-referenced test score
interpretations, which are useful in giving a more complete picture of the examinee’s
performance level (Nitko, 1984).

19
Professionally designed assessments are continually being evaluated and revised, keeping
abreast of current changes in mathematics education (McDonald, 1989). This can be further
illustrated by the recent and extensive revision process of the ACT and the SAT. Though as
this researcher has shown, neither is an effective mathematics placement assessment, each is an
example of a professionally designed assessment that has had to be responsive to change.
The ACT first administered what it now terms the enhanced ACT Assessment
Mathematics Test in October 1989. Staff consulted multiple sources of information: “state
curriculum guides, high school and college textbooks, and mathematics educators’ (university
professors, curriculum supervisors, and high school teachers) recommendations” (Noble &
Mullen, 1992, p. 22). This was done to evaluate current practice and any new trends that were
developing in mathematics education. Independent consultants determined the areas of math
knowledge required at the high school and college levels. The results of all of these surveys,
meetings, and reviews were used to design content and skill level plans for constructing many
new forms each year. A nation-wide survey had been planned for 1991-92 that would evaluate
new trends in math education (Noble & Mullen).
Noble and Mullen (1992) further explained that current secondary level teachers created
all the ACT test problems, with each problem being thoroughly reviewed and edited in a process
that took over two-and-a-half years before being incorporated into a test instrument This
included twelve separate reviews where the problem was evaluated for validity, accuracy, and
fairness All problems were then pre-tested by a group of students similar to those who would
be taking the regular ACT.
Braswell (1991) noted that the SAT recently completed a three year revision process,
with new test instruments first administered in October 1993. The initial revision process first

20
began with the 1989 release of the National Council of Teachers of Mathematics Curriculum
and Evaluation Standards. This initiated changes in test design. These included a greater
emphasis on (a) data interpretation, (b) algebraic representation, (c) realistic applied problems,
(d) open ended problems, and (e) calculator usage. The new SAT had to incorporate these
changes in order to be responsive to the current changes in math education reform for grades 9-
12. This researcher will discuss these issues further in the last section of this chapter.
Disadvantages: Locally Designed
“The writing of good, unambiguous items that discriminate well among students of
different groups, that are unbiased, and that relate well to the total test score is much more
complex than it appears on the surface” (Morante, 1987, p. 58). Combining items on the test to
form a valid and reliable comprehensive test is a difficult process. It requires pre-testing,
statistical analysis, and continual objective review by professionals (Morante & Truman, 1992).
In 1989 McDonald stated that in the creation of the locally designed tests, design
problems can be introduced which cause measurement errors. For example, mathematics
problems frequently use symbols. Faculty may easily understand the stated notation, but an
adult who has been away from mathematics education for a few years may not. Additionally,
“marginal quality questions can be made worse by the poor format of a test combined with the
inconsistent format of the answer sheets” (p. 21).
The development of alternate test forms that are important in reliability studies, re-test
and post-test issues requires a “level of sophisticated psychometrics that most faculty do not
have or do not use in the development of in-house tests” (Morante, 1987, p. 58). As stated
previously, many professionally created test manufacturers supply these statistically similar test
instruments.

21
Professionally designed assessments have to be responsive to their potential buyers’
needs. Staff have to continuously study, revise, and pilot the professionally created test
instrument. Since local college faculty created the locally designed test with what they felt was
a high correlation with curriculum and because they frequently have other demands on their
time, there is a concern that minimal time is spent conducting studies of the effectiveness of
locally designed instruments.
This is supported by the fact that this researcher could find only two recently documented
validation studies of a locally designed math placement test, Truman (1992) and Johnson
(1983), while there were many documented studies conducted on professionally designed math
placement instruments. This researcher only used six out of many in this study. This included
Callahan (1993), Gabe (1989), Jue (1993), Isonio (1992), Slark et al. (1992), and Sturtz and
McCarroll (1993). It is noteworthy to consider why so few locally designed tests have
documented studies. As McDonald (1989) cited, “because a test is locally developed, greater
temptations arise to ignore periodic reviews of the test in light of curricular or textbook
changes” (p. 21), though as Anastasi (1988) indicated, content validation should occur on an
annual basis
Ebel and Frisbie ( 1986) documented that professionally designed mathematics assessment
tests tended to have higher reliability coefficients, averaging 0.90 and above, while locally
designed mathematics assessments tended to be lower (as cited in McDonald, 1989). These
professionally designed instruments have specified procedures on how to maintain uniformity
including the use of tests, answer sheets, the testing environment, instructions, time limits, and
scoring procedures These procedures are strictly followed in order to reduce error variance
(Appendix A) which increases reliability. Since these procedures are so standardized, error

22
variance attributable to any of these is very minimal (Anastasi, 1988). Locally created
placement tests do not always adhere to such standards, and as such adversely affect test
reliability. For example, when judgmental decisions have entered into the assessment process,
the issue of scorer reliability needs much attention and examination (Anastasi, 1988). Allowing
judgment into an assessment decision is likely to adversely affect reliability since estimates of
interjudge and intrajudge reliability by calculation of score correlations are in many cases low
(Gay, 1992). (Refer to the definition of scorer reliability in Appendix A.) According to the
Standards for Educational and Psvchological Testing (1985), professionally designed
assessments have to adhere to very strict standards in regards to scorer reliability issues, while
locally designed instruments possibly do not In this way, test reliability can be adversely
affected (American Psychological Association).
Summary
“In-house (locally designed) tests may be written to reflect a selected curriculum, but they
may not provide accurate measurement (of the intended criteria)” (Morante, 1987). Faculty and
administrators need to continuously review the advantages and disadvantages of using a locally
designed or purchasing a professionally developed math assessment used in placement.
As McDonald (1989) stated, if an existing professionally designed test instrument cannot
adequately satisfy the needs of a college, some organizations have designed appropriate and
effective test instruments with the assistance of measurement professionals trained in test
construction. The City University of New York and the states of New Jersey and Tennessee
hired professionals to assist them in their perspective test creation.

23
Examples: Professionally Designed Math Placement Tests
McDonald (1989) mentioned four professionally developed mathematics placement tests.
The descriptions serve only to illustrate what these tests can provide. These tests included (a)
Educational Testing Services (ETS) Descriptive Tests o f Mathematics Skills, (b) Mathematical
Association of America (MAA) Placement Test Program, (c) American College Test (ACT)
Asset, and (d) ETS and College Board Multiple Assessment Programs and Services (MAPS).
The College Board (1988) markets the Descriptive Tests of Mathematics Skills. It covers
basic arithmetic, elementary algebra, intermediate algebra and calculus readiness. Each test has
30-35 multiple choice problems and requires 30 minutes for administration.
The MAA Placement Test Program (1987) provides various course level assessments
with tests in arithmetic, algebra, beginning algebra, advanced algebra, trigonometry, and
calculus readiness. Each test has multiple choice problems and requires 30 to 45 minutes to
administrate. The MAA provides additional support to any institution purchasing these
instruments. This includes (a) notification of updates and providing forms when available and
(b) providing alternate forms for reliability assessments, re-testing, for exit testing, and for
testing achievement When a college purchases this instrument, they may reproduce copies of
the test
The College Board (1986) and ETS (1985) developed the MAPS for local college
placement, and the ACT (1985) developed the Asset test specifically for community college
placement. McDonald offered no additional information on these two placement tests;
however, both were mentioned in several of the documented studies this researcher found for
this study.

24
Construction and Evaluation of a Math Placement Test
Research on the specific procedures for creating a locally designed mathematics
placement test was limited since this researcher could find only one documented study
completed by Truman in 1992. He detailed the creation and continuing administration of the
staff designed test at Pembroke State University. Therefore, much of the research cited in this
study dealt with the standards required of a professionally prepared assessment.
Sources
According to Millman and Greene (1988) and Truman (1992), an invaluable tool for the
creation of a mathematics placement test would be the latest standards established by the
American Psychological Association in Standards for Educational and Psvchological Testing
This researcher used the standards published in 1985 for the completion of this study. This
issue delineated two levels of testing standards. The primary standards were required, while
secondary standards were only suggested (Appendix A)
Additionally, this researcher found three other valuable sources: ( 1 ) A Guide to
Criterion-Referenced Test Construction, edited by R. A. Berk (1984a); (2) Educational
Measurement, edited by R. L. Linn (1988); and the National Council of Teachers of
Mathematics (1989) Curriculum and Evaluation Standards for School Mathematics
Procedures
According to Millman & Greene (1988), there are external and internal factors that affect
the development of achievement and ability assessments. The external factors that first need to
be addressed involve what McDonald (1989) termed test purpose. The internal factors were
delineated in a more general way by Braswell (1992). These are (a) setting test specifications,
(b) writing test items, (c) reviewing items, (d) field testing items, (e) test assembly, and (f) test
25
review. Berk (1984a) stated these steps in more detail in A Guide to Criterion-Referenced Test
Construction, with each step corresponding to a chapter in the book. These were (a) specifying
the domain of content, (b) generating the test items, (c) conducting the item analysis, (d)
determining test length, (e) setting performance standards, (f) validating the test scores, (g)
selecting the index of reliability, and (h) estimating the dependability of the scores.
This researcher will utilize a combination of these steps in the following overview of the
procedures involved in the creation of a valid and reliable test instrument.
Test Purpose
According to McDonald (1989) the basis of any mathematics assessment program must
be the goals of the program and “these must be selected in the context of curricular and
institutional needs” (p. 20). A college uses a mathematics placement assessment for a variety of
reasons. McDonald delineated these as follows; (a) testing all incoming students, (b) increasing
course completion through appropriate placement, (c) testing basic mathematics students before
leaving remediation, (d) developing standards of basic proficiency, and (e) identifying those
students with trigonometry or calculus proficiency.
If the purpose of the test has been clearly delineated, it will guide test development
through all the required steps of test construction (Millman & Greene). Since the selected
purpose “guides the scope, procedures and decisions for the mathematics assessment and
placement system,” staff must periodically evaluate the purpose of testing (McDonald, 1989, p.
20). This is necessary to ensure that the assessment program still provides the needed objective
As Millman and Greene (1988) established, the statement of purpose is sometimes
difficult to delineate because there is no clear difference between achievement and aptitude
testing. Each is created differently; but in many cases, each may be used in a similar way. They

26
suggested that the questions to consider would be: (a) Will test be given before, during or after
instruction? (b) Will test inferences be used for placement or prediction of successful
performance in the related class?
In the area o f test administration, the following additional questions need to be answered:
(a) Who will be taking the test? (b) How much time will be available? (c) How shall test be
administered? (Millman & Greene, 1988).
Specifications
Content validation is built into educational test design through the choice of appropriate
test items (Anastasi, 1988), Anastasi suggested that before faculty begin creating test problems,
they conduct a thorough and organized study of the relevant course curriculum and textbooks.
In addition, they should obtain information from subject matter experts. The faculty can then
prepare test specifications that cover the appropriate content areas (American Psychological
Association, 1985), and the instructional objectives or process to be tested (Anastasi).
One method that could be used to organize this information is with the following chart.
Faculty could assign the number of problems needed in each content area with the specified
level of instructional objective according to the relative importance of the individual topic. The
more problems assigned, the higher degree of importance desired (Anastasi, 1988, p 431).
Instructional Objectives
ContentAreas
KnowsBasic
Terms
Understands Concepts &
PrinciplesApplies
PrinciplesInterprets
Data Total
27
Millman and Greene (1988) used the following questions as guides to assist in the
creation of the test development plan:
Internal Test Attributes: What will the test cover? What sources of content will be
used? What is the desired dimensionality of the content? How specific or broad will the
domain of inferences be? How will the items be distributed among content components?
What types of item format will be used? How many items will be produced? What
psychometric characteristics of the items are desired? How will the items be evaluated
and selected? How will the test items be arranged, sequenced and reproduced? How
will the items/test be scored? What psychometric properties of the test are desired?
Further considerations: How specific will be the test development plan itself? How shall
the test development plan be validated'’ Who shall carry out the test development steps,
following what time schedule, and using what resources? (p. 339).
Calculator Usage
In this section, this researcher will explore how to incorporate calculators into the
assessment arena, while in a later section on math education reform, the need to utilize
calculators will be addressed
The decision to allow calculator usage needs to occur before the actual creation of the
test problems. It should be incorporated into the test specifications; otherwise, the content of
each problem would need to be evaluated for the calculator effect (Braswell, 1991). The skills
and abilities that are assessed in each problem can be affected by the use of a calculator. Certain
problems such as those that measure basic skills will no longer be appropriate, while other
problems could become more complicated than originally intended (Braswell).

28
Once staflFhas designed the test, there will be equity issues to consider such as what types
of calculators should be allowed. Students with programmable graphing calculators could have
an unfair advantage over other students (Braswell, 1991). In order to prevent this, the highest
level of sophistication is specified prior to testing.
If a test allows for calculator usage, it does so at three levels according to Harvey (1992).
(a) In calculator-passive testing, staff allow students to use calculators but no one has studied
what the effect might be. The skills used in solving each problem may not be the ones originally
intended, (b) In calculator-neutral testing, staff has carefully studied test content for any
possible adverse effect when calculators are used by examinees. Problems that cause difficulty
are removed from the instrument, (c) In calculator-based testing, test problems have been
designed with calculator usage as a purpose, with each test generally specifying the type of
calculator required. These tests require established proficiency in calculator use to solve the
problems, and in some cases, levels of proficiency may be measured.
There are two reasons to incorporate calculator-based problems in test design. ( 1 ) If
students need established proficiency levels with certain types of calculators as a pre-requisite
skill for a class, the placement test needs to measure this skill. The problems have to be
designed accordingly. (2) Since math placement instruments are designed to accurately measure
the examinee’s skills and abilities in mathematics, not testing for skill in the use o f statistical and
graphing calculators will misrepresent the true ability levels of the student (Harvey, 1992;
Mathematics Science Education Board, 1993).
Professional test manufacturers are beginning to address computer usage in the design of
new mathematics assessments. As stated previously, the Scholastic Aptitude Test (SAT) was
recently revised. Among the newest revisions was the provision to allow calculators during

29
testing starting in 1994. According to Braswell (1991), the SAT staff carefully evaluated the
content and equity issues before this change was allowed.
They conducted a calculator usage study, comparing student performance with and
without calculators on an SAT sample test and found minimal difference between the
performance of the two. High school and college mathematics instructors who review the SAT
problems for content have been asked to further identify any other problems that could be
affected by calculator usage. In most cases, calculators had no significant impact on test items
because the SAT was never designed to be a test of basic computational skill (Braswell, 1991).
The SAT staff made a decision on the equity issue. As specified by the College Board
(1994) in the directions for the Preliminary Scholastic Aptitude Test and National Merit
Scholarship Qualifying Test (PSAT/NMSQT), students may use calculators, but they are not
necessary. SAT staff also limited the type of calculator allowed. ‘'Students may use four-
function, scientific, or graphing calculators. However, students may not use calculators with
paper tape or printers, ‘hand-held’ minicomputers, pocket organizers, or lap-top computers”
(P 8)
Creatine Test Questions
Content
Creation of quality placement test problems requires much care. Roid (1984) stated that
the basic principle in test item development “is to create measures of the true achievement
dimensions desired, not of extraneous abilities such as test-wiseness or related skills such as ...
reading ability or speed of information processing” (p. 52). Using the test specifications as an
appropriate guide, faculty can create problems in the specified areas of content and with the
desired instructional objectives, but all problems will still need further study and evaluation.

30
One common error found in locally designed placement tests is that faculty create
problems that are similar to those found in a final exam. Instead, each problem should assess
pre-requisite knowledge (Mathematical Association of America, 1984, as cited in Truman,
1992), such as those fi’om the beginning of the course, not the end. Truman suggested that a
good source for multiple choice problems in a placement test would be fi"om open-ended
questions that have been used in class tests. In this way problems will have a strong correlation
to class content.
In order to have variety and larger number of problems available, Truman (1992) stated
that each year at Pembroke State University, introductory mathematics level faculty are asked to
generate at least five new problems for a replacement pool o f questions. These problems cover
areas that have not been addressed in the current placement test, but arc being currently taught.
Using test problems of this design satisfy the definition of being content valid as stated in
the American Psychological Association (1985) Standards for Educational and Psvchological
Testing: (a) It must test subject matter taught in the level of testing, or (b) it must test
previously learned knowledge or a subskill needed to be successful in the course.
Millman and Greene (1988) had further suggestions for the construction of multiple
choice problems: (a) Use questions that stress important facts and concepts (b) Include
questions that utilize higher level thinking rather than recall, (c) Write questions in clear and
simple language, (d) Avoid having one problem cue another unless that is what was intended.
Distractors
There are certain criteria required for distractors (Appendix A) of a multiple choice
problem, (a) Roid (1984) indicated that all distractors chosen should be “grammatically parallel
and of similar length” (p. 51). In that way students would not be able to rule out answers that

31
seem unlikely by appearance alone, (b) Each problem needs several distractors. One method
indicated by Morante (1987) to partially alleviate the guessing factor in multiple choice tests is
to increase the number of distractors, with four or five being better than one or two. (c) Each
distract or should have a high probability of being chosen if the student makes a common error.
Although as cited by Truman (1992), experienced faculty could easily generate suitable
distractors, many of the distractors used for problems in the Pembroke State University test
were actually wrong answers given by students that illustrated a lack of understanding.
Millman and Greene (1988) suggested the following additional considerations for
effective distractors; (a) Place all distractors at the end of the problem, not in the middle (b)
Arrange the distractors in logical order if one exists, (c) Avoid repetition of keywords in the
wording of the problem and in the distractors. (d) Avoid use of descriptive terms such as never
or always in the distractors, as they can act as cue words.
Pool of Questions
The number of possible test problems needs to be large At Pembroke State University,
Truman (1992) found that out often initial problems suggested, two might be appropriate for
the placement test use, having satisfied all conditions Each year, Pembroke faculty collect two
or three of the best problems found out of each class level for future test items. Staff replaces a
test item if it is no longer content valid or an alternate new item has better statistics In this
manner, the Pembroke staff is continually validating the content of the placement test
item Analysis
Berk (1984b) suggested that item analysis consists of four levels of review. (1 ) Experts
must initially review each item in order to assess the item-objective correlation or make a
judgment of content This part of the analysis also incorporates an assessment of item or

32
content bias. (2) Statistical analysis is required for determining item efiBciency. (3) Once staff
has gathered the appropriate statistics on problem performance, the second level of judgmental
review is required to assess if items need to be discarded, revised or retained. (4) Staff need to
collect statistics on the effectiveness of the distractors.
Content Judgment
Berk ( 1994b) indicated that there are three criteria utilized to assess the match between
items and the original objectives or intent; (1) behavior, (2) content, and (3) hierarchical
classification that evaluates the level of cognition or thought process required to solve the
problem, (These were defined as instructional objectives in the previously described test
specification chart on page 26.)
Berk (1994b) indicated that the original test specifications should be compared to the
actual problems to determine any discrepancies in design. The author felt that the first two
areas are generally addressed when staff create problems under the guidelines of the test
specifications, but the third area requires further assessment. “Some test makers tend to
construct items at lower levels of cognition than the specifications originally indicated” (p. 98).
For example, the specifications may have designated a problem requiring the application level;
instead once the problem was written, it required only the knowledge level.
During this initial evaluation process, staff will find problems that no longer appropriately
match the original specifications. They either revise each problem or redesign the test
specifications (Berk, 1994b),
Content bias. Although statistical and more objective evaluations are possible once the
test problems are assimilated in test form, expert judgment is required to determine item bias.
Berk (1984b) suggested that this review be conducted by specially formed panels of faculty and
33
lay representatives o f the appropriate subgroups such as "males, females, blacks, whites, and
Hispanics” (p. 100) when the assessment has some significance such as school or district-wide
basis competency tests.
Shepard (1982) stated that there is one general question that needs to be answered when
judgmental analysis is conducted for detection of bias. “Will the match of the item to the
construct be the same across groups?” (p. 21). Hambleton (1980a) composed the following
questions for guiding this item-by-item analysis;
(a) Is the item free of offensive sex, cultural, racial, regional and/or ethnic content?
(b) Is the item free of sex, cultural, racial, and/or ethnic stereotyping?
(c) Is the item free of language that could be offensive to a segment of the examinee
population?
(d) Is the item free of descriptions that could be offensive to a segment of the
examinee population?
(e) Will the activities described in the item be equally familiar (equally unfamiliar) to all
examinees'’
(f) Will the words in the item have a common meaning to all examinees? (as cited in Berk,
1984b, p. 101).
Statistical Analysis
Millman and Greene (1988) stated that there are two approaches that can be used in item
analysis: (1) The first approach they termed the classical approach In this method, difficulty
and discrimination indexes are calculated for each test item (Appendix A). (2) The second
approach has been defined as item response theory (Appendix A) where an item characteristic
curve is calculated for each problem which “estimates the probability that an item will be

34
answered correctly as a function of an examinee’s status on the under-lying construct being
measured by the test” (Millman & Greene, 1988, p. 358).
Truman (1992) indicated that Pembroke State University staff tests each problem in the
classroom environment. Faculty use all future test problems in entry level classes and collect
statistics that reflect success of these problems during the school year, thereby calculating
difficulty indexes for each problem in the classroom. Staff also calculate correlations between
problem error rate and the eventual student mid-term grade for the class. In this manner,
discrimination indexes are calculated for each problem as well.
Difficulty index. The difficulty index is the percentage of examinees who answer an item
correctly, with the index varying from 0.0% to 100.0%. Easier problems have higher indexes,
while the more difficult problems have lower indexes (Berk, 1984b).
Anastasi (1988) indicated that the primary reason for determining item difficulty level in
placement test construction was to choose items of suitable levels. “If no one passes an item,
it’s excess baggage in the test. The same is true of items that everyone passes” (p. 203).
Neither method provides any additional information about the examinee.
Another reason for calculating difficulty index of a problem is to determine eventual
location in the test instrument. (Anastasi, 1988; Meyer, 1992; Mathematical Sciences Education
Board, 1993, and Truman, 1992). This researcher will discuss this issue further in the test
assimilation section later in this chapter
Item discrimination. Anastasi (1988) defined item discrimination to be “the degree to
which an item differentiates correctly among test takers in the behavior that the test is designed
to measure” (p. 210). Millman and Greene (1988) defined item discrimination to be (a) a
correlation between score on that item and some other criterion measure or (b) the difference in
35
performance on that item for examinees in different criterion groups. These are both simplified
descriptions of a statistical calculation that has a wide variety of interpretations. Berk (1984b)
listed seventeen different methods of calculating this index, with each of increasing complexity.
Because of the depth of this concept, this researcher can only present this issue as an overview.
Truman (1992) used a combination of the methods previously described by Millman and
Greene (1988) in the Pembroke State University study. Staff calculated a correlation of each
problem’s error rate to students’ midterm grades. Truman also defined the index to be “the
difference between the percentage of students in the upper quartile getting an answer correct
and the percentage of students in the lower quartiles getting the same item correct” (p. 61). An
example of this would be if 50% of the upper quartile and 20% of the lower quartile got the
same problem correct, the discrimination index would be 0.3.
Diederick (1973) stated that the minimum discrimination index allowed for most items
should be 0 15 (as cited in Truman, 1992). Similar to difficulty indexes, the discrimination
index levels determine test placement location Those items having the lowest discrimination
indexes are placed at the beginning of the test (Truman).
Item response theory. This approach of item analysis utilizes the construction of an item
characteristic curve (ICC) for each test item. As Anastasi (1988) indicated, different models
utilize different mathematical functions but the results from each are very similar. Item response
theory, also referred to as latent trait theory, “almost always provides the basis of item selection
and ability estimation” (McCormick & Cliff, 1977, as cited in Millman, 1984)
Because this theory is complicated, to explain it completely is beyond the scope of this
paper. Therefore, this researcher can only provide a brief overview of the basic concept in the
following section.

36
Anastasi (1988) stated that the graph of each problem’s ICC is determined by three
parameters. These relate difficulty, discrimination and ability, and are derived mathematically
from empirical data. The “horizontal axis is defined for the ability scale 0, which is estimated
from total test score. The vertical axis represents Pi (0) the probability of a correct response
to an item i as a function of the person’s position on the ability scale (0). This probability is
derived from data on the proportion of persons at different ability levels who passed the item”
(p. 221-222). The item discrimination parameter (a,) is indicated by the slope of the curve at
any point [ 0, Pi(0)]. The item difficulty parameter (b,) is measured on the horizontal axis or
0 scale for the same point.
Truman (1992) did not construct item characteristic curves (ICC) for test items under
consideration at Pembroke State University. He used only the classical approach, though
Anastasi (1988) suggested that both the classical and the graphing of the item characteristic
curves be provided for all items under consideration. Though the information may be
contradictory, it will be helpful in making informed decisions about problem performance.
Judgmental Overview
As stated by Berk (1984b), once staff has gathered the previously described judgmental
and statistical information on each of the problems under consideration, they will need to
determine if the items have “functioned consistently with the purposes for which they were
constructed” (p. 122). Again, the decisions will be to (a) accept for inclusion in the test
instrument, (b) revise and re-submit for the analysis process again, or (c) discard.

37
Distractor Analysis
Truman (1992) indicated that Pembroke State University staff maintained statistics on
how often distractors were chosen in each placement test. “If a particular answer had not been
chosen in 100 cases, then it needs to be replaced” (Katz, 1965, as cited in Truman, p. 59). Berk
(1984b) indicated that the following criteria should be utilized in the analysis of problem
distractors; (a) Each distractor should be chosen more often by the uninstructed group that the
instructed, (b) At least 5% to 10% of the uninstructed group should chose each distractor. (c)
If the instructed group chose a distractor as often as the correct answer, the distractor should be
replaced.
Test Assimilation
Problem Order
As stated previously, the difficulty indexes calculated when the test items were analyzed
are now used for placement in the test instrument. There are four possibilities for arrangement
as stated by Meyer (1992). These arrangements were (a) easy to difficult, (b) difficult to easy,
(c) random, and (d) spiral cyclical.
Meyer stated advantages and disadvantages for each of the first two arrangements. In the
easy to difficult arrangement, the test taker can build confidence by being able to complete the
easy problems at the beginning. The disadvantage is that the test taker will have less energy to
complete the harder problems at the end of the test. In the difficult to easy, the test taker is able
to deal with the harder problems when less fatigued, but as a disadvantage, could become
discouraged sooner.
According to Truman (1992) and Anastasi (1988), problem arrangement in a placement
test is typically from easy to hard which allows test takers to gain confidence and not waste time

38
on problems that are too difficult for them to solve. In the placement test designed by Truman
and staff at Pembroke State University, they divided the test into sections, with increasing
difficulty in each. This satisfies the goal of having each student work until level of placement is
reached (Miles, 1982b, as cited in Truman).
There are possible gender issues involved in problem positioning in a test instrument.
There have been a variety of studies conducted on the effect of each on student success, but the
results were inconsistent. After reviewing many gender and problem arrangement studies,
Leary and Dorans (1985) could only conclude that the hard to easy problem arrangement should
be avoided, especially under highly speeded test situations (as cited in Meyer, 1992).
Positioning of problems in the instrument according to content is a consideration in test
assimilation as well. Anastasi (1988) stated that working towards internal consistency and
external validity are admirable objectives in test construction, but sometimes these objectives
conflict. To accommodate this in most testing purposes, it is appropriate to sort similar items
into separate tests or subtests, each of which could then assess separate external curriculums.
Test Length
According to Anastasi (1988) and Morante (1987), when all other criteria are equal,
longer tests are generally more valid and more reliable, however, there is a limit to the length of
a test instrument Evidently if every problem from every assignment throughout a specified
mathematics course could be incorporated into the test instrument, there would be a direct
correlation between successful completion of the assessment and the course, but that is highly
unlikely Available time and endurance of examinees are a primary consideration.
The longer the test, the more likely that fatigue will enter as a factor and adversely affect
the accuracy of the measurement (Truman, 1992). Truman indicated further that lower ability

39
students tend to tire more quickly than those with higher ability. Shortening the test and still
maintaining a valid measurement is a significant problem for test designers. The need to ensure
adequate sampling validity with the fewest number of problems and the shortest period of time
allowed is difficult. (Refer to the definition of content validity in Appendix A.) This researcher
will further address the content validity issue in a later section of this study.
Katz (1973) added that the benefits of increasing test reliability by making the test longer
need to be weighed against the issue of time. As Katz stated, the law of diminishing returns
applies to test length. Increasing the test beyond a certain length provides minimal increases in
reliability. After a certain point, lengthening the test basically just adds on time.
Since the students in need of basic skills are the ones that a placement test in mathematics
is trying to identify, it would seem logical that creating tests of an appropriate length would be
important Truman (1992) suggested that a placement test in mathematics should be 25 to 50
problems in length.
Hambleton ( 1984) presented five different methods that test designers could use to
calculate the ideal test length for their instrument. These methods were ( 1 ) Millman’s (1972,
1973) binomial test model, (2) Novick’s and Lewis’s (1974) Bayesian approach, (3) Wilcox’s
(1976) indifference zone approach (4) Hambleton, Mills and Simon (1983) computer simulation
methods, and (5) Lord’s (1980) item response theory design.
The scope of this paper prohibits dealing with these techniques in detail; however, in
summary, these methods reflect that a statistical approach is most appropriate for determination
of proper test length. Each of these previously mentioned methods utilize a variety of measures
such as cut score levels, acceptable level of classification errors, percentage of examinees who
are likely to exceed the cut score level, previous measure of false positives and false negatives.

40
and some measure o f the degree of similarity between items. The last factor is evaluated
because a longer test is required when test items differ in content (Hambleton, 1984).
Item analysis makes it possible to shorten a test and at the same time increase its validity
and reliability. If several items can be removed from the test that have unsatisfactory difficulty
and discrimination indexes, the test will actually improve (Anastasi, 1988).
The study by Melancon and Thompson (1990) reflected a similar thought. They were
able to improve the calculated split-half reliability (Appendix A) of a Mathematics Association
of American mathematics placement test by changing test items. They revised the test by
changing from three subscales of arithmetic (18 items), algebra (20 items) and finite math (12
items) to two subscales of arithmetic and algebra with 25 items in each. They kept the number
of problems the same but improved the internal consistency of the test. When they recalculated
the Spearman-Brown coefficient, it had a higher correlation than before (Appendix A)
Power Versus Speed Tests
Entering into any decision about test length is the consideration of time. As stated
previously, placement tests for basic skills should not be speed tests (Morante, 1987) Anastasi
(1988) stated examinees must have sufficient time to complete criterion-referenced tests since
the test ends when the examinee reaches his or her their level of expertise, not because of a lack
of time Additionally, Anastasi stated that just having a time limit does not make the test a
speed test. The time allowed needs to be reasonable. Nunnally (1978) stated that
psychometricians recommend that 80% to 90% of examinees must be able to complete a
placement test in the stated time (as cited in Akst & Hirsch, 1991).
Timed tests have not been a primary concern in the past for multiple choice tests since
most allow for one quick answer; but as test developers begin to design problems that require

41
higher level thinking and problem solving skills, the factor of time may become a more
important consideration (Akst & Hirsch, 1991).
Test Bias
Test instruments should consist of unbiased items. As previously described, during the
item analysis process, problems have already been reviewed for item content bias; but now the
entire test instrument needs to be reviewed for test bias. According to Shepard (1982) both
judgmental and statistical methods are necessary for identifying bias in a test instrument. Expert
judgment is necessary to determine the relevance of items for the test, while statistical
assessments are necessary for detecting items that are inappropriately placed. After
the statistical analysis is complete and statistically biased items identified, expert judgment is
necessary to verify that these items are inappropriate.
Required Data Type
Once the test has been assembled and prior to the onset of the actual test review process,
the type of student data required needs delineation. This researcher found that most
documented test instrument studies were statistically based. This included the determination of
cut scores and any criterion-related validity studies. McDonald (1989) and Truman (1992) both
recommended that statistical methods other than subjective opinion be considered in test
evaluation
This researcher will summarize studies in later sections of this chapter that correlated
placement test scores with other measurements. In several cases the researchers selected final
grades as the criterion of measure because it was the easiest score to obtain, but in all cases, the
test scores were reported in the form of interval or ordinal data (Appendix A)

42
In most cases the researchers calculated Pearson rho correlation coefficients for interval
data or the Spearman rho correlation coefficient for ordinal data (Appendix A), In very few
cases was a Chi Square calculation (Appendix A) utilized because the studies were not limited
to measurements maintained in nominal data form. Many of the following studies would not
have been possible if the researchers had recorded student scores as nominal data.
Setting Performance Standards
Test Difficulty
A range of difficulty is built into most tests with the expectation that a majority of the
students will be able to complete the easiest tasks while only a few will be able to complete the
most difficult tasks (Mathematical Sciences Education Board, 1993). Truman (1992) stated
that 75% of the freshmen could complete questions from the least difficult area, while only 25%
could answer questions at the most difficult level. This percentage level is a local decision
based on the student population. Anastasi (1988) stated that screening or placement tests
should use items whose difficulty indexes come closest to the desired selection ratio.
Difficulty levels can adversely affect the validity and reliability of a test instrument.
According to Gay (1992) if tests are too hard and scores are constantly low, the test will have
reliability but will have low validity since it will not be measuring or discriminating between the
students. Anastasi (1988) indicated that if tests lack an adequate number of easy items, then
discrimination will not occur at the lower end of the scale, resulting in “skewness from
insufficient test floors” (p. 208).
Cut Score Determination
There are numerous methods for determining cut scores with wide variations in the
required levels of proficiency established by each college (Akst & Hirsch, 1991) Methods vary

43
from primarily faculty judgment and scatter graphs to regression techniques (Hirsch &
Subhiyah, 1987, as cited in Akst & Hirsch), or utilizing the same data that is collected for
validation studies (Frisbie, 1982, as cited in McDonald, 1989).
Researchers cited a variety of sources. McDonald (1989) suggested two additional
references in this area; (a) Passing Scores by Livington and Zickey (1982) and (b) “A
Consumer’s Guide to Standards Setting” by R. Berk (1986). Akst and Hirsch noted that An
Investigation of the Validity of Cut-off Scores for Criterion Referenced Tests by Hoveland
(1985) provided five different methods to determine cut scores in a mathematics placement test.
Morante (1987) stated that the traditional method used for cut score determination is to
correlate placement test scores with grades. This requires that every student enroll in the higher
level math class regardless of test score. The primary disadvantage of this approach is that
remediation-level students will have a high failure rate. Morante introduced another statistical
method for validating cut scores; however, first some additional concepts and terms must be
defined
According to Anastasi (1988), a placement test with one specific cut score creates four
categories of students: (a) Valid acceptance — student passes the test and is successful in the
class, (b) False acceptance or false positive — student passes the test but fails the class; (c) False
rejection or false negative — student fails test but is successful in the class; or (d) Valid rejection
— student fails the test and was unsuccessful in the class. No matter where faculty set scores,
there will be false negatives and false positives (Akst & Hirsch, 1991), but these should be kept
at a minimum level (American Psychological Association, 1985).
Since no one score is sufficient for making decisions, it would be more appropriate to
utilize cut ranges (Morante, 1987). Faculty should consider three areas of proficiency in cut
44
score determination (Morante, Faskow, & Menditto, 1994, as cited in McDonald, 1989). These
are the following: (a) Highest scores — students are proficient enough for advancement into the
next class level, (b) Gray area — students at this level will require assistance of a faculty
member or counselor to evaluate other factors for placement level determination. These include
test anxiety, grade point, motivation, and other factors not addressed by the test, (c) Lowest
scores -- students at this level lack the required levels o f proficiency and are appropriate for
remediation or assignment to that level. Scores at the highest level and at the lowest level are
likely to be the most accurate assessments (Morante, 1987).
Using this classification of cut ranges, Morante (1987) suggested an alternative method
for cut score validation and determination This includes the following: (a) Appoint a
committee of faculty and administration members, (b) Make a preliminary judgment on
tentative cut score levels. (Prior levels would be appropriate.) (c) Allow three levels of
proficiency for each suggested course, high score, gray score and low score, (d) Using this
system set cut score ranges at each level, (e) Place students accordingly, (f) After a few weeks,
obtain faculty ratings as to perceived levels of proficiency, without including other factors such
as attendance, motivation or class participation, (g) Use collected information to adjust cut
scores accordingly.
Once cut scores are determined, specific tables are used to interpret the raw scores.
Sturtz and McCarroll (1993) used a cut score table to interpret student scores on the New
Jersey College Basic Skills Placement Tests (NJCBSPT), for three levels of math classes (p. 7):

45
1 Test 1 Ranges 1 Recommendation 11 Computation 1 < = 1 6 0 t Basic Math I 11 Computation 1 >=161 1 Basic Math II |1 Algebra 1 <=171 1 .11... .. Algebra.. ........ 1 >=172 1 College Math 1
Callahan (1993), Isonio (1992), and Slark et al (1991) utilized various forms of statistical
analysis to make cut score determinations or validate existing levels of cut scores in their
perspective colleges. In the first case, Callahan introduced several other variables into the
placement decision, while Isonio and Slark et al. used the usual one set cut score.
Callahan (1993) utilized ten years of student data and correlated placement test scores,
ACT and SAT test scores, and years of high school math to corresponding success levels in
Basic Algebra and Calculus Readiness classes. As a final result of the study, the researcher
created a specific rating table for determining appropriate placement. In this way, faculty could
make more consistent judgments on assessing those students who might fall in the previously
described gray areas. This table is summarized as follows:
Test ScoreHS Math Education
ACTScores Course
> = 1 2 CALC I<=11 5 Yrs CALCl<=11 4 Yrs > = 30 CALC I<=11 26 to 29 BORDER<=11 < =25 COL ALG<=11 3 Yrs COL ALG
In Callahan’s placement table (a) Yrs HS represents the number of years of high school
math classes, (b) ACT represents the older version of ACT test scores, (c) CALC I represents
Calculus I, and (d) COL ALG represents College Algebra.
This researcher presents this table only to illustrate how multiple criteria can be

46
incorporated into placement decisions in a more standardized manner as opposed to making
subjective evaluations of the same. By limiting subjective evaluations, the scorer reliability issue
will not be as significant.
Both Isonio (1992) and Slark et al. (1991) utilized mathematics placements test scores
from the California Mathematics Diagnostic Testing Project tests (MDTP), but with students
from different colleges and a different time frame. Both compared math placement test scores
to class grades and determined or verified the cut score level by maximizing the discrimination
between successful and unsuccessful students.
Isonio established the cut score in each of six levels of math classes by determining the
score level above which the greatest percentage of students were successful and the least
percentage of students were unsuccessful. Slark et al. compared student performance in two
different math classes across possible cut score levels. The student scores were additionally
differentiated by the four categories previously described by Anastasi (1988): (a) valid
acceptance, (b) false acceptance or false positives, (d) false rejections or false negatives, and (e)
valid rejections. Slark et al. verified current cut score levels by showing that this level
optimized the appropriate placement of students. If the score in each case were raised, too
many students who could have been successful would be eliminated from consideration, termed
false negatives. By lowering the score, too many false positives would occur.
Determination of Validity
According to the American Psychological Association (1985) Standards for Educational
and Psychological Testing, "the most important consideration in test evaluation is the
determination of validity” (p. 9). Additionally, a test is only considered valid for a particular
purpose and for a particular group (Gay, 1992). This researcher will delineate the process

47
involved in providing this documentation in the following pages.
There are four types of validation, (a) face, (b) content, (c) criterion-related, and (d)
construct (Anastasi, 1988; Gay, 1992). (Refer to definition in Appendix A.) As has been stated
previously, the type of validation procedure used depends on what will be done with the test
scores (Anastasi). The same test that is used for different purposes requires validation by
different methods.
If a placement test is considered to be an achievement test, where the amount of
knowledge already learned is being assessed, then content validation is important. If the
placement test is used as an aptitude test to predict performance in a higher level class, then a
criterion-related validation study is suggested (Anastasi, 1988). As has been discussed
previously, a placement test is a combination of achievement test and aptitude test and needs
validation by both methods (McDonald, 1989; Truman, 1992)
Face Validity
This is the first assessment made of a test based on just appearance. It should not be
confused with some of the more technical aspects of validity that will be addressed. It merely
determines if the test appears to measure what it is supposed to measure (Anastasi, 1988; Gay,
1992) The format, style, and level of professionalism used in printing are considered in this
evaluation. If staff create problems that utilize the language of the examinees, face validity
improves (Anastasi). For example, in a college placement test, the test should be appropriate
for an adult population.
Content Validity
Gay (1992) stated that content validity requires both item validity and sampling validity.
Item validity indicates that the test items represent measurement in the intended area, while

48
sampling validity indicates that the intended areas are appropriately represented. An item is
considered content valid if it tests subject matter taught in the level of testing or if it measures a
previously learned skill that is required for successful completion of the class (Millman &
Greene, 1988; Truman, 1992).
Romberg, Wilson, et al. (1992) used a three level matrix as a guide, which has been
reproduced below, for conducting assessment analysis that incorporated recent mathematics
education reform suggested in National Council of Teachers of Mathematics (1989) Curriculum
and Evaluation Standards for School Mathematics. This assessment design could be helpful in
conducting a content analysis; but it would only serve to illustrate the concept since the defined
content was only appropriate for the tests that Romberg, Wilson, et al. used in their analysis.
This assessment uses three areas: (a) content, (b) process, and (c) level. The content
areas are defined as (a) nr for number and number relations, (b) ns for number systems and
theory, (c) alg for algebra, (d) p/s for probability or statistics, (e) geo for geometry, and (f) mea
for measurement. The process area is divided into (a) com for communication, (b) c/e for
computation or estimation, (c) con for connection, (d) rea for reasoning, (e) ps for problem
solving, and (f) p&f for patterns and functions. The level is in turn divided into (a) cone for
concepts and (b) proc for procedures (Romberg & Wilson, Appendix B).
CONTENT PROCESS LEVELQues nr I ns | alg | pis | geo | mea com I c/e I con I rea | ps | p&f | cone | proc
Sampling validity is somewhat more difficult to measure according to Anastasi (1988).
‘The behavior domain must be systematically analyzed to make certain that all major aspects are
49
covered by the test item and in the proper proportion” (p. 140). Appropriate questions posed
by Mathematical Science Education Board (1993) regarding validity assessments might guide
the procedure: (a) Does each important area of course content give the same weight in the
assessment? (b) Is the entire course content reflected in the assessment? (c) How well does the
assessment treat the course content to which it was aimed?
A content validation study should consist o f a definition of the content area and the levels
of skills or instructional objectives covered with an indication of the numbers of items reported
in each (Anastasi, 1988), which has been previously described as the test specifications,
Anastasi further stated that any discussion of the content validity in the manual of an
educational achievement test should include a description of all procedures followed to ensure
that test content is representative and appropriate. By the definition, content validity is built
into test item construction and cannot be a consideration at the end such as in criterion-related
validity studies.
The American Psychological Association (1985) Standards of Educational and
Psychological Testing require test administrators and test designers to adhere to the follownng
primary standard, Standard 3.18.
A test should be amended or revised when new research data, significant changes in the
domain represented, or new conditions of test use and interpretation make test
inappropriate for use. An apparently old test need not be withdrawn or revised simply
because of the passage of time. But it is the responsibility of test developers and test
publishers to monitor changing conditions to amend, revise or withdraw tests as indicated
(1985, p. 29).
Content validity should be conducted on an annual basis (Anastasi, 1988) and should

50
precede any adoption or change in an assessment instrument (McDonald, 1989). Faculty should
examine all items in the test and determine if they have a clear relationship to curriculum. If not,
then test or test items should not be used (McDonald). As Truman (1992) indicated, even if a
test item has good predictive validity, it must be replaced if it is not content valid.
A content validation study is not calculated; it is conducted by expert judgment (Gay,
1992; McDonald, 1989). Truman (1992) suggested that at least three and at most six faculty
members evaluate test items for content validity. The American Psychological Association
(1985) Standards for Educational and Psvchological Testing has a secondary standard (Standard
1.7) that addresses this issue. If possible, faculty that review a test for content validity should
verify their expert status by signing, dating, and stating their credentials each time they validate
the test.
Criterion-Related Validity
According to the Standards for Educational and Psvchological Testing, criterion-related
evidence is the most common validation method used with admissions assessments, even though
construct and content related evidence is important (American Psychological Association,
1985) This type of validation evaluates the effectiveness an instrument has in predicting
success with an independent criterion that is a direct measure of what the test is designed to
measure (Anastasi, 1988),
There are two types of criterion-related validity studies: (a) concurrent correlation studies
or (b) predictive correlation studies. The American Psychological Association (1985) indicated
that the time factor determines the difference between the two. If the criterion is available at the
same time that the test instrument is being used, it is concurrent validation. If the criterion is
only available in the future, then it is a predictive validation.

51
The Standards for Educational and Psychological Testing (1985) delineated three separate
primary standards that relate to criterion-referenced validation studies of test instruments; (a)
Any reports of criterion-related validation studies should provide a detailed description of the
sample and statistical analysis used, (b) All criterion measures must be described accurately and
the reasons why measures were chosen must be delineated, (c) Any predictive criteria chosen
must be independent from effects due to the instrument (American Psychological Association).
Concurrent Validity
According to the Mathematical Science Education Board (1993), a concurrent validation
study evaluates if the assessment instrument in question scores students in the same way that
another proven test that measures the same information. Though the American Psychological
Association (1985) considers concurrent validation studies most appropriate for achievement
tests, this researcher found few recently documented studies of this type conducted by a college
on its mathematics placement instrument.
Johnson (1983) completed a concurrent validation of the REM, a placement test that
covered reading, grammar and mathematics. The reading and grammar component tests were
professionally designed instruments while the mathematics portion was locally designed.
Johnson correlated scores on the Scholastic Achievement Test (SAT) with scores from the
REM and calculated the Pearson rho and the Spearman rho correlation coefficients. At the
0.001 level of significance, the Pearson correlation coefficient was 0.6498 while the Spearman
rho was 0.6368 for scores on the mathematics portions of both tests. Johnson concluded that
the mathematics portion of the test had concurrent validity with the SAT
Morante (1987) discussed the results of correlation studies conducted by the Basic Skills
Council in 1978 and 1986. In these studies, SAT scores were correlated with the New Jersey

52
College Basic Skills Placement Test (NJCBSPT). As was stated in a previous section, little or
no correlation was found between SAT and NJCBSPT scores.
Predictive Validity
If test results will be used to predict success in some future situation such as a student’s
performance in college or in a particular class, then a predictive validity study is required
(Anastasi, 1988; Gay, 1992). It is unlikely that predictive validity studies will be successful in a
basic skills assessment. If the remediation class is effective, there will be little or no correlation
between placement test scores and final grades in the class (Morante, 1987).
This researcher found four recently documented predicted validity studies o f mathematics
placement tests conducted by the college. Each of the four evaluated the effectiveness of a
professionally designed placement test; each conducted a statistical analysis to verify cut score
levels; and each found weak correlations or inconclusive results. Two of these calculated
Pearson rho correlation coefficients for placement test scores and eventual success in the class
(Isonio, 1992; Slark et al., 1991), The other two did not calculate a correlation coefficient but
they studied eventual success rates for students in comparison to their test scores (Gabe, 1989;
Sturtz & McCarroll, 1993).
Slark et al. (1991) studied the correlation between the California State University
Mathematics Diagnostic Testing Project test scores and student success in the corresponding
class, by calculating the Pearson rho correlation coefficient. At the 0.05 level of significance,
for placement in Math 050 the correlation was 0.33; for placement in Math 060 the correlation
was 0.14 In either case the correlation was weak.
Isonio (1992) conducted a predictive validation study of the same test as Slark et al.
(1991) but utilized a different student population in a different college. The researcher

53
correlated test results with measures of student success in seven levels of math classes, using
Pearson rho correlation coefficients. Isonio denoted the median measure of the seven
correlations as the overall correlation and determined that it exceeded the standard of 0.35.
The researcher concluded that there was predictive validity between placement test scores and
student success measures, though at many course levels the correlation was very weak.
Gabe (1989) evaluated success rates for students who scored below or just above the
college set cut scores on the Asset placement test and did not take the recommended college
remediation courses. The Asset test covered math and writing. The results of the study were
inconclusive. Success in both math and English classes did not seem to be strongly correlated
to test scores or whether or not students followed suggested remediation. The researcher
concluded that there was questionable predictive validity for the Asset test and that mandatory
placement based totally on placement scores was inappropriate.
Sturtz and McCarroll (1993) correlated scores on the New Jersey College Basic Skills
Placement (NJCBSPT) with student success measures by evaluating success rates of those who
followed recommendations for remediation and those who did not. This resulted in a study of
false negatives and false positives. The researchers found that the results of the study were
inconclusive and suggested further study.
Construct-Related Validity
McDonald (1989) defined this validity to mean that the score from a test with construct-
related validity is a “measure of the knowledge, skills and abilities targeted by the test and is not
a measure of other irrelevant traits” (p. 21). Anastasi (1988) indicated that proving that a test is
content valid and that it has criterion-related validity is only proving that the test adequately

54
measures the intended construct. In this way, construct validity is the unitary type of validity
that is addressed in more current literature (Anastasi).
Assessing Test Reliability
Determination of Test Reliability
Anastasi (1988) defines reliability to be consistency of measurement. It is measured by
test-retest, alternate form testing, and split-half testing. The description of each type of test
follows.
Test-retest reliability is the most obvious way to calculate how consistently an instrument
measures, since the results from one administration of a test are compared to the second
administration of the same test. Only tests that repetition does not affect can utilize this
technique effectively (Anastasi, 1988). Researchers calculate a correlation coefficient, such as
Pearson rho if interval or ratio data is available or Spearman rho if ordinal data is available.
This type of coefficient in reliability studies is termed the coefficient of stability (Katz, 1973).
Researchers evaluate the results at stated levels of significance (Gay, 1992).
The alternate test method correlates test scores on the original test to a statistically similar
or parallel test administered at nearly the same time (Anastasi, 1988; Gay, 1992). The
correlational coefficient calculated with this test is the equivalence coefficient (Katz, 1973).
The primary difficulty with this method is obtaining an alternate test. As stated
previously, locally designed tests seldom have an alternate test available since the level of
psychometrics required to create an instrument of this type is beyond the capability of most
faculty (Morante, 1987). Some professional test manufacturers do provide tests of this type
(McDonald, 1989).
The split-half reliability test divides the test in equal halves and correlates examinee scores

55
on the two halves (Anastasi, 1988; Gay, 1992). The correlational coefficient obtained in this
manner is incorporated into the Spearman-Brown formula. This test measures consistency of
“content sampling” (Anastasi, p. 120), with the calculated coefficient is termed the coefficient of
internal consistency (Katz, 1973). This is most easily done when the test is arranged in
difficulty from easy to hard and can then be divided by odd and even number problems, though
this can also be done when some assessment is available on determination of equal divisions,
(Gay, 1992).
Assurance of Reliability
The easiest method for ensuring high reliability of test measurements is by following
standardized procedures, thereby reducing error variance. The standardized procedures
followed would include test form, time, directions, scoring and score evaluation. The less error
variance allowed; the more reliable will be the measures (Anastasi, 1988). Morante (1987) that
reliability coefficients should be high, measuring at least 0.90.
Scorer reliability. As stated previously, when judgment enters into score interpretation,
error variance is introduced, thereby adversely affecting test reliability. The assessment of
scorer reliability in a judgmental decision becomes one of the most important factors in
assessing reliability of a test instrument (Anastasi, 1988).
Using standard cut scores or specified cut score ranges with other factors clearly defined
will help eliminate some of the error variance that is introduced by scorer judgment. The
sample placement guide originally created by Slark et al. (1991) and reproduced in part on page
45 would be helpful When scorers use standardized guides for score interpretation, error
variance is reduced, which improves reliability.
Producers of assessments are required to adhere to the following two primary standards

56
which relate specifically to scorer reliability as determined by the American Psychological
Association (1985) Standards for Educational and Psychological Testing: Standard 2.8 —
Evidence of inteijudge agreement should be provided. Standard 3.25 — The basis for scoring
and the training procedures for scorers needs to be delineated. Standard 2.3 — When test
“reliability is estimated, the specific type of study, sample and confidence level must be
specified” (p. 21).
Interpretation
According to Katz (1973), there are seven factors that influence the interpretation of
stated reliability coefficients; (a) Speed tests — Because test items in speed tests have high
content similarity, reported coefficients of internal consistency will be high, (b) Test length —
Lengthy tests tend to have higher reliability, but consideration must be given to length of time
available and how much added reliability is worth the additional time, (c) Population — The
population used in the reported study must be the same as the testing population Testing of
more diverse population results in higher coefficients that those testing similar populations, (d)
Difficulty — Tests that are more difficult, resulting in more guessing, will have lower reliability
than those the reported study population found easier, (e) Standard error o f measurement — A
measurement of reliability that is not affected by nature of sample population (Appendix A). It
is expressed in the reported score interpretation for each test. Some test manufacturers provide
varying levels of the standard error of measurement for different scores, (f) Group — The
reliability of any test is better when comparing scores of groups than scores of individuals, (g)
Purpose — If the assessment is a high cost assessment, a higher degree of reliability will be
desired.

57
Additionally, the Standards for Educational and Psyciiological Testing (1985) requires
that when producers of assessments provide estimations of reliability that they provide the
specific type of study, sample population, and confidence level utilized in the reliability study
conducted for further evaluation (American Psychological Association, Standard 2.3).
Test Administration
Once the test is in place, staff and administration need to make decisions on how to use
the test and how best to ensure that scores will be accurate.
Test Anxiety
Because the group testing environment is so threatening to students, steps must be taken
to ensure that information is communicated effectively to the student (Anastasi, 1988). Test
information needs to be disseminated to the student, especially the adult student who has been
away from a math class for a length of time. Short basic mathematics review sessions geared to
adults with sample tests would be effective (McDonald, 1989). The score that an adult receives
on his or her first math test after being away from the educational arena for an extended period
is usually not a true measure o f knowledge or skill level.
Mandatory versus Recommended
Administration needs to decide how faculty will obtain and use student scores. In every
placement arena, if testing is provided it is either optional or required. Once the score is
obtained, there are four methods to handle the information, (a) In self assessment, the student is
provided take-home tests for the various levels being considered. In that way, the student can
without the pressure of the group testing environment, decide what the appropriate course
should be (b) In advisement, counselors determine the appropriate course placement upon
reviewing test scores and student background, (c) In mandatory, all students are required to

58
take a placement test. The results of this one test determine student placement. In some cases;
borderline students may be allowed to select one of two levels, (d) In modified mandatory, all
students are required to take a placement test; and the results o f this determine placement,
unless permission is granted fi'om a designated faculty member to deviate from this decision
(Lewenthal, 1981, as cited in Akst & Hirsch, 1991).
Local junior colleges presently use a variety of combinations of testing and placement
policies in the mathematics arena. In the Michigan State Board of Education Survey (1990), 23
junior colleges or 79% reported that placement testing was mandatory for basic mathematics,
while 17 colleges or 59% reported that this testing was mandatory for algebra. Fewer numbers
of colleges reported mandatory placement in the same survey. Only eight reported mandatory
placement in basic mathematics with six of these same colleges reported mandatory placement
in algebra.
Out of the six who reported mandatory placement in algebra, one used a locally designed
math placement test, two used the American College Testing (ACT) Assset, and there was no
mention of the tests used by the other three colleges. Out of the eight who reported mandatory
placement in basic math, six of these utilized the ACT Asset placement test. There was no
mention of what type the other two colleges used.
Many have argued in favor of mandatory placement, stating that unprepared and
uninformed students will make poor class selections (Sworder, 1976, as cited in Akst & Hirsch).
When students enroll in an inappropriate class, their failure rates are high (Cohen, 1989, as cited
in Brunson, 1992, Morante, 1987). Researchers have conducted studies that evaluate if
students who follow placement recommendations are more successful than those who do not.
Results are generally mixed.

59
Sturtz and McCarroll (1993) conducted a study to determine if students who followed
placement recommendations into remediation for math and English classes were more
successful than those who chose to enroll in higher level classes without the appropriate
recommendation. The researchers used the New Jersey College Basic Skills Placement Test in
which the students were tested for basic math and English skills. Test scores from each
determined placement.
Sturtz and McCarroll (1993) measured student success by mean grade for the class,
successful completion of a higher level math or English class, and continued enrollment. The
researchers found that 404 out of 678 followed recommendations for placement in the
appropriate math class, 50 students enrolled in higher classes, while 24 enrolled in lower classes
than recommended. The remaining 200 students did not enroll in a math class.
Of the original 404 who enrolled in the appropriate class, 267 or 66% received an A, B or
C for the course. Of the 50 who enrolled in higher classes than were recommended, 31 were
successful or 62%; therefore, a higher percentage of those who followed faculty
recommendations received an A, B or C, though there was no discussion of the significance
level of the difference. In overall grade point, those that did not follow faculty
recommendations and opted to enroll in a higher level class, had higher average grade points
and stayed in school longer; again, there was no discussion of the significance of difference.
The researchers concluded that this should be studied further.
Studies have shown that once students have the correct information that they will
generally make appropriate decisions. The study by Jue (1993) illustrated this concept. Jue
compared the effectiveness o f what was termed mandatory placement to that of an advisory
self-selection or blind process in Napa Valley College, California. (Note: According to the

60
definition given above, the placement concept used in this study would be more accurately
termed advisement instead of mandatory.) Researchers randomly assigned the students to two
groups. Both groups completed placement tests in math and English, and both received course
recommendations from faculty. The students in the mandatory group were the only ones who
received their test scores.
Faculty requested that both groups consider several other factors before making a class
selection decision. These were (a) grades in last math and English class, (b) high school grade
point average and length of time away Ifom school, (c) length of time since taking a math or
English class, (d) available time, considering work and family obligations, (e) their study skills,
and (f) their level of ambition (Jue, 1993).
Faculty had assumed that almost all of the mandatory students would follow
recommendations and assumed that a significant number of the blind students would enroll in
inappropriate level classes. This did not happen.
Instead of almost all the mandatory enrolling in the appropriate class, 3/4 enrolled.
Instead of a significant number of blind students enrolling in inappropriate classes, 2/3 enrolled
in the appropriate level. Most students did not want to know their scores and placed
themselves without it Greater numbers of students (mandatory and blind) followed faculty
recommendations for mathematics class placement while higher percentages of both types
enrolled in lower level Enghsh classes than recommended (Jue, 1993).
Making placement decisions based on just the result of one test is risky Tests are
measurements and as such have measurement error (McDonald, 1989; Schoen,1993). Because
mathematics knowledge is multi-faceted, one test cannot measure all a person knows (Webb &
Romberg, 1992). Many students have been inappropriately placed because of a placement test

6 1
score. The issue of false negatives and false positives would not be a concern if this number
was small (Anastasi, 1988; Schoen; Truman, 1992). This researcher found no study where
there was a significant correlation between placement test score and success in the class. The
studies reflected in this paper found weak predictive correlations between purchased placement
tests and student success (Gabe, 1989; Isonio, 1992; Slark et al., 1991).
Since no one score is sufficient for making placement recommendations for every
student, cut score ranges have been suggested, with particular attention being given to the gray
area (Morante, 1987). These have been described in the previous section and are a way to deal
with the inaccuracies of test measurements. Multi-leveled assessments where many factors are
considered for placement decisions have been proposed. “No test has perfect predictive
validity, however, predictions based on a combination of several test scores will invariably be
more accurate than predictions based on the scores of any one test” (Gay, 1992, p. 159).
There are a variety of factors that will determine whether or not a student will be
successful in a class that cannot be determined by a test (Schoen, 1993). Some of these were
mentioned above but they include previous achievement, anxiety, motivation, study skills,
available time, work, family, sickness, years since last math class, class ranking, grade point
average in high school, number of years of high school math, and grade average in high school
math (Akst & Hirsch, 1991; Jue, 1993; Morante, 1987). Prior scores on ACT and SAT can be
helpful information as well (Callahan, 1993). Letters of recommendation, lists of past
accomplishments, and written statements by the student would all be helpful information to
consider before a placement decision is made (American Psychological Association, 1985).
Not any one of these other factors will determine the true picture of the student’s ability. All
must be considered and evaluated.

62
Literature review has not shown that mandatory placement is for every college (Akst &
Hirsch, 1991; Sturtz & McCarroll, 1993). Before a college makes a decision on what will
constitute its placement policy, three factors need to be evaluated:
(1) Test validity — If a placement test is going to be used, it must be a valid and reliable
instrument. A placement decision is a high cost decision and as such should be a valid and
reliable instrument (Akst & Hirsch, 1991; American Psychological Association, 1985,
Mathematical Sciences Education Board, 1993). This paper dealt extensively with the
standards that are required of a valid and reliable instrument.
(2) Quality of advisors — As has been shown previously, the correlation between a
placement test instrument and success in the corresponding class is relatively low because there
are so many other factors that can influence success in a class that cannot be addressed in a test.
Appropriate faculty need to explore these issues with the student before placement.
(3) Nature of student population — Morante (1987) characterized the potential success
rate of students in the following way . (a) The more difficulties and responsibilities a student
faces, the more likely that remediation will be appropriate, (b) Many recent high school
graduates are not able to make an accurate assessment of their capabilities (c) The older
students tend to be “more fearful, cautious, and motivated. All else being equal, the older
student will have a better chance in college courses than younger students” (p. 61)
In closing, a single score from an assessment tool no matter how extensively studied,
tested, and evaluated, it is still a tool and as such has error of measurement. Making a decision
of consequence with one measurement is risky and should be considered with caution A
standardized composite score with multiple predictors might be more appropriate (Anastasi,
1988)

63
Math Education Reform
No discussion of mathematics assessments used in placement would be complete without
some closing comments about the significant changes that are occurring in mathematics
education as a direct result of the National Council of Teachers of Mathematics (NCTM) 1989
release of the Curriculum and Evaluation Standards for School Mathematics. To cover this in
detail is beyond the scope of this paper. However, a brief overview of how the NCTM
standards have affected the assessment process and the methods used in instruction of
mathematics remediation at the college level is appropriate.
NCTM Standards
With the release of the National Council of Teachers of Mathematics Curriculum and
Evaluation Standards for School Mathematics in 1989, there have been significant changes
made in the instruction and assessment of mathematics in grades K-12 (Laughbaum, 1992;
Mathematical Sciences Education Board, 1993). There are three basic issues that NCTM
addressed that need to be explored because of the types of students that colleges will see in
increasing numbers; (a) equity, (b) calculators, and (c) mathematics remediation
NCTM - Equity Principle
One of the underlying assumptions of the NCTM standards for grades 9-12 is “the level of
computational proficiency suggested in the K-8 standards will be expected of all students;
however, no student will be denied access to the study of mathematics in grades 9-12 because
of a lack of computational facility” (National Council o f Teachers of Mathematics, p. 124).
Another basic concept of the NCTM standards is that all students grades 9-12 will be
exposed to the higher levels of mathematics instruction (1989; Webb & Romberg, 1992); but
large scale assessments in mathematics have been inappropriately used in the past to filter

64
students out of educational opportunity (Mathematical Sciences Education Board, 1993).
Many students, particularly of African-Americans and Hispanic descent, were required to stay in
basic mathematics instruction for extended periods of time trying to learn fractions, decimal, and
percentage operations in repetitive drill type environments (Schoen, 1993). Since many could
not learn these concepts well with that type of method before, in many cases their lack of
success continued (Boyd & Carson, 1991).
Continuing to teach remediation in this manner continues to reinforce the idea that only
certain people can be successful in mathematics. With our highly skilled testing systems and the
need to rank and classify mathematics students, this idea again reinforces the idea that only
some students can learn mathematics, while others cannot (Mathematical Sciences Education
Board, 1993). No where in the world is to so readily established that failure, particularly in
mathematics, is acceptable (Wolf et al., 1991, as cited in Schoen, 1993). “Students are very
willing to accept that they just did not get that math gene, eluding that some just have that
ungraspable power” (Schoen, p. 5).
All students need to learn the more interesting and more applicable levels of mathematics
since “mathematics is not reserved for the talented few but is required of all to live and work in
the 21st century” (Mathematical Sciences Education Board, 1993, p. 6). Advances in
technology, including calculators and computers, require quantitative methodology in almost all
fields (Webb & Romberg, 1992).
“The last ten years have brought technological advances that have all but eliminated the
need for paper and pencil computational skill” (Batista, 1994, p. 463). Using calculators as a
tool and not a thinking process is the method offered by NCTM to help alleviate some of this

65
discrepancy in ability with our students. Technology has given math educators the opportunity
to restructure the basic remediation course (Laughbaum, 1992).
NCTM - Calculators
This researcher had previously explored how to incorporate the usage of calculators into a
mathematics assessment used in placement (p. 27), but this section addresses why this needs to
occur. Another of NCTM standards basic concepts relates to the use and availability of
calculators. “Scientific calculators with graphing capabilities will be available to all students at
all time” (National Council o f Teachers of Mathematics, p. 124). Because of the increasing
availability and demand of technology, all students must be proficient with calculators, and
“students who are educated under curriculum guided by the NCTM standards will be dependent
on them” (Harvey, 1989, p. 156).
Since using technology appropriately and effectively is a significant part of learning
mathematics today, we need to include the same component in assessments. Allowing
calculators in mathematics assessments has been suggested by many in the education field
(Harvey, 1992, Senk, 1992; National Council of Teachers of Mathematics, 1989). Not allowing
calculators in assessment will inaccurately measure the student’s ability (Harvey, 1992).
Furthermore, according to Harvey ( 1989), not allowing calculators in the assessment arena
when the student believes that they will be used will negatively bias the results of the test (as
cited in Akst & Hirsch, 1991).
If calculators are being used on an extensive basis in our schools, grades K-12, how will
basic mathematics be taught in grades 9-12?

66
NCTM - Mathematics Remediation
NCTM has addressed this. “Although arithmetic computation will not be a direct object
of study in grades 9-12, number and operation sense, estimation skills, and the ability to judge
the reasonableness of results will be strengthened in the context of applications and problem
solving, including those situations dealing with issues of scientific computation” (p. 124). The
Boyd and Carson (1991) study illustrated how effective this method can be. This researcher
will give more details about this study at the end of this section.
Local Status of Math Education Grades 9-12
In order to evaluate how pervasive the NCTM standards have become in the instruction
of mathematics in grades 9-12, this researcher conducted a telephone survey in February and
March 1995 of fourteen high schools in this county. Twelve math department chairpersons
responded. Four questions were asked regarding calculator usage and basic mathematics
instruction. These questions were the following; (a) What type of remediation class is being
taught at the high school level and are calculators allowed'’ (b) What type or level of calculator
usage is required, suggested or allowed in the other math classes? (c) Are calculators allowed
on all tests? (d) Would you encourage local colleges to consider calculator usage in math
placement tests'’ The following summarizes the replies:
Mathematics Remediation
Only one school out of the twelve had a remediation mathematics class where drill
problems in basic mathematics were taught in whole numbers, fractions, decimals and percents,
without the aide of a calculator. This was a private school that had no staff available to work
with students who perhaps in a public school would be receiving some special assistance. Also,
this was the first year in many years that a course such as this was being offered.

67
Every other school in the county provides a variety o f higher level mathematics course
work for the remediation-level student. This includes algebra, pre-algebra or technical
mathematics, which after two years is supposed to be equivalent to one year of high school
algebra. In all cases except for this one school, remediation students work with calculators. In
one school, remediation-level students work on problems and tests with a computer; in another,
this same level o f student is taught algebra with the outcomes based concept. Each student has
to earn an A, B or C to earn credit. The students are allowed to keep repeating this algebra
class on a semester basis until they earn a high enough grade.
Calculators
General usage. Calculator usage is stressed in all twelve respondent schools. Scientific
calculators are encouraged in all schools by the fourth year o f high school level math, with one
school using that level of calculator by grade nine. Another school is even considering the use
of the scientific calculator with the remediation-level student.
Tests Eleven out of twelve schools allow calculators on all tests. One math chairperson
indicated that although calculators are allowed on most tests, occasionally she gives quizzes to
students with calculator usage prohibited, so as to keep students “thinking.”
College math placement. Ten high school math chairpersons were asked if they felt
colleges should allow calculators in math placement testing. Nine out of ten indicated that they
should. One was quite surprised to find that all colleges did not.
Current Status of College Level Mathematics Placement and Remediation
This researcher’s original intent was to study how the NCTM standards have affected the
design of mathematics placement tests for junior college level. This was not an appropriate
direction because this researcher could find minimal information on this subject.

68
Mathematics remediation without a calculator. “In light of NCTM standards and
various recommendations, it would seem that college developmental mathematics programs
would begin with the study of algebra and each student would have access to a scientific
calculator, but this seems not to be the case” (Boyd & Carson, 1991, p. 9). Today, many of our
colleges are providing mathematics remediation in the same way that our schools did before the
NCTM standards. Albers (1987) summarized a recent survey conducted by the Conference
Board of Mathematical Sciences (as cited in Boyd & Carson, 1991). Of the 479,000 students
enrolled in remediation level math classes at the four year college or university levels, 46,000 or
9.6% were enrolled in basic arithmetic classes. Of the 482,000 students enrolled in remediation
math classes at the junior college level, 142,000 or 29% were enrolled in arithmetic classes.
Though it was stated in the survey that calculators have had more of an impact than computers,
there was no mention of calculator usage in any of the 13 remediation basic math classes taught.
In the state of Michigan, of the 29 junior colleges that responded to the 1990 Michigan
State Board of Education survey, all 29 tested students for basic skills in mathematics. This
survey supplied no documentation regarding the use of calculators in math remediation
instruction, therefore, this researcher cannot make a definite conclusion regarding the type of
teaching methods used in this area. However, this researcher is inclined to believe that
instruction in these classes probably follows the usual paper and pencil, drill method of basic
mathematics review. Laughbaum (1992) stated that the teaching mathematicians at the college
level are still discussing how mathematics should be taught, while high school teachers are
already teaching mathematics in the ways suggested by NCTM standards.
Today, many teachers strongly believe that, until basic skills are mastered, it is impossible
for students to progress to college level mathematics. “Basic skills means arithmetic

69
computation and little else” (Boyd & Carson, 1991, p. 9). Adults who fail placement tests for
basic remediation are examples of people who could not learn mathematics in the traditional
method of drill and practice. Trying to teach them in the same manner again will likely result in
failure. Other methods of instruction must be incorporated into mathematics remediation. As
Hilton (1981) stated “with cheap hand-held calculators available it is manifestly absurd to be
concentrating on those dreary mechanical calculations” (as cited in Boyd & Carson, 1991).
Studies have been conducted to illustrate that bringing calculators into basic math remediation is
beneficial.
Mathematics remediation with a calculator. Boyd and Carson (1991) conducted a
study that illustrates the benefits of incorporating calculators in remediation. They compared
two sections of pre-algebra students, where the experimental group could use a calculator in
tests and in class work while the control group could not. The class content consisted of
approximately 40% arithmetic and 60% algebra, with basically the same material taught to both
groups. Besides the use of the calculator, the primary difference between the two groups was
that the experimental group was taught how and when to use their calculators. Additionally,
their work emphasized the estimation skills and real life problem solving that is supported by the
NCTM standards.
Boyd and Carson (1991) determined that even though the initial mean SAT math and
preliminary class test scores for the control group were higher, the mean final exam scores were
higher for the experimental group Though this difference was not significant at the 0.05 level,
the attitudes of the students at the end of the class merit comment. The control group had
generally more negative comments concerning the class than did the experimental group who
were positive and even excited about the class. They had become the active learners.

70
Testing with calculators. In the testing arena, professional test developers are creating
more and more tests that allow or require calculator usage. As discussed previously, the SAT
incorporated calculator usage in 1994 (Braswell, 1991). In 1991 College Board administered
the Mathematics Level IIC Achievement Test that required the use of a scientific calculator
(Boyd & Carson, 1991). The Iowa Test of Basic Skills, that is used in the K-12 assessment
area, has a school district option for calculator use; and the College Entrance Exam Board will
be requiring the use of a graphing calculator on the AP Calculus exam by 1994 (Schoen, 1993).
However, it is evident in the listing of these new tests that at the placement level for college
mathematics remediation, tests that allow or require the use of a calculator are not an option at
this time.
Placement test reform? In the area of possible placement test revision in light of current
reform, Bomstein stated in a recent article in the New York Times. July 24, 1994, that the
future of the New Jersey College Basic Skills Placement Test (NJCBSPT) was uncertain. A
spokesman for New Jersey Governor Christina Todd Whitman indicated in the article that there
were no immediate plans to eliminate the NJCBSPT, but that educators were expressing
concern that it might be gradually phased out. This researcher was unable to gather any more
information on this subject and this merits further study.
The NJCBSPT is a placement test of some significance. Colleges and universities on the
east coast use this test, and this researcher found articles and studies in the survey of current
literature that utilized this test instrument (Morante, 1987; Sturtz et al., 1993).
Potential Problem?
Most of the local high schools are no longer teaching basic mathematics and are using
calculators, just as had been suggested by the NCTM standards. The junior colleges are still

71
screening for basic math skills and seem to be teaching paper and pencil, rote drill mathematics.
Colleges will be seeing increasing numbers of students who were educated in this new
environment where all are being challenged with higher level and more interesting mathematics
assisted with the aide of a calculator. They will expect the mathematics education they receive
at the college level to continue in the same manner. “Teaching STANDARDS mathematics in
high school and traditional math in college remedial courses could prove disastrous to remedial
math education” (Laughbaum, 1992, p. 8).
Summary
At the onset of this study, this researcher was unaware of the depth and complexity of
current issues regarding the construction and continual administration of a standardized
assessment used in math placement. To exhaust the available research was not possible within
the scope of this paper. This researcher could only present an overview and could not explain
the concepts fully for several factors of this study.
There are four basic conclusions that this researcher can draw from this study They
relate to (1) the construction and use of a locally designed math placement test, (2) the
administration of a professionally designed instrument, (3) the decision of placement policy, and
(4) mathematics education reform.
(1). To construct and administrate a “good” mathematics placement test requires an
extensive amount of staff time, a high degree of skill, a significant amount of statistical
information, and a continuing investment of the same as the instrument is continually evaluated,
updated, analyzed and tested. When Truman (1992) described the activities involved by the
staff at Pembroke State University, this researcher questioned how they could have
accomplished all they did. Very few faculty members have the time to do the required amount
72
of work; additionally, further costs are required because computerized scoring of tests is
required to accumulate the amount and types of data required in the item analysis section..
Repeating all the steps involved in the creation and continual administration of a
mathematics assessment that is used in placement would seem redundant at this point.
However, there is a concern that there are many locally designed placement instruments in use
today that do not adequately satisfy the criteria established in this study. Even though the
project described by Truman (1992) was extensive, requiring a computerized and statistical
base; it still did not cover all of the requirements such as the graphing of item characteristic
curves for each problem or determining appropriate test length by the appropriate mathematical
calculation. Most of the activities described are beyond the capabilities of current faculty.
Decisions of consequence are possibly being made based on tests that have not been properly
designed, analyzed, validated, or assured of some level of reliability.
Another reason for this concern was that Truman’s 1992 study was the only recently
documented study of the creation and validation process for a locally designed math placement
test that this researcher could find. This was certainly outnumbered by the validation studies of
professionally created mathematics placement instruments.
(2). Even if colleges utilize commercially prepared assessments in mathematics placement
with all the benefits each can provide, staff are required to invest a significant amount of time,
energy and skill to ensure that the instrument is valid and will generate reliable information.
Setting cut scores, validating content on an annual basis, and calculating some level of criterion-
related validity are significant projects for faculty that currently have little available time
(3) This researcher explored the various types of placement policy in the section on
mandatory and recommended placement. As has been stated previously, no matter how “good”
73
a placement test might be, no test is error-free. It does not matter how the cut score level was
calculated or where it was set, there will always be students who are inappropriately placed.
A test instrument cannot measure all the factors that can influence a student’s success in
the class, many of which have been discussed in this paper. This instrument cannot completely
and accurately measure the student’s knowledge and ability. To utilize one score from one
instrument to make a decision of consequence is risky since this researcher did not find one
study of a placement test that had a significant positive correlation to success in a math class,
Apparently, the student is the only person who can accurately measure the true likelihood
for success, once he or she has the necessary information to make an informed decision. This
information could consist of a placement test score and a discussion of all the various factors
that will influence his or her success in the class, with this discussion occurring before a
placement decision is made..
(4). The final comment relates to the potential effect of the NCTM standards and
instruction of mathematics remediation at the college level Math education is changing in
grades K-12, and it will have far reaching effects. Colleges need to recognize that their methods
of instruction in mathematics remediation will have to change in some manner as well, or as
Laughbaum (1992) indicated, the consequences could prove disastrous.

CHAPTER THREE
The purpose of this last chapter will be to conduct a qualitative and quantitative
descriptive study of a locally designed mathematics placement test that is presently being
utilized by a midwestem two year community college, hereafter referenced as CC. This
researcher will utilize the information detailed in the second chapter of this study on the
required procedures for construction and administration of a “good” math placement test as a
guide for the study. However, since this test has already been created, the order will be
reversed. In this analysis the overall test will be considered first and then end with the item
analysis and related validation and reliability assessments..
This analysis will consist of the following areas; (a) test background, (b) test policies and
procedures, (c) test structure, (d) assessment and reporting, (e) validation, and (f) a subjective
reliability assessment.
This study needs to be conducted. Two faculty members created most of this current math
placement test over ten years ago; two other faculty members redesigned the trigonometry
section of the test two years ago. Staff have not conducted any other content, criterion-related,
or cut score validation statistically based studies of any significance since the test was originally
administered. This pattern of local development and less systematic review is possibly true of
many junior colleges today as has been shown in Chapter Two
There will be limitations to this study because of the lack of adequate statistical data at
this time. Though research indicates that statistical methods are more appropriate in test
evaluation than subjective opinion, in those areas where statistical data does not exist, this
researcher will have to use opinion based judgments. Although, it is preferable to use expert

75
evaluation that consists of panels of faculty members as opposed to just one person, this is not
possible within the scope of this study.
As will be evident throughout the remainder o f this paper, many current CC staff and
faculty volunteered their time and expertise in assisting with this study. This researcher
conducted interviews of varying length with five out of seven full time math science faculty. At
a minimum, each were asked two questions: (1) What did each believe was the purpose of the
placement test, and (2) how effective did each believe it was. Other staff were interviewed in
more depth to gain an understanding of the history, background, and current procedures.
Besides the telephone survey that was conducted of the area high school math department
chairpersons, this researcher also interviewed a local high school math teacher with many years
teaching experience about his prior involvement and opinions of the test effectiveness.
Questions regarding opinions of effectiveness were asked of a current class of 20 at the college,
with most having no opinion. Two other students who have transferred to other colleges were
also asked of their opinion about test effectiveness.
A representative from the CC data processing department was extremely helpful with the
creation of the two student data bases that were used in this study. The representatives from
the testing department and the full time math instructor who is primarily responsible for making
the majority of the recommendations from the results of the placement test were very beneficial
in providing this researcher with much of the following information.
Test Background
The College
This midwestem junior college (CC) is a public funded institution of higher education that
offers a variety of programs of less than a baccalaureate degree. CC offers Associates in Arts

76
and Associates in Science as primarily transfer programs and offers the Associates in Applied
Sciences degree as basically a career program.
CC has had an average annual enrollment of approximately 6,000, though in the past few
years enrollment has been declining. A local newspaper reported that 4,598 students had
enrolled in credit earning classes in the fall semester of 1994.
The 1995-96 catalog for CC listed 105 full time faculty and 52 areas of emphasis,
including mathematics. The science and mathematics department, which consists of seven full
time faculty, three of which work primarily in mathematics, and a large number o f adjunct
faculty, offers fifteen different mathematics courses, nine of which accept math placement test
recommendations as a prerequisite. The general description for these nine courses follows:
Math Courses
Basic Mathematics and Pre-Algebra in Modules (Basic Math!
Placement for this course is determined by the placement test. This is taught as basically
an independent study with scheduled appointments for teacher assistance. Each section of study
is divided into seven modules: Module A - Pre-Algebra, Module B - Fractions, Module C -
Decimals, Module D - Percentages, Module E - Measurements, Module F - Metrics, and
Module G - Ratios This course is offered in an individualized study lab.
Basic Mathematics and Pre-Algebra in Classroom (Basic Math)
This covers the same material as the previous class, but this is taught in a classroom
setting instead of an independent study The student is recommended for this class if he or she
has done poorly on four or more of the modules in the basic mathematics section of the
placement test.

77
Beginning Algebra
Prerequisite for this class is a staff recommendation from the results of the math
placement test. This is primarily an introductory course in algebra for students who have never
had an algebra class or had no more than one algebra class more than five years ago. Concepts
covered include monomials, polynomials, order of operations, linear inequalities, solutions of
linear equations of two unknowns, systems of liner equations, factoring and exponents.
Intermediate Algebra
Prerequisite for this class is successful completion of Beginning Algebra or a
recommendation from the math placement test This course covers many of the similar areas
introduced in Beginning Algebra, but more in-depth. In addition, new topics include fractional
exponents, radicals, quadratic formula, systems of equations with two or three unknowns, and
function notation.
Mathematics for Elementary Teachers
Prerequisite for this course is successful completion of Intermediate Algebra or a
recommendation from math placement test. This is a general mathematics course that covers
concepts not methods. Students who major in elementary education have to take this course.
College Algebra with Applications
Prerequisite for this class is also successful completion of Intermediate Algebra or a
recommendation from the math placement test. This course stresses applications and graphing
in linear, quadratic, polynomial, rational, exponential and logarithmic models, mathematics of
finance, systems of equations and matrices, linear programming; and some topics in probability.
This is the first of the next five math courses that accepts recommendations from the math
placement test as a pre-requisite and requires a graphing calculator.

78
Algebra with Coordinate Geometry (Advanced Algebra)
Prerequisite for this class is successful completion of Intermediate Algebra or a
recommendation from the math placement test This course if the first of two courses offered
as a preparation for any student who will be taking calculus Topics covered are solving
equations and inequalities graphically and algebraically, functions and graphs; polynomial
functions, rational functions and functions involving radicals; exponential and logarithmic
functions; and conic sections. This course also requires a graphing calculator.
Trigonometric Equations with Coordinate Geometry fTrigonometrvI
The prerequisites for this class are Advanced Algebra or recommendation from math
placement test. This class is the second of two courses offered as a preparation for any student
who will be taking calculus. Topics include trigonometric functions, identities, and equations;
graphs of trigonometric functions; inverse functions; sequences and series, polar coordinates,
parametric equations, DeMoivre’s Theorem, binomial theorem, and systems of equations,
inequalities and matrices; and mathematical induction This course also requires a graphing
calculator.
Probability and Statistics
Prerequisites are Intermediate Algebra or two years of beginning and intermediate algebra
and a recommendation from the math placement test. Students generally take this class if they
are majoring in fields other than mathematics. Topics presented include descriptive statistics,
probability, probability distributions, hypothesis testing, analysis of variance, regression and
non-parametric statistics. Again, the course requires a graphing calculator.

79
Calculus I
Prerequisites for this class are Advanced Algebra and Trigonometry or assignment by
math placement test. Topics presented include limits, function continuity, derivatives, Rolle’s
Theorem, Mean Value Theorem, extrema, rate o f change, anti-derivatives, fundamental theorem
of integral calculus, definite integrals, applications, differentiation and integration. Again, this
course requires a graphing calculator.
The Purpose of the Placement Test
CC utilizes a locally designed mathematics assessment for placement into the nine levels
of previously described math classes. This researcher interviewed five of the seven full-time
faculty in the math science department and asked what they felt was the purpose of the math
placement test. The following summarized their replies.
(1). The test attempts to place student in appropriate class.
(2) It is in place to provide some guidance, feeling it might be better than nothing at all.
(3) The placement test gives a student an idea what might be an appropriate class.
(4) It determines the level of math class where the student will achieve success.
(5) It assesses the student’s readiness and predicts at which level studies should begin.
In all cases, the faculty had the student’s well being in mind. The CC placement test was
not designed to satisfy a necessary quota of students for the remediation center. It is supposed
to give the student the right information to ensure success; but is this really happening"^

80
General Test Information
Placement
Mandatory Testing
CC has a mandatory testing policy in mathematics. Students are required to take the
mathematics placement test if they are (a) a new enrollee taking six or more credits, (b) planning
to take a math class, (c) a transfer or current student with less than 15 accumulated credits, or
(d) current students with a grade point average (GPA) less than 2.0.
MandatoiT versus Recommended Placement
In all the printed information that is made available to the student before testing, it
indicates that CC has a mandatory policy for placement from test scores. In reality, the policy is
basically recommended placement for mathematics. When students receive their test results by
mail within two or three weeks of taking the test, the letter states that the placement results
from the math test are only recommendations. The letter strongly urges the student to follow
the recommendation, but no one typically enforces it As this researcher will show in the
validation section of this study later in this chapter, a high percentage of students follow the
recommendation as if it were mandatory.
It is noteworthy, however, that at least one faculty member believes that the results from
the mathematics placement test are at least modified mandatory. This staff person believes that
the only way a student is allowed to enroll in a class other than at the recommended level is by
receiving special authorization from the math department chairperson.
Recommendation.
( 1 ) Consider stating in all related literature that placement decisions are recommendations.

8 1
Math Anxiety
Many students who have not had a mathematics class in a period of time take this
placement test. Many of these students have a high degree of anxiety about the test and about
mathematics. Research has shown that typically the score that these students receive in a group
standardized test, similar to this math placement test, will not be an accurate measure of their
knowledge and abilities.
CC has tried to counter this pre-test anxiety by providing an informational brochure and
test review handout for students prior to testing. Between these two sources, they give
information about the entire testing procedure, including sample questions from the pre-algebra
and basic mathematics section. The test review handout also provides a detailed listing of the
topics covered on all levels of the placement test. This material is routinely mailed to each
student who contacts the testing center to make an appointment for the test, or the student
picks it up, whichever is most convenient for the student. This information is not given as
routinely to the students in the high schools. The details for distribution to high school students
are not clear This still needs further verification.
Literature has suggested that short pre-test review sessions geared for the adult student
might be appropriate in this area. In this way, each student could be more prepared and more
likely to earn a score that is representative of his or her knowledge level.
Recommendation.
(1) Consider providing pre-test review sessions or tutorial packets geared for the adult
students who have not had a mathematics class in a period of time.

82
Calculators
CC currently does not allow calculator usage in the placement test arena. This researcher
feels that there are three primary reasons for this policy: (1) Ten years ago when the test was
first designed, calculators were not used by every student (2) Each student is assessed for basic
mathematics remediation because some faculty believe that students cannot adequately learn
higher level mathematics without having a firm grasp of the basic skills. (3) The CC basic
mathematics remediation program teaches math foundations without the aide of a calculator.
There will be potentially more problems resulting from this policy in the future. As stated
in the last chapter, research indicates that increasing numbers of students who have been
educated under the National Council of Teachers of Mathematics (NCTM, 1989) Curriculum
and Evaluation Standards for School Mathematics will be dependent on calculators. Many of
these students have used them in tests.
As stated previously in Chapter Two, eleven out of twelve of the local high school
mathematics faculty that had responded to this researcher’s recent telephone survey stated that
calculators are allowed in the completion of all daily work and in all tests. Only one local high
school math teacher indicated that she occasionally gave quizzes in which the students were not
allowed to use calculators. Nine out of ten indicated that they thought CC should consider
calculator usage in the placement arena because to not do so would be unfair to the students.
The tenth respondent would not make a recommendation because she did not know the purpose
of the placement test and felt that “calculators could conflict with purpose.” Two indicated that
they were disappointed in the college for not changing the policy sooner. One was surprised to
find that calculators were not allowed. Since today’s high school students have been using

83
calculators for most of their high school and junior high mathematics careers, they will be at a
significant disadvantage in a testing arena without calculators.
Even though calculators are not allowed in the placement test arena, there is no
information regarding this in any of the current CC test-related literature. This is another
concern since research has indicated that if these calculator-dependent NCTM standards
students are not adequately pre-wamed about a policy such as this, their scores could be
negatively biased and therefore inaccurate.
Also, research indicates that if higher level math classes require more sophisticated
calculators such as the graphing calculator, the placement test should test proficiency in some
manner. The CC placement test does not measure this skill, and there are at least five math
classes that accept mathematics placement scores as a pre-requisite and each requires that
students use graphing calculators.
Calculators are now being used in many mathematics arenas. Driven by the NCTM
standards, many of our local schools are providing all students with the opportunity to learn
more interesting and higher level mathematics, instead of the repetitive drill basic mathematics
remediation from the past. As stated in the second chapter of this research, apparently only one
local high school in the area is still providing basic mathematics instruction without the aide of a
calculator. Students in need of remediation in every other local high school in the county are
learning at least a transition to algebra or a technical mathematics course with the aide of that
tool or in one school, computers.
Contrary to all of this, the CC basic mathematics remediation program still teaches the
foundation mathematics class without the aide o f a calculator. Any further discussion as to the
effectiveness or logic of continuing basic mathematics education in this manner is beyond the

84
scope of this paper; however, faculty need to be aware that mathematics education is changing
and not studying the potential effects of this would be inappropriate.
Recommendations.
(1) Consider placing a statement in all test-related literature that states the policy on
calculator usage. Whether the policy prohibits or allows calculators, either should be
stated.
(2) If calculators are not allowed, consider a pre-test remediation mathematics review
session for the NCTM standards student.
(3) Consider investigating the use of calculators in the remediation area.
(4) Consider exploring calculator usage in the placement process.
Test Structure
Power versus Sneed Test
CC test administrators routinely announce at the onset of each testing session that
students have approximately 90 minutes to complete the math placement test, with more time
allowed if necessary Each student is directed to complete as much of the test as possible, and
only completed problems are corrected. Because the math test is generally given last in
combination with the English and reading placement tests, students have additional time
available to work on the math test if they need it. Test administrators state that they have never
denied any student more time if he or she requests it, but generally, the only students who
request additional time are those with language difficulties.
According to previously cited research, a power test is most appropriate for a placement
test. Since staff allow students more time if necessary, the test satisfies the criteria of being a
power test. There are two further problems that possibly affect the time factor in this test. The

85
test is long and it appears to be very complex with many students failing major portions of the
test. Both of these factors will be studied more in later sections of this chapter, but this
researcher questions if students do not ask for more time because they simply lose their
motivation to continue. Research has stated that the students who struggle in math are the ones
who tire easily. Since a placement test is designed to screen for remediation, length, complexity
and time are factors that need careful study for possible negative impact on the low-achieving
student.
One other factor that affects the time variable in this test occurs during test sessions when
the math test is given in conjunction with the English placement tests in a three hour block of
time. This occurs routinely when the CC testing staff provide the placement test battery in the
local high schools, and it occurs more often than not in the college testing center as well. It is
noteworthy that some faculty believe that the only place that this battery of testing occurs is in
the high schools; but in talking with the test administrators, they indicate that the English and
math placement tests are given on the same day no matter where the tests are administered.
Because the reading test is timed, the English test is given first. In any case, students
work in one test and then immediately follow that with another Many remediation students are
not being positively reinforced by either test Furthermore, as stated previously, this type of
student also tires more quickly in the testing arena than the high ability student. There is little
likelihood that the test instruments in either English or math will evaluate this student
comprehensively.
Supporters of providing all placement tests in one session state that students have to take
the ACT and SAT tests in continuous test sessions, so this should not be a problem. Research
has shown, however, that the ACT and SAT tests do not screen effectively for the remediation
86
student, and they are not efifective placement tests. They are speed tests and as such are used to
identify the students who will be successful in college, not the students who will struggle.
Recommendations.
(1) Consider stating that students will be allowed more time if necessary in all related
test literature.
(2) Consider shortening the test and evaluating the apparent difficulty.
(3) Consider setting up separate tests for the English and the math components.
Length and Organization
The CC math placement test has 112 multiple choice problems and five different sections.
These include (1) Basic Math, (2) Beginning Algebra, (3) Intermediate Algebra, (4) Advanced
Algebra, and (5) Trigonometry. The general topics suggest that the test is divided into content
specific areas as is recommended by research.
The student completes the Basic Math section first, which is the largest with 52 problems.
This section tests six different areas, each of which corresponds directly to the modules that the
basic math course offers The first ten problems cover fractions, the next nine cover decimals,
the next eight cover percents; the next nine cover measurements; the next eight cover the metric
system and conversion, and the final eight cover ratios.
After the student completes the fifty-two problems in the general mathematics area, he or
she then works on the Beginning Algebra, Intermediate Algebra, Advanced Algebra and finally
Trigonometry in that order, with fifteen problems in each. This amounts to another sixty
problems; therefore, this test has a total of 112 problems that cover a wide area and would
appear for many students to be complex. The overall length of the test may be a concern. It
seems longer than what literature suggests.
87
This researcher notes two areas that merit further study in terms of length. The first is the
general mathematics section and the other relates to the module on metrics.
Why is the basic math section so long? Is it impossible to assess basic mathematics
remediation with less than fifty-two problems? This constitutes a one semester course in
mathematics just as do the other corresponding algebra and trigonometry sections of the test,
but the test measures proficiency in those sections with only fifteen problem in each. Asking
every student to complete this lengthy basic math section whether they need it or not it is unfair.
The metrics subtest of the Basic Mathematics section merits further consideration also.
This researcher understands that the health science program requires students who are entering
the field to have proficiency in metrics, so these students do need this assessment. That does
not explain why all students have to complete these eight problems. Each student has to
identify his or her status in this regards at the onset o f the test , therefore, CC staff know who
has to take this subtest. Because this section does not measure a pre-requisite skill or test
subject matter that will be taught in the appropriate level of testing, this section is not content
valid for the student who is not entering the health science field.
Secondly, these eight problems are not easy. There are at least three of the conversion
problems that most people only remember once they review and memorize the specific
conversion These problems are at the end of the basic mathematics section, at a point when
many students are already becoming very discouraged. By forcing every student to complete
this section only tends to discourage them even more, which seems unfair.
Staff need to evaluate the length of this test very carefully. Evidently the number of
problems in each subtest was not determined by formula or a statistical analysis as suggested by
the literature since these formulas require information that CC does not have. This could

88
include cut score levels, a measure of similarity between test items, and an acceptable
percentage of false negatives and false positives. Since the length of the current test is not
predetermined, it needs to be shortened. With a total of 52 problems in a seemingly complex
basic math section and 60 more additional problems in yet higher level areas, it is very unlikely
that the less able student who even has some working knowledge in the higher levels o f math
will want to finish the test.
Recommendations.
(1) Consider using a locator or routing test as suggested in the literature.
(2) Consider shortening the test by decreasing the basic math section.
(3) Consider requiring the metric subtest for only those who are entering the health
science field.
Test Difficulty
Overall Assessment
The student takes the test in the previously stated order: (1) Six modules of Basic
Mathematics, (2) Elementary Algebra, (3) Intermediate Algebra, (4) Advanced Algebra, and (5)
Trigonometry. The order that the student takes this test is important. Each completes the tests
in succession, with each getting progressively more difficult. The intent is that the students who
have the higher achievement levels will be more willing and able to complete the test in its
entirety. In this way, the student only has to complete those sections in which he or she has
some working knowledge. Since longer tests tend to tire the less able students, having the
easier problems early in the test is appropriate.
However, there is some concern about the difficulty level of this test. The General Math
section has a high rate of failure. When students fail one or more of the five basic math subtests

89
of the placement test, they are routinely recommended for basic math remediation. The only
time this does not occur is when the student only fails the metric subtest. In the 1993-94 school
year, a total of 1,102 or 91.4% of 1,206 tested students failed one or more of the basic math
subtests. It was noteworthy that five of these students were also recommended for calculus, 52
for the 100 level algebra courses, and 16 for trigonometry. All of these courses require at least
two to three years of fairly recent high school mathematics and proficiency and use of a
graphing calculator. It seems illogical that students who are suitable for calculus and
trigonometry, need mathematics remediation.
Only 8 .6% (104) of all students tested in the 1993-94 school year passed the basic
mathematics section and did not require remediation. From this particular year of testing, staff
recommended more students for the highest level classes (132), which includes calculus,
trigonometry, and the 100 level advanced algebra classes, than those who could pass the basic
math section (104). This fact by itself certainly merits further study. It is illogical to assume
that more students are capable of higher level math than those who can pass the basics.
When this researcher shared this information with some of the faculty, they suggested that
perhaps these higher level students were failing just the metric module of the test Test
administrators have stated that they do not recommend a non-health science student for
remediation if he or she only fails the metric module. This researcher will evaluate these
statistics in more detail in the test effectiveness assessment section of this chapter.
It is apparent from these statistics that the difficulty and discrimination ability of all test
problems need further study. When a test is too difficult, research states that it is not measuring
anything accurately. Problems that are too difficult, just as problems that are too easy, do not
differentiate between the examinees (Anastasi, 1988).

90
Problem Efficiency
Statistical analysis. As discussed in the second chapter, the statistical analysis that is
required, such as calculating discrimination and difficulty indexes, success rates for distractors,
and statistics on the types of students that choose each distractor, requires a significant amount
of data and a sophisticated method to manipulate that data. In order to accomplish this,
Truman (1992) and staff at Pembroke State University utilized a very detailed method of data
collection and manipulation. He recently sent this researcher copies of the type of information
they have been amassing.
Each year Truman (1992) and staff calculate discrimination and difficulty indexes for each
problem. After their annual content validation study, these new statistics determine each
problem’s new position in the test instrument. As he had stated previously, staff remove any
problem that is not content valid, regardless the level of predictive validity it has. Truman’s staff
then replace this problem with another from their pool of available questions that covers the
new desired area of content.
This level of sophistication is not available at CC at this time. The CC testing department
scores all tests manually, and staff currently have no data collected that could be used to
evaluate the efficiency of test problems.
Truman (1992) did not indicate how they collected their data, but CC will have to use an
efficient method since it tests a significant number o f students each year. In the 1993-94 school
year, the testing center tested 1,206 students in mathematics placement. Evidently hand
counting the necessary statistics would be inappropriate and some form of electronic data
collection such as computerized scoring might be a consideration in order to collect the
appropriate data.

91
This data needs to be collected in order to complete the necessary statistical analysis of all
the test problems. Because of the high failure rate of this test instrument, it is important to
determine each problem’s success rate. Staff can gain little information from a test with so
many low scores.
Recommendations.
(1) Consider computerized scoring as one method for collecting the necessary data.
(2) Consider calculating difficulty and discrimination indexes for each test problem.
Subjective item difllcultv analysis. Since the more appropriate and accurate difficulty
and discrimination indexes cannot be calculated, this researcher completed a subjective analysis
of each test problem’s difficulty level, recorded the results in Appendix B, and summarized this
in Appendix C. These difficulty measures are crude, but it is apparent from these estimates that
most of the test problems do not seem to be arranged from easy-to-hard as is appropriate in an
achievement test Additionally, some of the test items may be written in a manner that is
unfamiliar for many students, and as research states, this will result in an inaccurate
measurement
This researcher found that, within each of the six modules in the Basic Mathematics
section, problems followed the easy-to-hard distribution more than the other test sections since
only 9 out 52 problems need further evaluation for difficulty alignment These are (a) Problems
#8 and #9 in Fractions; (b) Problem #14 in Decimals; (c) Problems #24 and #27 in Percentages;
(d) Problems #34, #35, and #36 in Measurements; and (e) Problem #41 in Metrics. (Refer to
Appendix C.)
The individual modules in the General Math section do not appear to be organized
appropriately according to increasing difficulty. Three of these modules seem to be out of

92
order: (a) The ratio and measurement modules seem to be the easiest of all, but they are located
near the end of the set. (b) The fraction module is one of the more difficult ones, and it is first
in the set. Having a difficult subtest first in a long and apparently complex test seem unfair.
This researcher has discussed the metric module previously, but it has some of the most
difficult problems in the entire test. These include Problems #42, #43, and #44. Locating it in
the basic math section of the test seems inappropriate. (Refer to page 88 and Appendix B.)
This researcher identified several other basic math section problems that merit further
study in terms of their individual levels of difficulty and possible redundancy. These include (a)
Problem #8 in Fractions; (b) Problems #23 and #24 in Percentages, and (c) Problem #36 in
Metrics. There are possible redundancy issues to explore in Problems #25 and #26. (Refer to
Appendix B for more details.)
This researcher noted five problems in the Beginning Algebra section of the test that need
further study for difficulty alignment. These are Problems #4, #8, #11, #12, and #15. (Refer to
Appendix C). In terms of exceedingly difficulty or awkward problems in this section, this
researcher noted only Problem #13. Long division with polynomials is no longer taught in
Intermediate Algebra. Though the problem may be content valid for Beginning Algebra, staff
do not feel that it is important enough to reinforce the concept in the Intermediate Algebra
course Evidently, there are other problems of more importance that could be incorporated into
this test instrument. Since many students find the concept difficult and it is not necessary at the
intermediate algebra level, it should not be stressed in beginning algebra
The problems in the Intermediate Algebra, Advanced Algebra and Trigonometry sections
of the test are randomly distributed according to difficulty. (Refer to Appendix C.) This
researcher also noted one test items that seemed more difficult than necessary. This was

93
Problems #29. (Refer to Appendix B.) Problem #46 is not too difficult but having one of the
most difficult problems in the trigonometry section first in that section seems unnecessary.
Recommendations.
(1) Once difficulty and discrimination indexes have been calculated, consider re-alignment
of test problems and the basic math subtests from easy-to-hard.
(2) Consider moving the metric module to another area of the test.
(3) Consider removing or replacing problems that are identified as being too difficult.
Distractors
Evaluation of distractors is a consideration in the determination of problem efficiency.
No one would want distractors to trick the student, nor would anyone want distractors that
gave the answer away. In many cases, test developers spend a great deal of time evaluating
how effective each distract or is for every problem in the test. Truman (1992) tracked how often
students chose distractors, with the intent that if one was not chosen in 100 cases, that it be
replaced (Katz, 1965, as cited in Truman) Truman also created distractors from the actual
erroneous answers students had given to test problems that were piloted as open ended
questions in the appropriate classes.
There have been no statistical studies conducted on the distractors of each test item in the
CC math placement test. It is unknown how often students chose each distract or It is
unknown what types of students are choosing which distractors. There is no information
available to determine which distractors, if any, staff should replace.
Since so many students are not performing adequately on the test instrument, trying to
create distractors that would more accurately represent possible errors seems to be rather

94
pointless. However, there were some more subjective assessments that research has shown that
can improve the quality of the distractors. This researcher can address the following;
(a) Number — Each problem in the Basic Math section has three distractors, while each
problem in the higher level mathematics sections has five distractors. Research indicates four or
five is better than one or two.
(b) High error probability — Trying to increase the error rate when so many students are
doing so poorly seems futile, but as this researcher evaluated each problem, the distractors were
also examined. In most cases, some of the more likely errors were already distractors.
(c) Grammaticallv parallel — Since all answers are either one word or one number
answers, this criterion does not seem to be a factor.
(d) Location — Each set of distractors is appropriately located at the end of the problem.
(e) Repetition of Keywords and (f) Use of Never or Ahvavs — Again, neither of these
had any particular importance with primarily numerical answers.
This researcher noted two problems that possibly were more difficult because of the way
the answer was written in each. In both cases, these were not officially distractors. These were
the correct answers for the problems.
In Problem #33, the correct answer is not stated in the appropriate form for a simplified
radical expression. In Intermediate Algebra students are taught to remove any radical from the
denominator. The correct answer for this problem has a radical in the denominator, which is
inappropriate The student might go further than necessary to obtain the correct answer only to
find that his or her correct answer is not listed as an option.

95
In Problem #41, the correct answer is a parabola that is symmetric about the x-axis but it
should have a vertex of (3,0). The correct answer is a similar type of parabola, but it shows
what would appear to be a vertex at the origin.
Recommendations.
(1) Consider a statistically based method of determining distractor effectiveness.
(2) Consider a method to track the number and type of students who choose each
(3) Ensure that each problem’s correct answer is written in a clear and accurate manner.
Assessment and Reporting
Cut Scores
In the current test, staff have established specific cut scores for the basic math subtests
with more subjective interpretations occurring at the other higher levels. The current
information is as follows for each of the courses referenced with the placement test.
Basic Mathematics and Pre-Algebra in Modules
Students are recommended for one up to seven different modules in the Basic
Mathematics and Pre-Algebra course depending on performance on the math placement test.
The individual modules in this class include Mod A (Pre-Algebra), Mod B (Fractions), Mod C
(Decimals), Mod D (Percents), Mod E (Measurements), Mod F (Metrics), and Mod G (Ratios).
There are six subtests in the basic math portion of the placement test that relate to six of
these modules in this course. These relate directly to Mod B, Mod C, Mod D, Mod E, and
Mod F as stated above. For each of these six subtests in the Basic Mathematics test section, a
student can miss no more than two in each or he or she fails the subtest. Staff determine if a
student passes or fails the Module A (Pre-Algebra) differently. Students who answer five or
fewer problems correctly out of fifteen in the Beginning Algebra section of the math placement

96
test are recommended to enroll in Module A as well. This translates to the following cut score
levels for Basic Math and Pre-Algebra:
Basic Math Modules Cut Score Basic Math Subtest StatusA Pre-Algebra > = 10 Beg. Alg. PassedB Fractions > = 8 Math: Fractions PassedC Decimals > = 7 Math: Decimals PassedD Percents > = 6 Math: Percents PassedE Measurement > = 7 Math: Measurement PassedF Metric > = 6 Math: Metric PassedG Ratios > = 6 Math: Ratios Passed
A student may receive a recommendation to work in one or more of these modules
according to his or her score and field of interest. The declared field o f interest only affects
those students who are enrolled in the health science program. They have to pass the metric
subtest. If a student who is not in this program only fails the subtest for metrics, he or she does
not have to take this module. If he or she fails other Basic Mathematics subtests, staff will
recommend that the student take all modules that he or she has failed, including the metric
module
Basic Math and Pre-Algebra in Class
If a student misses four or more questions in four or more of the designated subtests
above, staff will recommend that the student enroll in this course. As stated previously this is
the lecture and classroom version of Basic Math and Pre-Algebra taught in modules
Higher Level Course Recommendations
There is primarily one faculty member who evaluates every student’s math test and makes
course recommendations. This full time math instructor works full time with the remediation
students who enroll in Basic Math and Pre-Algebra.
97
Making these recommendations is not easy. As stated previously, each student may
receive a recommendation for a higher level course in combination with basic math remediation
if he or she has failed one or more of the appropriate basic math subtests but indicates some
level of proficiency with the higher level sections of the test. For higher level course
considerations, this faculty member has to review the results from each student’s placement test
and consider the number of problems attempted and number correct. CC has no defined cut
score to determine proficiency on the Beginning Algebra, Intermediate Algebra, Advanced
Algebra or Trigonometry tests, but the following is a guide on the test results that are reviewed:
Primary Tests of Consideration Possible Recommended CourseDifficulties with Beginning Algebra Test Beginning. AlgebraDifficulties with Intermediate Algebra Test Proficiency with Beginning Algebra Test
Intermediate Algebra
Proficiency with Beg. & Int. Algebra Test Math for Elem. Teachers, Prob. & Stats. Algebra with Applications
Difficulties with Advanced Algebra Test Proficiency with Beg. & Int. Algebra Tests
Advanced Algebra
Difficulties with Trigonometry Test Proficiency with Beg , Int., & Adv. Algebra Tests
Trigonometry
Proficiency in Beg , Int., Adv. Alg & Trig Tests Calculus
This faculty member also considers the student’s self reported math history when making
this course recommendation. This includes the number of years since student has had a math
class, the grades that he or she received in these classes, the number and levels of math classes
the student has had, and the stated career plans. These are all evaluated in order to determine
the course recommendation. This staff person utilizes a multiple criterion evaluation to
determine student placement, without any defined cut score levels for determination of
proficiency. This instructor typically asks other math faculty for assistance when unsure of the

98
proper recommendation, but there is no set plan followed when determining these
recommendations.
Since no set cut scores are used for any of the test sections above basic math, this
instructor has to make subjective evaluations. Since pre-determined and validated
interpretation tables are not used, levels of inteijudge and intrajudge reliability will be low
Research indicates when subjective evaluation has occurred, the issue of scorer reliability
becomes a significant consideration.
Recommendations.
(1) Consider conducting a statistically based validation study to establish and validate cut
score levels for all tests and subtests
(2) Consider a validation of the multiple factor recommendation process.
(3) Once process is validated, consider utilizing a standardized table that follows
established multiple level criteria such as the one described in Chapter 2, page 45.
(4) Consider involving the student into more of the decision process since research states
that one test cannot be a perfect measure of all of the student’s current knowledge.
Data Type
Students who complete the CC math placement test do not receive a test score expressed
as a measure of a specified criterion. They do not receive a score that compares their
performance to others or a specified norm group They receive a recommendation to take one
or more math classes. Staff do not routinely inform students of their scores on any of the
subtests, even though student records do indicate whether students have passed or failed the
basic math subtests.

99
Therefore, data is not recorded in ratio or ordinal form as is most appropriate for
educational measurements; data is reported in the nominal data form, as pass or fail status or
recommended or not recommended. This only allows for the calculation of Chi Square test
coefficients. This in turn only allows for an assessment if the frequency is at the expected level
or not.
Test evaluation needs to be statistically based. Determination of cut score levels and
criterion-related validity studies require a statistical analysis with data reported in ratio or in the
very least ordinal data form. Relationship studies between a test score level and some other
criteria of measure require that the test score be individualized such as with a ratio or ordinal
data. When data is in the nominal data form, measures of relationship between individual test
scores and some other criteria are not possible.
Recommendations.
( 1 ) Consider reporting and recording student scores for each major test section and the
basic math subtests.
(2) Consider creating a student profile sheet that reports each student’s scores and
subscores compared to the stated cut score in each
Validation
Face
This form of validation is a subjective Judgment on test effectiveness. It answers the
question, does the test appear to measure what it is supposed to measure'’ This researcher
asked this question of students who had previously taken this test and found mixed reactions.
Three of the higher achieving students felt that the test was a good review and generally felt that

100
they had been placed in the appropriate class. One student mentioned that she even enjoyed
taking the basic mathematics section because it reinforced that she had learned something.
The students who typically struggle in mathematics and find testing difficult felt that the
test did not measure their knowledge level well. One student commented that even though staff
had recommended that she take the mathematics remediation classes, she refused to take them.
She felt the test was inaccurate and unimportant. Two other students indicated that they too
had failed one or more of the basic mathematics subtests, but had completed the recommended
basic math modules. One thought that the modules were beneficial because she planned on
teaching elementary mathematics. The other thought they were a waste of time. She felt that
all she really needed was a brief review session, and then she would have remembered those
basic math concepts.
This researcher also asked this question of a local high school math instructor with many
years of teaching experience in higher level math. This teacher was very unhappy about the
results of this test. He felt that the test did not measure students math knowledge effectively.
His high school has up to five students each year who are ready to take calculus classes in their
senior year They are typically the best students that this school can offer The high school
pays the tuition for these students to enroll in what should be in most cases a calculus class.
Each of these students has completed the advanced mathematics or pre-calculus class and has
had the equivalent of four years high school mathematics. Yet, when these students are tested
with the CC placement test, generally only half of them each year test high enough to be
recommended for calculus. The other half typically do not question their recommendations.
They enroll in the Trigonometric Equations and Coordinate Geometry as directed and generally
find the class unchallenging. This instructor added that perhaps CC should request
101
recommendations from local high school instructors along with the results of this test, since one
test score can never be a true measure.
Faculty have a variety of opinions about the effectiveness of this placement system.
Some feel that it is reasonably effective, with only a few students questioning that they have
been placed too low. Other faculty feel that the test recommendations very rarely place a
student too high, but can place students too low. They each can document cases where
students have questioned a placement as being too low; but then after trying the higher level
class, the students have transferred back to the original class because the other was too difficult
for them. They also can document cases where students should have been placed in the higher
class, but the student really did not want to transfer up because he or she wanted the “easy A”
or needed the review.
Other faculty feel that the test is just not effective and question what it is really measuring,
having seen many examples of misplaced students in their classes. One faculty member stated
that he knew that he could not validate his statement, but he felt that it was completely invalid.
In many beginning and intermediate algebra level classes, faculty give another screening
test on the first day of class, trying to help students decide if they are in the correct class In
some cases, this results in additional transfers during the first few weeks of class. This certainly
makes a statement about the level of confidence faculty have in the CC math placement test
when they have to re-test students in their own classrooms in order to ensure that students will
be placed more appropriately.
Evidently, there are some concerns about the effectiveness of this test instrument.

102
Content
Content validity has two concepts that need evaluation. One is item validity or content
alignment and the other is sampling validity', with sampling validity the most difficult to
accomplish.
Item Validity
This researcher has studied each problem in the CC test instrument and determined what
math process and specific knowledge areas were required to solve each. (Refer to Appendix
B.) Once this information was gathered for the Beginning Algebra, Intermediate Algebra,
Advanced Algebra and Trigonometry sections of the test, then this researcher completed an
item content alignment. This was completed with current syllabi for the following courses.
Beginning Algebra, Intermediate Algebra, Mathematics for Elementary Teachers, College
Algebra with Applications, Algebra with Coordinate Geometry, and Trigonometric Equations
with Coordinate Geometry. This researcher has summarized this information in Appendix D.
This researcher did not perform the item content validity alignment in this way with the
General Mathematics portion of the test because the course descriptions for the General
Mathematics and Pre-Algebra course is not written in this manner. The study on the General
Mathematics portion of the test will be at the end of this section
This item analysis and content alignment is just a subjective analysis conducted by one
person This is significantly less than the required content alignment portion of the study.
Research states that in a content analysis study of any test of consequence, such as this
placement test, expert opinion, consisting of multiple numbers of faculty, should annually review
and compare the content of the test to course content. As stated previously, most of this test

103
was created over ten years ago. As is true with most locally designed test instruments, staff
have not significantly analyzed or revised this test for content since it was written.
This researcher found that the item content of each problem in the Beginning Algebra test
section was adequately aligned with subject matter taught in the Beginning Algebra course and
generally reinforced by instruction in Intermediate Algebra, which would seem appropriate since
it is the subsequent course. (Refer to Appendix D). Only Problem #13 introduced a concept
that Intermediate Algebra did not address. (Refer to Appendix B for details on this )
It was also apparent that the item content alignment of each problem in the Intermediate
Algebra section of the test was adequate with the Intermediate Algebra course. (Refer to
Appendix D.) The assessed skills seemed to be appropriate in terms of assessing pre-requisite
skill for the higher math courses as well, such as Probability and Statistics and College Algebra
with Applications, and Algebra with Coordinate Geometry.
This researcher found that the Advanced Algebra section problems were aligned more
closely with Algebra with Coordinate Geometry than with College Algebra with Applications.
There was little or no item content alignment with Mathematics for Elementary Teachers and
Probability and Statistics (Refer to Appendix D.) This seemed to follow placement test policy
(Refer to page 97).
The item content alignment for the Trigonometry test section was adequate as well. The
content addressed in each test item was either stated specifically in the syllabus for
Trigonometric Equations with Coordinate Geometry or the problem measured a necessary
prerequisite skill. (Refer to Appendix D.)
Though Truman (1992) stated that placement test questions should be designed more like
an early test in the semester than the final exam, many of the test items addressed subject matter

104
taught throughout the semester. In the two levels of algebra tests. Intermediate and Advanced,
the prerequisite class presented over half of the content areas addressed in each test section.
Nine of the fifteen items on the Intermediate Algebra test are presented in the Beginning
Algebra class, which is the pre-requisite for the Intermediate Algebra course. Eight of the
fifteen items on the Advanced Algebra test are introduced or reinforced in the Intermediate
Algebra course, which is the pre-requisite for College Algebra with Coordinate Geometry.
These are identified as Review in Appendix D.
Where the student learns the material that is tested in the Beginning Algebra and
Trigonometry test sections differs extensively from tins. In the Beginning Algebra section, at
least 13 out of 15 of the problems would cover material that would be new to the student unless
he or she had other previous algebra classes.
CC does provide this prior training in the Pre-Algebra module or in the Basic
Mathematics and Pre-Algebra class. In 1993-94 a total of 65 students received instruction in
pre-algebra Twenty-eight enrolled specifically in the module while 37 received pre-algebra
instruction in the complete Basic Mathematics and Pre-Algebra course provided in the
classroom setting
None of the problems in the Trigonometry test section are covered by the prerequisite
class. Algebra with Coordinate Geometry Because of the comments regarding possible
excessive difficulty of the test questions, this researcher studied the type of material typically
taught in a second year high school algebra course and found similar concepts (Hall &
Fabricant, 1991), therefore, the content should not be too complicated for even a second year
high school algebra student. Why so many students are unable to pass this portion of the test
merits further study.

105
For students who are learning their mathematics entirely through the CC system, all of
these concepts have to be taught in the beginning algebra or trigonometry class. These new
concept areas are noted as New in Appendix D.
It is apparent from this analysis that each test item in the Beginning Algebra, Intermediate
Algebra, Advanced Algebra, and Trigonometry section of the CC math placement test addresses
subject matter that is presently being taught in the related course. It therefore satisfies the
definition for having item validity (Millman & Greene, 1988; Truman, 1992).
The Basic Mathematics and Pre-Algebra classes provide math remediation in seven
specific modules that correlate directly with the General Mathematics portion of the test. In the
module version of this class, students work independently in just the module that they have
failed. They test out of the module when they earn a passing score on a computer generated
test These tests correspond very closely to the types of test questions found in the CC
placement test. In the classroom version of the same, the same information is taught and tested,
but the material for all the modules is covered. In that respect, again, the test does have content
alignment with the Basic Math and Pre-Algebra course.
This researcher has previously discussed the metric subtest in the Basic Math section of
the CC placement test. If the definition of content validity is strictly applied, such that the test
problem must measure a prerequisite skill or be subject matter that is taught in the related class,
then the metric module is only content valid for those students who are entering the health
sciences field. It is not content valid for anyone else.
Sampling Validity
In the section, this researcher will consider sampling validity by comparing the concepts
currently addressed by the test and comparing that to stated curriculum. Because this

106
researcher has only taught Intermediate Algebra, she feels only qualified to assess sampling
validity within the scope of that class; however, there is one primary component that is missing
throughout most o f the test instrument Because much of the test emphasizes immediate quick
answer as is usually true with multiple choice problems, there is little or no higher level thought
process required to solve most of the problems. As stated in the literature, mathematics should
assess more than just computational skill.
There are several elementary level word problems and diagrams to interpret in the basic
math section, but this is not found throughout the balance of the test. The Beginning Algebra
and the Intermediate Algebra sections only have computation problems. The Advanced Algebra
section has 11 computational problems and 4 graphs to interpret. The Trigonometry section has
12 computational problems and 3 graphs to interpret. Even though the directions given to each
math faculty prior to the onset of each math class state that 20% of the total points in the course
must be from word problems, the test addresses very few and none at the higher level.
In terms of sampling content validity for Intermediate Algebra, this researcher has made
the following assessment:
Chap. Heading ProblemsOne Basic Concepts #20Two Linear Equations & Inequalities #23Three Graphs & Functions #18, #27, #28, #30Four Systems of Linear Equations & Inequalities #25Five Polynomials #16, #26Six Factoring #17, #19, #22Seven Rational Expressions & EquationsEight Roots, Radicals & Complex Numbers #21, #21, #24,Nine Quadratic Functions & Algebra of FunctionsEleven Exponential and Logarithmic Functions
As is evident from this table, problems are primarily concentrated in Chapters 3, 6, and 8.
Though these chapters cover important concepts, the test is not adequately sampling the entire

107
content of the class. There are numerous concepts that have not been addressed in this test.
The lack of word problems is certainly one of the primary areas. Setting up one and two
variable equations from word problems involving more general interpretation, mixture, rate, or
work areas are not addressed in this instrument and are used throughout the course. More
specific information about graphing certain polynomials and lines, performing operations with
polynomials, or solving a quadratic equation using the quadratic formula are only a few of the
important items that are not addressed with this test.
It is very difficult to adequately assess course material in just fifteen problems. If this test
section had as many problems as are found in the basic mathematics section, it would more
likely be an adequate sampling. If router or locator tests were used, more problems could be
used for each sections of the test since students would not have to complete all the problems in
every test.
In this researcher’s opinion, there is inadequate content sampling from the Intermediate
Algebra course and more than likely for the other math courses as well. Content sampling was
not addressed with the Basic Mathematics and Pre-Algebra course, but more than likely this will
have content sampling by virtue of the number of problems and concepts covered.
Recommendations
(1) Consider a complete faculty based content validity study. Though item validity may
not be a problem in this test, sampling validity may be.
(2) Consider obtaining more specific input from local high school mathematics faculty.
(3) Consider further evaluation of the appropriateness of the metric module.
(4) Consider using a router or locator test.
(4) Consider addition of problems to address higher order thinking skills.

108
Item Bias
To assess item bias, research states that a panel of faculty and non-expert representatives
from the appropriate subgroups is necessary to determine if any test items are offensive,
stereotype, or use words that are unfamiliar to some of the members because of their group.
Evidently this test instrument has not been assessed for bias, and it cannot be done accurately by
one person, such as this researcher.
One test problem was found that could be gender biased. Problem #36 in the General
Mathematics test section may be easier for males than for females. This problem asked for the
conversion between quarts and fluid ounces. To learn more about its potential gender bias, the
question was posed to three males and three females. Two of the males immediately gave the
correct answer, while the third had to derive it indirectly. Two females including the researcher
had to derive the answer indirectly. The third female did not know. It was interesting to note
that both males, who gave the correct answer quickly, knew the information from mixing oil and
gasoline for small engines. The two females calculated the answer from the relationship with
cups and fluid ounces and then applying the conversion chain, which was more difficult.
Recommendation.
(1) Consider evaluating the test for possible bias All tests should consist of unbiased
items.
Test Effectiveness Measure
Very few students ever receive a high enough score to recommend placement into any of
the higher level math courses. During the 1993-94 school year, staff recommended only 132
(10.4%) of the tested students for advanced algebra, trigonometry and calculus. Some measure
of test effectiveness is a necessity, but a criterion related validation study is not possible because

109
the data is only presently reported in nominal data form. Since cut scores are not used
throughout and individual scores on tests and subtests are not recorded, the only placement test
data available relates to placement test recommendations and the students’ pass or fail status on
each of the basic math subtests.
This researcher used both of these in evaluating two primary concerns. One portion of
the study evaluated the relative difficulty of the basic math subtests by further examining
individual student performance on each. The second portion of the study evaluated the
recommendation process by comparing the performance of those who followed placement
recommendations to those who did not.
Student demographics. As stated previously, this researcher restricted the study to
student data from the 1993-94 school year and utilized two separate data bases of student
information The first included some limited student demographics, math classes completed,
grades earned for each, and course recommendations from the placement test for 1,206 new
admissions for 1993-94. The second data base gave more specific placement test information
for 505 students who enrolled in math classes during the 1993-94 school year. This information
included which basic math modules the student passed and failed, the first math course(s) taken,
and the corresponding grade in each.
Statistics from the first data base allowed for the generation of some interesting
information about the students who were tested in 1993-94. This first table illustrates the age
breakdown for these students:

110
1993-94 STUDENT ADMISSIONS AGE DISTRIBUTION
AGES#
TESTED# TAKING
MATH CLASSES16-20 881 561 63.7%21 -25 165 71 43.0%2 6 -3 0 41 20 48.8%31 -35 48 18 37.5%3 6 -4 0 30 13 43.3%41 -45 22 8 36.4%4 6 -5 0 8 4 50.0%50- 11 4 36.4%TOTALS 1206 699 58.0%
As would be anticipated, the 16 through 20 age group had the greatest number and
highest percentage of students who enrolled and immediately began taking math classes. The
largest sub-group within this category was the 19 year old age group with 401 out of 557
students enrolled or 72.0% taking math classes during their first year in college. It was
noteworthy that even though a total of 1206 students were tested, only 699 (58.0%) enrolled in
a subsequent math class. Further study might suggest why this low percentage of enrollment is
occurring
Additionally, 119 (9.9%) of 1206 were over 30 years of age. It is likely that these are the
students who have not had a math class in a long time. Only 47 out of the 119 (39.5%) enrolled
in a math class within the year. Special care needs to continue with the methods used to place
these students in the appropriate math class.
From admissions data, this researcher assimilated a summary of recommendations
generated by the placement process for the 1206 tested students.

I l l
PLACEMENT TESTHIGHEST LEVEL RECOMMENDED 1993-94 ADMISSIONS
COURSE NUMBERBASIC MATH 410 34.0%BEGINNING ALGEBRA 501 41.5%INTERMEDIATE ALGEBRA 163 13.5%ADVANCED ALGEBRA 77 6.4%TRIGONOMETRY 34 2.8%CALCULUS 21 1.7%
TOTAL 1206
Basic math difficulty assessment. As this researcher has previously stated, 91.4% of
the students tested in 1993-94 school year failed one or more subtests of the basic math section
of the CC placement test. Staff also recommended 73 of these same students for the advanced
levels of algebra, trigonometry and calculus. (This is illustrated in the next table.) This suggests
that the general math subtests may be too difficult, but CC faculty has theorized that most of
these students had probably failed just the metric subtest. This researcher evaluated this theory
more specifically
Failing the metric subtest only results in a recommendation for that specific basic math
module if the student is entering the health science field or he or she has failed other modules
besides the metric module When students fail more than one subtest, they receive
recommendations for each. Students are never told specifically when they fail any of the
subtests They are just notified that they should take the related module.
The permanent student records do not reflect this information in the same way. If a
student fails one or more general math subtest, the CC data processing department has coded
the student’s record as a recommendation for basic math remediation. In many cases, students

112
were reflected as receiving a recommendation for general math and a higher level math class.
This researcher has summarized these inclusive recommendations as follows:
1993-94 PLACEMENT TEST RECOMMENDATIONSCOURSE NUMBERBASIC MATH ONLY 410 34.0%MATH & BEGINNING ALGEBRA 472 39.1%MATH & INTERMEDIATE ALGEBRA 147 12.2%MATH & ADVANCED ALGEBRA 52 4.3%MATH & TRIGONOMETRY 16 1.3%MATH & CALCULUS 5 0.4%BEGINNING ALGEBRA ONLY 29 2.4%INTERMEDIATE ALGEBRA ONLY 16 1.3%ADVANCED ALGEBRA ONLY 25 2.1%TRIGONOMETRY ONLY 18 1.5%CALCULUS ONLY 16 1.3%
TOTAL 1206
These numbers include those students who may have failed just the metric subtest. Since
this information suggests that 73 higher level algebra and trigonometry students need basic math
remediation, it was important to determine which subtests these students had failed. Once
success and failure information for each basic math subtest on all students was collected, this
was then categorized according to the course recommendation level. The first table summarizes
the total number of students who passed and failed each subtest.
PASS AND FAIL STATUS OF ALL STUDENTS TESTED 1993-94SUBTEST #PASS #FAIL TOTALFRACTIONS 493 40.8% 714 59.2% 1207DECIMALS 789 65.4% 418 34.6% 1207PERCENTAGES 571 47.3% 636 52.7% 1207MEASUREMENTS 380 31.5% 827 68.5% 1207METRICS 176 14.6% 1031 85.4% 1207RATIOS 668 55.4% 538 44.6% 1206

113
Evidently, the highest percentage of students failed the metric subtest (85.4%); this is
followed by the measurement section (68.5%) and fractions (59.2%). This researcher’s original
theoiy that perhaps the subtests in the basic math section were not arranged from easy to hard is
further illustrated by this pattern. The fraction subtest appears first in the general math section
of the CC math placement test, and it seems to be one of the more difficult sections.
It is noteworthy that this researcher’s original hypothesis that the measurement subtest
was one of the easier sections certainly is negated by these results. This further supports why
subjective evaluation is not always effective.
In order to summarize student performance on the basic math subtests in comparison to
their overall placement recommendation, this researcher had to utilize the smaller data base of
505 students who enrolled in a math class during the 1993-94 school year. These were divided
into four types of students: (a) enrollment in just one class higher than basic math [321], (b)
enrollment in one or more of the general mathematics modules [120], (c) enrollment in one or
more of the math modules in conjunction with an algebra or trigonometry class [27], and (d)
enrollment in general mathematics taught in the classroom [37] The totals may differ from the
larger data base but the patterns are basically the same.
Pass and Failure Rate for Basic Math Subtests from 1993-94 EnrollmentsSuggested Math Class
Fractions Pass Fail
Decimals Pass Fail
Percents Pass Fail
Measures Pass Fail
Metrics Pass Fail
Ratios Pass Fail
Basic Math 5 127 34 98 8 124 10 122 0 132 23 111Beg Alg 96 111 174 33 117 90 71 136 26 181 148 59Im Alg 64 30 90 4 69 25 50 44 17 77 85 6Adv' Alg 39 1 40 0 34 6 30 10 22 18 40 0Trig 15 2 17 0 16 1 15 2 12 5 17 0Calculus 15 0 15 0 15 0 14 1 12 3 15 0
Totals: 234 271 370 135 259 246 190 315 89 416 328 176Percents 46.3 53.7 73.5 26.5 51.3 48.7 37.6 62.4 17.6 82.4 65.1 34.9

114
Evidently, the higher level students primarily failed the metric subtest [26], but they also
failed three of the others. These included the following subtests; (a) measurements [13], (b)
percentages [7], and (c) fractions [3] Again, this information suggests that the apparent
difficulty of these test sections merit further study.
Even though the exact number of students who were recommended for one or more
modules of basic math remediation is unknown, this researcher was able to determine the
number of new admissions in 1993-94 who actually enrolled in one or more of the basic math
modules and summarized this information in the following table:
Completion General Mathematics Modules for 1993-94 EnrollmentsGen Math Module # Passed % # Failed % TotalPre-Algebra 9 32.1 19 67.9 28Fractions 118 67.4 57 32.6 175Decimals 73 62.9 33 37.1 106Percents 77 51.3 73 48.7 150Measurement 45 45.9 53 54.1 98Metric 40 43.0 53 57.0 93Ratio 54 52.4 49 47.6 103
Total Modules: 416 55.2 337 44.8 753
This researcher can make one observation from this summary. More students (118), who
had failed the fraction subtest and were recommended to take the fraction module, follow
through on that recommendation than any of the other subtests. This suggests again that the
fraction subtest be evaluated for difficulty
Evaluation of recommendation process This researcher calculated and compared the
success rates for the students who followed recommendations to those who did not This
resulted in three different categories of students for each level of course: (1) students who
follow recommendations, (2) those who are recommended for a lower class, but enroll in a

115
higher level class; and (3) the students who are recommended for a higher class, but enroll in a
lower level class. For simplicity, this study defined a successful student as one who received an
A, B or C for the final grade of the class and an unsuccessful student as one who received a D,
E or had withdrawn from the class.
There are at least four limitations to this definition. (1) Though many students have a
withdraw passing (WP), withdraw failing (WF) or an incomplete (I) as their class grade, further
evaluation into this issue and its effects on the eventual statistics would be beneficial but were
beyond the scope of this paper. (2) Even though research has stated that using a student’s final
grade in a class is not the most appropriate criterion to measure placement test effectiveness, it
was the only criterion available at this time. There are multiple factors that can affect a
student’s performance in a class that a test instrument cannot measure. (3) Since 127 students
enrolled in one or more of the math modules concurrently, to count each student only once and
evaluate performance in the basic math course, the student had to earn an A, B, or C for all the
modules in order to be classified as a success. This interpretation may possibly cause the
number of failures in that category to be overstated. (4) Since 27 students enrolled in one or
more of the basic math modules and an algebra or trigonometry class, in order to only count
each of these students once, the grade the student received in the algebra or trigonometry class
determined whether the student would be counted as a success at that course level Grades
received on the basic math modules did not affect this determination.
This researcher has summarized the comparison of relative success of those students who
follow recommendations to those who do not in the following table:

116
1993-94 1EnrollmentsjBasic Math
Recommended Course from Math Placement1 Beg Alg I Int Alg \ Adv Aig | Trig | Calc Total
Category | N % 1 N % 1 N 1 % N % 1 N 1 % 1 N 1 % N %Recommend | Successful 1 54 40.9 1 78 37.31 59 1 62.8 23 60.5 1 7
1 1 141.21 11
1|73.3 232 45.9
Recommend | Not Success | 53 40.2 1 63 30.11 24 125.5 10 26.3] 3
I 11 17.61 0
11 0.0 153 30.3
Higher Course Successful 1 13 9.8 16 7.7| 4 1 4.3 3 8.0 1 2
1 1 1 11.81 1
11 6.7 39 7.7
Higher Course Not Success | 12 9.1 7 3.3 1 1 1 10 1 2.6 1 1
1 1 1 5.91 0
11 0.0 22 4.4
Lower Course | Successful 1 1 27 13 0 | 5 1 5.4 1 2.6 1 3
1 1 1 17.61 1
11 6.7 37 7.3
Lower Course | Not Success | 1 18 8.61 1 1 10 0 0.0 1 1
1 1 1 5.91 2
11 13.3 22 4.4
Totals 1132 1 209 94 38 17 1 1 15 1 505
This information suggests the following; (1) A high percentage [76.2%] of tested
students follow placement test recommendations. (2) A high percentage [45.9%] o f tested
students achieve success in the recommended courses. (3) Of those that do not follow the
placement recommendation, the percentage that chose the higher course [12.1%] was very
similar to the percentage that chose a lower level course [11.7%]. (4) Contrary to what would
normally occur, almost the same percentage achieved success in the higher class [7.7%] as did
the percentage of students who achieved success in the lower level class [7.3%]. (5) A high
percentage of students are not successful at the recommended level in Basic Math (40.2%) and
in Beginning Algebra (30.1%). (6) Though small in number [17], the group recommended for
Trigonometry had the highest percentage [11.8%] of students who enrolled in a higher class and
were successful. It also had the highest percentage [23.5%] that enrolled in a lower class; but
all of these were still not successful.

117
When students did not follow the placement test recommendation, the class they enrolled
in was in some cases much different from the suggested level. The following table summarizes
the courses that students enrolled in compared to the placement recommendations and their
corresponding success and failure in the class.
Comparison of Recommendations and Actual Student Enrollment in Math Classes 1993-94
Suggested Math Class
Basic Math Pass Fail
Beg Alg Pass Fail
Int Alg Pass Fail
Adv Alg Pass Fail
TrigPass Fail
Calculus Pass Fail
11 Total
Basic Math 54 53 11 7 1 4 1 0 0 0 0 1 1 132Beg Algebra 27 18 78 63 13 6 3 1 0 0 0 0 1209Int Algebra 3 0 1 1 59 24 4 1 0 0 1 0 1 94Ad\' Algebra 1 0 0 0 0 0 23 10 2 1 1 0 1 38Trigonomeir>’ 1 0 0 0 0 0 2 1 7 3 2 1 1 17Calculus 0 0 0 0 0 0 0 0 1 2 12 0 1 15
Totals: 86 71 90 71 73 34 33 13 10 6 16 2 1 505Percents: 17.0 14.1 17.8 14.1 14.5 6.7 6.5 2.6 2.0 1.2 3.2 0.4 1
Evidently from this table, students who do not follow the placement recommendation will
sometimes take courses that are up to three levels higher or lower than the recommended levels.
There are three cases of students where a mandatory policy of placement would have resulted in
a very negative consequence for the student: (1) one student who was recommended for Basic
Mathematics but enrolled in Advanced Algebra and was successful; (2) three students who were
recommended for Beginning Algebra but enrolled in Advanced Algebra and were successful;
and (3) the one student who was recommended for Intermediate Algebra but enrolled in
Calculus and was successful. The difference in recommended level and the appropriate level in
these three cases was significant, being three levels of course work apart in two cases, and two
levels apart for the case with the three students. Considering that the sample is only 505
students, finding five students with this degree of discrepancy merits further study.

118
It is evident from this brief summary of information that the data available to statistically
analyze the effectiveness of this instrument was limited. For example, cut score validations or
correlation validity studies could not be completed. Also, the sample size was small. When a
larger population base is considered, it would be more suitable to make conclusions.
Also, this study did not provide an evaluation of those students who followed
recommendations that placed them too low, even though they know they had been misplaced.
Because of test difficulty, the number of false negatives such as these may be high. Thirty-nine
students from this school year enrolled in a higher class and were successful, but the true
number who could have been like this is unknown. This type of false negative cannot be
measured Again, evaluating this component was beyond the scope of this paper.
Recommendations.
(1) Again, consider reporting actual student scores for all subtests and tests.
(2) Once student scores are in place, consider conducting a more appropriate criterion
validation study with these scores and some related but independent criterion of measure.
(3) Consider the same for establishing and validating cut scores for all tests and subtests.
(4) Consider further study of the apparent difficulty level of the CC placement test.
(5) Consider evaluating the number of students who are inappropriately recommended
for lower level mathematics course work by virtue of the current placement process.
(6) Consider further evaluation of the subjective recommendation process.
Reliability
Assessment
According to related literature, there are three ways to measure the reliability of a test
instrument. These are alternate form, split half reliability, and test-retest. None of these

119
calculations are possible at this time
1. The alternate form test cannot be performed because there is no alternate test
available, which according to research is generally true for locally designed test
instruments.
2. The split half reliability test requires that the test be divided in equal halves, allowing
the two scores to be correlated, thereby measuring the internal consistency of the test.
Splitting the test in equal halves is most easily accomplished when the test problems are
arranged by increasing difficulty, then the scores from the even and odd problems can be
compared. As this researcher has shown, the problems in this test instrument are not
arranged in that manner. Determination of the equal halves will be another potential
problem.
3. The test-retest reliability test is only an appropriate test if practice and familiarity will
not affect the results of the test, which this researcher feels would not be appropriate for a
mathematics placement test. Once given to a student, it would be relatively easy for the
student to improve his or her score by reviewing some of the specific concepts from the
test
Assurance
Since it is not possible at this time to measure the reliability of this test instrument, it
would seem that the only appropriate method possible to ensure high reliability would be to
follow standardized testing procedures. This includes controlling the test environment,
instructions, time limits, rapport, and other similar factors, in order to ensure that all examinees
will receive the same conditions for administration and scoring, thereby eliminating error
variance and making the test more reliable.

120
In terms of a general assessment for adhering to a standardized process of testing, the CC
Mathematics Placement Test adheres to many of the required procedures, (a) The test utilizes
standardized test forms, with multiple choice problems with only one right answer, and
standardized answer sheets, (b) The testing process offers standardized and impartial test
administration and scoring with all work performed by a separate department reserved for
testing.
Though subjective judgment has been removed from the scoring, as this researcher has
stated previously, there is some concern about the degree of scorer reliability when subjective
evaluations are given for the recommendations at the levels of math classes beyond basic
mathematics.
When scorer judgment enters into decision making, error variance is introduced which
decreases reliability.
Recommendations.
(1 ) Consider using a multi-criterion table such as the one described on page 45.
(2) Consider conducting a split half reliability assessment once appropriate difficulty
indexes have been calculated and test is rearranged according to easy-to-hard
Conclusion
Much work remains if CC wants to use a locally designed mathematics placement
instrument and be assured that it is validated and will generate reliable measurements. The
present test has several issues that remain to be studied. These include (a) test length, (b) test
difficulty, (c) establishment and validation of cut scores with criterion-related study, (d)
calculation of difficulty and discrimination indexes for all test problems, (e) analysis of
distractors, (f) a content validation study by a panel o f faculty, (g) creation of a pool o f piloted
121
test problems for replacement items, (h) reporting of student scores in ratio or interval data
form, (i) re-arrangement of test items from easy-to-hard, (j) item and test bias study, (k)
creation of possible router test, (1) design and validation of a multiple criterion placement table,
(m) performance o f split-half reliability test, and (n) further consideration of calculators in the
placement test arena and in math remediation.
Dissemination
This researcher will present a copy of this complete study to the CC math-science faculty.
A summary of the study has already been presented to the Dean of Faculty. Once the faculty
have reviewed this study, the Dean has asked this researcher to discuss these issues more
completely in a departmental meeting scheduled for May or June of this year.
This study will be published through UMI Dissertation Services which will make it
accessible to other community colleges. This could serve as a guide for others to follow in the
creation and analysis of locally designed mathematics placement tests. Perhaps other
community colleges are unaware of all the complex issues involved in ensuring that these tests
are valid and reliable.

122
References
Akst, G , & Hirsch, L. (1991), Selected studies onmathplacement. Review of
Research in Developmental Education. 8. 3-6.
American Psychological Association. (1985). Standards for educational and
psvchological testing. Washington, DC: Author.
Anastasi, A. (1988). Psvchological testing (6th ed.) New York: Macmillan Publishing
Company.
Angoff, W. H. (1982). Use of difficulty and discrimination indexes for detecting test
bias. In R. A. Berk (Ed ), Handbook of methods for detecting test bias (pp. 96-116).
Baltimore & London: John Hopkins University Press.
Baker, H. (1992, January), The SAT should be revised. The Mathematics Teacher. 85,
14- 16
Battista, M. T. (1994, February). Teacher beliefs and the reform movement in
mathematics education. Phi Delta Kappan, 75. 462-470,
Berenson, S. B , Carter, G , & Norwood, K. S. (1992, February). The at-risk student
in college developmental algebra. School Science & Mathematics, 2. 55-58.
Berk, R. A., (Ed ). (1984a). A guide to criterion-referenced test construction.
Baltimore & London: Jolm Hopkins University Press.
Berk, R, A. (1984b). Conducting the item analysis. In R. A. Berk (Ed.). A guide to
criterion-referenced test construction (pp. 97-143). Baltimore & London: John Hopkins
University Press,
Bomstein, A. (1994, July 4). Placement exam’s future is unclear. The New York
Times. [CD-ROM], Abstract from: ProQuest File: 03088802

123
Boyd, L , & Carson, V. (1991). Using the calculator in a prealgebra course. In D
Cohen (Ed.), The AMATYC Review. 13. 8-13. (ERIC Document Reproduction Service No.
ED 344 641)
Braswell, J. S. (1991, January). Changes in the SAT in 1994. The Mathematics
Teacher. 85. 16-21.
Brunson, P. W. (1992). The arithmetic connection. In D. Cohen (Ed ), The AMATYC
Review. 13. 53-56. (ERIC Document Reproduction Service, No. ED 344 641)
Callahan, S. (1993, November). Math placement at Cottev College. Cottey College,
MO: American Mathematical Association of Two-Year Colleges. (ERIC Document
Reproduction Service No. HD 373 813)
Clarkson, P. C. (1992). Evaluation — Some other perspectives. In T. A. Romberg
(Ed ), Mathematics assessment and evaluation: Imperatives of mathematics educators (pp. 285-
300). Albany, NY: State University of New York.
College Board. (1994). Working with the PSAT/NMSOT. New York: Author.
Gabe, L. C. (1989). Relating college-level course performance to Asset Placement
scores (Institutional Research Report). Fort Lauderdale, FL: Broward Community College,
(ERIC Document Reproduction Service No ED 309 823)
Gay, L. R (1992). Educational research: Competencies for analysis and application
(4th ed.) New York: Macmillan Publishing Company.
Hall, B. C , & Fabricant, M. (1991). Algebra 2 with trigonometry. Englewood Cliffs,
NJ: Prentice Hall.
Hambleton, R. K, (1984). Determining test length. In R. A. Berk (Ed.). A guide to
criterion-referenced test construction (pp. 144-168). Baltimore & London. John Hopkins Press.

124
Harvey, J. G. (1992). Mathematics testing with calculators; Ransoming the hostages.
In T. A. Romberg (Ed ), Mathematics assessment and evaluation. Imperatives for mathematics
educators (pp. 139-168). Albany, NY: State University of New York Press.
Ironson, G. H. (1982). Chi-Square and latent trait approaches. In R. A. Berk (Ed.),
Handbook of methods for detecting test bias (pp. 117-160). Baltimore & London: John
Hopkins University Press.
Isonio, S. (1992, February). Implementation and initial validation of the MDTP tests at
Golden West College. CA: Golden West College, Huntington Beach. (ERIC Document
Reproduction Service No. ED 345 782)
Jacobi, M., Astin, A , & Ayala, F , Jr. (1987). College student outcomes assessment: A
talent devleopment perspective. (Ashe-ERIC Higher Education Report No.7). Washington,
DC: Association for the Study of Higher Education.
Johnson, B. (1983, June). The DeKalb REM Test placement levels and the SAT:
concurrent validity. Clarkston, GA: DeKalb Community College. (ERIC Document
Reproduction Service No. ED 233 761)
Jue, P Y. (1993, March). Course enrollments and subsequent success after being
advised of or ‘Blind' to assessment test scores and recommendations. CA: Napa Valley
College. (ERIC Document Reproduction Service No. Ed 356 819)
Katz, M. (1973). Selecting an achievement test. Principles and procedures. Princeton,
N.J.: Educational Testing Service.
Laughbaum, E, D. (1992). A time for change in remedial mathematics. In D. Cohen
(Ed ), The AMATYC Review. 13. 7-10. (ERIC Document Reproduction Service No. ED 344
641)

125
Linn, R. L. (Ed.). (1988). Educational Measurement (3rd, éd.). New York; American
Council on Education & Macmillan Publishing Company.
Mason, R. D., Lind, D. A., & Marchai, W. G. (1983). Statistics: An introduction
New York: Harcourt Brace Jovanovich, Inc.
Mathematical Sciences Education Board. (1993). Measuring what counts: A
conceptual guide for mathematics assessment. Washington, DC: National Academy Press.
McDonald, A. D. (1989, Winter). Issues in assessment and placement for mathematics.
Journal of Developmental Education. 13. 20-23. Boone, NC: Center for Developmental
Education, Appalachian State University.
Melancon, J. G , & Thompson, B. (1990, November). Measurement characteristics of
the Mathematical Association of America (MAAJ math placement. Paper presented at the
Annual Meeting of the Mid-South Educational Research Association, New Orleans. (ERIC
Document Reproduction Service No. ED 325 510)
Meyer, M. R. (1992). Gender differences in test taking: A review. In T. A. Romberg
(Ed ), Mathematics assessment and evaluation: Imperatives for mathematics educators (pp. 169-
183). Albany, NY: State University of New York Press.
Michigan State Board of Education. (1990). Survev of student assessment and
developmental education in Michigan’s public communitv colleges: Executive summary second
state survev. Lansing, MI: Author. (ERIC Document Reproduction Service No. ED 320 624)
Millman, J, (1984). Individuazlizing test construction and administration by computer.
In R A. Berk (Ed ), A guide to criterion-referenced test construction (pp 78-96). Baltimore &
London. John Hopkins Press.
126
Millman, J., & Greene, J. (1988). The specification and development o f tests of
achievement and ability. In R. L. Linn (Ed ), Educational measurement (3rd ed., pp. 335-366).
New York: American Council on Education & Macmillan Publishing Company.
Morante, E A (1987). A primer on placement testing. In D. Bray & M. J. Belcher
(Eds ), Issues in student assessment: New directions for communitv colleges, (no. 59, pp. 55-
63). San Francisco & London. Jossey-Bass Inc. & ERIC Clearinghouse for Junior Colleges.
National Council of Teachers o f Mathematics. (1989). Curriculum and evaluation
standards for school mathematics. Rest on, VA: Author.
Nitko, A. J. (1984). Defining criterion-referenced test In R. A. Berk (Ed ), A guide to
criterion-referenced test construction (pp. 9-28). Baltimore & London: John Hopkins
University Press.
Noble, A. C , & Mullen, K. B. (1992, January). The ACT assessment in the 1990’s.
The Mathematics Teacher. 85. 22-25.
Palmer, J. (1987). Sources and information: Student assessment at community
colleges. In D. Bray & M. J. Belcher (Eds ), Issues in student assessments: New directions for
communitv colleges, (no. 59, pp. 103-112). San Francisco & London: Jossey-Bass Inc. &
ERIC Clearinghouse for Junior Colleges.
Roid, G. H. (1984). Generating the test items. In R. A. Berk (Ed ), A Guide to
criterion-referenced test construction (pp. 49-77) Baltimore & London: John Hopkins
University.
Romberg, T. A. (1992). Evaluation: A coat of many colors. In T. A. Romberg (Ed ),
Mathematics assessment and evaluation. Imperatives for mathematics educators (pp. 10-36).
Albany, NY: State University of New York Press.

127
Romberg, T. A., Wilson, L., Khaketla, M., & Chavarria, S. (1992). Curriculum and
test alignment. In T. A. Romberg (Ed.), Mathematics assessment and evaluation: Imperatives
for mathematics educators (pp. 61-74). Albany, NY; State University ofNew York Press.
Rounds, J. C , Kanter, M. J , & Blumin, M. (1987). In D. Bray & M. J. Belcher (Eds ),
Issues in student assessment. New directions for communitv colleges, (no. 59, pp. 83-93).
San Francisco & London: Jossey-Bass Inc & ERIC Clearinghouse for Junior Colleges.
Ryan, M., Doubet, M, E., Farricant, M., & Rockhill, T. D. (1993). Advanced
mathematics: A precalculus approach. Englewood Cliffs, NJ: Prentice Hall.
Schoen, H. L. (1993, May). Assessment issues from a mathematics education
perspective. The mathematics outlook. Washington DC: Office of Educational Research and
Improvement & ERIC Clearinghouse for Science, Mathematics, and Environmental Education,
1929 Kenny Rd , Columbus, OH. (ERIC Document Reproduction Service No. ED 359 047)
Senk, S. (1992). Assessing students’ learning in courses using graphics tools: A
preliminary research agenda. In T A. Romberg (Ed ), Mathematics assessment and evaluation.
Imperatives for mathematics educators (pp. 128-138). Albany, NY: State University o f New
York Press.
Shepard, L, A (1982). Definitions of bias. In R, A. Berk (Ed ), Handbook of methods
for dectecting test bias (pp. 9-30). Baltimore & London. John Hopkins University Press.
Slark, J , & Others. (1991). RSC validation of mathematics placement tests, research,
planning, resource development report. Santa Anna, CA. Rancho Santiago Community
College, (ERIC Document Reproduction Service No. ED 341 418)

128
Sturtz, A. J., & McCarroll, J. A. (1993). Placement testing and student success: The
first intervening variable. CT; South Central Community College. (ERIC Document
Reproduction Service No. ED 360 018)
Tobias, S. (1993). Overcoming Math Anxiety. New York & London: W. W. Norton
&Co.
Truman, W. L. (1992). College placement testing: A local test alternative. In D. Cohen
(Ed ), The AMATYC Review, 13. 58-64. (ERIC Document Reproduction Service No. ED 344
641)
Webb, N., & Romberg, T. A. (1992). Implications of the NCTM Standards for
mathematics assessment. In T. A. Romberg (Ed ), Mathematics assessment and evaluation:
imperatives for mathematics educators (pp. 37-60). Albany, NY: State University of New York
Press
Wilson, M. (1992). Measuring levels of mathematical understanding. In T A
Romberg (Ed ), Mathematics assessment and evaluation: Imperatives for mathematics
educators (pp 213-241). Albany, NY, State University of New York Press.
Wise, S. & Others. (1993). The role of anxietv in examinee preference for self-adapted
testing Atlanta, GA. American Educational Research Association. (ERIC Document
Reproduction Service No. ED 358 154)

A - 129
Appendix A
Definitions
Achievement tests. Tests that “measure effects of relatively standardized sets of
experiences,” such as a final examination for a specific course (Anastasi, 1988, p. 411-412).
The results are generally used to measure performance at a stated time and, as such, are
validated by content related validity studies.
Alternate form test. A method utilized for assessing test reliability, comparing the
scores obtained on the original test to that of the alternate test. The correlational coefficient
that is calculated is termed the coefficient of equivalence (Katz, 1973).
Alternate test forms. Statistically similar or parallel test instruments with “standard
deviations and correlation with other measures considered approximately equal” (American
Psychological Association, 1985, p. 89). These include: (a) measuring same variable, (b) having
same number of items, (c) having same structure, (d) having same difficulty level, and (e) having
same directions for administering, scoring and interpretation of scores. The only difference is
the tests forms have different problems (Anastasi, 1988, Gay, 1992).
Aptitude tests. Tests that “measure the effects of learning under relatively uncontrolled
and unknown conditions” (Anastasi, 1988, p 412). The results are generally used to predict
performance and, as such, are validated by criterion-related validity studies.
Chi Square (X^). A statistical test used to determine if there is a significant difference
between observed and expected frequencies in “two or more mutually exclusive categories,”

A - 130
being used primarily with studies o f nominal data (Gay, 1992, p. 443). The formula for this
coefficient is given as follows (Gay & Mason, Lind, & Marchai, 1983):
fp = frequency observed and fg = expected
Gay (1992) used the following example as a method for recording data, where the total
observed and total expected in each row and column equal.
Successful Unsuccessful
Male
Female
In the example above, the degrees of freedom would be (C-1)(R-1) = 1 where C is the
number of columns and R is the number of rows. The determination of the Chi Square critical
value is dependent on the selected level of significance and the resultant degrees of freedom and
can be found in a Chi Square critical value table.
Mason et al (1983) stated that expected frequencies are equal (if each choice has an
equal chance of occurring), unequal (based on percentages determined by larger populations or
trends), or need to be calculated. (Refer to definition of expected frequencies, calculated.) The
grand total of subjects in either expected or observed categories equals the same measure.
Computerized adaptive or aided testing (CAT). Testing that allows for more immediate
and accurate analysis of students’ competency levels with computer generated problems
according to performance level of student. As student answers problems correctly, more

A - 131
difficult problems are generated. When student misses an answer, the computer generates an
easier problem, with an eventual placement decision achieved in a shorter period of time (Akst
& Hirsch, 1991; Anastasi, 1988; Rounds, Kanter, & Blumin, 1987).
Confidence interval. “The points on a score scale that define, with specified probability,
an interval that includes the parameter of interest” (American Psychological Association, 1995,
p. 90). It defines the probability that the unknown will fall within the specified interval.
Construct validity. Focuses on test scores as a measure o f psychological characteristics
of interest or a theoretical construct or trait. Examples would be assessing reasoning ability,
spatial visualization, introversion, and extroversion (Anastasi, 1988).
Content validity. The degree to which a test measures an intended content area.
According to Gay (1992), content validity consists of two measures, (a) item validity and (b)
sampling validity. The first indicates that the test items represent measurement in the intended
area (or that they are content aligned). The second indicates that the intended areas are
represented appropriately. Measures of content validity are determined by expert judgment
(Gay & McDonald, 1989) and no statistic is calculated.
Correlation Coefficient. Expresses the degree of correspondence or relationship
between two sets of scores, expressed as a value from -1.0 to 0.0 to +1.0 (Anastasi, 1988).
Gay (1992) stated that the level required for acceptance is dependent on use. A coefficient
greater than 0.4 is acceptable for a relationship study; it needs to be greater than 0.6 for use in
predictive studies; and it needs to be greater than 0.7 for acceptability in reliability tests of some
instruments
Criterion-referenced testing. Testing that utilizes “as its interpretive frame of reference a
specified content domain rather than a specified population of persons. In this respect it has

A - 132
been contrasted with the usual norm-referenced testing” (Anastasi, 1988, p. 101).
Criterion-related validity. Measures of validity that are calculated by correlating
performance on a test to performance on another criterion. If the other criteria's measurement
is available at the time of testing, it is termed concurrent validity. If the other criteria's
measurement is available at a later date, it is termed predictive validity More objective
measurement of this type of validity is possible than with content validity (Gay, 1992,
McDonald, 1989).
Critical value. “The number that separates the region of acceptance from the region of
rejection” (Mason et al., 1983, p. 477).
Cut score. In placement assessments, the score level that determines the “mandatory or
advised placement of students into a given course within a sequence” (McDonald, 1989, p. 22).
It is the score level that has been pre-determined to indicate a stated degree of proficiency; it
divides those who have the stated level of training from those who do not (Anastasi, 1988,
Morante, 1987; Truman, 1992).
Dichotomouslv. Scoring a test either correct or incorrect, with no partial credit given
for any item (Gay, 1992).
Difficulty index ( p ). Calculated for each item of an assessment and represents the
proportion of examinees answering a dichotomously scored item correctly (Millman & Greene,
1988, Truman, 1992). Millman and Greene stated a formula for the difficulty index ( p ) that is
corrected by the random guessing factor:
Pc = P ~ Pc = difficulty index corrected; p% = proportion who attempted
and missed; a = number of alternatives in problem

A - 133
Discrimination index. “The difference between the percentage of students in the upper
quartile getting an item correct and the percentage of students in the lower quartile getting the
same item correct” (Truman, 1992, p. 61).
Distractors. In a multiple choice test, the set of possible answers given (Truman, 1992).
Errors of measurement. “Differences between scores from one form to another or from
one occasion to another” (American Psychological Association, 1985, p. 19), that reduce the
reliability of a measurement. They constitute the difference between what is observed and
measured and what would be the true score.
Error variance. “Essentially, any condition that is irrelevant to the purpose of the test”
(Anastasi, 1988, p. 110).
Expected frequencies, calculated Mason et al. (1983) stated that the expected
frequency can be calculated for a Chi Square test as follows:
f - (Row total)(Column total) Grand total
Face validity. A subjective measure of the degree to which a test appears to measure
what it is supposed to measure (Gay, 1992; Morante, 1987). It is not validity in the technical
sense (Anastasi, 1988).
False negatives or false rejections. Students that fail the placement test but eventually
succeed in the class for which they were not recommended (American Psychological
Association [APA], 1985, Anastasi, 1988; Truman, 1992).
False positives or false acceptances Students that pass placement tests but eventually
fail in the recommended class (APA, 1985; Anastasi, 1988; Truman, 1992).

A - 134
Group testing. Assessments that are given to groups of examinees. These are opposed
to individualized administered tests. Group tests are more convenient to administer, save time
and costs, and are used in the educational arena (Gay, 1992).
Interval scores. Most tests in educational research use this type of measurement.
“Interval data is based on predetermined equal intervals. Scores on achievement tests are
examples of this type of data” (Gay, 1992, p. 379).
Item analysis. “The process of assessing certain characteristics of test items, usually
difficulty value, the discriminating power, and sometimes the correlation with an external
criterion” (American Psychological Association, 1985, p. 92).
Item bias. “Test questions designed to measure the same construct must be studied
together; bias is discovered when an item does not fit the pattern established by others in the
set” (Shepard et al., 1980, as cited in Shepard, 1982, p. 24).
Item response theory. Provides a mathematical basis for determination of value of
difficulty level and content area for each test problem. It uses an item characteristic curve
(ICC) that “depicts the relationship between ability and the probability of answering the item
correctly” (Ironson, 1982, p. 118)
Item validity. One of the measurements of content validity Item validity determines
“whether the test items represent measurement in the intended area” (Gay, 1992)
Locally developed or in-house test. An assessment that has been designed by local
college staff (McDonald, 1989, Morante, 1987; Truman, 1992)
Mastery tests. Tests where the items are of low level and time allowances are generous
(Gay, 1992).
Multiple choice problem. Any problem that can be answered with one of the supplied

135
answers. Generally this type of problem is scored dicotomously with the remaining possible
answers termed distractors (Anastasi, 1988).
Nominal scales. Represents the lowest level of measurement. Such a scale classifies
data into two or more categories, such as success and not success or male and female (Gay,
1992).
Norm-referenced testing. An individual’s score from this type of instrument is
“interpreted by comparing it with the scores obtained by others on the same test” (Anastasi,
1988, p. 101).
Ordinal scale. A data measurement where participants are ranked in order (Gay, 1992).
Pearson rho correlation coefficient. Formula utilized when data is in interval or ratio
form, which is the most common for educational measurement instruments (Gay, 1992). The
following formula was utilized by Gay and Mason et al. (1983).
n/
Where x and y indicate each perspective score and n is the number of scores.
Performance standard. A level of measurement of a specified criterion .
Placement testing. A process “used in higher education to describe a process of student
assessment, the results of which are used to help to place entering college students in an
appropriate beginning courses” (Morante, 1987, p. 55).
Power test. A test whereby every student has sufficient time to complete the entire test
(Meyer, 1992) with items usually arranged from easy to hard (Gay, 1992).

A - 136
Predictive validity. Measures the effectiveness or how well the test predicts or
correlates with some other criterion that is an independent measure of what the test is designed
to predict (Anastasi, 1988; Morante, 1987).
Primary standards. The level of standards depicted by the Standards of Educational and
Psvchological Testing (1985) that are required of all tests before they are used “unless a sound
professional reason is shown why it is not necessary or technically feasible to do so in a
particular use” (American Psychological Association, p. 2).
Professionally developed tests. Assessments that has been created, produced and
studied by professionals, who are trained in test design. The use of a test of this nature implies
uniformity in administration and scoring (Anastasi, 1988; McDonald, 1989).
Psychometrics. The field of study that involves the application of statistical procedures
to “the measurement of psychological characteristics such as abilities, aptitudes, achievement,
skill and knowledge” (American Psychological Association, 1985, p. 93).
Ratio scale. An actual measurement such as height or weight. It has a true zero (Gay,
1992).
Reliability. The degree to which a test consistently, dependably and repeatedly
measures whatever it is supposed to measure (Gay, 1992). Reliability is the likelihood that if a
student takes the same test again, he or she will get the same score (Morante, 1987), “When
examiners try to maintain uniform testing conditions by controlling the testing environment,
instructions, time limits, rapport, and other similar factors, they are reducing error variance and
making the test scores more reliable” (Anastasi, 1988, p. 110). It is typically measured by test-
retest, alternate form, and split-half reliability studies (Anastasi, Gay & Katz, 1973)..

A - 137
Sampling validity. An indication that intended content areas are represented (Gay,
1992).
Scorer reliability. When test scoring allows for judgmental decision making from the
scorer, “there is as much need for a measure of scorer reliability as there is for the more usual
reliability coefficients” (Anastasi, 1988, p. 125). This can be estimated by having a sample of
test scored by two or more independent test scorers and calculate the correlation coefficient of
the obtained scores, termed inteijudge reliability, or have the same tests evaluated another time
by the scorer, termed intrajudge reliability. In either case, in subjective interpretations, these
calculations tend to not be very high (Gay, 1992).
Secondary standards. This level is depicted by the Standards of Educational and
Psvchological Testing (1985) as being desirable “but likely to be beyond reasonable
expectations in many situations” (American Psychological Association, p. 3).
Spearman-Brown formula, r^ = —^ - where r^^ = correlation of half testsl + ^hh
Spearman rho. Correlation formula that utilizes order ranking of scores (Gay, 1992).
Speeded test. A timed test in which the number of tasks that can be performed in a
stated time are measured (American Psychological Association, 1985), with the items being
generally at the same level o f difficulty (Gay, 1992). Students who respond at a slower rate
may not finish all of the items (Meyer, 1992).
Split-half reliability. The internal consistency of the same test can be measured by this
method. Two sets of scores are obtained for each person by dividing the test into equivalent
halves (Anastasi, 1988). When problems are arranged by increasing difficulty, scores from the
even and odd problems can be compared. These scores are then correlated. Since this would

A - 138
only be the correlation coefficient of a half-test, the Spearman-Brown formula is used for
calculating split-half reliability of the entire test (Anastasi & Truman, 1992). The calculated
coefficient is termed the internal consistency coefficient (Katz, 1973).
Standard Error of Estimate. “Before drawing any conclusions about the apparent
validity of a test, we need to be sure that the obtained validity coefficient could not have been
obtained by chance” (Anastasi, 1988, p. 118-119). SEgj = SDy Jl - ^ This shows the
margin of error to be expected in the individual’s predicted criterion score. The r y is the
calculated validity coefficient and SDy is the standard deviation of the criterion scores
(Anastasi).
Standard Error of Measurement. “The standard deviation of errors of measurement that
is associated with the test scores for a specified group of test takers” (American Psychological
Association, 1985, p. 94).
Standardized test. An assessment in which “the conditions of administration and scoring
procedures are designed to be the same for all uses of the test” (Millman & Greene 1988, p.
340).
Test bias. A test is biased for members of a subgroup of the population if the abilities of
this subgroup are misrepresented in the prediction of a criterion for which the test was designed.
Both judgmental and statistical methods should be used in identifying bias (Shepard, 1982).
Test-retest. Assessing the reliability of a test instrument by correlating test scores
obtained when the test is given twice to the same group after a stated time interval (Anastasi,
1988). Practice and familiarity can adversely affect the validity of this measurement. The
calculated coefficient is termed the coefficient of stability (Katz, 1973).

A - 139
Unbiased Test Item. “A test item can be considered unbiased if all individuals having the
same underlying ability level have an equal probability of correctly answering the item,
regardless of their subgroup membership (Pine, 1977, as cited in Shepard, 1982, p. 23).
Validity. “The likelihood that the test in fact measures what it is supposed to measure.
It consists efface validity, concurrent validity, and predictive validity” (Morante, 1987, p. 59).
Validity coefficient. “A coefficient of correlation that shows the strength of the relation
between predictor and criterion” (American Psychological Association, 1985, p. 94).
Weighted scoring. “Scoring in which the number of points awarded for a correct
response is not the same for all items in the test. In some cases, the scoring formula awards
more points for one response to an item than for another” (American Psychological Association,
1985, p. 94).
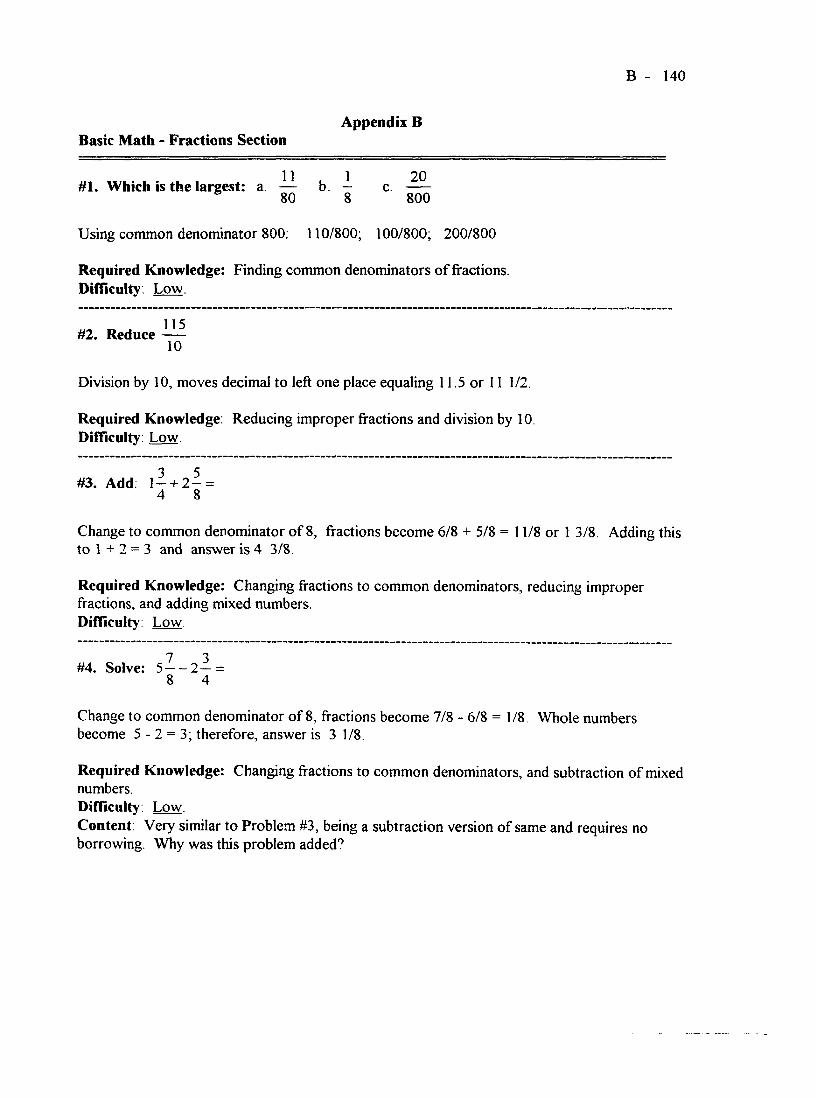
B - 140
Appendix BBasic Math - Fractions Section
#1. Which is the largest: a. — b. — c.80 8 800
Using common denominator 800: 110/800; 100/800, 200/800
Required Knowledge: Finding common denominators of fractions.DifTiculty. Low.
#2. Reduce10
Division by 10, moves decimal to left one place equaling 11.5 or 11 1/2,
Required Knowledge: Reducing improper fractions and division by 10.Difficulty: Low.
#3. Add: l - + 2 - =4 8
Change to common denominator of 8, fractions become 6/8 + 5/8=11/8 or 1 3/8. Adding this to 1 + 2 = 3 and answer is 4 3/8.
Required Knowledge: Changing fractions to common denominators, reducing improper fractions, and adding mixed numbers.Difficulty: Low
#4. Solve: 5—- 2 — =8 4
Change to common denominator of 8, fractions become 7/8 - 6/8 = 1/8 Whole numbers become 5 -2 = 3, therefore, answer is 3 1/8.
Required Knowledge: Changing fractions to common denominators, and subtraction of mixed numbers.Difficulty: Low.Content: Very similar to Problem #3, being a subtraction version of same and requires no borrowing. Why was this problem added"’

B - 141
Basic Mathematics - Fractions Cent.’
2 1#5. Solve: 4 —-1 —=5 2
When multiplying mixed numbers, change to improper fraction and multiply:22 3 33 ,35 2 5 5
Required Knowledge: Changing mixed numbers to improper fractions before multiplying. Difficulty: Medium. Many students find multiplying mixed numbers difficult.
#6. Divide: 2 —-^3— =2 4
When dividing mixed numbers, make improper and multiply by the reciprocal of the divisor .5 13 5 4 102 4 2 13 13
Required Knowledge: Changing mixed numbers to improper factions and invert the divisor. Difficulty Medium to high. Many students do not remember how to divide with fractions and again find the concept more difficult when combined with a mixed number.
#7. Word Problem: Original length 4 1/4 yards long and remove I 2/3 yards.
1 2 3 R 1 5 R 7Subtraction: 4 - - l - = 4 ----- 1— z=3— - 1 — = 2 —
4 3 12 12 12 12 12
Required Knowledge: Interpretation of a word problem, changing fractions to common denominators before subtracting; and borrowing from mixed numberDifficulty Medium to high. Many students find word problems more difficult. Secondly, this subtraction problem requires borrowing from the whole number, which many find difficult to do

B - 142
Basic Mathematics - Fractions Cent.’
#8. Word Problem: Car travels at 50 1/2 mph for 2 3/4 hours; distance traveled?^Consider: Use less complicated fractions.
Multiplication since D = (R)(T) where r = rate and t = time:
2 4 8 8
Required Knowledge: Interpretation of a word problem; knowledge of distance = rate times time formula; multiplication of mixed fractions require conversion to improper; multiplication and eventual reduction of a relatively complicated fraction.Difficulty: Very high difficulty. This is perhaps the most difficult problem in the set. It combines a word problem, with the D= (R)(T) formula which students find difficult, multiplication with mixed numbers, and a relatively complex set of numbers where nothing cancels make this a very difficult problem..
#9. Word Problem: Works 1 3/4 hours and 2 1/8 hours and 1 1/2 hours. What is total hours worked?
Requires addition of mixed numbers: 1-4-2 — + 1 — = 1 —4-2-^4-l — = 4 — = 5—4 8 2 8 8 8 8 8
Required Knowledge: Interpretation of a word problem and requires addition of a series of mixed numbers, converting each to common denominators and reducing eventual improper fractionDifficulty: Medium. Word problems tend to be somewhat more difficult but concept easy.
#10. Word Problem: Division of 9 3/8 feet by 1 7/8 feet:
Division problem requires conversion to improper and invert divisor:^ 3 7 75 15 75 8 .9 —-4 1— = ------:----- = = 5 n ie c e s
8 8 8 8 8 15
Required Knowledge: Interpretation of a word problem; conversion of mixed number to improper; multiplying by the reciprocal of divisor, and reduction of fraction to lowest terms. Difficulty: High Students find word problems more difficult, but combined with the need to recognize a division problem with mixed numbers make this difficult.

B - 143
Basic Math - Decimal Section
#11. Write 44 23/100 as decimal: Answer; 44.23
Required Knowledge: Conversion of fraction in hundredths to decimal.Difficulty Low.
#12. Write 1.654 as non-reduced fraction: 1 654/100
Required Knowledge: Reading decimal converts to fraction. Difficulty: Low
#13. Add: 0.763 + 1.2 + 120.96.
Line up decimals and add: 0.763 + 1.200 + 120.960 = 122.923
Required Knowledge: Adding decimals requires same number of decimal places.Difficulty: Low.
#14. Round off 245.504 to two decimal places. ^Consider: Hundredths place
The zero is in the hundredths place and it should stay 0. 245.50
Required Knowledge: The rounding rule.Difficulty: Very low. Rounding is sometimes difficult for students but usually when question is asked in terms of hundredths place and when they have to round up.
#15. Solve: 4.0 - 1.65 =
Line up decimals and subtract: 4.00 - 1.65 = 2.35
Required Knowledge: Subtraction of decimals requires same number of decimal places. Difficulty: Low. Expressing the 4 as 4.0 makes it easier for student to recognize the proper set-up for solving the problem.
#16. Solve: (10.25)(.001) =
When multiplying by 1/1000, move decimal 3 places to the left or multiply and move the total number of decimal places in each factor. 0.01025
Required Knowledge: Multiplying with decimals.Difficulty: Low to medium. Students sometimes have difficult with multiplication with decimals.

B - 144
Basic Mathematics - Decimals Cont.’
#17. Solve: 4.5)91.35
When dividing, clear decimal out of divisor by multiplying by ten and multiply dividend by ten as well. Answer = 20.3
Required Knowledge: Division with decimals requires clearing decimal from divisor. This problem also requires inserting place value of 0 in ones place.Difficulty: Medium. Students find division by a decimal to be slightly more difficult than the other operations.
#18. Change 1 2/9 to decimal form (to two decimal places):
To convert fraction to a decimal, divide denominator into numerator or 9^2 and carry to hundredths place. Answer: 1.22 since 2/9 is under half
Required Knowledge: Conversion to a decimal from a fraction requires dividing numerator by denominator; understanding of where the whole number lies in interpretation of decimals; and rounding rule.Difficulty: High. If the problem had only dealt with the conversion of 2/9 it would not have been as difficult, but having the whole number 1 in the problem, makes it more difficult.
#19. "Word Problem: Drove 214.7 miles on 11.2 gallons of gas. Calculate miles per gallon to nearest hundredth.
Divide miles by number of gallons. 11.2)214.7 After clearing decimals from divisor by
multiplying by ten, the same factor is applied to dividend and answer is 19.17 since the remainder is 108/112 which is over half.
Required Knowledge: Interpretation of word problem; ‘per’ means to divide, division with a decimal; and the rounding rule.Difficulty High. Students generally find mile per gallons problem difficult, and then when combined with a word problem and more complex numbers, the problem becomes more difficult.
General Comment: In regards to overall difficulty, even though it is appropriate to teach fractions before decimals, the problem set for decimals seems easier than the fraction set. Though calculated difficulty indexes for each would be more appropriate than subjective opinion, it would seem that consideration be given to reversed the order or these two sections.

B - 145
Basic Math - Percentage Problem Section
#20. Change 137% to a decimal: '^Suggestion: Use 37%
To convert a percentage to a decimal, multiply by .01 : Answer; 1.37
Required Knowledge: A percent always means 0.01 or 1/100; multiplication by 0.01 moves the decimal to the left two places.Difficulty; Low to medium. Students generally have difficulty converting percentages that involve numbers over 100.
#21. Change .257 to a percentage:
To convert a decimal to a percent, move the decimal two places to the right. 25.7%
Required Knowledge; A percent means a quantity per hundred. Multiplying by 100 moves the decimal two places to the right.Difficulty; Low.
#22. Change 3/5 to a percentage:
A percent means a quantity per hundred and 3/5 = 60/100 or 60%
Required Knowledge. A percent means a quantity per hundred. Five divides evenly into 100, making an easy conversion.Difficulty: Low to medium.
#23. Word Problem: A man earns SI 1,300, paying 22% for taxes. What is the tax?
22% of 11300 = = (22X113) = $2,486100 1
Required Knowledge; Interpretation of word problem; conversion to percent; utilization of (Percent)(Whole) = (Part) formula.Difficulty; Medium to high. Students will find this problem more difficult because it combines a word problem with a calculation of slightly complex numbers. If calculated as a fraction, little cancels. Consider “SI 1,300 at 20%.”

B - 146
Basic Mathematics - Percentage Cont/
#24. What percent is 100 of 250?
(N%)(250)= 100 =>. N% =100_ = 10 = _40 =>N% = 40%250 25 100
Required Knowledge: Utilization of (Percent)(Whole) = (Part) or Percent = (Part)/(Whole) formula and conversion from fraction to percentage.Difficulty: High. Students generally find solving for the percentage in a problem to be most difficult; then combine this with a problem that seems to be worded in an awkward manner, makes the problem even more difficult. Consider wording as “ 100 is what percent o f 250?”
#25. 75% of a number is 300. What is the number?
(75%)(N) = 300 = > _1(N) = 300 = > N = (3001 4 ==> N = 4004 1 3
Required Knowledge: Conversion of percentage to fraction; and solving for the whole number in (Percent)(Whole) = (Part).Difficulty Medium to high. Students generally find solving for the Whole part o f a problem like this more difficult.
#26. 20 is 2% of Total. What is Total?
20 = (2%)(N)=> 20= _2 (N) = > 1 0 0 (2 0 ) = N = > N = 1 0 0 0100 2 1
Required Knowledge: Conversion of percentage to fraction, and solving for the “Whole” number in (Percent)(Whole) = (Part).Difficulty Medium to high. Same as Problem #25.Content. WOiy is the problem added? It is very similar in content to Problem #25.
#27. 7.5% of 52.2 is what number?
(7.5%)(52.2) = (0.075)(52.2) = 3.9150 or 3.915
Required Knowledge: Conversion of percentage to decimal; and solving for the part number in (Percent)(WTiole) = (Part)Difficulty. Medium Once percentage converted, primarily involves straight multiplication of decimals. Students generally can find the “Part” easier than they can find the “Whole” number.

B - 147
Basic Math - Measurement Problem Section
#28. Interpretation of a diagram: Find the length of a missing section.
Add up the dimensions given and subtract from the entire length to find the missing section, 2 + 1 + 1/2 + 1 = 4 1/2. The entire distance is given to be 6; therefore, the missing distance is 6 - 4 1 / 2 = 1 1/2.
Required Knowledge: Interpretation of diagram indicating linear dimensions; and subtraction of mixed number fractions, requiring borrowing.Difficulty: Low to medium. Determining measurement is not as difficult as perhaps having to borrow in the fraction portion of the operation.
#29. Boundary of a circle is a ?
Answer: Circumference
Required Knowledge: Definition of circumference of a circle.Difficulty: Low. With the problem written this way, student is likely to pick the correct one.
#30. Find area of a square with side 3”:
Area of a square = s = A; therefore, 3^= 9 square inches
Required Knowledge: Definition of a square; formula for area of a square; and understanding of s or (s)(s).Difficulty: Low. If the student knows the formula, this will not be difficult.
#31. Interpretation a diagram: Find area of a figure.(The figure is a rectangle with sides 2” and 3”).
Area of a rectangle = (length)(width) => (2)(3) = 6 sq inches
Required Knowledge: Interpretation of a diagram, definition of a rectangle; and formula for area of a rectangle.Difficulty: Low Again, if the student knows the formula, this will not be difficult
#32. Interpretation of a diagram: Find area of a figure. (The figure is a circle with a given diameter of 2 feet).
Area of a circle = nr^ or n(d/2)^ = 7r(l)^ = tc or 22/7 or 3.14
Required Knowledge: Interpretation of a diagram; definition of diameter and radius of a circle; the formula for the area o f a circle; and the magnitude of n.Difficulty: Medium to high Students have difficulty with the formula and the value of 7t.

B - 148
Basic Mathematics - Measurements Cont.’
#33. What is volume of cube with sides 12” in length?
After examining answers, none are given in inches. Change 12” to 1 ft and calculate volume: Volume of cube = s3 = > 13 = 1 cubic foot.
Required Knowledge: Re-calibrate dimensions after examination of possible answers, conversion from inches to feet; definition of a cube; and formula for volume of a cube. Difficulty: High. Students will have more difficulty with this problem. If they remember the formula for the volume of a cube and calculate 12 = 1,728 in , they will not find their answer. They will have to re-calibrate their dimensions and try again. Is this problem measuring conversions or measurement?
#34. What is volume of rectangular solid with dimensions of 3”, 4”, and 5”?
Volume = (length)(width)(height) = (3)(4)(5) = 60 cubic inches
Required Knowledge: Formula for volume of a rectangular solid.Difficulty: Low to medium. If the student knows the formula, this will be relatively easy.
#35. Solve: 42 inches = _____ feet and inches.
42— = 3 ft. and 6 inches 12
Required Knowledge: Number of inches in one foot and division of whole numbers.Difficulty Low. Students are generally familiar with the conversion and numbers are easy.
#36. Solve: 1 quart = ______ fluid ounces
1 quart = 2 pints and 1 pint = 2 cups and 1 cup = 8 fluid ounces Therefore, 1 quart = 32 fluid ounces or obtain conversion directly
Required Knowledge: Either knowledge of conversion directly or number of pints per quart, cups per pint and fluid ounces per cup.Difficulty: Possibly Low for some and High for others. If the student commonly works with quarts of measure, such as mixing fuel oil and gasoline, this will not be difficult If the student uses cups and fluid ounces as in cooking, this will be more difficult.

B - 149
General Mathematics - Metrics Section
#37. 36.7 g = kg
■ _ 1 M _ = 0.0367 kg1 1000 g
Required Knowledge: Number of grams in a kilogram and utilizing conversion chain. Difficulty: Low to medium. Only if the student knows the metric conversions.
#38. 2.103 m = ______ cm
2 M ^ 1 0 0 c m ^ 210,3 cm 1 1 m
Required Knowledge: Number of centimeters in one meter and utilizing conversion chain. Difficulty: Low to medium. Only if the student knows the metric conversions.
#39. 6 mm = ____ cm
6 mm 1 cm-------------------= 0.6 cm1 10 mm
Required Knowledge: Number of millimeters in one centimeter and utilizing conversion chain. Difficulty Low to medium. Only if the student knows the metric conversions
#40. 0.31 liters = ml
0.31 liters 1000 ml1 liters
= 310 ml
Required Knowledge: Number of milliliters in one liter and utilizing conversion chain. Difficulty: Low to medium. Only if the student knows the metric conversions
#41. 0.06 kg = ____ mg
0.06 kg 1000 g 1000 mg 1 1 kg 1 g
= 60,000 mg
Required Knowledge: Number of milligrams in a gram; number of grams in a kilogram and utilizing the conversion chain.Difficulty: Medium. Slightly more difficult, because another term in the conversion chain is required.

B - 150
General Mathematics - Metrics Cont.’
#42. 6.6 lbs = ______ kg * Suggestion: Too difficult?
6.6 lbs 1 kg1 2.2 lbs
= 3 kg
Required Knowledge: Number of pounds in a kilogram and utilizing conversion chain. Difficulty: Could be very hard! Becomes very difficult if the student does not know this particular conversion. Transferring from our system to metric and back is always difficult for anyone who is not used to working with the metric system.
#43. 3 liters = ____ quarts * Suggestion: Too difficult?
3 liters 1.06 qts . , _---------------- — = 3.18 qts1 1 liters
Required Knowledge: Number of quarts per one liter and how to utilize conversion chain. Difficulty : Could be verv hard! Becomes very difficult if the student does not know this particular conversion. Transferring from our system to metric and back is always difficult for anyone who is not used to working with the metric system
#44. 1 ft = cm * Suggestion: Too difficult?
1 ft 1 yd 1 m 100 cm1 3 ft 1.1 yd 1 m
= 30.3
Required Knowledge: To do it this way, the student would need yds to ft, meters to yds, and cm to meter, unless student knew that 1 ft = 30.48 cm, which is unlikely.Difficulty: Could be verv hard! Becomes very difficult if the student does not know this particular conversion Transferring from our system to metric and back is always difficult for anyone who is not used to working with the metric system
General Comment: Why should all students have to complete this section'^ It is understood that the only students who have to complete this section are the ones who are going to enter some area of the medical field, but that question is asked on the first page of this test. Why could everyone else just not do this section? This may be interesting information to obtain on everyone, but many students are already becoming very discouraged by the time they have reached this point in this test. To force all students to complete this section which will only possibly discourage them even more seems very unfair.

B - 151
Basic Mathematics - Ratios Section
#45. Reduce 24/72 to lowest terms:24/72 = 1/3
Required Knowledge. Requires skill of reducing fractions.DifTlculty; Very low.
#46. Reduce 15 ft : 10 ft to lowest terms:15/10 = 3/2 or 3 : 2
Required Knowledge. Recognizing that ratios are simply fractions and reducing fraction. Diilicuity: Low.
#47. Which of the following is the inverse of 2 to 1?Inverse of 2 to 1 is 1 to 2
Required Knowledge. Understanding definition of inverse.Difficulty: Low.
#48. Which of the following as the same meaning as 2:3 = 18:272 183 “ 27
Required Knowledge: Understanding that ratios are simply fractions.Difficulty: Low.
8 3#49. Solve for the letter in — = —:
9 X
8 3 27— = — = > 8x = 27 or X = — = 3.3759 X 8
Required Knowledge : Understanding in a proportion that the product of the means equals the product of the extremes.Difficulty: Medium.
#50. Given the following test scores: 89, 79, 47, 52, 76,93, 89. Find the average.89 + 79 + 47 + 52 + 76 + 93 + 89 = 525/7 = 75
Required Knowledge: Knowing how to calculate the arithmetic mean or average.Difficulty Medium. If the student knows the mean, it amounts to a relatively simple problem.

B - 152
General Mathematics - Ratios Cont/
#51. Word Problem: Bruce saved three dollars in twelve weeks. Saving at this rate, how3 Xmuch would he earn in forty eight weeks? — = — ==> x = 12
® 12 48since (12)(4) = 48 therefore, (3)(4) = 12
Required Knowledge: Knowing the product of means equals product of extremes or solving the problem like working with equivalent fractions.Difficulty: Medium. Solving for unknowns in a word problem will make this difficult.
#52. Word Problem: If a frame is 28 inches wide and 48 inches long, what is the ratioof width to length?
28:48 or 7 : 1 2 if you divide each by 4
Required Knowledge: Knowing how to set up ratios and reduce like fractions.Difficulty: Low to medium. There is no unknown to solve for here.
Beginning Algebra Section - Aligned with the Beginning Algebra Course (Beg. Alg.)
#1. (-11) - (-7) = -11 + 7 = -4Required Knowledge: Operations with positive and negative numbers.Difficulty: Low If a student knows the definition of subtraction, this will be easy.Content: Concept covered in Chapter 1 in Beg. Alg.
#2. -(-3x-2(2y-5)] = -[-3x-2(2y-5)] = -[-3x-4y+10] = 3x+4y-10
Required Knowledge: Operations with positive and negative numbers, order of operations, and distributive law Difficulty: Low to medium.Content: Concept covered in Chapter 1 in Beg. Alg.
#3. (2x+3)(5x-l)= (2x+3)(5x-l)= 10x + 1 5 x - 2 x - 3 = 10x^+13x-3
Required Knowledge: Multiplication of binomials and/or foiling.Difficulty: Low to medium.Content Concept covered in Chapter 3 in Beg. Alg.
#4. 1 + 1 . l + l = X + A = ü l lX y X y xy xy xy
Required Knowledge: Addition with rational polynomialsDifficulty: Medium. Many students may find this problem difficult because it resembles addition with rational numbers which are often difficult.Content: Concept covered in Chapter 2 in Beg. Alg.

B - 153
Beginning Algebra Cont.’
# 5. Solve for x : 2x - 3 = 6x + 13 2x - 3 = 6x + 13-2x-13 = -2x -13 -16 = 4x or X = -4
Required Knowledge: Solving for one variable in an equation.Difficulty: Low to medium. If familiar with concept, this will be an easy problem. Content: Concept covered in Chapter 2 in Beg. Alg.
Required Knowledge: Division of a rational polynomial.Difficulty: Low to medium. If familiar with concept, this wil not be too difficult. Content: Concept covered in Chapter 5 in Beg. Alg. which is later in semester.
5 3 . , _ 10x-3(x + 2) 1 0 x - 3 x - 6 7 x - 6# 7 . --------------- is equal to?
x + 2 2x 2x(x + 2) 2x ^ +4 x 2 x^+4x
Required Knowledge: Operations with rational polynomials and the distributive law.Difficulty: Medium. Similar to Problem #4 but at a higher skill levelContent: Concept covered in Chapter 6 in Beg. Alg. which is in the 2nd half of semester.
#8. Simplify: 2x^y - 3xy - x y - 5xy + 4x^y - T x ^
2x“y - x"y + 4x‘y - 3xy^- 5xy - 7x*'y“ = 5x"y - 8xy" - 7x~y~
Required Knowledge: Grouping of like terms.Difficulty: LowContent: Concept covered in Chapter 2 in Beg. Alg
#9. Factor completely: 8x + 14xy - 4y :
8x" + 14xy - 4y = 2(4x^ + 7xy - 2y^)= 2(x+2y)(4x-y)
Required Knowledge: FactoringDifficulty Medium to high. Factoring is generally a relatively easy process for students at this level, but this problem does not factor very easily.Content: Concept covered in Chapter 4 in Beg. Alg.

B - 154
Beginning Algebra Cont.’
#10. 3 x - 7 = - ^ - ( 4 - x ) solves to x = ?
3x - 7 = - - ( 4 - x) = > = > 2 (3 x - 7 ) = 2 0 - 5x2 1 2
346x — 14 = 20 — 5x = > 11X = 34 = > x = —1 1
Required Knowledge: Appropriate use of proportions, distributive law, and solving for one variable in an equation; or could multiply both sides with 2 to clear the denominator.Difficulty: High. Many students find solving one variable equations with a rational expression more difficult.Content. Concept introduced in Chapter 2 in Beg. Alg. and covered extensively in Int. Alg.
# 1 1 . y V = ? y V = y7
Required Knowledge: The first level of the exponent rule.Difficulty: Low to medium. Once student understands the value of an exponent, this is a relatively easy problem.Content: Concept covered in Chapter 3 in Beg. Alg.
#12. (2x - 3y) equals ?(2x - 3y)“ = (2x - 3y)(2x - 3y) = 4x“ - 12xy + 9y“
Required Knowledge: Squaring a binomial.Difficulty Medium. Though concept is not difficult, students typically omit the middle term. Content: Concept covered in Chapter 3 in Beg. Alg

B - 155
Beginning Algebra Cont.’
#13. — —— — — divides to (using long division)X - 2
2x +5X — 2 |2x" + X —12
2x^ -4 x5x -12 2x + 5 - ^5x -10 ^
-2
Required Knowledge: Long division with a binomial.DifTiculty: High. Many students find this type of problem difficult.Content: Concept covered in Chapter 5 in Beg. Alg. but omitted in Int. Alg. Why used in test if it does not measure a pre-requisite skill for subsequent class?
#,4. simpiiBesto-3x y X - 4
x^ +5x + 6 12xy _ (x+3)(x+2)12xy _ 4(x + 3)3x^y x ^ - 4 3x^y(x-2Xx + 2) x(x-2)
Required Knowledge: Multiplication with rational polynomial expressions, including distributive law, factoring, and canceling.Difficulty: High Students have difficulty with a problem such as this, even in Int. Alg. Content Concept covered in Chapter 5 in Beg. Alg. which is later in semester
#15. (-2x3y)^(xy)^ is equal to ?
(-2x3y)‘ (xy)“ = -Sx^x^y^ = -8x"y^
Required Knowledge: Exponential rules.Difficulty: Medium to high. Once the student knows these rules this is not difficult.Content: Concept covered in Chapter 3 in Beg. Alg.
Comments: Item content alignment seems adequate, other than Problem #13. Long division with a binomial may be presented in Beginning Algebra, but it is omitted in Intermediate Algebra, the subsequent course. Consider examining the apparent redundancy of Problems #4 and #7. There are also no word problems, problems are strictly computational.

B - 156
Intermediate Algebra Section - Aligned with Intermediate Algebra Course (Int. Alg.)
#16. =x"^ x"2
Required Knowledge: Division, exponent rule and working with negative exponents. Difficulty. Medium to high. Students find division and the application of the exponent rule not difficult, but when there is a negative exponent involved, they tend to have more difficulty. Content; Concept introduced in Beg. Alg. and reinforced in Int. Alg. in Chapter 5.
#17. The factors of x^-8 are? (x - 2)(x^ + 2x + 4)
Required Knowledge: Formula for the factoring of the difference of cubes.DifTiculty: High. Most students do not know this formula; definitely out of order.Content: Concept is not covered in Beg. Alg. and not covered in Int. Alg. until midway into the semester, in Chapter 6,
#18. If 3 is divided by 0 the result is: Undefined
Required Knowledge: Division by zero is undefined.Difficulty: Verv low. Most students have little difficulty recognizing this concept.Content: Concept is covered relatively early in both Beg. Alg. and by Chapter 3 in Int. Alg.
#19. The solution set of + 2x - 15 = 0 is
x" + 2x - 15 = (x + 5)(x - 3) = 0 ==> X = -5 and/or x = 3
Required Knowledge: Recognizing that this is a factoring problem and factoring.Difficulty. Medium. The factoring is not difficult; what will be initially difficult perhaps is recognizing that this is indeed a factoring problem.Content: Concept is covered in Beg. Alg., Chapter 4, and reinforced in Int. Alg., Chapter 6
#20. ■ -Jl is equal to ?—yfs ■ ~ — Vl 6 — —4
Required Knowledge: Definition and product of a square rootDifficulty Low to Medium. Once the student knows that radicals with equal indexes can bemultiplied, this would be a relatively easy problem.Content. Concept introduced in 2nd half of semester in Int. Alg., Chapter 8.

B - 157
Intermediate Algebra Cont.’
1 1 1 1 1 1 3 2 5
#21. The product of = x ^ - x ^ = x 2 6 = %6
Required Knowledge: Exponent rule, knowledge of rational exponents, and adding rational numbers.Difficulty High. Most students find working with fractional exponents to be very difficult to understand.Content: This is another new concept introduced late in Int. Alg , Chapter 8.
#22. If — then d equals b d
a c ^ ^ . be— = — = > ad = be ==> d = —b d a
Required Knowledge: Recognizing proportions and the product of the means equals the product of the extremes.Difficulty. Low to medium. Though primarily review, some students have difficulty with any problem that slightly resembles a fraction.Content: This concept is covered in Beg. Alg., Chapter 5, and in Int. Alg., Chapter 6.
#23. The inequality 2x + 5 < 5x - 7 solves to
2x + 5 < 5x - 7 -5x -5 = -5x -5 -3x < -12 ==> X > 4
Required Knowledge: Solving an inequality and reversing the inequality symbol when dividing by a negative number.Difficulty. High. Most students do not remember to reverse the inequality symbol.Content: This is a new concept, covered in Int Alg., early in the semester by Chapter 2.
#24. The solution of 2-Jlx - 3 = 3 is
2\/2x - 3 = 3 — > [2-y/2x -3] = 3“ = > 4(2x - 3) = 9 = >218x - 12 = 9 = > 8x = 21 or X = —8
Required Knowledge: Solving a one variable equation with a radical expression. Difficulty. High. Once they even learn the process, most students forget to square the 2. Content: This concept is introduced in Int. Alg., at the end of the semester, in Chapter 8

B - 158
Intermediate Algebra Cont.’
#25. Solve for x in the system 3x - 2y = 34x + 2y = 4
3x - 2y = 3 4x + 2v - 47x =7 = > X = 1
Required Knowledge: Solving linear systems of two variables.Difficulty. Medium. Students do not remember the process.Content: Concept covered in Beg. AJg., Chapter 8, and reinforced in Int. Alg., Chapter 4.
#26. (a + b)" is equivalent to (a + b)"' = —-—a + b
Required Knowledge: Understanding meaning of negative exponents.Difficulty: Medium. If they comprehend the meaning, this is a relatively easily problem. Content: Concept covered in Beg. Alg., Chapter 3, and reinforced in Int. Alg., Chapter 5.
#27, The lines y = 3x + 5 and 3y + x = 5 are:
In y = 3x + 5 the slope is 3 since already in the slope y-intercept form.In 3y + X = 5 or 3y = -x + 5 or y = (-l/3)x + 5/3. m = -1/3
The slopes are negative reciprocals of each other; they are perpendicular.
Required Knowledge: Slope intercept form, and relationship of slopes when lines are perpendicularDifficulty: Medium. If they remember this relationship and the slope intercept formula, this will be a relatively easy problem.Content Concept covered in Beg. Alg , Chapter 7, and reinforced in Int. Alg , Chapter 3.
#28. The distance between two points: (3,4) and (4,3).
d = V ( 3 - 4 ) ^ + ( 4 - 3 ) 2 =VT+T = V2
Required Knowledge: The formula for the distance between two pointsDifficulty: Medium to hieh. if they remember the formula and how to use it Students typicallyconfuse the application of it.Content: Introduced in Int. Alg., Chapter 3.

B - 159
Intermediate Algebra Cont.’
#29. The statement x(x + y) = (x + y)x illustrates the "Tricky?
Commutative property for multiplication
Required Knowledge: The basic principles of multiplication and addition and must be able to read very carefully.DifTiculty: Verv high. Even though this is not a difficult concept, many students do not recognize that this is simply an application of the commutative property. This researcher used this same problem in a take-home quiz for students in Int. Alg. and very few got it correct.When students apparently see a pair of parentheses, they immediately think of associative rule. Content: This concept is covered in Beg. Alg. and reviewed again in Chapter 1 in Int. Alg.
#30. V9+V 4 =V9 +V 4 =3 + 2 = 5
Required Knowledge: Evaluation of a square root.DifTiculty Low. Most students are capable of this.Content: This concept is reviewed in Int. Alg , Chapter 3 and Chapter 8.
Comments: The Intermediate Algebra test section appears to have adequate item content alignment with course syllabus for Intermediate Algebra.. The problems appear to be randomly distributed according to difficulty. Only one problem, #29, is noted for being particularly difficult at this level for most students. Consider appropriateness.
Advanced Algebra Section - Aligned with Advanced Algebra with Coordinate Geometry(Adv. Alg.) and somewhat with College Algebra with Applications (Col. Alg.)
#31. 8 '^ equals 8'^ = (8'' )' = 2' = 1/4
Required Knowledge: Knowledge of negative and rational exponents.DifTiculty: Medium. Students sometimes have difficulty interpreting the combination of rational and negative exponents.Content: Concept is covered at end of Int. Alg. and reinforced in Col Alg. and Adv Alg.
#32. If f(x)= (3x-5)^ then f(0) equals f(0)= [3(0) - 5 f = (-5)3 =-125
Required Knowledge: Evaluation of the value of a function at a specified value of x, and cubing..Difficulty: Low.Content: Concept is introduced in Int. Alg. and reinforced in Col. Alg. and Adv. AJg.

B - 160
Advanced Algebra Cont.’
#33. (x+1)*^ - (x + 1 )’* is equivalent to
Vx+ 1 Vx + 1 Vx+ 1 Vx + 1
Required Knowledge: Evaluation of negative and rational exponents and completing operations with the same.DifTiculty: High. Students sometimes have difficulty with this concept. Note: Students are taught in Int. Alg. to simplify any expression that has a radical in the denominator. If they remember this, they would go too far and not get the specified answer.Content: Concept is introduced at the end of the semester in Int. Alg., Chapter 8, and reinforced in Col. Alg. and Adv. Alg.
2 - 3i#34. The quotient ——r equals
2 - 3 i 5 - i _ 1 0 - 2 i - 1 5 i - 3 _ 7-17i 5 + i 5 - i “ 25+1 ~ 26
Required Knowledge: Complex numbers, how to simplify by multiplying with the conjugate of the complex number, and evaluation of the value of (i) .DifTiculty Medium to high. Students seem to grasp concept fairly well.Content: Concept is introduced at the end of Int. Alg., Chapter 8, and reinforced in Adv. Alg., in section C, but not evident in Col. Alg.
#35. If f(x) = 3x and g(x) = 1/x, then f[g(x)] =3(l /x) = 3/x
Required Knowledge Evaluation of a function at a function notation.Difficulty: Medium to high. Though perhaps difficult to remember, application is not too difficult.Content: Concept is introduced at the end of Int. Alg., Chapter 8, and reinforced in Adv. Alg., in section C, but not evident in Col. Alg.
#36. The expression ( x log (a) + log (b) ] is equivalent to
[ X log (a) + log (b) ] = log ( a f + log (b) = log (a^b)
Required Knowledge. Definition and application of logarithms.DifTiculty. High. Though logarithms alone are not too difficult a concept to grasp, this is a more difficult problem to evaluate because this combines two rules with operations with logarithms. (I) The sum of logarithms is the logarithm of the product. (2) The logarithm of a number raised to a power is equal to the power times the logarithm of the number.Content: Concept is introduced in the last chapter of Int. Alg. and reinforced in Adv. Alg.
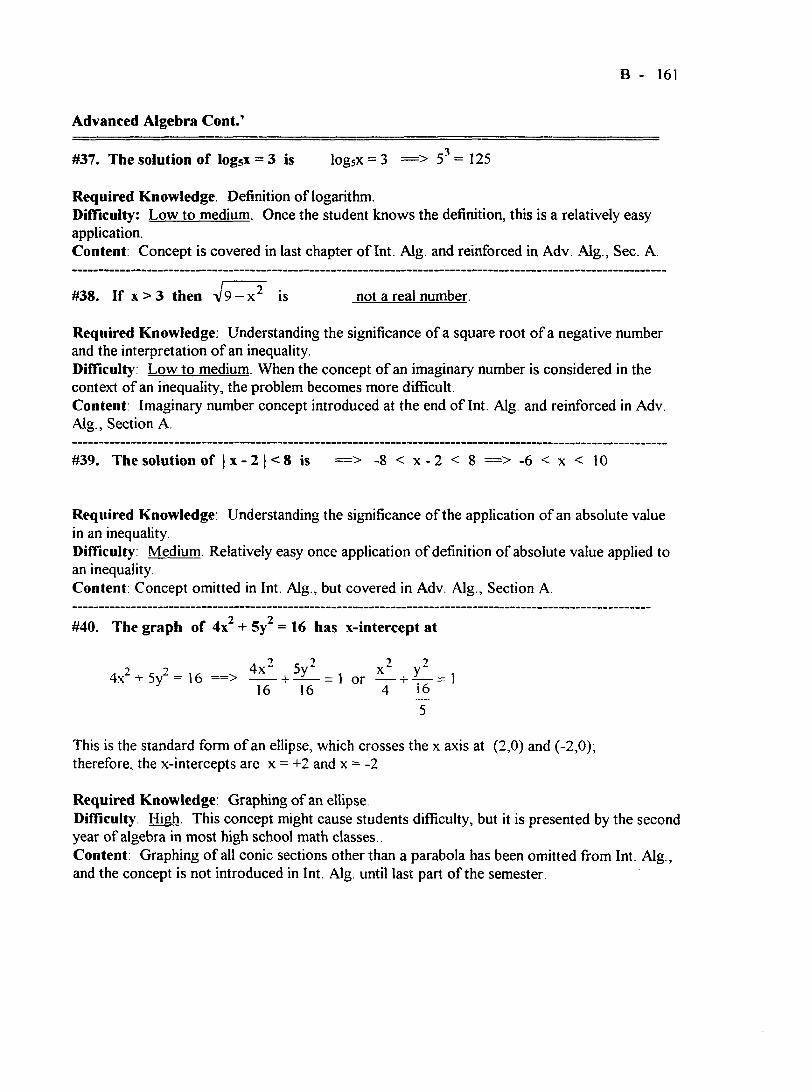
B - 161
Advanced Algebra Cont.’
#37. The solution of logs* = 3 is logsx = 3 = > 5^=125
Required Knowledge: Definition of logarithm.Difficulty: Low to medium. Once the student knows the definition, this is a relatively easy application.Content: Concept is covered in last chapter of Int. Alg. and reinforced in Adv. Alg., Sec. A.
#38. If X > 3 then V9 - is not a real number.
Required Knowledge: Understanding the significance of a square root of a negative number and the interpretation of an inequality.Difficulty: Low to medium. When the concept of an imaginary number is considered in the context of an inequality, the problem becomes more difficult.Content: Imaginary number concept introduced at the end of Int. Alg. and reinforced in Adv. Alg., Section A.
#39. The solution of | x - 2 ] < 8 is = > -8 < x - 2 < 8 = > -6 < x < 10
Required Knowledge Understanding the significance of the application of an absolute value in an inequality.Difficulty: Medium. Relatively easy once application of definition of absolute value applied to an inequality.Content: Concept omitted in Int. Alg , but covered in Adv. Alg , Section A
#40. The graph of 4x + 5y = 16 has x-intercept at
4, ^ 5 / - . 6 =»> + +16 16 4 i6
This is the standard form of an ellipse, which crosses the x axis at (2,0) and (-2,0), therefore, the x-intercepts are x = +2 and x = -2
Required Knowledge Graphing of an ellipseDifficulty. High. This concept might cause students difficulty, but it is presented by the second year of algebra in most high school math classes..Content: Graphing of all conic sections other than a parabola has been omitted from Int. Alg , and the concept is not introduced in Int. Alg. until last part of the semester.

B - 162
Advanced Algebra C ont/
#41. X = + 3 is best illustrated by which of the following graphs:
This would be a parabola with an axis of symmetry about the x-axis, and vertex at point (3,0). The only one that could be close would be figure (a); however, this shows a parabola with a vertex at (0,0).
Required Knowledge; Graphing of a parabola about the x-axis as opposed to the ones described in Math 050 which are true functions.Difficulty Medium to high. Graphing a parabola would not be too difficult but with the figure not exactly right, it could cause the student concern.Content: This concept is not addressed in Int. Alg., but covered in Adv. Alg. in last part o f the semester.
#42. What function best describes the graph?This is a graph of a rectangular hyperbola; therefore, y = 1/x is the appropriate function.
Required Knowledge: Graphing and familiarity with rectangular hyperbolas would be helpful, or the student could reason through the correct answer since various functions are given. Difficulty: High. This is a difficult function to remember; and having the graph and then having to find the relation or function is always more difficult than the reverse.Content: This concept is not presented in Int. Alg., and more than likely covered in conic sections in Adv. Alg. in last part of the semester.
#43. y = -V 16- x is best illustrated by:
y = -V l6 - x by squaring both sides, x“ + y“ = 16
This is a circle with radius of 4; therefore, y = - \ \ b - x^ is the bottom half of the circle, or where the y values are negative
Required Knowledge. Familiarity with the graph of a circle and how to interpret the relation of the same.Difficulty: Medium to High. Translation of the relation into the proper format and recognizing that it is simply a part of a circle might be difficult for some students to remember, but having the relation and then finding the appropriate graph tends to be easier than the reverse.Content: Though concept is not presented in Int. Alg.; it is covered in Adv. Alg.

Advanced Algebra C ont/
B - 163
#44. Evaluate the determinant:1 0 0I 2 31 4 9
12 3 1 3 1 2
-0 - + 0- = 18-12 = 64 9 1 9 I 4
Required Knowledge; Evaluation of determinants.DifTiculty: Medium. If the student remembers how to evaluate a determinant, this is not a difficult application of this concept.Content: Though not presented in Int. Alg., this concept is covered in Col. Alg., even though this would be an appropriate topic for Adv. Alg., it is not stated in the course syllabus.
#45. Identify which relationship is appropriate for the graph
The graph is a hyperbola with vertices on the x-axis. Therefore, the correct equation would
be c or16
Required Knowledge: Ability to recognize the graph and corresponding relationship of a hyperbola.DifTiculty High. Hyperbolas are not difficult to graph, but having a graph and then finding the appropriate relationship is slightly more difficult.Content: Again, this concept is not presented in Int Alg., but it is presented in Adv. Alg. in the last section in the course syllabus.
Comments The Advanced Algebra section of the test seems to have adequate item content validity with Algebra with Coordinate Geometry and only partial or questionable item content alignment with College Algebra with Applications. It has inadequate content alignment with Math for Elementary Teachers and Probability and Statistics. This corresponds with policy.
In terms of problem arrangement according to difficulty, the test problems in this test appear to be randomly distributed. Only one problem is noted for being confusing, #41. The student would be unable to find the exact graph to match the given relation because the graph which is supposed to be correct is drawn with the wrong vertex.

sinG — — — — — ^ — 2^ —1 ^ —3 or x — ->/32 r
B - 164
Trigonometry Section - Aligned with Trigonometry Equations with Coordinate Geometry
#46. The graph of y = 3cos2x is:
Graph of y = cosx has an amplitude of 1 and a period of 2k . The cosine function also has avalue of 1 when x = 0. Therefore, the graph of 3cos2x would have a period of 2tr/2 = k andwould have an amplitude of |3| or 3, with a value of 3 when x = 0 radians.
Knowledge Required: Knowledge of radians, the graph of, and amplitude and period of the cosine function, [y = a cos bx has amplitude of |a| and period of 27t/b ].Difficulty High. Graphing a cosine function becomes much more difficult when both the period length and amplitude have been affected.Content. Concept covered in Section A of Trig.
#47. If sin0 = 1/2 then cos0 is:
1r
V3then C O S 0 = —2
Knowledge Required: Definition of sin and cos functions, relationship between X, y and r, and Pythagorean Theorem.Difficulty Low. These are fairly basic trigonometric concepts.Content: Concept covered in Section A of Trig.
#48. Sin^30 + cos‘30 equals:
One of the fundamental trigonometric identities is sin^A + cos^A = 1. In this case, let A = 30; therefore, sin^30 + cos^30 = 1.
Knowledge Required: Knowledge of trigonometric identities.Difficulty Low This is a fairly basic trigonometric identity.Content: Concept covered in Section B of Trig.
#49. The maximum value of 2sin0 is:
The amplitude of sin0 is 1 ; therefore, the maximum value or amplitude of 2sin0 = 2.
Knowledge Required: Understanding of magnitude of values and amplitude of sin functions. Difficulty: Low. This is a fairly basic trigonometric concept.Content: Concept covered in Section A of Trig.

B - 165
Trigonometry Cent.’
#50. 3(cos 90° + i sin 90° ) is equivalent to:
By definition, the cos 90° = 0 and the sin 90° = 1; therefore, 3 (cos 90° + i sin 90°) = 3i
Knowledge Required: Applying the distributive rule to basic value of cosine and sine of 90° Difficulty: Low to medium. Once the student knows these two basic values of cos and sin, this would not be a difficult problem; all that remains is applying the distributive rule. Content: Concept covered in Section C of Trig.
#51. Sin(7C + 0) =
By definitions of radians, n - 180°. Therefore, we are evaluating the sin values after 180° or starting in Quadrant III, where the y values are negative, making the sin values negative as well. Answer would be - sinB
Knowledge Required: Value of radians and sine function.Difficulty: Medium. Solving this problem will take somewhat more thought than the others previous to this. Quadrant effects on corresponding values of y will need evaluation.Content: Concept covered in Section A of Trig.
#52, Sin (-1), which is equivalent to arcsin(-l), has the value of:
The arcsin(-l ) or the inverse sine function is defined to be what angle will have a sine value of - n Sine has a negative value in Quadrant III or IV, sin 90° = 1 while sin 270° or sin -n/2 = - I.
Knowledge Required: Inverse trigonometric functions and evaluation of negative sine values. Difficulty: Medium to high. Inverse trigonometric functions are slightly more difficult to comprehend.Content: Though not stated specifically in course syllabus, concept is fairly basic
#53. If sin20 = 1, then a possible value of 0 is:
The sine function equals 1 at 7t/2 or 90°. If 20 = 90° then 0 = 45°
Knowledge Required: Knowledge of sine values.Difficulty. Low. Once the student understands the basic sine value, this becomes basically a substitution and simple algebraic problem.Content. Concept covered in Trig., Section A.

B - 166
Trigonometry Cont.’
#54. If cos2A = 1 - 2sin^A, then cos 60" is:
If cos2A = 1 - 2sin^A then cos 60" = 1 - 2sin^ 30"
Knowledge Required: Substitution and how to interpret a trigonometric expression.Difficulty. Low. This requires minimal background in trigonometry other than to understand how to interpret the equation.Content: Concept covered in Trig., Section A.
#55. The polar coordinates (2,135" ) have rectangular coordinates of:
The polar coordinates of (2, 135° ) are located in Quadrant II, where the x values are negative and the y values are positive. Therefore, 135" is the same as evaluating 45" but in Quadrant II. Since in a 45° - 45" - 90" triangle, the x and y values measure the same length and in this case x + y = 2^or x + y^=4 = > y^+y^= 4 = > = 2 or y=V2In conclusion, the rectangular coordinates are (-a/2 , ^2 ).
Knowledge Required: Interpretation of polar coordinates; determination of trigonometric values of 45° and recognition of values of rectangular coordinates.Difficulty:. Medium to high. Concept is sometimes difficult for students to remember. Content: Concept covered in Section E of Trig.
#56. Which of the following (graphs) best describes y = 2tan (x):
The tangent function is defined as y/x such that when x is 0 the tangent function is undefined or approaches infinity since division by 0 is undefined. When y = 0, the value of tangent would be 0. Therefore, in evaluation with radians, when (x) = 0 radians or 0",X = 1 and y = 0; therefore, tan (0°) = 0. When (x) = k/4 or 45", tan (ti/4) = 1.When (x) = n/2 or 90", x = 0 and y = I; therefore, tan (ir/2) is undefined or the graph of the function would approach infinity.
Using this information for evaluation of y = 2tan (x):2tan(-7T/2) = undefined, 2tan(-7r/4) = -2; 2tan(0) = 0; 2tan(7r/4) = 2,
2tan(%/2) = undefined The only graph that fits this description is graph (a)
Knowledge Required: Definition and graph of the tangent functionDifficulty: High. Because the graph of the tangent function has asymptotes at every tc/2 + 2k ,
it tends to be more difficult to graph than the cos or sin functions. Then the student would have to analyze what effect if any the 2 would have on the function.Content: Concept covered in Trig , Section A.

B - 167
Trigonometry Cont.’
#57. Knowing that cos(A+B) = (cosA)(cosB) - (sinA)(sinB), then cos(6 + 90”) =
Since cos 90” = 0 and sin 90° = 1, then cos(6+90”) = (cos0)(cos9O°)-(sin0)(sin9O°) which equals (cos0)(O) - (sin0)(l) = - sin0.
Knowledge Required: Value of sine and cosine at 0” and 90°.Difficulty Low. Again, this requires just basic trigonometry information and substitution. Content: Concept covered in Trig., Section A.
#58. The value of cosStt =
By definition of radians, n = 180°, therefore, 3n = 540°. This is identical to evaluation of cos 180°, where the x value is -1 ; y value is 0; and r = 1. Since cos = x/r = -1/1 = -1.
Knowledge Required: Definition of radians and value of cosine at 180°.Difficulty: Low to medium. Solving this problem uses basic concepts and some thought. Cantent: Concept covered in Trig , Section A.
#59. (CSC0 - sec0)(sin0)(cos0) is:
Csc0 = l/sin0 and sec0 = l/cos0. By substitution,(csc0 - sec0)(sin0)(cos0) = (l/sin0 - l/cos0)(sin0)(cos0) = cos0 - sin0 (sin01tcos01
(sin0)(cos0) 1
or COS0 - s in 0
Knowledge Required: Definition of csc0 and sec0.Difficulty. Low. The problem can be solved with substitution and the basic definitions Content: Concept covered in Trig., Section A..
#60. Given a right triangle with hypotenuse = 1, adj leg = b, opp leg = h, which of the following statements would be true:
The answers all use sin and tan; tan 0 = h/b or h = b tan 0
Knowledge Required: Basic definitions of sin and tan.Difficulty . Low to medium. By using the definitions of sin and tan of an angle and solving for various components of each, the correct statement can be found.Content: Concept covered in Trig , Section A.

B - 168
Trigonometry Cont.’
Comments: Item content alignment with stated curriculum for Trigonometric Equations with Coordinate Geometry seems adequate. This researcher did not have access to the appropriate text for this course and has not taught the class; all interpretations on content appropriateness were accessed from the course syllabus.
None of the concepts that are addressed in this portion of the test are presented in Advanced Algebra with Coordinate Geometry, which is considered the course pre-requisite, but this researcher found that all concepts were adequately covered in an example of a second year high school algebra text. Algebra 2 with Trigonometrv. (Hall & Fabricant, 1991).
The problems in this section of the test seem to be randomly distributed according to difficulty, with what aopears to be one of the most difficult problems located first.

C-169
Appendix C
Summary of Subjective Difliculty Ratings CC Mathematics Placement Test Problems
Though it would be more appropriate to have quantitative measures such as difficulty indexes or discrimination indexes for each test problem, these statistics are not available at this time. The following is a summary of the subjectively assigned relative difficulty ratings for each problem. These ratings consist of the following levels according to relative difficulty:(a) very low, (b) low, (c) low to medium, (d) medium, (e) medium to high, (f) high, and (g) very high.
Basic Mathematics - Fractions Basic Mathematics - Decimals
1. Low 6. Med. to High 11. Low 16. Low to Med.2. Low 7. Med. to High 12. Low 17. Medium3. Low 8. Very High 13. Low 18. High4. Low 9. Medium 14. Very Low 19. High5. Medium 10. High 15 Low
Basic Mathematics - Percentages Basic Mathematics - Measurements
20 Low to Med. 25. Med. to High 28 Low to Med. 33. High21 Low 26. Med. to High 29. Low 34. Low to Med.22 Low to Med. 27. Medium 30. Low 35. Low23 Med. to High 31. Low 36 Low to High24 High 32. Med to High
Basic Mathematics - Metrics and Conversions Basic Mathematics - Ratios
37. Low to Med. 42. Very High 45. Very Low 50. Medium38 Low to Med 43. Very High 46. Low 51 Medium39 Low to Med 44. Very High 47. Low 52. Low to Med.40 Low to Med. 48. Low41 Medium 49. Medium
Beginning Algebra Intermediate Algebra
1. Low 9, Med to High 16. Med. to High 24. High2. Low to Med. 10. High 17. High 25. Medium3. Low to Med. 11. Low to Med. 18. Very Low 26. Medium4. Medium 12. Medium 19. Medium 27. Medium5. Low to Med. 13. High 20. Low to Med. 28. Med. to High6. Low to Med. 14. High 21. High 29. Very High7. Medium 15. Med. to High 22. Low to Med. 30. Low8. Low 23. High

Advanced Algebra
31.32.33.34.35.36.37.38.
MediumLowHighMed. to High Med. to High HighLow to Med. Low to Med.
39. Medium40. High41. Med. to High42. High43. Med. to High44. Med.45. High
C-170
Trigonometry
46. High47. Low48. Low49. Low50. Low to Med.51. Medium52. Med. to High53. Low
54. Low55. Med. to High56. High57. Low58. Low to Med.59. Low60. Low to Med.

D - 171
Appendix D Item Content Summary
CC Mathematics Placement Test
Beginning Algebra SectionProb. Concept Review/New Covered
#1 Operations with Positive and Negatives New? Chapter 1#2 Operations, Order, and Distributive Property New? Chapter 1#3 Multiplication of Binomials New Chapter 3#4 Addition of Rational Polynomial New Chapter 2#5 Solving for One Variable New Chapter 2#6 Division of a Rational Polynomial New Chapter 5#7 Rational Polynomial Operations and Factoring New Chapter 6#8 Grouping of Like Terms New Chapter 2#9 Factoring into Binomials New Chapter 4
#10 Solving for One Variable with Rational Coefficient New Chapter 2#11 Exponent Rule in Multiplication New Chapter 3#12 Squaring Binomial New Chapter 3#13. Long Division with a Binomial New Chapter 5#14. Multiplication with Rational Polynomials New Chapter 5#15 Exponent Rules in Multiplication New Chapter 3Note; The questioned items are covered in Basic Math & Pre-Algebra if the student took the class.
Intermediate Algebra SectionProb. Concept Review/New Covered#16 Negative Exponents and Division Rule Review Chapter 5#17 Factoring Difference of Cubes New Chapter 6#18 Division by Zero Review Chapter 3#19 Factoring and Zero Principle Review Chapter 6#20 Product of Radicals with Like Indexes New Chapter 8#21. Product with Fractional Exponents New Chapter 8#22 Product of Means Equals Product of Extremes Review Chapter 6#23 Solving Inequality of One Variable New Chapter 2#24 Solving Equation with Radical Expression New Chapter 8#25 Solving Systems of Two Variables Review Chapter 4#26 Evaluate an Expression with a Negative Exponent Review Chapter 5#27 Determine Slopes: Parallel or Perpendicular Lines Review Chapter 3#28 Determine Distance Between Two Points New Chapter 3#29 Commutative Property of Multiplication Review Chapter 1#30 Determine Value of Radical Expression Review Chapter 3,8

D - 172
Advanced Algebra SectionProb. Concept Review/New Covered#31 Negative and Positive Exponents Review Math 109, 111#32 Evaluation of Value of Function Review Math 109, 111#33 Evaluation of Rational Exponents Review Math 109, 111#34 Evaluation of Complex Number Expression Review Math 111#35 Conjugate Functions Review Math 111#36 Definition and Application of Common Logarithms Review Math 111#37 Definition of Logarithm Review Math 111#38 Defintion and Application of an Imaginary Number Review Math 111#39 Application of an Absolute Value in an Inequality New 111-Sec A#40 Graphing an Ellipse New 111-Sec F#41 Graphing a Parabola Relation New 111-Sec F#42 Graphing a Rectangular Hyperbola New 111-Sec F#43 Graphing a Part of a Circle New 111-Sec F#44 Evaluation of a Determinant New 111-Sec A?#45 Graphing a Hyperbola New 111-Sec FNote: Questioned item is not stated in vitae but is a fairly basic concept.
Prob. Concept Review/New Covered#46#47
Graph of Cos x with Adj. Amplitude and Period Definition of Sine and Cosine Function and
New 112-Sec A
Pythagorean Theorem New 112-Sec A#48 Trigonometric Identity New 112-Sec B
#49 Magnitude and Amplitude of Sin 0 New 112-Sec A#50 Basic Values of Sine and Cosine Functions New 112-SecC#51 Value of Radians and Sine Function New 112-Sec A#52 Knowledge of Arcsine New 112-Sec A*’#53 Knowledge of Basic Sine Function Values New 112-Sec A#54 Interpretation of a Basic Trigonometry Expression New 112-Sec A#55 Polar and Rectangular Coordinates New 112-Sec E#56 Graph of Tangent Function with Adjusted Amp. New 112-Sec A#57 Value of Sine and Cosine of 0° and 90°. New 112-Sec A#58 Definition of Radians and Value of Cos 180". New 112-Sec A#59 Definition of C sc 9 and Sec 6 New 112-Sec A#60 Definition of Tan 0 and Sin 0. New 112-Sec ANote: Questioned item is not addressed specifically in vitae but is a basic concept.

G R A N D V A L L E Y ST A T E U N IV E R SIT Y
E D 695 D A TA FO R M
NAM E: Bonnie E. Morris
M AJOR: (Choose only 1)
Ed Tech Ed Leadership X Sec/AdultElem Ed G/T Ed _______ Early ChildElem LD Sec LD _______ SpED PPI
TITLE: Mathematics Placement at a Community College
PAPER TY PE (Choose only 1) SE M /Y R C O M P L E T E D Winter 1995
_______ ProjectX Thesis
S U P E R V ISO R ’S S IG N A T U R E O F APPRO VAL: > / / r1 0
Using the E R IC thesaurus, choose as many descriptors (5-7 minimum) to describe tlie contents o f yourpaper.
1. Student Placement 6. College Entrance Exams
2 Higher Education 7. Mathematics Achievement
3 Matliematics Tests 8. Test Validity
4 Screening Tests 9 Standardized Tests
5. College Mathematics 10. Math Placement
A B ST R A C T T w o to three sentences that describe the contents o f your paper
This study consisted o f the assimilation o f the current best knowledge o f qualities required o f a
mathematics assessment that is used in placement and applying that knowledge to the analysis o f a
locally designed math placement test. _____________________________________________________
** Note: This page must be included as the last page to your master’s paper.
rev 5/94
libristu
Text Box