Mathematical Programming Approaches for Modeling a ...
44
Mathematical Programming Approaches for Modeling a Sustainable Cropping Pattern under Uncertainty: A Case Study in Southern Iran Mostafa Mardani Najafabadi Agricultural sciences and natural resources university of Khuzestan Niloofar Ashktorab ( [email protected] ) agricultural sciences and natural resources university of Khuzestan https://orcid.org/0000-0002-2855- 879X Research Article Keywords: Sustainable Cropping Pattern, Uncertainty, Robust Optimization, Controlled Estimation Method, Khuzestan. Posted Date: May 5th, 2021 DOI: https://doi.org/10.21203/rs.3.rs-440647/v1 License: This work is licensed under a Creative Commons Attribution 4.0 International License. Read Full License
Transcript of Mathematical Programming Approaches for Modeling a ...

Mathematical Programming Approaches forModeling a Sustainable Cropping Pattern underUncertainty: A Case Study in Southern IranMostafa Mardani Najafabadi
Agricultural sciences and natural resources university of KhuzestanNiloofar Ashktorab ( [email protected] )
agricultural sciences and natural resources university of Khuzestan https://orcid.org/0000-0002-2855-879X
Research Article
Keywords: Sustainable Cropping Pattern, Uncertainty, Robust Optimization, Controlled Estimation Method,Khuzestan.
Posted Date: May 5th, 2021
DOI: https://doi.org/10.21203/rs.3.rs-440647/v1
License: This work is licensed under a Creative Commons Attribution 4.0 International License. Read Full License

1
Mathematical Programming Approaches for Modeling a Sustainable 1
Cropping Pattern under Uncertainty: A Case Study in Southern Iran 2
3
Mostafa Mardani Najafabadia and Niloofar Ashktorabb* 4
5 a,b Department of Agricultural Economics, Faculty of Agricultural Engineering and Rural 6
Development, Agricultural Sciences and Natural Resources University of Khuzestan. 7
8 a Assistance professor of agricultural economics 9
Mobil phone number: +98 913 2309540 10
E-mail address: [email protected] or [email protected] 11
Linkedin: https://www.linkedin.com/in/mostafa-mardani-najafabadi-a995691bb/ 12
P.O. Box: 6341773637, Mollasani, Iran. 13
14 b* Corresponding author: Assistance professor of agricultural economics 15
E-mail address: [email protected] or [email protected] 16
Mobil phone number: +98 9171074484 17
Linkedin: https://www.linkedin.com/in/niloofar-ashktorab-a4315680/ 18
P.O. Box: 6341773637, Mollasani, Iran. 19
ORCID: 0000-0002-2855-879X 20
21
22
23
24
25
26
27
28
29
30
31
32
33
34
35
36

2
Mathematical Programming Approaches for Modeling a Sustainable 37
Cropping Pattern under Uncertainty: A Case Study in Southern Iran 38
Abstract 39
In recent years, the excessive and unreasonable use of chemicals, the occasional use of water, and the 40
use of improper irrigation methods have created a worrying and unstable situation in developing 41
countries' agricultural activities. In the present study, the robust multi-objective fractional linear 42
programming model (RMOLFP) was introduced to determine the sustainable optimal cropping pattern. 43
This model was presented in the Gotvand irrigation and drainage network located in Khuzestan 44
province, southern Iran, under two scenarios with and without considering the uncertainty to evaluate 45
the ability of the model. The results showed that in the first scenario, the consumption of critical 46
disruptive inputs of sustainable agriculture such as fertilizers and chemical pesticides decreased by 5.9% 47
and 8.19%, respectively. On the other hand, the model's uncertainty condition was applied in the second 48
scenario in which the increase in gross margin was reduced. There is a trade-off between protecting the 49
optimization model against system uncertainty and gross margin. Finally, the ability of the proposed 50
model to apply uncertainty conditions was verified by the Monte Carlo simulation method. The results 51
of this simulation confirmed the use of the RMOLFP method in determining the sustainable optimal 52
cropping pattern for the study area. 53
54
Keywords: Sustainable Cropping Pattern, Uncertainty, Robust Optimization, Controlled Estimation 55
Method, Khuzestan. 56
Subject classification codes: C02, C61, C83, Q1, Q56. 57
1. Introduction 58
Over the last five decades, agricultural development policies have increased agricultural production; 59
however, the use of disruptive inputs such as pesticides, fertilizers and agricultural machinery has 60
gradually replaced natural resources available inside farm M. Li et al. (2020). The issue of sustainable 61
agriculture has been emphasized by numerous international organizations and has led to positive 62
environmental, economic and social impacts (Tseng, Chiu, Tan, & Siriban-Manalang, 2013). Due to 63

3
the economic perspective, the emphasis on sustainable production has been increasing agricultural 64
inputs' productivity and improving and diversifying market opportunities (M. Li et al., 2020). 65
One of the approaches to achieve the optimum use of off-farm inputs and disrupt the sustainable 66
agriculture process is to determine the optimum utilization of inputs by establishing a sustainable 67
optimal cropping pattern (X. Li et al., 2017). Figure 1 shows the main purposes of studies that focus on 68
the sustainable production aspect of agricultural products also implicitly consider other objectives of 69
crop pattern studies. The explanation for this claim lies in the definition of sustainability provided in 70
Guideline 21 at the United Nations Conference of Environment and Development (UNCED) in 1992. 71
In this definition, sustainability was presented in ecological, economic and social dimensions (Mardani 72
Najafabadi, Abdeshahi, & Shirzadi Laskookalayeh, 2020). 73
Ecological sustainability means maintaining the ability of the system to adapt to the environment 74
fully and its changes. Therefore, Studies focusing primarily on environmental considerations emphasize 75
this aspect of sustainability (Mardani Najafabadi, Ziaee, Nikouei, & Ahmadpour Borazjani, 2019). 76
Sustainability in the economic dimension is a crucial concept in sustainable development literature. One 77
of the most important objectives to be achieved in this dimension is to increase farmers' gross profit. In 78
most developing countries, the agricultural sector tends to increase agricultural output while reducing 79
unemployment (Mardani, Ziaee, & Nikouei, 2018). This is due to the country's food security and the 80
reduction of the adverse social effects of unemployment (Mardani Najafabadi et al., 2019). Thus, the 81
two remaining goals (food security and employment) can be considered in the social dimension of 82
sustainability. 83

4
84
Figure 1. Tree dimensions of sustainable optimal cropping pattern 85
Considerable studies have been carried out to optimize the allocation of arable land using 86
mathematical programming techniques in different regions of the world. Most of the studies have used 87
linear programming models (Wineman & Crawford, 2017), goal programming (Mardani, Esfanjari 88
Kenari, Babaei, & Asemani, 2013) and multi-objective programming (Ren, Li, & Zhang, 2019). 89
On many practical issues such as quantitative sustainability indicators, optimizing 90
the ratio of criteria than each criterion alone provides a better vision (Mardani 91
Najafabadi et al., 2020). Fractional programming is the most common mathematical 92
programming with relative objectives. On the other hand, the existence of different 93
criteria in relational objectives have also led to the development of multi-objective 94
linear fractional programming models. This approach has been used in various studies 95
in agricultural management. For example, in the study of Zhang et al. (2017), the 96
GFCCFP method was used to optimally allocate irrigation water in the Heihe basin in 97
northwest China. CONNISE method has been used in their study to find optimal 98
solutions. This method is defined based on the estimation of weak efficient boundaries 99
in the objectives space, including some points of feasible set (Gorissen, 2015). The 100
distance between these points should not exceed the value previously provided. This 101

5
method is beneficial for finding efficient solutions, but in problems with more than two 102
objectives, the optimal solutions lose their convergence, and the final solution is 103
challenging to find. This problem can be solved by controlling the distance considered 104
for a predetermined error using the Controlled Estimation Method (CEM) method 105
proposed by Caballero and Hernández (2004). 106
The agricultural uncertainties are traditionally classified in areas such as production 107
management, marketing and investment (Mardani Najafabadi et al., 2020). The 108
application of fractional programming under uncertainty in agricultural management is 109
widespread. In the meantime, the use of fuzzy, interval, gray, stochastic or a 110
combination of these methods are more common (Tan & Zhang, 2018; Wang, Liu, Guo, 111
Yue, & Guo, 2019). 112
In the mid-1990s, the issue of creating conservatism in mathematical programming 113
models was introduced by limiting uncertain parameters (Ben-Tal & Nemirovski, 114
2000). The benefits of using robust optimization are reporting point-based optimal 115
solution (confronting the optimal interval solutions in interval programming) (M. 116
Sabouhi & Mardani, 2017) and lack of awareness of the data distribution (the challenge 117
of coping with the need to be aware of the data distribution in the stochastic 118
programming) (Mardani Najafabadi & Taki, 2020). 119
Recently, a wide range of robust optimization applications in the management of 120
water resources and agricultural land have been implemented. For the first time, this 121
method was used in fractional programming by Gorissen (2015). Tan and Zhang (2018) 122
optimized the allocation of water resources and agricultural land using robust fractional 123
programming to increase water-use efficiency in the arid northwest region of China. It 124

6
should be noted, however, that in both studies, single-objective fractional programming 125
is considered, and the problem of drastically losing the convergence of the optimal 126
solutions in multi-objective fractional programming in their methods remains. Using 127
CEM can be an appropriate approach to address this defect and enable the application 128
of robust multi-objective fractional programming to provide a sustainable optimal 129
cropping pattern. 130
Gotvand irrigation and drainage network is located in southwestern Iran in Khuzestan 131
province. According to official statistics from government agencies, fertilizer and 132
pesticides used in the lands covered by this network is 3.6 times the average in Iran 133
(Anonymous, 2018). The surplus irrigation water in the network is returned to the rivers 134
by drainage, contaminate water with a surplus of fertilizers and pesticides in 135
downstream of the network (Mardani Najafabadi et al., 2020). Due to the mentioned 136
issue, selecting this region to determine the cropping pattern that leads to optimal use 137
of disturbing inputs to sustainable agriculture, seems appropriate. Besides, the irrigation 138
water consumption is better managed in this network. 139
Therefore, the purpose of the present study was to propose a mathematical 140
programming model to determine the sustainable optimal cropping pattern for the 141
Gotvand irrigation and drainage network covered land. For this purpose, a robust multi-142
objective fractional linear programming model (RMOLFP) was proposed. Thus, the 143
innovation and importance of this study can be examined in two respects; first, a new 144
mathematical programming model for optimal cropping pattern with emphasis on 145
sustainability has been proposed, and second, a detailed plan has been prepared for an 146
area that desperately needs a revision of the cropping pattern. 147
7
2. Methodology 148
2.1 Study Area 149
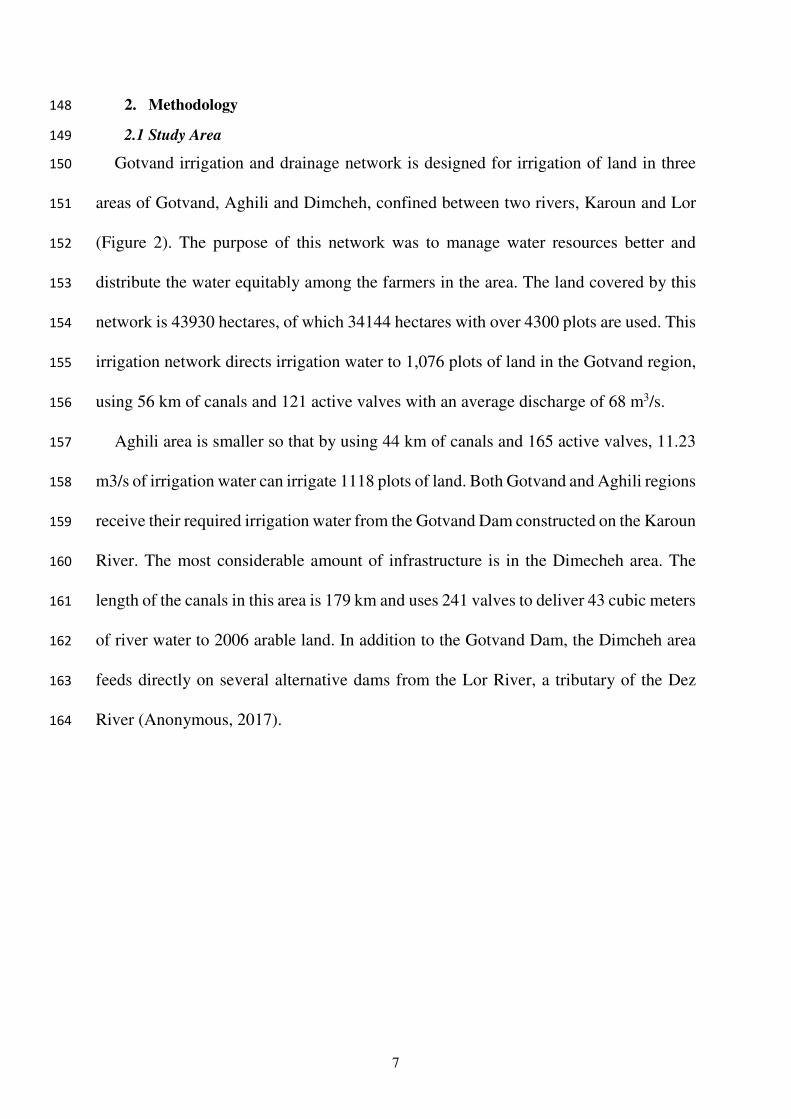
Gotvand irrigation and drainage network is designed for irrigation of land in three 150
areas of Gotvand, Aghili and Dimcheh, confined between two rivers, Karoun and Lor 151
(Figure 2). The purpose of this network was to manage water resources better and 152
distribute the water equitably among the farmers in the area. The land covered by this 153
network is 43930 hectares, of which 34144 hectares with over 4300 plots are used. This 154
irrigation network directs irrigation water to 1,076 plots of land in the Gotvand region, 155
using 56 km of canals and 121 active valves with an average discharge of 68 m3/s. 156
Aghili area is smaller so that by using 44 km of canals and 165 active valves, 11.23 157
m3/s of irrigation water can irrigate 1118 plots of land. Both Gotvand and Aghili regions 158
receive their required irrigation water from the Gotvand Dam constructed on the Karoun 159
River. The most considerable amount of infrastructure is in the Dimecheh area. The 160
length of the canals in this area is 179 km and uses 241 valves to deliver 43 cubic meters 161
of river water to 2006 arable land. In addition to the Gotvand Dam, the Dimcheh area 162
feeds directly on several alternative dams from the Lor River, a tributary of the Dez 163
River (Anonymous, 2017). 164

8
165
166
Figure 2. Schematic of the Gotvand irrigation and drainage network 167
168
2.2 Multi-objective Fractional Linear Programming 169
Fractional linear programming is a type of fractional programming, and the numerator and 170
denominator of the objective function is affine Function (AF), and the possible set is a convex 171
polyhedron. A multi-objective linear fractional programming is presented as Eq. (1): 172
Max 1 11
1 1
, .,
ttp p
pt t
p p
c xc xx x
d x d x
(1) 173
s.t. Ax ,b 174
x 0, 175
Where c and d are the coefficients of the objective function, α and β are the constant 176
components, A is the technical coefficient matrix, x is the decision variable, and b is right-sided values. 177
The CONNISE method, which combines the constraint method (CON) and the Non-inferior Set method 178

9
(NISE), can be used to find optimal solutions to multi-objective optimization problems. This method is 179
also used for multi-objective fractional linear programming. 180
Assuming that in multi-objective programming, E is efficient set while wE is weak efficient set. 181
The CONNISE method is defined based on the estimation of weak efficient boundaries including points 182
of the set of possible zones in the objective space ( wE ). The distance between possible points 183
should not exceed a certain value. 184
Although the CONNISE method was very useful for finding efficient solution but in problems with 185
more than two aims, the solutions lose their convergence so finding the final solution is very difficult. 186
This problem can be solved using the Controlled estimation method (CEM). In this method, the intended 187
interval for the predetermined error is controlled. The CEM algorithm which is consists of 7 steps, 188
proposed by Caballero and Hernandez (2004). 189
In the first stage, the ideal and non-ideal points (the pay-off matrix) are obtained. The boundaries of 190
objective space are formed between ideal ( *
iD ) and non-ideal ( iD ) values. In the second stage,191
*
1, , max ,
i ii p
is calculated, where
*
i and i are ideal and non-ideal values in the objective 192
space, respectively. At this stage, acceptable percentage of error for the interval between possible points 193
(d) is considered by the decision maker and finally,1
d
is calculated. Then, s= and A= sets are 194
defined that s is points of current estimation and A is loose points. In the third stage, m=E(1
d) is 195
calculated in which E(1
d) is integer part of
1
d. By using Parametric Constraints Method (PCM) and 196
m number, set s iteration is achieved. 197
In the fourth stage is calculated where 0,1ò , assume that s= 1, , kx x , K=1,…,N, 198
and K J . If for any i=1,…,p, */j k
i i i ix x , inequality is established, k
x point 199
is eliminated from S set. This process will continue until many points left in the set S. This step is known 200
as the filtering step. In the fifth step, it is assumed that s= , ,i Nx x and for each ,j
x J=1,…,N, the 201

10
endpoint (k
x ) corresponding to (j
x ) is found in the objective space. If 1, ,
max j k
i ii p
x x d
, 202
jx is unstable point and then
jx is placed in set A. This stage is repeated for all
jx . If A is null, this 203
process is over, otherwise the sixth step is started and m that is obtained from third stage, considered as 204
m+1. If A= 1, , mx x , for each
jx belongs to A,considered instead
jx point, which is closer to
kx 205
(in stage four). This stage is repeated for all points in set A. Ultimately, in stage seventh, set A= is 206
obtained and it goes to step three. 207
2.3 Robust Optimization 208
In the present study, robust optimization applies the uncertain conditions to the proposed parameters. 209
The linear form of the robust optimization model can be written as Eq. (2) (Ben-Tal & Nemirovski, 210
2000): 211
Maximize cx 212
Subject to .
1
,n
j j i
j
a x b
% ,i
i j J (2) 213
.l X u 214
Where iJ is a subset of the parameters associated with the uncertain parameter ija% which is specified 215
for each constraint i. Assume that ija% are independent, symmetric and their boundaries are in the range 216
of [-1, 1]. 217
Eq. (2) can be rewritten as robust optimization model that improves the reliability of systems under 218
uncertainty (Bertsimas, Iancu, & Parrilo, 2010): 219
Maximize cx 220
Subject to , ij i i ia x B x b i n
(3) 221
0x 222
Where 223
1ˆ,
n
i i j ij ijjB x Max x a u
224

11
S ubject to 1
n
ij iju i
(4) 225
0 1iju 226
Where for each j, *
j jy x . In Model (5), ij j iia x bn
is presents ith constraint in terms of 227
certainty. This model is based on a nonlinear form of robust optimization model. The reason for the 228
nonlinearity of this model is additional maximization expression. This maximization statement by the 229
controlling parameter of the amount of conservatism ( i ) guarantees the model's reliability against 230
uncertainty. calculating, the linear form of Model 5 is used to avoid the complexity of calculations in 231
the maximization expression as follows (Bertsimas et al., 2010): 232
And finally, the form of robust optimization is model (5): 233
Maximize cx ij jisubject to a x
n
234
, , \, ˆ ˆ
iii i i i i i i i i
ij j i i it t ij SS t S J S t J S
max a y a y b i
(5) 235
, j j j iy x y j J 236
,l X u 0y 237
238
Maximize z cx 239
i
ij j i i ij ij j Jsubject to a x z p b i
240
i, ,ˆ ji ij ij j iz p a y J ò 241
jj j jy x y (6) 242
jj j jl x u 243
, , 0 i, j,ij j i ip y z J ò 244
Where z, f and p are non-negative additional variables and ε is a given uncertainty level in the model. 245
In model 7, which is a linear form of optimization, variables and constraints are 246
existed. The degree of confidence in the model against uncertainty depends on the parameters i . If 247
1 kn nkm

12
0i , the maximization statement is eliminated and the constraint condition is changed from 248
uncertainty to certainty. If i ij the degree of system protection against uncertainty is maximized 249
and fully implemented. There are different values for i and it depends on the probability level of the 250
deviation of ith constraint ( ip ) and the number of uncertain parameters (n). Eq. (7) shows this 251
dependence (Bertsimas et al., 2010). 252
11 1j ip n (7) 253
Where is cumulative distribution of the standard Gaussian variable and n is uncertainty resources 254
in each constraint. 255
2.4 Application of RMOLFP Method to Optimal Sustainable Cropping Pattern 256
2.4.1 Objective Function 257
In order to optimize the cropping pattern and align this model with the relative objectives, the 258
objective functions in the present study are defined as Eq. (8): 259
1 1 1
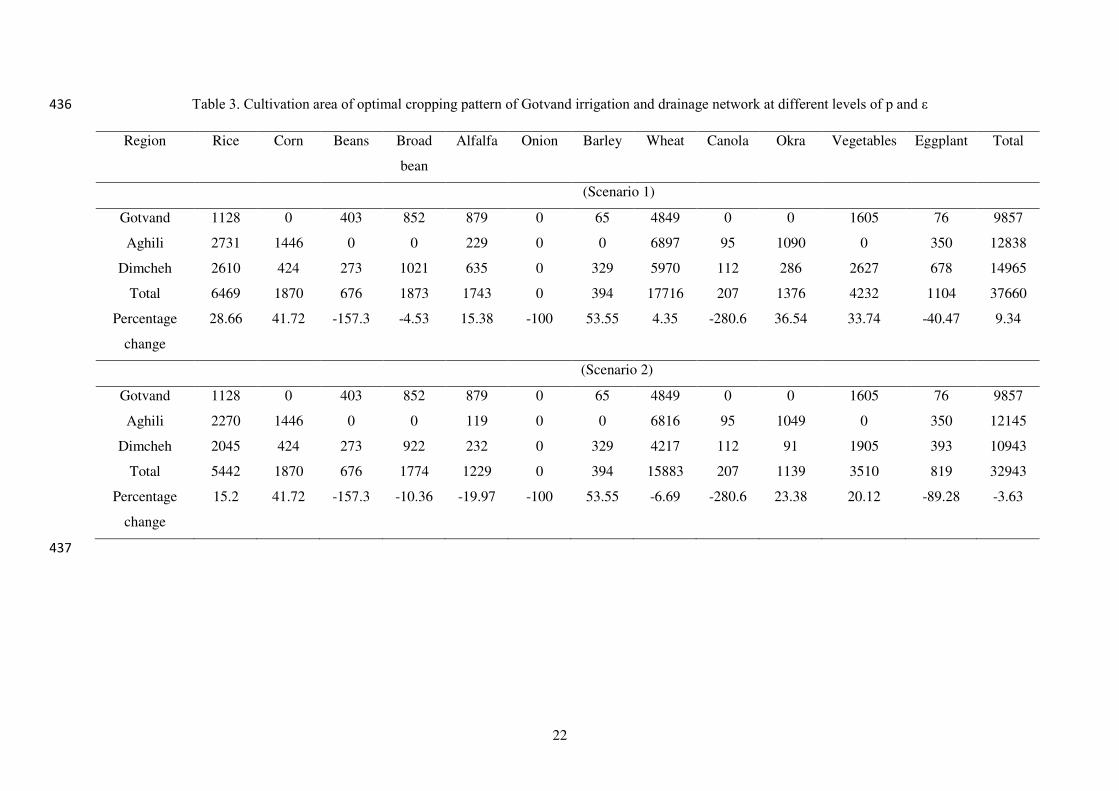
1 3
1 1 1
: 1, 2,3;
J S R
tjsr jsrj s r
J S R
jsrj s r
Fer AMin t
A
(8) 260
The objective function 1 to 3 are related to the sustainable use of nitrogen (N), phosphate (P) and 261
potash (K) fertilizers. In these functions, Ajsr represents the cultivation area crop j in season s for region 262
r, and Fertjs represents the required amount of fertilizer by type t (N, P or K) to cultivate each hectare 263
of crop j in season s for region r. 264
Functions 4 to 6 are related to sustainability to herbicides, fungicides and insecticides. 265
1 1 1
4 6
1 1 1
: 1, 2,3
J S R
zjsr jsrj s r
J S R
jsrj s r
Pes AMin z
A
(9) 266
In these equations, Peszjs represents the required amount of pesticide by the type z per hectare of 267
product j in season s for the region r. 268
Water resource productivity is another ecological objective of the optimal cropping pattern model 269
that has been addressed in the objective function 7 . 270

13
1 1 1
7
1 1 1
:
J S R jsr
jsrj s rr
J S R
jsrj s r
NetWA
EffMin
A
(10) 271
NetWjsr is the net water requirement for crop j in season s and region r (m3 / ha), and Effr is irrigation 272
efficiency in the region r. 273
The ecological dimension of sustainability of crop production in the proposed model is provided by 274
objective functions 1 to 7 . 275
The objective function 8 ensures the economic dimension of the sustainability of agricultural 276
production (Eq. 11). 277
1 1 1
8
1 1 1
:
J S R
jr jr jr jsrj s r
J S R
jsrj s r
Mp Sp Cp AMax
A
(11) 278
In this equation, Mpjr, Spjr and Cpjr are the main crops value, the sub-crop value and the production 279
cost for cultivating one hectare of crop j in region r, respectively. 280
It should be noted that the result of jr jr jrMp Sp Cp is equal to the gross margin of crop j in 281
region r ($/ha) and from now on, it will be shown with the symbol jrGM . 282
The social dimension of a sustainable cropping pattern model can be considered in workforce 283
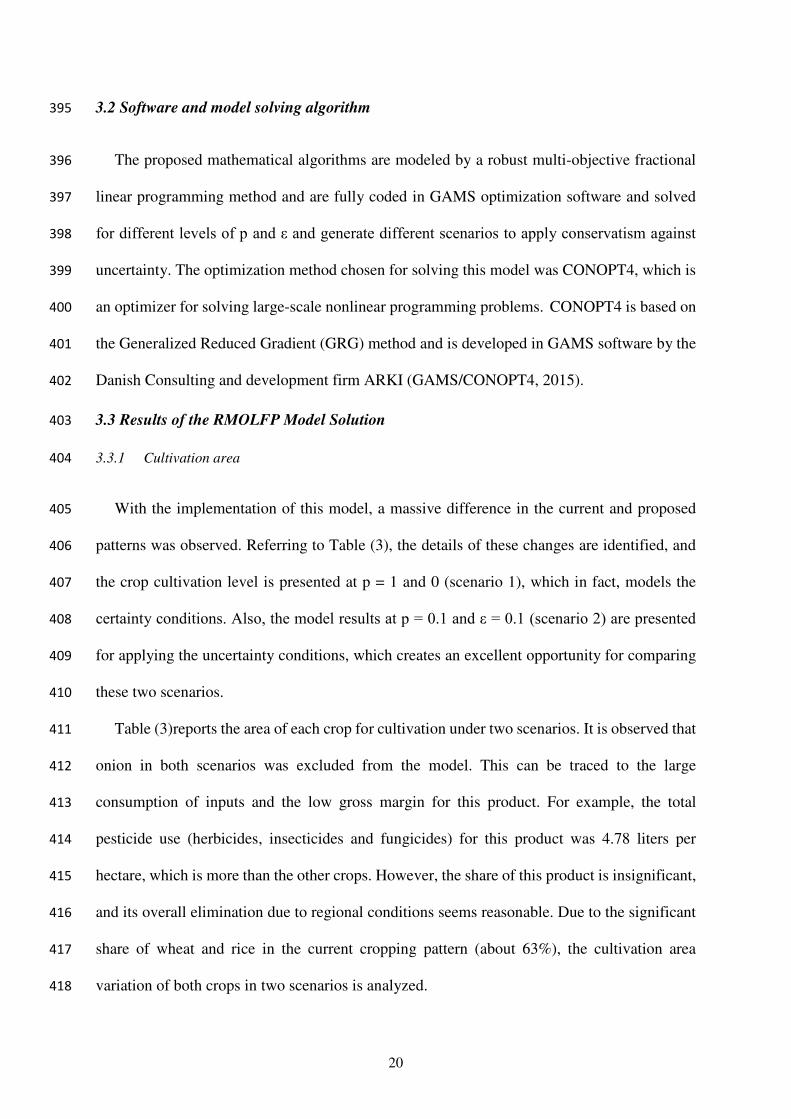
recruitment for the agricultural labor force. In this regard, the objective function 9 (Eq. 12) tries to 284
increase the workforce recruitment in the optimal cropping pattern. 285
1 1 1
9
1 1 1
:
J S R
jsr jsrj s r
J S R
jsrj s r
Lab AMax
A
(12) 286
Where Labjsr represents the amount of required labor to cultivate each hectare of crop j in season s 287
and region r (man-day / ha). 288
2.4.2 Constraint sets 289
The scarcity of production inputs limits crop cultivation. Equations 13 to 19 clearly define these 290
limitations. The set of irrigation water constraint is related to the amount of available water. Eq. (13) 291
determines the allowable limit for the amount of water available for each area. 292

14
1
,J
jsr
jsr sr
j r
NetWA TW s r
Eff
(13) 293
TWsr is the total amount of available water in season s and region r (m3). 294
The set of constraints (14) to (17) are related to the allowable limit for the amount of labor, agricultural 295
machinery, fertilizer and pesticide, respectively. 296
1 ,
J
jsr jsr srjLab A TLab s r
(14) 297
1 ,
J
jsr jsr srjMec A TMec s r
(15) 298
1 , ,
J
tjsr jsr tsrjFer A TFer t s r
(16) 299
1 z,s,r
J
zjsr jsr zsrjPes A TPes
(17) 300
Where, TLabsr, TMecsr, TFertsr and TPeszsr, represents the total amount of available labor (man-day), 301
available agricultural machinery (hour), Total available fertilizer of type t (kg) and amount of available 302
pesticide of type z (kg or liter), respectively. 303
Eq. (18) relates to land and in this set, the cultivation area of crops is limited by the amount of 304
available land in each region. 305
1 1
J S
jsr jsr rj sSch A TA r
(18) 306
The TAr represents the amount of available land in the region r (ha) for all crops and Schjsr indicates 307
the land occupancy coefficient. If the crops are cultivated each month (from planting to harvesting), the 308
land occupancy coefficient of that crop in those months is one, and otherwise zero. 309
In order to rely on the optimal solutions and to accept the model presented in this study, the current 310
profit of crop cultivation in each region should be provided (Eq. 19). 311
1 1Pr
J S
jr jsr rj sGM A Cur ofit r
(19) 312
In this equation CurProfitr is the current profit in the region r. 313
The set of constraints 20 and 21 specifies the maximum and minimum production of agricultural 314
products, respectively. 315
1
S
jr jsr jrsYield A MaxProd jr
(20) 316
1
S
jr jsr jrsYield A MinProd jr
(21) 317

15
Where jrYield is the yield of crop j in the region r and
jrMaxProd and jrMinProd are the 318
maximum and minimum allowable amount of production of agricultural products, respectively. The 319
amount of maximum production in Eq. (20) is determined based on the potential of each region and 320
macroeconomic considerations. The amount of minimum production in Eq. (21) is calculated based on 321
self-consumption needs and food security policies set by the government for each region. 322
2.4.3 Uncertain data 323
There are many uncertain parameters in an optimization model for cropping pattern. In this study, 324
the total amount of available water ( srTW ) and the gross margin ( jrGM ) are considered as uncertain 325
parameters. Therefore, by defining the parameter TW
sr , variables TW
srz and TW
srp and using model 6, the 326
constraint of the total amount of available water (Eq. 13) is converted into two Eqs. 22 and 23. 327
1 s,r
J jsr TWsrjsr sr sr srj
r
NetWE A z TW pTW T W
Eff
n
(22) 328
s,rsrsr srzTW pTW T W n
(23) 329
Where srTW represents the nominal value of the total amount of available water. 330
Considering jrGM as an uncertain parameter, the two Eqs. 11 and 19 change. These equations, like 331
Eqs. (22) and (23), are converted to robust form by defining new parameters and variables. Eq. (24) and 332
(25) are formulated to robustification the objective function 8 (maximizing gross margin) and Eq. 333
(26) and (27) are formulated to robustification the Eq. 19. 334
1 1 1 1 1 1
8
1 11 1 1
ΓJ S R
J Rjr jsrj s r GM GM GM
jrJ S R
j rjsrj s r
GM Az p
A
(24) 335
1 1 ,rGM GMjrjrz p G M j
n
(25) 336
2 2 2
1 1 1
Γ J S J
GM GM GM
jr jsr jr r
j s j
GM A z p CurProfit r
(26) 337
2 2 ,GM GM
jr jrz p GM j r (27) 338

16
2.4.4 Model evaluation 339
Monte Carlo simulation method is used to evaluate the proposed model (Figure 3). For this purpose, 340
after solving the robust multi-objective linear fractional programming, 10,000 random numbers with 341
specified distribution for the uncertain parameters (in this study, the amount of available water and 342
gross margin) are generated. After solving the proposed mathematical programming model, the values 343
of the optimal cultivation area (*
jsrA ) and generated numbers are replaced in Eq. 13 and 19. If the 344
equations were not correct after these replacements, they are recorded as infeasible solution indicating 345
model's inability to apply uncertain data. 346
This process is performed at different levels of probability deviation of constraint (p) and given 347
uncertainty level (ε). 348
349
350
351
352
353
354
355
356
Figure 3. Monte Carlo simulation process to evaluate the capability of a robust multi-objective linear 357
fractional programming model 358
3. Results 359
3.1 Primary data processing 360
In this study, all the required data were obtained from various governmental agencies such as the 361
Jihad-e-Keshavarzi organization (Anonymous, 2018), Khuzestan Water and Power Authority and the 362
Great Karoun Irrigation Network Operating Company (Anonymous, 2017) in the year 2017. In this 363
Solving a robust multi-objective linear fractional programming
model
Generate random numbers with
specified distribution for uncertain parameters
replace optimal solution and
generated numbers in Eq. 13 and 19
Record an infeasible solution if equations
were not correct
Calculate the percentage of
infeasible solution
Repeat this process for different p
and ε

17
network, there are generally winter and summer agricultural products in which 12 types of crops are 364
cultivated. Some of these crops are perennial (such as alfalfa). Table 1 lists these crops along with the 365
current cultivation area. Wheat is one of the most popular crops among farmers in this irrigation and 366
drainage network due to its guaranteed price and elimination of income risk, with about 17,000 hectares 367
cultivation area. Although the availability of water and canal length in the Aghili area is less than the 368
Dimech area, the presence of more modern irrigation equipment in the Aghili area has made its current 369
cultivation area (about 2800 hectares) the same as the area of Dimcheh. 370
Table 1. Crop cultivation area in the Gotvand irrigated and drainage network by operation zones (ha) 371
Crop Gotvand Aghili Dimcheh total The share of the cultivation
area (Percent)
Corn 0 1015 75 1090 3.19
Eggplant 212 251 1088 1551 4.54
Rice 736 1977 1902 4615 13.52
Beans 859 0 881 1740 5.1
Okra 0 580 293 873 2.56
Barley 32 61 90 183 0.54
Onion 10 110 0 120 0.35
Wheat 4468 6695 5782 16945 49.63
Canola 0 428 360 788 2.31
Vegetables 967 0 1837 2804 8.21
Broad bean 943 0 1015 1958 5.73
Alfalfa 631 119 725 1475 4.32
Total 8858 11238 14048 34144 100
372
Table (2) summarizes the important parameters used in the proposed model. Table (1) and 373
Table (2) provide exciting findings on the relationship between the cultivation area and input 374
consumption. Although the Corn cultivation area is lower than wheat and rice, the gross margin 375
for corn ($ 5864 per hectare) is more than the mentioned crops (Table 1). The government has 376
led a restriction on corn cultivation in the study area since the consumption of fertilizer and 377
pesticide for its cultivation is more the other two crops. However, this coercion was 378

18
accompanied by fierce opposition from farmers (due to poverty) and led to severe tensions 379
between government bodies and farmers. It is also evident that despite the low consumption of 380
these inputs in barley, the cultivation area of this crop is just about 183 hectares. The simplest 381
reason is the low gross profit of this product ($ 192 per hectare) compared to other products, 382
so the low gross margin has led to farmers' unwillingness to cultivate this crop. 383
Tables (1) and (2) show that the study area desperately needs a revision of the current 384
cropping pattern. This change should be made in light of the problems already mentioned. 385
Firstly, the farmers tend to participate in this change, and it is related to how much income, 386
they can earn (more or equal than their current income) and secondly, due to the critical 387
conditions of fertilizers and chemical pesticides consumption in the area, their consumption is 388
drastically reduced. In other words, it is necessary to make a compromise between the different 389
objectives in the area.390

19
391
392
Table 2- Average technical and economic coefficients of agricultural product in the Gotvand irrigation and drainage network (per hectare) 393
Rice Corn Beans Broad bean Alfalfa Onion Barley Wheat Canola Okra Vegetables Eggplant
Gross margin ($) 1842 5864 100 401 1106 1003 192 412 214 2904 3481 2958
Production Cost ($) 1603 1378 1031 817 2146 1910 563 768 740 1824 1620 954
Phosphate (kg) 239 109 112 60 238 114 22 98 88 55 124 36
Nitrogen (kg) 395 472 224 30 16 248 123 353 279 324 367 152
Potash (kg) 0 14 0 60 17 9 0 6 25 46 53 17
Total fertilizer (kg) 634 595 336 150 272 370 146 457 393 344 444 371
Herbicide (kg) 0.88 3.07 0 0 0.19 1.86 0.28 1.48 3.08 1.18 1.44 1.8
Insecticides (kg) 1.52 0.58 0 0 0.14 1.68 0.01 0.12 0.76 0.7 0 1.6
Fungicides (kg) 0 0 0 0 0.06 1.24 0.01 0.01 0.14 0 0.11 0.12
Total pesticide(kg) 2.4 3.65 0 0 0.4 4.78 0.3 1.61 3.98 1.2 0 3.24
Net water requirement(m3) 10260 3084 6252 5868 14448 5052 2148 2724 4106 13973 9502 4523
Machinery (hours) 25 31 34 40 38 24 28 26 36 28 24 40
Labor (man-day) 121 15 31 32 60 43 8 7 8 85 24 16
394
20
3.2 Software and model solving algorithm 395
The proposed mathematical algorithms are modeled by a robust multi-objective fractional 396
linear programming method and are fully coded in GAMS optimization software and solved 397
for different levels of p and ε and generate different scenarios to apply conservatism against 398
uncertainty. The optimization method chosen for solving this model was CONOPT4, which is 399
an optimizer for solving large-scale nonlinear programming problems. CONOPT4 is based on 400
the Generalized Reduced Gradient (GRG) method and is developed in GAMS software by the 401
Danish Consulting and development firm ARKI (GAMS/CONOPT4, 2015). 402
3.3 Results of the RMOLFP Model Solution 403
3.3.1 Cultivation area 404
With the implementation of this model, a massive difference in the current and proposed 405
patterns was observed. Referring to Table (3), the details of these changes are identified, and 406
the crop cultivation level is presented at p = 1 and 0 (scenario 1), which in fact, models the 407
certainty conditions. Also, the model results at p = 0.1 and ε = 0.1 (scenario 2) are presented 408
for applying the uncertainty conditions, which creates an excellent opportunity for comparing 409
these two scenarios. 410
Table (3)reports the area of each crop for cultivation under two scenarios. It is observed that 411
onion in both scenarios was excluded from the model. This can be traced to the large 412
consumption of inputs and the low gross margin for this product. For example, the total 413
pesticide use (herbicides, insecticides and fungicides) for this product was 4.78 liters per 414
hectare, which is more than the other crops. However, the share of this product is insignificant, 415
and its overall elimination due to regional conditions seems reasonable. Due to the significant 416
share of wheat and rice in the current cropping pattern (about 63%), the cultivation area 417
variation of both crops in two scenarios is analyzed. 418

21
Table (3) shows that there is an increase (in scenario 1) in the cultivation area of wheat and 419
rice, which increases the cultivation area to 2635 hectares in the entire area. With the increase 420
in model protection against uncertainty, the proposed cultivation area has decreased 421
significantly. The main reason for this reduction compared to scenario 1 is the extensive water 422
use of these two products. This result seems reasonable due to the increased conservatism 423
leading to a decrease in the amount of available water. 424
The cultivation area of some crops such as rice and corn have been increased in the proposed 425
models to offset the reduction in profits in both scenarios. So, the policy that is currently being 426
implemented by the government to limit corn cultivation area is not appropriate. This policy 427
increases the dissatisfaction of farmers and, on the other hand, loses the alternatives. For 428
example, the government could authorize the cultivation of corn along with barley, which has 429
an increased cultivation area on both scenarios, which will increase farmers' interest in 430
cultivating barley (Table 2). However, this policy should be done with caution if the whole 431
proposed pattern is implemented . 432
It can be observed that by increasing the model's protection against uncertainty (decreasing the 433
probability level p), the total cultivation area decreases; at p = 1, the cultivation area increased 434
by 9.34%, and at p = 0.1 the mentioned area decreased by 3.63%. 435
22
Table 3. Cultivation area of optimal cropping pattern of Gotvand irrigation and drainage network at different levels of p and ε 436
Region Rice Corn Beans Broad
bean
Alfalfa Onion Barley Wheat Canola Okra Vegetables Eggplant Total
(Scenario 1)
Gotvand 1128 0 403 852 879 0 65 4849 0 0 1605 76 9857
Aghili 2731 1446 0 0 229 0 0 6897 95 1090 0 350 12838
Dimcheh 2610 424 273 1021 635 0 329 5970 112 286 2627 678 14965
Total 6469 1870 676 1873 1743 0 394 17716 207 1376 4232 1104 37660
Percentage
change
28.66 41.72 -157.3 -4.53 15.38 -100 53.55 4.35 -280.6 36.54 33.74 -40.47 9.34
(Scenario 2)
Gotvand 1128 0 403 852 879 0 65 4849 0 0 1605 76 9857
Aghili 2270 1446 0 0 119 0 0 6816 95 1049 0 350 12145
Dimcheh 2045 424 273 922 232 0 329 4217 112 91 1905 393 10943
Total 5442 1870 676 1774 1229 0 394 15883 207 1139 3510 819 32943
Percentage
change
15.2 41.72 -157.3 -10.36 -19.97 -100 53.55 -6.69 -280.6 23.38 20.12 -89.28 -3.63
437

23
3.3.2 Consumption of chemical inputs (ecological dimension) 438
Table (4) presents the results of the changes in fertilizer and pesticide in the study area. However, 439
the absolute reduction in the number of consumed inputs in optimal models does not necessarily indicate 440
an improvement in the use of these production resources, and it just happened by reducing the 441
cultivation area. Therefore, the average fertilizer application per hectare can be a good criterion for 442
examining the effect of cropping pattern change on the optimal use of these resources. The results show 443
that the fertilizers and pesticides used has decreased by approximately 6% and 8%, respectively, in both 444
scenarios. Due to the current challenging economic situations in Iran (Poor economic growth, sanctions 445
and unemployment), reducing this amount of fertilizer is crucial for the agriculture sector.446

24
447
Table 4. Average current and optimal consumption of pesticides and Fertilizers in the Gotvand Irrigation and Drainage Network (Unit: Kg or L/ha) 448
Model Region Phosphate Nitrogen Potash Total fertilizer Herbicide insecticide Fungicides Total pesticides
Current
Gotvand 129.9 309.5 18.5 457.9 1.14 0.26 0.02 1.43
Aghili 136.8 402.8 10 549.6 1.76 0.58 0.03 2.36
Dimcheh 131.4 322.1 19.4 472.8 1.31 0.47 0.03 1.81
Total 132.7 344.8 15.9 493.4 1.4 0.43 0.03 1.86
Scenario 1
Gotvand 127.2 293.8 18.4 439.3 1.1 0.26 0.02 1.38
Aghili 126.3 360.8 9.7 496.8 1.5 0.56 0.01 2.08
Dimcheh 125.7 312.2 18.7 456.6 1.22 0.43 0.03 1.68
Total 126.4 322.3 15.6 464.3 1.27 0.42 0.02 1.71
Percentage change -4.8 -6.5 -2.1 -5.9 -9 -4.13 -29.63 -8.19
Scenario 2
Gotvand 127.2 293.8 18.4 439.3 1.1 0.26 0.02 1.38
Aghili 121.5 362.8 9.9 494.1 1.54 0.53 0.01 2.09
Dimcheh 124.4 315.2 18.7 458.4 1.22 0.43 0.03 1.67
Total 124.4 323.9 15.7 464 1.29 0.41 0.02 1.71
Percentage change -6.3 -6.1 -1.7 -6 -8.17 -6.43 -32.09 -8.15
449

25
3.3.3 System profit (economic dimension) 450
The vital point in examining the proposed model is that with increasing system protection against 451
uncertainty (decreasing level of p from 1 to 0.1), the Total profit has increased. Figure 4 is presented to 452
investigate this issue better and analyze its sensitivity at different levels of p ranging from 0.1 to 1 with 453
steps 0.1 for each region. It is observed that as the level of p increases, the amount of total profit 454
decreased in all three regions. In other words, there is a trade-off correlation between the degree of 455
system protection against uncertainty (robustness) and the amount of total profit. 456
457
Figure 4.Total profit at different levels of p in the Gotvand irrigation and drainage network regions 458
3.3.4 Other inputs (social and ecological dimensions) 459
Table (5) reports the utilization of other inputs generated by implementing the two scenarios of 460
optimal cropping patterns and the current situation. In both scenarios and all three regions, irrigation 461
water use per hectare decreased. In the Gotvand region, the reduction of water use per hectare is 462
increased with increasing system protection against uncertainty, and in other regions, it remains 463
unchanged. In other words, there is no particular trend (such as total profit) for water consumption by 464
increasing the system protection against uncertainty. In Gotvand and Dimcheh regions, as the level of 465
p decreases, the utilization of labour and machinery does not have a significant change, while in the 466
Agheli region, by decreasing the level of p, the increase in the labour is about 10% lower than the first 467
scenario. 468

26
Table 5. Average, current and optimal consumption of other agricultural inputs per hectare in different 469
scenarios 470
Scenario 1 Scenario 2
Current
amount
Optimal
amount
Percentage
Change
Optimal
amount
Percentage
Change
Gotvand
Irrigation water
(Cubic meters) 6403.7 5804.8 -9.4 5804.8 -36.9
Machinery
(hour) 32.1 28.3 -11.8 28.3 -11.8
Labor (man-day) 30.1 30.8 2.2 30.8 2.2
Aghili
Irrigation water
(Cubic meters) 6040.4 5519.8 -8.6 5284.6 -7.4
Machinery
(hour) 27.2 27.2 0 27.2 0
Labor (man-day) 33 40 21.2 36.8 11.6
Dimcheh
Irrigation water
(Cubic meters) 6598.7 6138.9 -9.1 5997.5 -9.1
Machinery
(hour) 32.1 28 -12.6 28 -12.8
Labor (man-day) 36.4 36.4 0 36.4 0
471
3.4 Evaluation the capability of the proposed model against uncertainty 472
Monte Carlo simulation method was used to validate the proposed model, as shown in Figure 3. In 473
this regard, 10,000 random data were generated for the available water parameter with uniform (at a 474
given distance) and normal (with 95% convergence) distributions for uncertain parameters jrGM and 475
srTW . Then, the feasibility of randomly generated numbers was investigated by using the simulation 476
method. Figures (5) and (6) show the results of this simulation method for different levels of p and ε 477
for random numbers generated using uniform and normal distributions, respectively. It is observed that 478
in both distributions, with the decrease in the level of p, the percentage of infeasibility is reduced; So 479
that at the 10% given uncertainty level (ε=0.1) with a uniform distribution, with the decrease level of p 480
from 100% to 10%, the infeasibility percentage is decreased from 56% to 17%. It is also found that by 481
increasing the given uncertainty level in both distributions, the average infeasibility is decreased. The 482

27
lower infeasibility at high levels of conservatism (lower levels of p) indicates the considerable 483
robustness of the proposed optimal cropping pattern model to overcome the uncertainty. 484
485
Figure 4. Infeasibility percentage of the proposed model assuming uniform distribution over a given 486
interval 487
488
Figure 5. Infeasibility percentage of the proposed model assuming normal distribution with 95% 489
convergence 490
4. Discussion 491
In this section, the results of the present study and previous studies are compared based on three 492
ecological, economic and social dimensions of the optimal sustainable cropping pattern. A summary of 493
this discussion is provided as follows: 494

28
4.1 Ecological dimension 495
Increasing the cultivation area in the Gotvand irrigation and drainage network led to a decrease in 496
the total area under the proposed model, improperly. Reducing the cultivation area in optimal cropping 497
pattern models is not limited to this study and has been recommended in most similar studies for 498
different regions of Iran (M. S. Sabouhi & Mardani, 2013). For example, Mardani Najafabadi et al. 499
(2019), used the multi-objective robust optimization method in their cropping pattern programming 500
model and they found that about 16.5% of the total cultivation area in Isfahan province has been 501
reduced. 502
According to statistics published by the Khuzestan Agricultural Jihad Organization, the use of 503
fertilizers and pesticides in the Gotvand irrigation and drainage network has an upward trend and the 504
consumption of these two destructive inputs will almost double. It is crucial to prevent the increase in 505
the use of fertilizers and pesticides for this region, however, the reduction in their use in the proposed 506
model is less than 10% (Anonymous, 2017). 507
In contrast, Neamatollahi, Vafabakhshi, Jahansuz, and Sharifzadeh (2017) applied different 508
scenarios by using a fuzzy multi-objective planning model, they found that the reduction rate of 509
fertilizer and chemical pesticide consumption are 38% and 35%, respectively. These percentages are 510
realized only when the demand for the industrial and livestock sectors is not taken into account. If this 511
demand is calculated, the consumption of fertilizers and pesticides will increase sharply by 52 and 11 512
percent, respectively. The important point in the present study is that the need for self-consumption and 513
food safety considerations are considered in Equation 21 and this has led to more input consumption of 514
fertilizers and pesticides. However, contrary to the study of Neamatollahi et al. (2017), the consumption 515
of these two destructive inputs has decreased. 516
In many studies that have tried to optimize the cropping pattern, the ecological dimension has been 517
considered only for the optimal use of irrigation water (C. Zhang et al., 2018; F. Zhang et al., 2018). 518
Tan and Zhang (2018) optimized irrigation water use efficiency using robust fraction programming. 519
The result of their study is that with increasing conservatism (reducing the level of probability of 520
deviation), the efficiency of water consumption decreases. 521

29
4.2 Economic dimension 522
It should be noted that the economic and ecological dimensions are closely related. For example, in 523
most studies that consider environmental objectives, optimal use of inputs that lead to disruption of the 524
ecological system has been suggested as a viable solution for economic (lower cost on the consumption 525
of production inputs) and ecological (optimal use of chemical inputs) sustainability (Mardani 526
Najafabadi et al., 2019). 527
Sensitivity analysis of gross profit in the present study showed that with increasing system protection 528
against uncertainty, system profit decreases. According to a review of research, this sensitivity analysis 529
has been used in studies such as Tan & Zhang (2018) and M. S. Sabouhi and Mardani (2013) that used 530
a robust optimization approach. Depending on the number of uncertain parameters in the models, this 531
decrease in profit or increase in cost is distinctive. 532
Increasing the protection of the system against uncertainty is not limited to the robust optimization 533
method. For example, in the study of Zhang et al. (2017), the probability of occurrence for different 534
inflow is considered as different levels of conservatism. The profit of the system has increased by 535
increasing the conservatism which means the protection of the system against uncertainty is reduced. 536
Wang et al. (2019) used a bi-level multi-objective linear fractional programming model with the theory 537
of fuzzy sets and different levels of alpha (Uncertainty condition) to redistribute water to the 538
agricultural, industrial, urban, and ecological sectors of the Heihe River basin in China. They found that 539
increasing the level of conservatism (alpha levels) reduced the total gross profit, especially in the 540
agricultural sector. 541
Filippi et al., (2017) used the mixed integer linear programming model in similar conditions. The 542
objective function of their model was different, so they maximized the net return function with the 543
approach of Conditional Value-at-Risk as a safety measure. Increasing the risk-aversion parameter in 544
this model, which can be considered as increasing the protection of the system against uncertainty, led 545
to a decrease in profit. 546

30
4.3 Social dimension 547
In the present study increasing employment and food security has been considered as two aspects of 548
social dimensions. According to the results, by implementing the cultivation pattern introduced in this 549
study, the total employment rate will increase which shows the priority of ecological dimension in 550
Gotvand region (especially reducing the use of fertilizers and pesticides). Although the aspect of food 551
security in the present study is not considered as a main objective, however, in Equation 21, the need 552
for self-consumption as well as government policies on food security when estimating the right-hand 553
side of this constraint (the minimum production rate of each product) is calculated. 554
Mardni Najafabadi et al., (2019) considered Maximization of the use of labor (employment 555
aspect) and minimization of the net import of energy from agricultural products (food security aspect). 556
As the result, the employment rate in the whole region increased by 9%; But its relative rate (labor per 557
hectare) has decreased by 11 percent. In this study, the food security index did not improve due to a 2% 558
increase in net energy imports. Considering the increase in population and the consequent increase in 559
the need for calories, this result seems reasonable. However Wineman and Crawford (2017) studied 560
that due to the importance of the aspect of food security in a country, its only main objective is to 561
maximize calorie production through the cultivation of agricultural products. 562
Increasing social equality is one of the important indicators in some studies of water or land 563
redistribution pattern. Increase social equity in water redistribution with the aim of increasing the Gini 564
coefficient in the equitable distribution of irrigation water is another economic dimension that studied 565
by Wang et al. (2019). The results of this redistribution showed that if the proposed model is 566
implemented, the Gini coefficient of water distribution is reduced, which indicates a reduction in the 567
distribution inequality. 568
4.4 Summery 569
Due to many aspects of the optimal cropping pattern, Table 6 was designed to provide a summary 570
of the status of the studies previously discussed. Although, it should be noticed that these studies have 571

31
different objectives depending on the areas under study and the different priorities of each of them in 572
solving the challenges, so considering the different challenges is not the reason for the superiority of 573
the studies. 574
The proposed model in the present study does not apply only the supply-demand balance aspect 575
since the transportation equations in this model is not provided. In the study of Mardani Najafabadi et 576
al. (2019), agricultural products could be transferred from one county to another and also outside of 577
Isfahan province. For this reason, the lack of supply of products from outside the province or other 578
county was compensated. However, in this study, adding this feature required redesigning the model, 579
which was not necessary due to regional priorities. As can be seen, this aspect has not been considered 580
in most studies. 581
582

32
Table 6. Comparison of the results of the present study with others 583
Social
dimension
Ecological
dimension
Economic dimension
Fo
od
security
Em
plo
ym
ent
En
viro
nm
ental
con
sideratio
ns
Ap
ply
ing
un
certainty
con
ditio
n
Su
pp
ly- d
eman
d
balan
ce
Gro
ss pro
fit
increase
Op
timal
utilizatio
n o
f
inputs
Mathematical programming model Title NO.
Robust Multi-Objective
Programming
(Mardani Najafabadi et al., 2019) 1
inexact robust two-stage mixed-
integer linear programming
(C. Zhang et al., 2018) 2
Liner programming (Wineman & Crawford, 2017) 3
interval multistage joint-probabilistic
chance constrained programming
(Zhang et al., 2017) 4
Fuzzy multi-objective linear
programming
(Zeng, Kang, Li, Zhang, & Guo,
2010)
5
interval nonlinear multi-objective
programming
(F. Zhang et al., 2018) 6
Mixed integer linear programming (Filippi et al., 2017) 7
Robust fractional programming (Tan & Zhang, 2018) 8
bi-level multi-objective linear
fractional programming
(Wang et al., 2019) 9

33
Robust Multi-Objective Fractional
Linear Programming
Proposed model 10
584

34
5. Conclusion 585
Over the past few decades, environmentalists have consistently emphasized the need to create a 586
sustainable agricultural system because of imbalances between water supply and demand, falling 587
aquifers, increasing fertilizer and pesticides use and depleting soil resources to conserve valuable 588
environmental resources. Therefore, assessing the sustainability of farming systems to prevent the 589
degradation of water and soil resources and reducing economic and social damages has become one of 590
the top priorities of agricultural policymakers. Hence, this study aims to achieve an optimal cropping 591
pattern for balancing the consumption of agricultural inputs (especially fertilizers and pesticides) by 592
using a robust multi-objective fractional programming approach based on two scenarios (with and 593
without uncertainty). The study area was located under the irrigation and drainage network of Gotvand 594
in Khuzestan province, Iran, while it is dissimilar in terms of the average consumption of fertilizers and 595
pesticides due to other provinces. The model was solved at different levels of deviation probability of 596
each constraint (p) in two scenarios. The results showed that using the optimal cropping pattern in both 597
scenarios made it possible to achieve the appropriate and optimal use of agricultural inputs (especially 598
fertilizers and pesticides), which is the main objective of the study. However, the gross profit of the 599
proposed model shows a slight increase in increasing system protection against uncertainty. Since, in 600
the real world, the probability of uncertainty in the utilized data is higher, it is, therefore, advisable to 601
use scenario (2) results to apply changes in the cropping pattern. Different and sometimes conflicting 602
objectives in the structural programming scheme of the cropping pattern have been considered. It is 603
possible to compromise between the considered objectives in the RMOLFP model, which is 604
recommended to decision-makers. On the one hand, farmers are encouraged to implement the proposed 605
model (due to the increase in gross profit) and on the other hand, the rate of water and chemical inputs 606
(fertilizer and pesticides) consumption, which are in line with the implementation of the sustainable 607
optimal cropping pattern, will be reduced. 608
6. Declarations 609
Availability of data and materials 610

35
All data generated or analyzed during this study are included in this published article. 611
Competing interests 612
The authors declare that they have no competing interests. 613
Funding 614
This research did not receive any specific grant from funding agencies in the public, commercial, or 615
not-for-profit sectors. 616
Authors' contributions 617
Mostafa Mardani Najafabadi: Conceptualization, Methodology, Software, Formal analysis and 618
investigations, Writing - Original Draft, Writing - Review & Editing, Resources. 619
Niloofar Ashktorab: Conceptualization, Methodology, Software, Formal analysis and investigations, 620
Writing - Original Draft, Writing - Review & Editing, Resources. 621
Acknowledgement 622
This study is a part of research (Determining the optimal cropping pattern of agricultural products 623
in line with sustainable agriculture in lands covered by Gotvand Irrigation and Drainage Network under 624
uncertainty (No. 981.55)) with the support of the Research and Technology Deputy of Agricultural 625
Sciences and Natural Resources University of Khuzestan. 626
627
References 628
Anonymous. (2017). Detailed Report of the Gotvand Irrigation and Drainage Networks. Great Karoun 629
Irrigation and Drainage Operating Company, Khuzestan Water and Power Organization 630
Anonymous. (2018). Comprehensive land suitability studies of Gotvand irrigation and drainage 631
network. Khouzstan, Iran: Soil and Water Research center, Jihad-e-Keshavarzi organization 632
Ben-Tal, A., & Nemirovski, A. (2000). Robust solutions of Linear Programming problems 633
contaminated with uncertain data. Mathematical Programming, 88(3), 411-424. 634
Bertsimas, D., Iancu, D. A., & Parrilo, P. A. (2010). Optimality of Affine Policies in Multistage Robust 635
Optimization. Mathematics of Operations Research, 35(2), 363-394. Retrieved from 636
https://pubsonline.informs.org/doi/abs/10.1287/moor.1100.0444. 637
doi:10.1287/moor.1100.0444 638
Caballero, R., & Hernández, M. (2004). The controlled estimation method in the multiobjective linear 639
fractional problem. Computers & Operations Research, 31(11), 1821-1832. Retrieved from 640
http://www.sciencedirect.com/science/article/pii/S0305054803001412. 641
doi:https://doi.org/10.1016/S0305-0548(03)00141-2 642
Filippi, C., Mansini, R., & Stevanato, E. (2017). Mixed integer linear programming models for optimal 643
crop selection. Computers & Operations Research, 81, 26-39. Retrieved from 644
http://www.sciencedirect.com/science/article/pii/S0305054816303033. 645
doi:https://doi.org/10.1016/j.cor.2016.12.004 646
GAMS/CONOPT4. (2015). GAMS/CONOPT4. Bagsvaerdvej 246A, DK-2880 Bagsvaerd, Denmark: 647
Arki Consulting Development. 648

36
Gorissen, B. L. (2015). Robust Fractional Programming. Journal of Optimization Theory and 649
Applications, 166(2), 508-528. Retrieved from https://doi.org/10.1007/s10957-014-0633-4. 650
doi:10.1007/s10957-014-0633-4 651
Li, M., Fu, Q., Singh, V. P., Liu, D., Li, T., & Li, J. (2020). Sustainable management of land, water, 652
and fertilizer for rice production considering footprint family assessment in a random 653
environment. Journal of Cleaner Production, 258, 120785. Retrieved from 654
http://www.sciencedirect.com/science/article/pii/S0959652620308325. 655
doi:https://doi.org/10.1016/j.jclepro.2020.120785 656
Li, X., Kang, S., Niu, J., Du, T., Tong, L., Li, S., & Ding, R. (2017). Applying uncertain programming 657
model to improve regional farming economic benefits and water productivity. Agricultural 658
Water Management, 179, 352-365. Retrieved from 659
http://www.sciencedirect.com/science/article/pii/S0378377416302451. 660
doi:https://doi.org/10.1016/j.agwat.2016.06.030 661
Mardani, M., Esfanjari Kenari, R., Babaei, M., & Asemani, A. (2013). Application of Meta-goal 662
programming approach to determine optimal cropping pattern. International Journal of 663
Agronomy and Plant Production, 4 (8), 1928-1935. 664
Mardani, M., Ziaee, S., & Nikouei, A. (2018). Optimal Cropping Pattern Modifications With the Aimof 665
Environmental-Economic Decision Making Underuncertainty. INTERNATIONAL JOURNAL 666
OF AGRICULTURAL MANAGEMENT AND DEVELOPMENT (IJAMAD), 8(3), 15-43. 667
Retrieved from https://www.sid.ir/En/Journal/ViewPaper.aspx?ID=613505. 668
Mardani Najafabadi, M., Abdeshahi, A., & Shirzadi Laskookalayeh, S. (2020). Determining the 669
Optimal Cropping Pattern with Emphasis on Proper Use of Sustainable Agricultural Disruptive 670
Inputs: Application of Robust Multi-Objective Linear Fractional Programming. Journal of 671
Agricultural Science, 30(1), 241-256. Retrieved from 672
https://www.sid.ir/en/journal/ViewPaper.aspx?ID=753970. 673
Mardani Najafabadi, M., & Taki, M. (2020). Robust data envelopment analysis with Monte Carlo 674
simulation model for optimization the energy consumption in agriculture. Energy Sources, Part 675
A: Recovery, Utilization, and Environmental Effects, 1-15. Retrieved from 676
https://doi.org/10.1080/15567036.2020.1777221. doi:10.1080/15567036.2020.1777221 677
Mardani Najafabadi, M., Ziaee, S., Nikouei, A., & Ahmadpour Borazjani, M. (2019). Mathematical 678
programming model (MMP) for optimization of regional cropping patterns decisions: A case 679
study. Agricultural Systems, 173, 218-232. Retrieved from 680
http://www.sciencedirect.com/science/article/pii/S0308521X18306644. 681
doi:https://doi.org/10.1016/j.agsy.2019.02.006 682
Neamatollahi, E., Vafabakhshi, J., Jahansuz, M. R., & Sharifzadeh, F. (2017). Agricultural Optimal 683
Cropping Pattern Determination Based on Fuzzy System. Fuzzy Information and Engineering, 684
9(4), 479-491. Retrieved from https://doi.org/10.1016/j.fiae.2017.12.004. 685
doi:10.1016/j.fiae.2017.12.004 686
Ren, C., Li, Z., & Zhang, H. (2019). Integrated multi-objective stochastic fuzzy programming and AHP 687
method for agricultural water and land optimization allocation under multiple uncertainties. 688
Journal of Cleaner Production, 210, 12-24. Retrieved from 689
http://www.sciencedirect.com/science/article/pii/S0959652618333857. 690
doi:https://doi.org/10.1016/j.jclepro.2018.10.348 691
Sabouhi, M., & Mardani, M. (2017). Linear robust data envelopment analysis: CCR model with 692
uncertain data. International Journal of Productivity and Quality Management, 22(2), 262-280. 693
Sabouhi, M. S., & Mardani, M. (2013). Application of Robust Optimization Approach for Agricultural 694
Water Resource Management under Uncertainty. Journal of Irrigation and Drainage 695
Engineering, 139(7), 571-581 696
Tan, Q., & Zhang, T. (2018). Robust fractional programming approach for improving agricultural 697
water-use efficiency under uncertainty. Journal of Hydrology, 564, 1110-1119. Retrieved from 698
http://www.sciencedirect.com/science/article/pii/S0022169418305948. 699
doi:https://doi.org/10.1016/j.jhydrol.2018.07.080 700
Tseng, M.-L., Chiu, S. F., Tan, R. R., & Siriban-Manalang, A. B. (2013). Sustainable consumption and 701
production for Asia: sustainability through green design and practice. Journal of Cleaner 702
Production, 40, 1-5. 703

37
Wang, Y., Liu, L., Guo, S., Yue, Q., & Guo, P. (2019). A bi-level multi-objective linear fractional 704
programming for water consumption structure optimization based on water shortage risk. 705
Journal of Cleaner Production, 237, 117829. Retrieved from 706
http://www.sciencedirect.com/science/article/pii/S0959652619326897. 707
doi:https://doi.org/10.1016/j.jclepro.2019.117829 708
Wineman, A., & Crawford, E. W. (2017). Climate change and crop choice in Zambia: A mathematical 709
programming approach. NJAS - Wageningen Journal of Life Sciences, 81, 19-31. Retrieved 710
from http://www.sciencedirect.com/science/article/pii/S1573521417300040. 711
doi:http://dx.doi.org/10.1016/j.njas.2017.02.002 712
Zeng, X., Kang, S., Li, F., Zhang, L., & Guo, P. (2010). Fuzzy multi-objective linear programming 713
applying to crop area planning. Agricultural Water Management, 98(1), 134-142. 714
Zhang, C., Engel, B. A., Guo, P., Zhang, F., Guo, S., Liu, X., & Wang, Y. (2018). An inexact robust 715
two-stage mixed-integer linear programming approach for crop area planning under 716
uncertainty. Journal of Cleaner Production, 204, 489-500. Retrieved from 717
http://www.sciencedirect.com/science/article/pii/S0959652618327173. 718
doi:https://doi.org/10.1016/j.jclepro.2018.09.005 719
Zhang, C., Li, M., & Guo, P. (2017). An interval multistage joint-probabilistic chance-constrained 720
programming model with left-hand-side randomness for crop area planning under uncertainty. 721
Journal of Cleaner Production, 167, 1276-1289. Retrieved from 722
http://www.sciencedirect.com/science/article/pii/S0959652617311447. 723
doi:https://doi.org/10.1016/j.jclepro.2017.05.191 724
Zhang, F., Zhang, C., Yan, Z., Guo, S., Wang, Y., & Guo, P. (2018). An interval nonlinear 725
multiobjective programming model with fuzzy-interval credibility constraint for crop monthly 726
water allocation. Agricultural Water Management, 209, 123-133. Retrieved from 727
http://www.sciencedirect.com/science/article/pii/S0378377418310692. 728
doi:https://doi.org/10.1016/j.agwat.2018.07.026 729
730

Figures
Figure 1
Tree dimensions of sustainable optimal cropping pattern
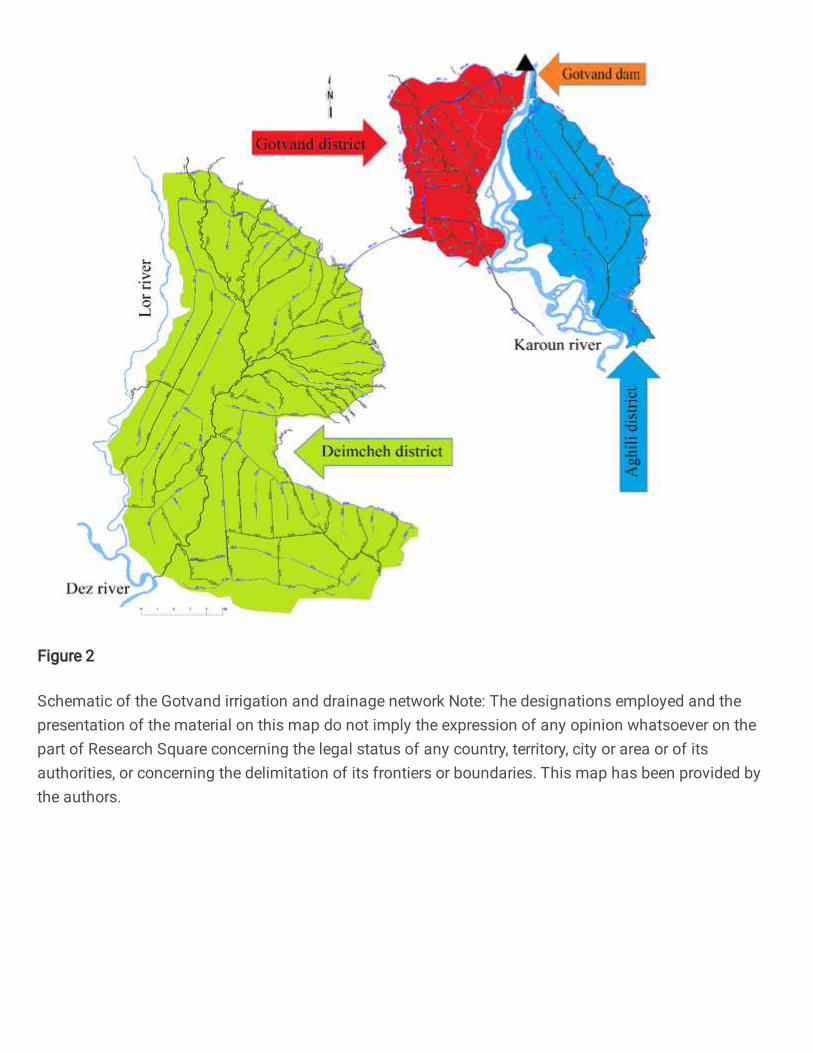
Figure 2
Schematic of the Gotvand irrigation and drainage network Note: The designations employed and thepresentation of the material on this map do not imply the expression of any opinion whatsoever on thepart of Research Square concerning the legal status of any country, territory, city or area or of itsauthorities, or concerning the delimitation of its frontiers or boundaries. This map has been provided bythe authors.

Figure 3
Monte Carlo simulation process to evaluate the capability of a robust multi-objective linear fractionalprogramming model

Figure 4
Total pro�t at different levels of p in the Gotvand irrigation and drainage network regions

Figure 5
Infeasibility percentage of the proposed model assuming uniform distribution over a given interval

Figure 6
Infeasibility percentage of the proposed model assuming normal distribution with 95% convergence