Mathematical Practices - Ledyard
53
Approved 2013 Integrated Math 2 Unit 1: Parallel and Perpendicular Lines 1 Pacing: 12 days plus 3 days for enrichment and reteaching Mathematical Practices Mathematical Practices #1 and #3 describe a classroom environment that encourages thinking mathematically and are critical for quality teaching and learning. Practices in bold are to be emphasized in the unit. 1. Make sense of problems and persevere in solving them. 2. Reason abstractly and quantitatively. 3. Construct viable arguments and critique the reasoning of others. 4. Model with mathematics. 5. Use appropriate tools strategically. 6. Attend to precision. 7. Look for and make use of structure. 8. Look for and express regularity in repeated reasoning. Domain and Standards Overview Make geometric constructions Prove simple geometric theorems about parallel and perpendicular lines
Transcript of Mathematical Practices - Ledyard

Approved 2013 Integrated Math 2
Unit 1: Parallel and Perpendicular Lines
1
Pacing: 12 days plus 3 days for enrichment and reteaching
Mathematical Practices Mathematical Practices #1 and #3 describe a classroom environment that encourages thinking mathematically and are critical for quality teaching and learning. Practices in bold are to be emphasized in the unit. 1. Make sense of problems and persevere in solving them. 2. Reason abstractly and quantitatively. 3. Construct viable arguments and critique the reasoning of others. 4. Model with mathematics. 5. Use appropriate tools strategically. 6. Attend to precision. 7. Look for and make use of structure. 8. Look for and express regularity in repeated reasoning.
Domain and Standards Overview Make geometric constructions Prove simple geometric theorems about parallel and perpendicular lines

Approved 2013 Integrated Math 2
Unit 1: Parallel and Perpendicular Lines
2
Priority and Supporting CCSS Explanations and Examples
G-CO1: Know precise definitions of angle, perpendicular line, parallel line. G-GPE5: Prove the slope criteria for parallel and perpendicular lines. CC.9-12.G.CO.9 Prove theorems about lines and angles. Theorems include: vertical angles are congruent; when a transversal crosses parallel lines, alternate interior angles are congruent and corresponding angles are congruent; points on a perpendicular bisector of a line segment are exactly those equidistant from the segment's endpoints. G-CO12: Make formal geometric constructions with a variety of tools and methods (compass and straight edge, string, reflective devices, paper folding, dynamic geometric software, etc.).
Understand basic (undefined) terms of geometry and basic postulates of geometry Identify parallel lines, skew lines, perpendicular lines Recognize and write conditional statements, their converses, biconditionals (if applicable), and valid definitions Relate slopes of parallel or perpendicular line Identify angle pairs Prove and apply theorems about angles Identify angles formed by two lines and a transversal Prove and use properties of parallel lines Use a transversal in proving lines parallel Relate parallel and perpendicular lines Use a compass and straight edge to construct congruent angles. Use a compass and straight edge to construct a line parallel to a given line. Use a compass and straight edge to construct a line perpendicular to a given line.
Approved 2013 Integrated Math 2
Unit 1: Parallel and Perpendicular Lines
3
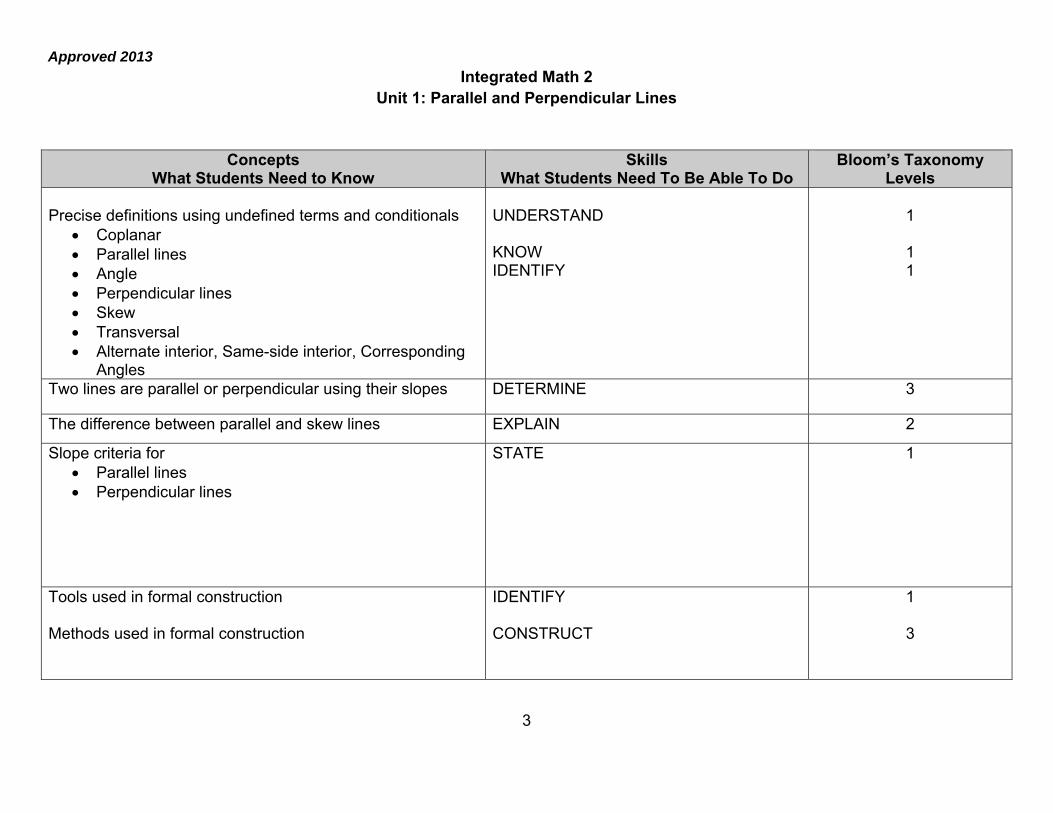
Concepts What Students Need to Know
Skills What Students Need To Be Able To Do
Bloom’s Taxonomy Levels
Precise definitions using undefined terms and conditionals
Coplanar Parallel lines Angle Perpendicular lines Skew Transversal Alternate interior, Same-side interior, Corresponding
Angles
UNDERSTAND KNOW IDENTIFY
1
1 1
Two lines are parallel or perpendicular using their slopes DETERMINE 3
The difference between parallel and skew lines EXPLAIN 2
Slope criteria for Parallel lines Perpendicular lines
STATE
1
Tools used in formal construction Methods used in formal construction
IDENTIFY CONSTRUCT
1
3

Approved 2013 Integrated Math 2
Unit 1: Parallel and Perpendicular Lines
4
Unit Vocabulary
line, coplanar, parallel lines, skew lines, perpendicular lines, slope, counterexample, conditional, converse, biconditional, hypothesis, conclusion, truth value
Essential Questions
In what ways can congruence be useful? How can algebra be useful when expressing geometric properties? How can mathematical reasoning be supported?
Corresponding Big Ideas Proving and modeling congruence provides a basis for modeling situations geometrically. Algebra can be used to efficiently and effectively describe and apply geometric properties. A well-crafted argument requires a thoughtful and logical progression of mathematically sound statements and supporting evidence.
Standardized Assessment Correlations (State, College and Career)
Expectations for Learning (in development) This information will be included as it is developed at the national level. CT is a governing member of the Smarter Balanced Assessment Consortium (SBAC) and has input into the development of the assessment.

Approved 2013 Integrated Math 2
Unit 1: Parallel and Perpendicular Lines
5
LEARNING ACTIVITIES
Topic Section in Text PH Geometry
CCSS
Conditional Statements, Biconditionals, Definitions
2.1 and 2.2 G-CO1
Measure Angles 1.4 G-CO1
Basic Construction (copy angle)
Construct line parallel to a given line
Construct line perpendicular to a given line
1.5 G-CO12
Unit Assessments The items developed for this section can be used during the course of instruction when deemed appropriate by the teacher. Mid test Unit test Performance task(s)
Approved 2013 Integrated Math 2
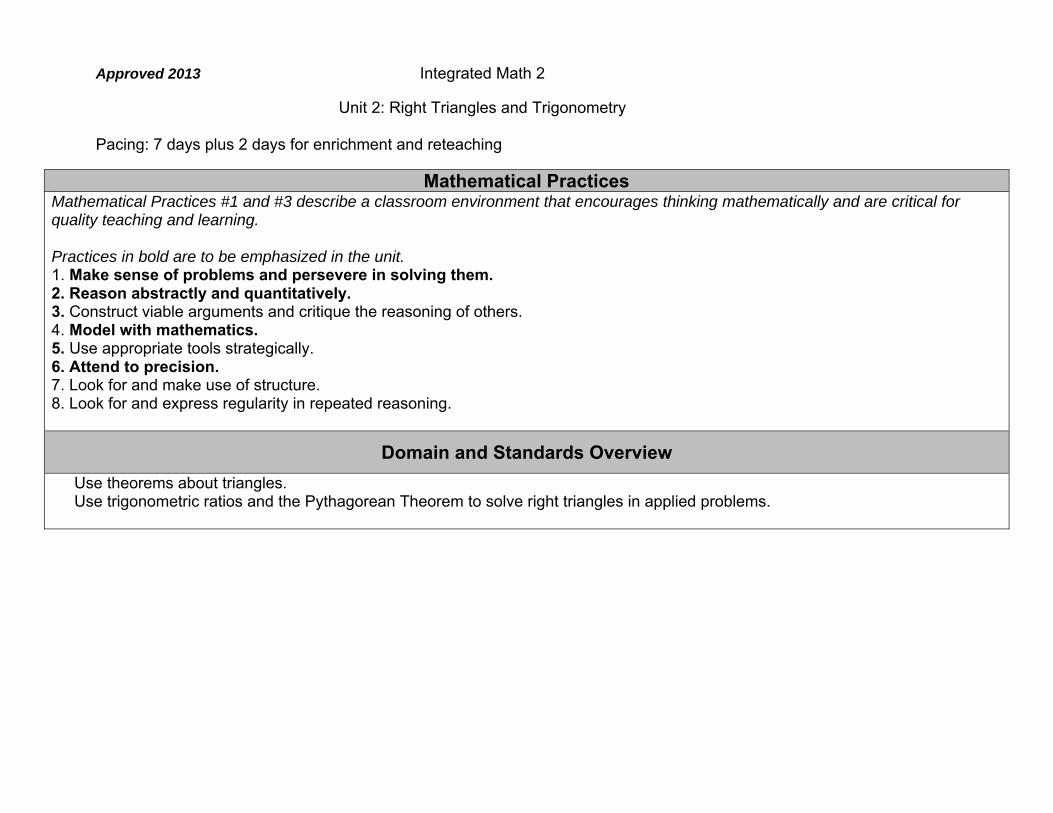
Unit 2: Right Triangles and Trigonometry
Pacing: 7 days plus 2 days for enrichment and reteaching
Mathematical Practices Mathematical Practices #1 and #3 describe a classroom environment that encourages thinking mathematically and are critical for quality teaching and learning. Practices in bold are to be emphasized in the unit. 1. Make sense of problems and persevere in solving them. 2. Reason abstractly and quantitatively. 3. Construct viable arguments and critique the reasoning of others. 4. Model with mathematics. 5. Use appropriate tools strategically. 6. Attend to precision. 7. Look for and make use of structure. 8. Look for and express regularity in repeated reasoning.
Domain and Standards Overview Use theorems about triangles. Use trigonometric ratios and the Pythagorean Theorem to solve right triangles in applied problems.

Approved 2013 Integrated Math 2
Unit 2: Right Triangles and Trigonometry
Priority and Supporting CCSS Explanations and Examples
CC.9-12.G.SRT.8 Use trigonometric ratios and the Pythagorean Theorem to solve right triangles in applied problems (Triangle inequality theorem) CC.9-12.G.SRT.8 Use trigonometric ratios and the Pythagorean Theorem to solve right triangles in applied problems.*
To use inequalities involving angles and sides of triangles Students may use geometric simulations (computer software or graphing calculator) to explore theorems about lines and angles. Use the Pythagorean Theorem and its Converse Use the properties of 45-45-90 and 30-60-90 triangles Use tangent ratios to determine side lengths in triangles Use sine and cosine ratios to determine side lengths in triangles Use angles of elevation and depression to solve problems Students may use geometric simulations (computer software or graphing calculator) to explore theorems about triangles
Concepts What Students Need to Know
Skills What Students Need To Be Able To Do
Bloom’s Taxonomy Levels
the relative size of side lengths and angle measures in a triangle using the Triangle Inequality Theorem and Triangle Angle-Side Theorem (longest side opposite largest angle)
trigonometric ratios and the Pythagorean Theorem to
solve right triangles in applied problems
DETERMINE USE
3
3
Approved 2013 Integrated Math 2
Unit 2: Right Triangles and Trigonometry
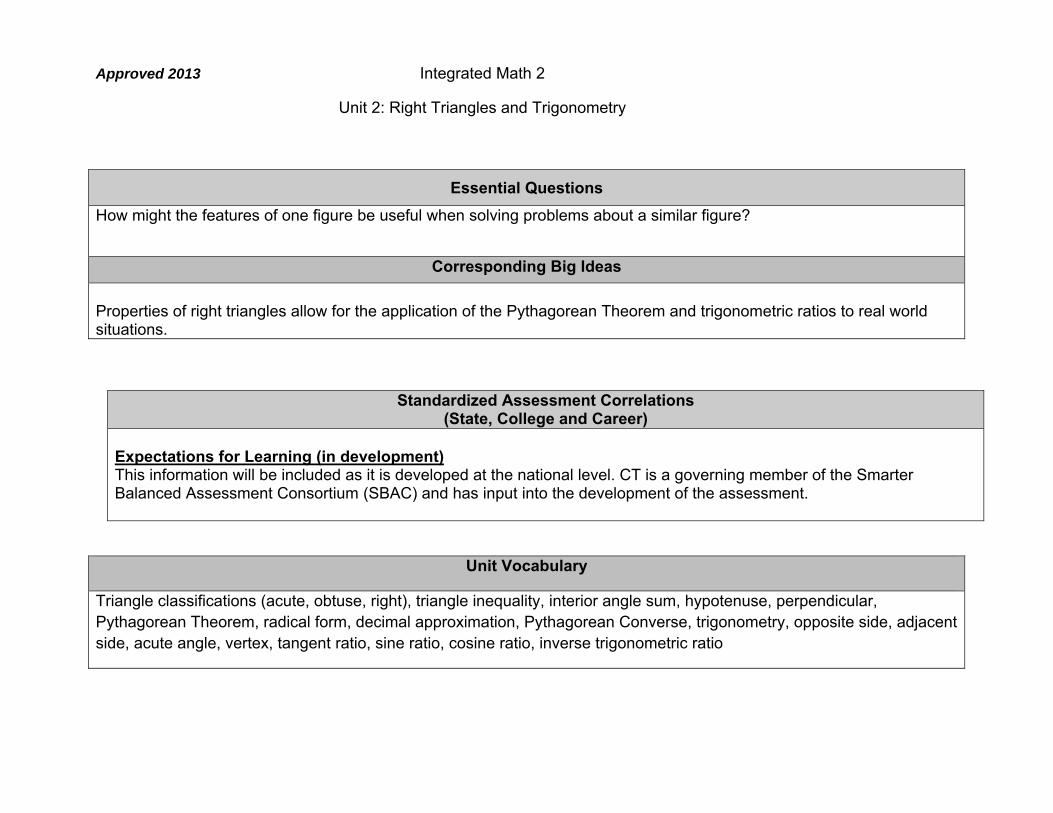
Unit Vocabulary
Triangle classifications (acute, obtuse, right), triangle inequality, interior angle sum, hypotenuse, perpendicular, Pythagorean Theorem, radical form, decimal approximation, Pythagorean Converse, trigonometry, opposite side, adjacent side, acute angle, vertex, tangent ratio, sine ratio, cosine ratio, inverse trigonometric ratio
Essential Questions How might the features of one figure be useful when solving problems about a similar figure?
Corresponding Big Ideas Properties of right triangles allow for the application of the Pythagorean Theorem and trigonometric ratios to real world situations.
Standardized Assessment Correlations (State, College and Career)
Expectations for Learning (in development) This information will be included as it is developed at the national level. CT is a governing member of the Smarter Balanced Assessment Consortium (SBAC) and has input into the development of the assessment.
Approved 2013 Integrated Math 2
Unit 2: Right Triangles and Trigonometry
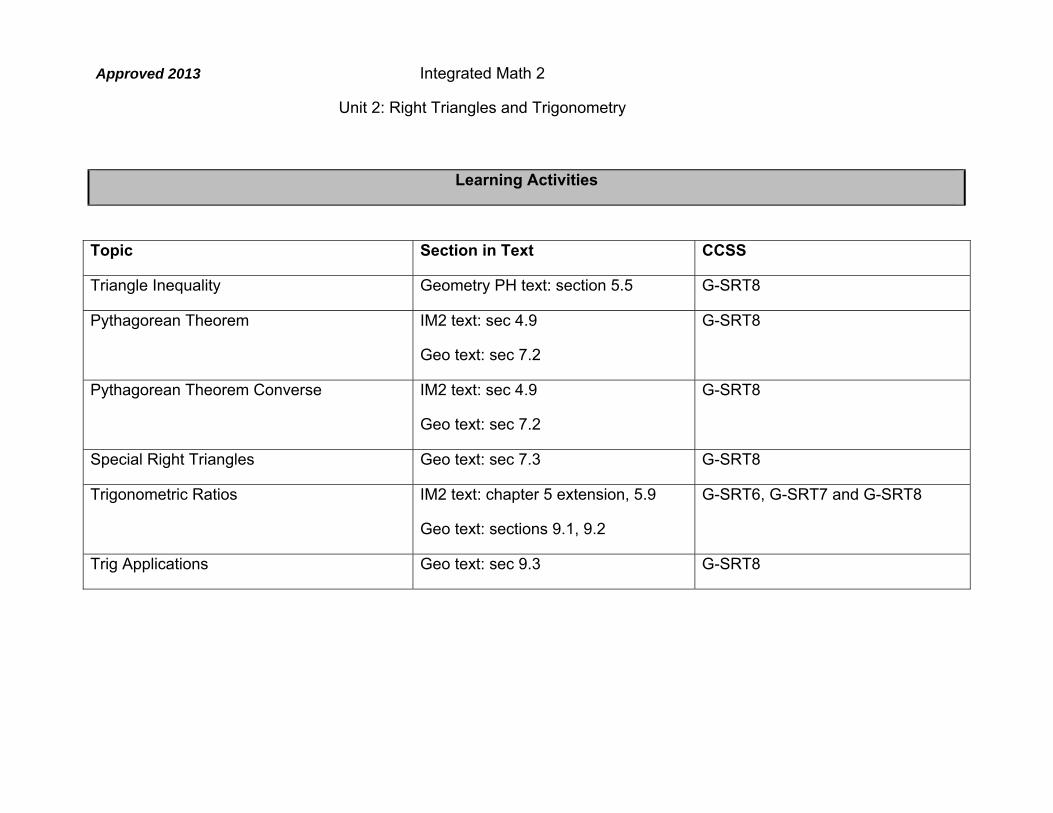
Learning Activities
Topic Section in Text CCSS
Triangle Inequality Geometry PH text: section 5.5 G-SRT8
Pythagorean Theorem IM2 text: sec 4.9
Geo text: sec 7.2
G-SRT8
Pythagorean Theorem Converse IM2 text: sec 4.9
Geo text: sec 7.2
G-SRT8
Special Right Triangles Geo text: sec 7.3 G-SRT8
Trigonometric Ratios IM2 text: chapter 5 extension, 5.9
Geo text: sections 9.1, 9.2
G-SRT6, G-SRT7 and G-SRT8
Trig Applications Geo text: sec 9.3 G-SRT8

Approved 2013 Integrated Math 2
Unit 2: Right Triangles and Trigonometry
Unit Assessments The items developed for this section can be used during the course of instruction when deemed appropriate by the teacher. Mid Test Unit Test Performance Task(s)

Approved 2013 Integrated Math 2 Unit 3: Volume
1
Pacing: 12 days + 2 days for enrichment and reteaching
Mathematical Practices Mathematical Practices #1 and #3 describe a classroom environment that encourages thinking mathematically and are critical for quality teaching and learning. Practices in bold are to be emphasized in the unit. 1. Make sense of problems and persevere in solving them. 2. Reason abstractly and quantitatively. 3. Construct viable arguments and critique the reasoning of others. 4. Model with mathematics. 5. Use appropriate tools strategically. 6. Attend to precision. 7. Look for and make use of structure. 8. Look for and express regularity in repeated reasoning.
Domain and Standards Overview Explain volume formulas and use them to solve problems. Visualize relationships between two-dimensional and three-dimensional objects. Apply geometric concepts in modeling situations.

Approved 2013 Integrated Math 2 Unit 3: Volume
2
Priority and Supporting CCSS Explanations and Examples
CC.9-12.G.GMD.3 Use volume formulas for cylinders, pyramids, cones, and spheres to solve problems.* N-Q 1. Use units as a way to understand problems and to guide the solution of multi-step problems; choose and interpret units consistently in formulas N-Q 3. Choose a level of accuracy appropriate to limitations on measurement when reporting quantities.
Find the volume of a solid including the following: prism, cylinder, pyramid, cone, sphere Find the volume of a composite solid Given the volume of a solid, work backwards to find a missing dimension. In all problem situations the answer should be reported with appropriate units.
Concepts What Students Need to Know
Skills What Students Need To Be Able To Do
Bloom’s Taxonomy Levels
● Volume formulas for o Cylinders o Pyramids o Cones o Spheres
USE (to solve problems) 3

Approved 2013 Integrated Math 2 Unit 3: Volume
3
Essential Questions
How can two-dimensional figures be used to understand three-dimensional objects? In what ways can geometric figures be used to understand real world situations?
Corresponding Big Ideas Two-dimensional figures can be “stacked” to create three-dimensional objects and generate volume formulas. Geometric definitions, properties, and theorems allow one to describe, model, and analyze situations in the real world.
Unit Vocabulary
Volume, base area, height, perpendicular height, prism, cylinder, pyramid, cone, sphere, in terms of pi, decimal approximation, linear units, square units, cubic units
Standardized Assessment Correlations (State, College and Career)
Expectations for Learning (in development) This information will be included as it is developed at the national level. CT is a governing member of the Smarter Balanced Assessment Consortium (SBAC) and has input into the development of the assessment.

Approved 2013 Integrated Math 2 Unit 3: Volume
4
Learning Activities
Topic Section in Text CCSS
Review: Area formulas 8.7, 8.8 7.G.4, 7.G.6
Review: Volume of Prism and Cylinder IM2 text: 9.6
Geo text: 10.5
G-GMD1, G-GMD3
Volume of Pyramid and Cone IM2 text: 9.7
Geo text: 10.6
G-GMD1, G-GMD3
Volume of Spheres IM2 text: 9.7 extension
Geo text: 10.7
G-GMD3
Modeling Embedded
CAPT released items
G-MG1, G-MG2,
G-MG3
Unit Assessments The items developed for this section can be used during the course of instruction when deemed appropriate by the teacher. Mid test Unit test Performance task(s)

Approved 2013 Integrated Math 2 Unit 3: Volume
5
Approved 2013 Integrated Math 2
Unit 4: Expressions, Equations and Inequalities
1
Adapted from The Leadership and Learning Center “Rigorous Curriculum Design” model. *Adapted from the Arizona Academic Content Standards.
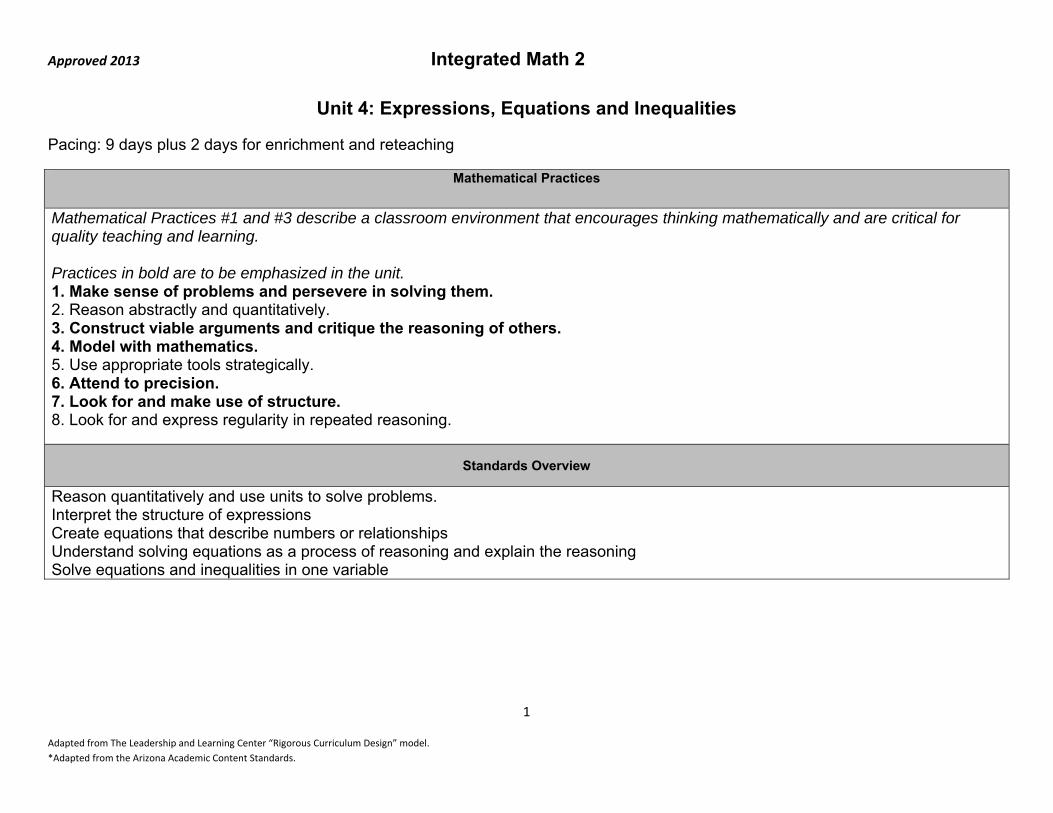
Pacing: 9 days plus 2 days for enrichment and reteaching
Mathematical Practices
Mathematical Practices #1 and #3 describe a classroom environment that encourages thinking mathematically and are critical for quality teaching and learning. Practices in bold are to be emphasized in the unit. 1. Make sense of problems and persevere in solving them. 2. Reason abstractly and quantitatively. 3. Construct viable arguments and critique the reasoning of others. 4. Model with mathematics. 5. Use appropriate tools strategically. 6. Attend to precision. 7. Look for and make use of structure. 8. Look for and express regularity in repeated reasoning.
Standards Overview
Reason quantitatively and use units to solve problems. Interpret the structure of expressions Create equations that describe numbers or relationships Understand solving equations as a process of reasoning and explain the reasoning Solve equations and inequalities in one variable
Approved 2013 Integrated Math 2
Unit 4: Expressions, Equations and Inequalities
2
Adapted from The Leadership and Learning Center “Rigorous Curriculum Design” model. *Adapted from the Arizona Academic Content Standards.
Priority and Supporting CCSS Explanations and Examples*
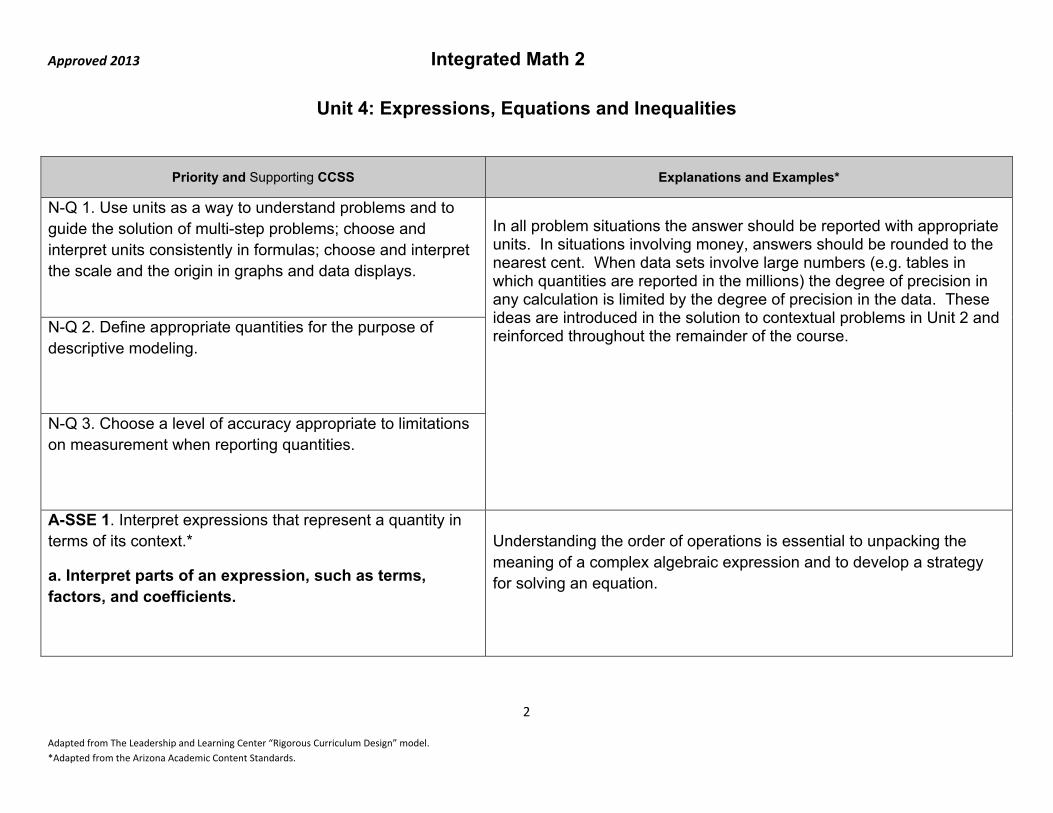
N-Q 1. Use units as a way to understand problems and to guide the solution of multi-step problems; choose and interpret units consistently in formulas; choose and interpret the scale and the origin in graphs and data displays.
In all problem situations the answer should be reported with appropriate units. In situations involving money, answers should be rounded to the nearest cent. When data sets involve large numbers (e.g. tables in which quantities are reported in the millions) the degree of precision in any calculation is limited by the degree of precision in the data. These ideas are introduced in the solution to contextual problems in Unit 2 and reinforced throughout the remainder of the course.
N-Q 2. Define appropriate quantities for the purpose of descriptive modeling.
N-Q 3. Choose a level of accuracy appropriate to limitations on measurement when reporting quantities.
A-SSE 1. Interpret expressions that represent a quantity in terms of its context.*
a. Interpret parts of an expression, such as terms, factors, and coefficients.
Understanding the order of operations is essential to unpacking the meaning of a complex algebraic expression and to develop a strategy for solving an equation.

Approved 2013 Integrated Math 2
Unit 4: Expressions, Equations and Inequalities
3
Adapted from The Leadership and Learning Center “Rigorous Curriculum Design” model. *Adapted from the Arizona Academic Content Standards.
Priority and Supporting CCSS Explanations and Examples*
b. Interpret complicated expressions by viewing one or more of their parts as a single entity...
Using the commutative, associative and distributive properties enables students to find equivalent expressions, which are helpful in solving equations.
A-CED 1. (part) Create equations and inequalities in one variable and use them to solve problems. Include equations arising from linear ... functions
Here are some examples where students can create equations and inequalities.
a. (Two step equation) The bank charges a monthly fee of $2.25 for your Dad’s checking account and an additional $1.25 for each transaction with his debit card, whether used at an ATM machine or by using the card to make a purchase. He noticed a transaction charge of $13.50 on this month’s statement. He is trying to remember how many times he used the debit card. Can you use the information on the statement help him figure out how many transactions he made?
b. (Equations with variables on both sides) Willie and Malia have
been hired by two different neighbors to pick-up mail and newspapers while they are on vacation. Willie will be paid $7 plus $3 per day. Malia will be paid $10 plus $3 per day. By which day will they have earned the same amount of money?

Approved 2013 Integrated Math 2
Unit 4: Expressions, Equations and Inequalities
4
Adapted from The Leadership and Learning Center “Rigorous Curriculum Design” model. *Adapted from the Arizona Academic Content Standards.
Priority and Supporting CCSS Explanations and Examples*
c. (Equations which require using the distributive property) Jessica wanted to buy 7 small pizzas but she only had four, $2 off, coupons. So, she bought four with the discount and paid full price for the other three, and the bill came to $44.50. How much was each small pizza?
d. (Inequality) The student council has set aside $6,000 to purchase the shirts. (They plan to sell them later at double the price.) How many shirts can they buy at the price they found online if the shipping costs are $14?
A-CED 4. Rearrange formulas to highlight a quantity of interest, using the same reasoning as in solving equations. For example, rearrange Ohm’s law V = IR to highlight resistance R.
Begin with a familiar formula such as one for the perimeter of a rectangle: p = 2l + 2w. Consider this progression of problems:
(a) Values for the variables l and w are given. We can find p by substituting for l and w and evaluating the expression on the right side.
(b) Values for the variables l and p are given. We can find w by substituting for l and p and solving the equation for w.
(c) We can find a formula for w in terms of l and p, by following the same steps as in (b) above to solve for w. This gives us a general method for finding w when the other variables are known. (Check this new formula by showing that it gives the correct value for w when the values of l and p from (b) are

Approved 2013 Integrated Math 2
Unit 4: Expressions, Equations and Inequalities
5
Adapted from The Leadership and Learning Center “Rigorous Curriculum Design” model. *Adapted from the Arizona Academic Content Standards.
Priority and Supporting CCSS Explanations and Examples*
substituted. )
A-REI 1. Explain each step in solving a simple equation as following from the equality of numbers asserted at the previous step, starting from the assumption that the original equation has a solution. Construct a viable argument to justify a solution method.
For two-step equations, flow charts may be used to help students “undo” the order of operations to find the value of a variable. For example, this flow chart may be used to solve the equation 4x – 2 = 30.
Then students learn to solve equations by performing the same operation (except for division by zero) on both sides of the equal sign. 4x – 2 = 30 +2 +2 4x = 32 4 4 x = 8
A-REI 3. Solve linear equations and inequalities in one variable, including equations with coefficients represented by letters.

Approved 2013 Integrated Math 2
Unit 4: Expressions, Equations and Inequalities
6
Adapted from The Leadership and Learning Center “Rigorous Curriculum Design” model. *Adapted from the Arizona Academic Content Standards.
Priority and Supporting CCSS Explanations and Examples*
In solving multiple-step equations students should realize that there may be several valid solution paths. For example here are two approaches to the equation 3x + 10 = 7x – 6. 3x + 10 = 7x – 6 3x + 10 = 7x – 6
–3x –3x –7x –7x
10 = 4x – 6 –4x + 10 = –6
+6 +6 –10 –10
16 = 4x –4x = –16
4 4 –4 –4
4 = x x = 4

Approved 2013 Integrated Math 2
Unit 4: Expressions, Equations and Inequalities
7
Adapted from The Leadership and Learning Center “Rigorous Curriculum Design” model. *Adapted from the Arizona Academic Content Standards.
Concepts
What Students Need to Know Skills
What Students Need To Be Able To Do Bloom’s Taxonomy
Levels Order of operations Expression vs. equation Inequality Associative property Commutative property Distributive property Inverse operations
Model (with linear equation or inequality) Solve (linear equation or inequality) Simplify (expression) Use (algebraic properties) Select (appropriate units, degree of precision)
3
3 2 3 5
Essential Questions
How is an expression different than an equation?
What does equality mean?
What is an inequality?
How can we use linear equations and linear inequalities to solve real world problems?
What is a solution set for a linear equation or linear inequality?
How can models and technology aid in the solving of linear equations and linear inequalities?

Approved 2013 Integrated Math 2
Unit 4: Expressions, Equations and Inequalities
8
Adapted from The Leadership and Learning Center “Rigorous Curriculum Design” model. *Adapted from the Arizona Academic Content Standards.
Standardized Assessment Correlations
(State, College and Career) CAPT through 2014, Smarter Balance assessment thereafter.
VocabularyVariable, algebraic expression, equation, open sentence, simplify, exponent, base, power, evaluate, additive inverse, properties of equalities (multiplicative identify, additive identity, associative, commutative, distributive), term, constant, coefficient, like terms, inverse operations, identity (x=x), solution, solution set.
Topic Section in Text
Mathematics Course 3
CCSS
Real number operations (review) Simplify numerical expressions using
order of operations, with an emphasis on fractions
1.1, 1.7
A-SSE 1
Corresponding Big Ideas To obtain a solution to an equation, no matter how complex, always involves the process of undoing the operations.
Learning Activities

Approved 2013 Integrated Math 2
Unit 4: Expressions, Equations and Inequalities
9
Adapted from The Leadership and Learning Center “Rigorous Curriculum Design” model. *Adapted from the Arizona Academic Content Standards.
Variable Expressions Interpret parts of an expression, such as
terms, factors, and coefficients. Simplify by combining like terms
Associative Property
Commutative Property
Distributive Property
Simplify by using properties
Translate word sentences into variable expressions
Evaluate variable expressions involving the combination of like terms and distribution
2.3
A-SSE.1a
A-SSE.1b
A-SSE.2
Solve Multi-step Linear Equations
Define the use of inverse operations to solve equations
Justify steps using equality of numbers, properties from algebra
Rearrange formulas to highlight a quantity of interest.
Create and solve equations to solve problems.
2.4
A-CED.1
A-CED.4
A-REI.1
A-REI.3

Approved 2013 Integrated Math 2
Unit 4: Expressions, Equations and Inequalities
10
Adapted from The Leadership and Learning Center “Rigorous Curriculum Design” model. *Adapted from the Arizona Academic Content Standards.
Solve Multi-step Inequalities
Define the use of inverse operations to solve inequalities
Justify steps using equality of numbers, properties from algebra *inequality sign reversal when multiplying or dividing by a negative number.
Graph solution sets on a number line
Create and solve inequalities to solve problems.
2.6, 2.7
A-CED.1
A-CED.4
A-REI.1
A-REI.3
Unit Assessments The items developed for this section can be used during the course of instruction when deemed appropriate by the teacher. End-of-unit test Performance Task CAPT Practice Problems – See appendix

Approved 2013 Integrated Math 2
Unit 5: Transformations
1
Pacing: 6 days + 2 days for enrichment and reteaching
Mathematical Practices Mathematical Practices #1 and #3 describe a classroom environment that encourages thinking mathematically and are critical for quality teaching and learning. Practices in bold are to be emphasized in the unit. 1. Make sense of problems and persevere in solving them. 2. Reason abstractly and quantitatively. 3. Construct viable arguments and critique the reasoning of others. 4. Model with mathematics. 5. Use appropriate tools strategically. 6. Attend to precision. 7. Look for and make use of structure. 8. Look for and express regularity in repeated reasoning.
Domain and Standards Overview Given a geometric figure and a rotation, reflection, or translation, draw the transformed figure using graph paper, tracing paper, or geometry software. Specify a sequence of transformations that will carry a given figure onto another. Verify experimentally the properties of dilations given by a center and a scale factor. Apply geometric concepts in modeling situations.

Approved 2013 Integrated Math 2
Unit 5: Transformations
2
Priority and Supporting CCSS Explanations and Examples
CC.9-12.G.CO.4 Develop definitions of rotations, reflections, and translations in terms of angles, circles, perpendicular lines, parallel lines, and line segments. CC.9-12.G.CO.2 Represent transformations in the plane using, e.g., transparencies and geometry software; describe transformations as functions that take points in the plane as inputs and give other points as outputs. Compare transformations that preserve distance and angle to those that do not (e.g., translation versus horizontal stretch). CC.9-12.G.CO.5 Given a geometric figure and a rotation, reflection, or translation, draw the transformed figure using, e.g., graph paper, tracing paper, or geometry software. Specify a sequence of transformations that will carry a given figure onto another. CC.9-12.G.SRT.1 Verify experimentally the properties of dilations given by a center and a scale factor:
a. A dilation takes a line not passing through the center of the dilation to a parallel line, and leaves a line passing through the center unchanged.
b. The dilation of a line segment is longer or shorter in the ratio given by the scale factor.
Students may use geometry software and/or manipulatives to model transformations. Students may observe patterns and develop definitions of rotations, reflections, and translations.
Students may use geometry software and/or manipulatives to model and compare transformations.
Students may use geometry software and/or manipulatives to model transformations and demonstrate a sequence of transformations that will carry a given figure onto another.
A dilation is a transformation that moves each point along the ray through the point emanating from a fixed center, and multiplies distances from the center by a common scale factor.
Students may use geometric simulation software to model transformations. Students may observe patterns and verify experimentally the properties of dilations.

Approved 2013 Integrated Math 2
Unit 5: Transformations
3
Essential Questions
In what ways can geometric figures be used to understand real world situations? In what ways can congruence be useful? How might the features of one figure be useful when solving problems about a similar figure?
Corresponding Big Ideas
Concepts What Students Need to Know
Skills What Students Need To Be Able To Do
Bloom’s Taxonomy Levels
Transformations – isometries Translations, Reflections, Rotations, Compositions
o Graph using graph paper, tracing paper, geometry software
o Determine the coordinates of an image when a transformation rule is applied to the preimage
o Communicate using arrow notation, lines of reflection, centers of rotation, angles of rotation
Dilations (non-isometry)
o Graph using graph paper, tracing paper, geometry software
o Determine the coordinates of an image when transformation information is applied to the preimage
DEFINE DEFINE GRAPH CALCULATE COMMUNICATE IN WRITING/USING MATHEMATICAL NOTATION DEFINE GRAPH CALCULATE
2
2
3
3
3
2
3
3

Approved 2013 Integrated Math 2
Unit 5: Transformations
4
Geometric definitions, properties, and theorems allow one to describe, model, and analyze situations in the real world.
Unit Vocabulary
Transformation, congruence transformation, isometry, image, pre-image, prime notation, coordinates, translation, arrow notation, vector, reflection, symmetry, mirror, line of reflection, equidistant, rotation, center of rotation, counter clockwise, angle of rotation, dilation, scale factor, ratio
Learning Activities
Topic Section in Text CCSS
Isometric Transformations IM2 text: 3.8 G9-12.CO.2
Standardized Assessment Correlations (State, College and Career)
Expectations for Learning (in development) This information will be included as it is developed at the national level. CT is a governing member of the Smarter Balanced Assessment Consortium (SBAC) and has input into the development of the assessment.
Approved 2013 Integrated Math 2
Unit 5: Transformations
5
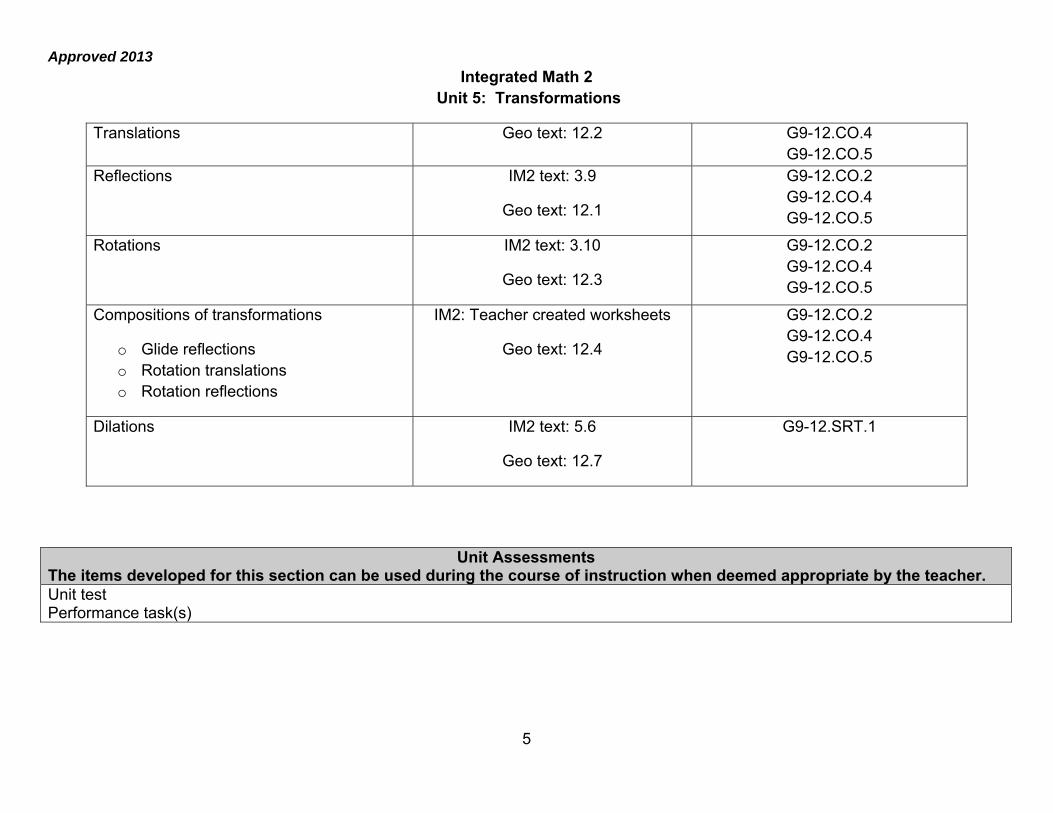
Translations Geo text: 12.2 G9-12.CO.4 G9-12.CO.5
Reflections IM2 text: 3.9
Geo text: 12.1
G9-12.CO.2 G9-12.CO.4 G9-12.CO.5
Rotations IM2 text: 3.10
Geo text: 12.3
G9-12.CO.2 G9-12.CO.4 G9-12.CO.5
Compositions of transformations
o Glide reflections o Rotation translations o Rotation reflections
IM2: Teacher created worksheets
Geo text: 12.4
G9-12.CO.2 G9-12.CO.4 G9-12.CO.5
Dilations IM2 text: 5.6
Geo text: 12.7
G9-12.SRT.1
Unit Assessments The items developed for this section can be used during the course of instruction when deemed appropriate by the teacher. Unit test Performance task(s)

Approved 2013 Integrated Math 2
Unit 6: Functions
1
Adapted from The Leadership and Learning Center “Rigorous Curriculum Design” model. *Adapted from the Arizona Academic Content Standards.
Pacing: 6 days plus 2 days for enrichment and reteaching
Mathematical Practices Mathematical Practices #1 and #3 describe a classroom environment that encourages thinking mathematically and are critical for quality teaching and learning. Practices in bold are to be emphasized in the unit. 1. Make sense of problems and persevere in solving them. 2. Reason abstractly and quantitatively. 3. Construct viable arguments and critique the reasoning of others. 4. Model with mathematics. 5. Use appropriate tools strategically. 6. Attend to precision. 7. Look for and make use of structure. 8. Look for and express regularity in repeated reasoning.
Standards Overview
Understand the concept of a function and use function notation Analyze functions using different representation – equations, tables, graphs Interpret functions that arise in applications in terms of the context

Approved 2013 Integrated Math 2
Unit 6: Functions
2
Adapted from The Leadership and Learning Center “Rigorous Curriculum Design” model. *Adapted from the Arizona Academic Content Standards.
Priority and Supporting CCSS Explanations and Examples*
F-IF 1. Understand that a function from one set (called the domain) to another set (called the range) assigns to each element of the domain exactly one element of the range. If f is a function and x is an element of its domain, then f(x) denotes the output of f corresponding to the input x. The graph of f is the graph of the equation y = f(x).
The domain of a function given by an algebraic expression, unless otherwise specified, is the largest possible domain. Mapping diagrams may be used to introduce the concepts of domain and range. The vertical line test may be used to determine whether a graph represents a function.
F-IF 2. Use function notation, evaluate functions for inputs in their domains, and interpret statements that use function notation in terms of a context.
Examples: If f(x) = x2 + 4x – 12, find f(2) Let f(x) = 10x – 5; find f(1/2), f(-6), f(a) If P(t) is the population of Tucson t years after 2000, interpret the statements P(0) = 487,000 and P(10)-P(9) = 5,900.
Approved 2013 Integrated Math 2
Unit 6: Functions
3
Adapted from The Leadership and Learning Center “Rigorous Curriculum Design” model. *Adapted from the Arizona Academic Content Standards.
Priority and Supporting CCSS Explanations and Examples*
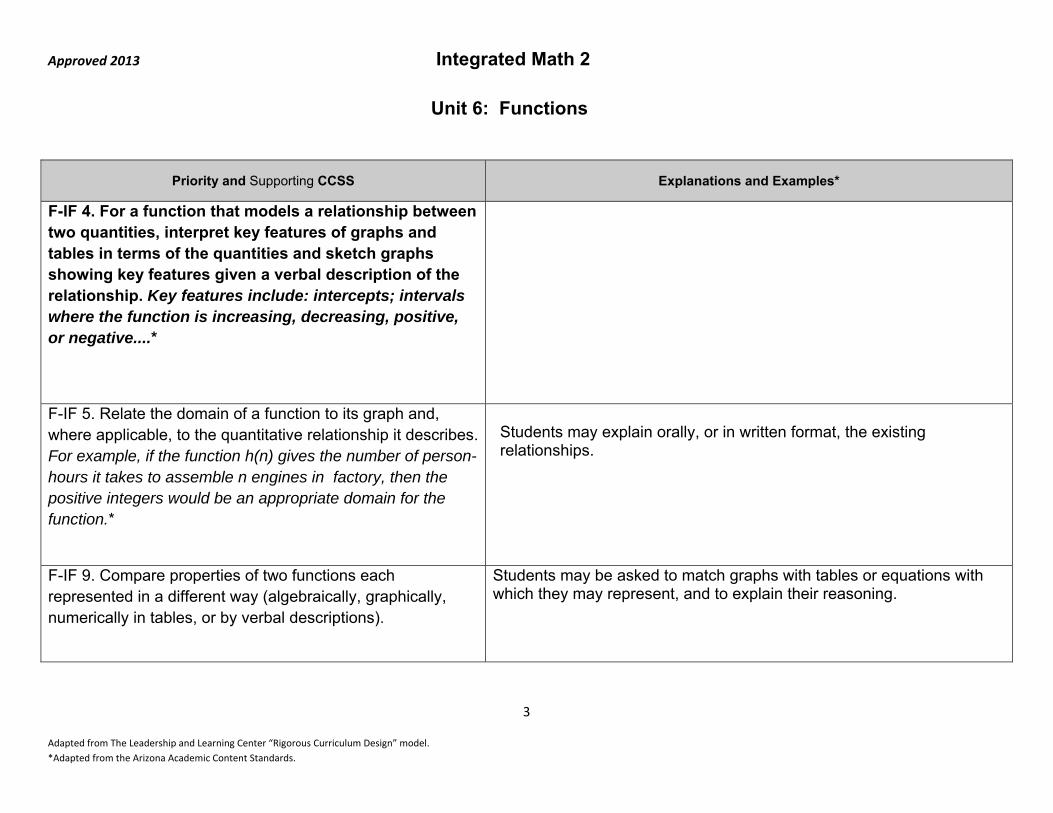
F-IF 4. For a function that models a relationship between two quantities, interpret key features of graphs and tables in terms of the quantities and sketch graphs showing key features given a verbal description of the relationship. Key features include: intercepts; intervals where the function is increasing, decreasing, positive, or negative....*
F-IF 5. Relate the domain of a function to its graph and, where applicable, to the quantitative relationship it describes. For example, if the function h(n) gives the number of person-hours it takes to assemble n engines in factory, then the positive integers would be an appropriate domain for the function.*
Students may explain orally, or in written format, the existing relationships.
F-IF 9. Compare properties of two functions each represented in a different way (algebraically, graphically, numerically in tables, or by verbal descriptions).
Students may be asked to match graphs with tables or equations with which they may represent, and to explain their reasoning.

Approved 2013 Integrated Math 2
Unit 6: Functions
4
Adapted from The Leadership and Learning Center “Rigorous Curriculum Design” model. *Adapted from the Arizona Academic Content Standards.
Priority and Supporting CCSS Explanations and Examples*
A-REI 10. Understand that the graph of an equation in two variables is the set of all its solutions plotted in the coordinate plane, often forming a curve (which could be a line).
The graph below shows the height of a hot air balloon as a function of time. Explain what the point (50, 300) on this graph represents.

Approved 2013 Integrated Math 2
Unit 6: Functions
5
Adapted from The Leadership and Learning Center “Rigorous Curriculum Design” model. *Adapted from the Arizona Academic Content Standards.
Concepts
What Students Need to Know Skills
What Students Need To Be Able To Do Bloom’s Taxonomy
Levels Independent variable Dependent variable Ordered pair Mapping Diagram Table Graph Equation for a function Function notation Domain Range
Relative max or min values Increasing/decreasing functions Vertical Line test X-intercept Y-intercept
Determine (whether or not a relation is a function) Determine (range and domain of a function) Model (a real world situation with a function) Evaluate (a function) Represent a function (with table, graph, equation, mapping diagram) Determine based on real world situation – continuous vs. discrete Determine for Absolute value function Determine from the graph Determine (whether or not a graphed relation is a function) Interpret its meaning in its real world context
4
4
3
3 3
3
3 3 2
4

Approved 2013 Integrated Math 2
Unit 6: Functions
6
Adapted from The Leadership and Learning Center “Rigorous Curriculum Design” model. *Adapted from the Arizona Academic Content Standards.
Essential Questions
What is a function? What are the different ways that functions may be represented? How can functions be used to model real world situations, make predictions, and solve problems
Corresponding Big Ideas Functions are a mathematical way to describe relationships between two quantities that vary.
Standardized Assessment Correlations
(State, College and Career) CAPT through 2014, Smarter Balance assessment thereafter.
Unit Vocabulary
Function, independent and dependent variable, domain, range, relation, vertical line test, function notation, discrete and continuous data, Intercepts, Intervals of increasing / decreasing / positive / negative/constant, input, output, ordered pairs, co-ordinate points, coordinate plane, axis, table of values, mapping, set, evaluate, function rule, end behavior of a linear, slope, slope intercept form

Approved 2013 Integrated Math 2
Unit 6: Functions
7
Adapted from The Leadership and Learning Center “Rigorous Curriculum Design” model. *Adapted from the Arizona Academic Content Standards.
Learning Activities
Topic Section in Text
PH Mathematics Course 3
CCSS
Introduction to Functions
Determine whether a relation is a function given a relation expressed with a set, table or graph
Determine domain and range values for a variety of functions Relate the domain of a function to its graph and where
applicable, to the quantitative relationship it describes. Use function notation to communicate pairings of input and
output values Evaluate functions for inputs in their domain Understand that the graph of an equation in two variables is
the set of all its solutions plotted on the coordinate plane
IM2 Text:12.2, 12.3,12.5
Alg 1 text: 1.4 Objective 2
Alg 1 text: 5.1-5.3, 5.5, 5.6
F-IF.2
F-IF.1
A-REI.10
Approved 2013 Integrated Math 2
Unit 6: Functions
8
Adapted from The Leadership and Learning Center “Rigorous Curriculum Design” model. *Adapted from the Arizona Academic Content Standards.
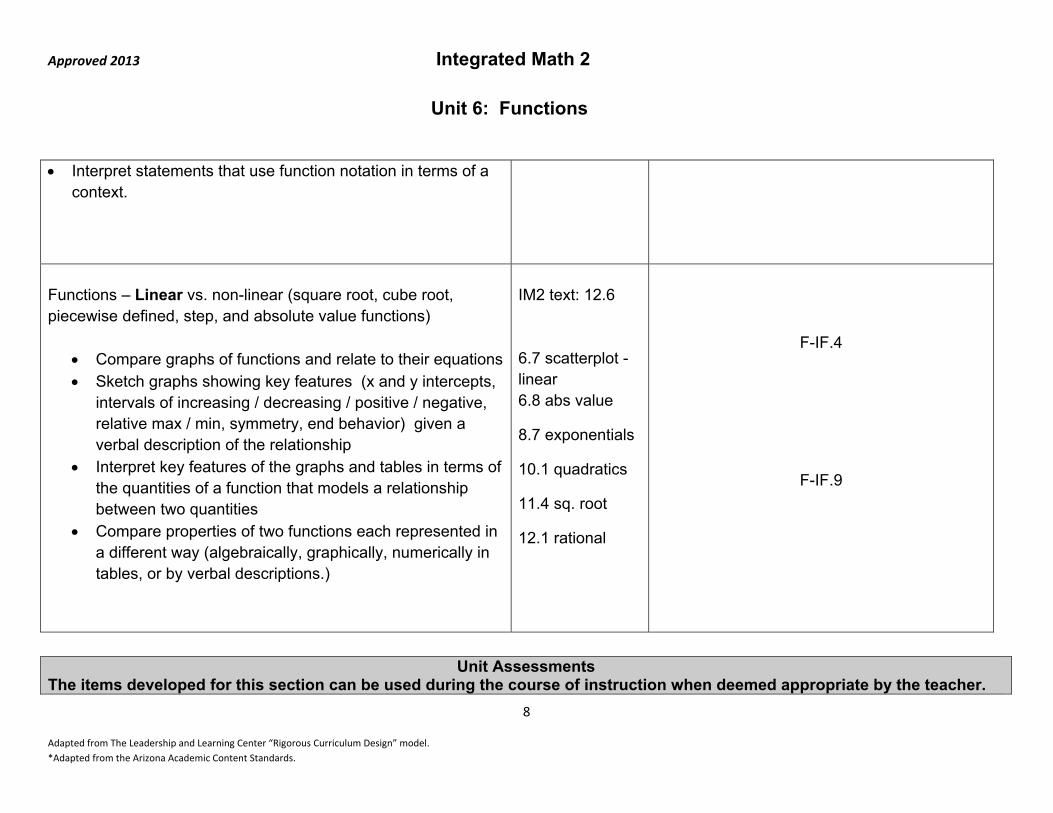
Interpret statements that use function notation in terms of a context.
Functions – Linear vs. non-linear (square root, cube root, piecewise defined, step, and absolute value functions)
Compare graphs of functions and relate to their equations Sketch graphs showing key features (x and y intercepts,
intervals of increasing / decreasing / positive / negative, relative max / min, symmetry, end behavior) given a verbal description of the relationship
Interpret key features of the graphs and tables in terms of the quantities of a function that models a relationship between two quantities
Compare properties of two functions each represented in a different way (algebraically, graphically, numerically in tables, or by verbal descriptions.)
IM2 text: 12.6 6.7 scatterplot - linear 6.8 abs value
8.7 exponentials
10.1 quadratics
11.4 sq. root
12.1 rational
F-IF.4
F-IF.9
Unit Assessments The items developed for this section can be used during the course of instruction when deemed appropriate by the teacher.

Approved 2013 Integrated Math 2
Unit 6: Functions
9
Adapted from The Leadership and Learning Center “Rigorous Curriculum Design” model. *Adapted from the Arizona Academic Content Standards.
End-of-Unit Test Performance Task CAPT released items selected by their alignment to the unit content, are imbedded in the cumulative unit assessment. Other CAPT released items may be used for instructional purposes throughout the unit. See appendix.

Approved 2013 Integrated Math 2
Unit 7: Linear Functions
1
Adapted from The Leadership and Learning Center “Rigorous Curriculum Design” model. *Adapted from the Arizona Academic Content Standards.
Pacing: 12 days plus 2 days for enrichment and reteaching
Mathematical Practices Mathematical Practices #1 and #3 describe a classroom environment that encourages thinking mathematically and are critical for quality teaching and learning. Practices in bold are to be emphasized in the unit. 1. Make sense of problems and persevere in solving them. 2. Reason abstractly and quantitatively. 3. Construct viable arguments and critique the reasoning of others. 4. Model with mathematics. 5. Use appropriate tools strategically. 6. Attend to precision. 7. Look for and make use of structure. 8. Look for and express regularity in repeated reasoning.
Standards Overview
Interpret functions that arise in applications in terms of the context Analyze functions using different representations Construct and compare linear and solve problems Interpret expressions for functions in terms of the situation they model
Approved 2013 Integrated Math 2
Unit 7: Linear Functions
2
Adapted from The Leadership and Learning Center “Rigorous Curriculum Design” model. *Adapted from the Arizona Academic Content Standards.
Priority and Supporting CCSS Explanations and Examples*
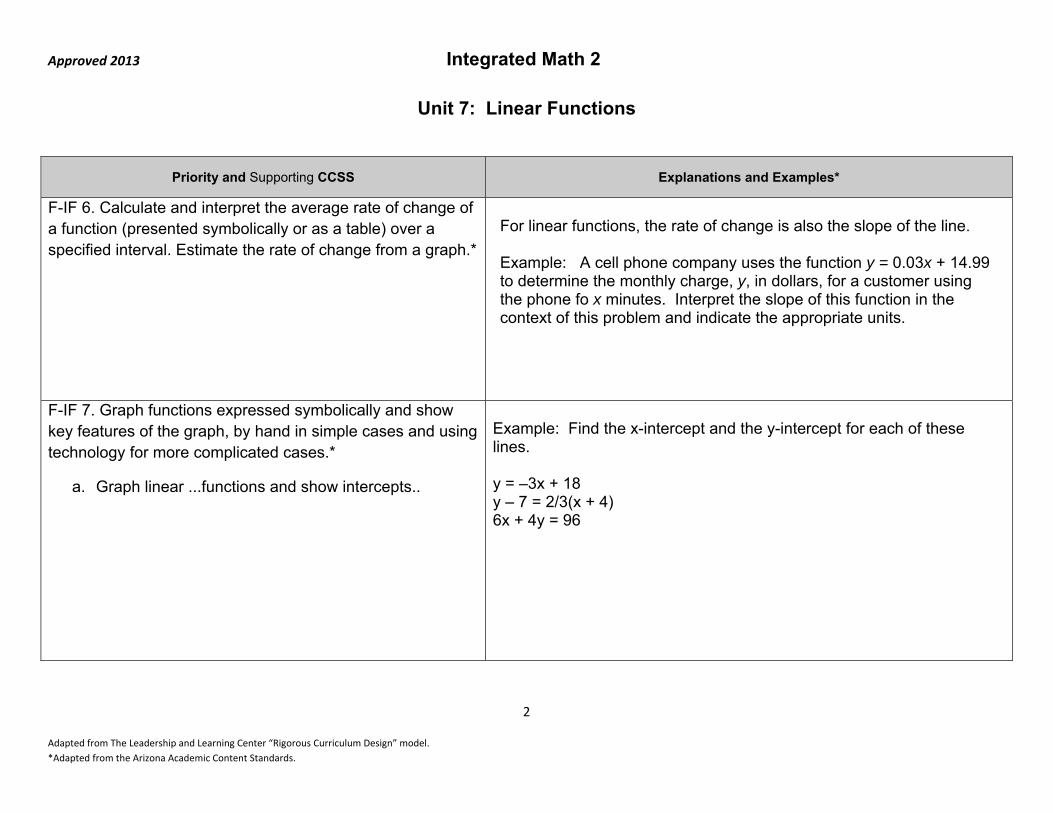
F-IF 6. Calculate and interpret the average rate of change of a function (presented symbolically or as a table) over a specified interval. Estimate the rate of change from a graph.*
For linear functions, the rate of change is also the slope of the line. Example: A cell phone company uses the function y = 0.03x + 14.99 to determine the monthly charge, y, in dollars, for a customer using the phone fo x minutes. Interpret the slope of this function in the context of this problem and indicate the appropriate units.
F-IF 7. Graph functions expressed symbolically and show key features of the graph, by hand in simple cases and using technology for more complicated cases.*
a. Graph linear ...functions and show intercepts..
Example: Find the x-intercept and the y-intercept for each of these lines. y = –3x + 18 y – 7 = 2/3(x + 4) 6x + 4y = 96
Approved 2013 Integrated Math 2
Unit 7: Linear Functions
3
Adapted from The Leadership and Learning Center “Rigorous Curriculum Design” model. *Adapted from the Arizona Academic Content Standards.
Priority and Supporting CCSS Explanations and Examples*
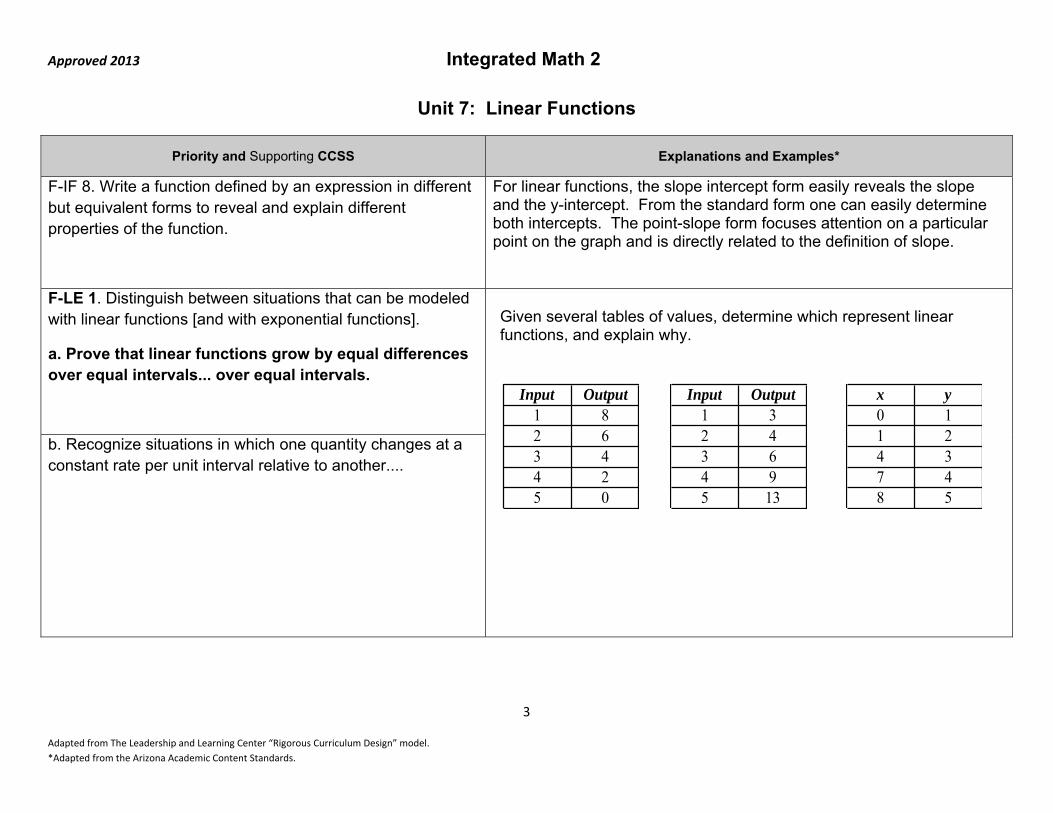
F-IF 8. Write a function defined by an expression in different but equivalent forms to reveal and explain different properties of the function.
For linear functions, the slope intercept form easily reveals the slope and the y-intercept. From the standard form one can easily determine both intercepts. The point-slope form focuses attention on a particular point on the graph and is directly related to the definition of slope.
F-LE 1. Distinguish between situations that can be modeled with linear functions [and with exponential functions].
a. Prove that linear functions grow by equal differences over equal intervals... over equal intervals.
Given several tables of values, determine which represent linear functions, and explain why.
b. Recognize situations in which one quantity changes at a constant rate per unit interval relative to another....
Input Output1 32 43 64 95 13
Input Output1 82 63 44 25 0
x y0 11 24 37 48 5

Approved 2013 Integrated Math 2
Unit 7: Linear Functions
4
Adapted from The Leadership and Learning Center “Rigorous Curriculum Design” model. *Adapted from the Arizona Academic Content Standards.
Priority and Supporting CCSS Explanations and Examples*
F-LE 2. Construct linear ... functions, including arithmetic ... sequences, given a graph, a description of a relationship, or two input-output pairs (include reading these from a table).
Example: Sara’s starting salary is $32,500. Each year she receives a $700 raise. Write a sequence in explicit form to describe the situation. Draw a graph representing this situation. Is this function discrete or continuous?
F-LE 5. Interpret the parameters in a linear ... function in terms of a context.
Use technology to explore the effects of the parameters m and b in the linear functions y = mx + b by holding first one parameter and then the other constant while allowing the other one to vary. Example: A student club is raising funds to fight cancer. They raffle off a gift basket and sell raffle tickets. The function that gives their profit is f(x) = 2x – 80, where x is the number of tickets sold.
a. How much did they spend on the gift basket? b. How much do they charge for each ticket? c. If they raise the price of a ticket, which parameter will change, the
slope or the y-intercept? Explain.

Approved 2013 Integrated Math 2
Unit 7: Linear Functions
5
Adapted from The Leadership and Learning Center “Rigorous Curriculum Design” model. *Adapted from the Arizona Academic Content Standards.
Concepts
What Students Need to Know Skills
What Students Need To Be Able To Do Bloom’s Taxonomy
Levels Rate of change Constant additive change Slope
x-intercept y-intercept slope-intercept form point-slope form standard form Inequalities in two variables
Find (slope given two points, given graph rise/run)
Interpret (slope as rate of change) Determine (whether function is linear) Find (slopes of parallel and perpendicular lines) Interpret (parameters of linear function)
Find (equation of a line) Rearrange (equation of a line into a different form) Model (linear function) Graph (linear function) Create linear (inequalities) Graph linear (inequalities)
1
2 3 3
4
3 3
3 3
3 3

Approved 2013 Integrated Math 2
Unit 7: Linear Functions
6
Adapted from The Leadership and Learning Center “Rigorous Curriculum Design” model. *Adapted from the Arizona Academic Content Standards.
Essential Questions
What is a linear function?
What are the different ways that linear functions may be represented?
What is the significance of a linear function’s slope and y-intercept?
How may linear functions help us analyze real world situations and solve practical problems?
Corresponding Big Ideas
Linear functions are characterized by a constant average rate of change (or constant additive change).
Unit Vocabulary Linear function, independent and dependent variable, discrete, continuous, function notation, exponential and quadratic function, slope, intercepts, arithmetic sequence, average-rate-of-change, velocity, slope-intercept form, point-slope form, standard form

Approved 2013 Integrated Math 2
Unit 7: Linear Functions
7
Adapted from The Leadership and Learning Center “Rigorous Curriculum Design” model. *Adapted from the Arizona Academic Content Standards.
Learning Activities Topic Section in the Text CCSS
Determining the rate-of-change Calculate and interpret the average-rate-
of-change using information provided symbolically or given in a table or graph or provided in a verbal description
Graphing lines
Graph linear functions expressed symbolically or verbally using the slope and X- Y- intercepts
Graph manually and using technology Developing and constructing linear functions
Develop linear functions (equations) using arithmetic sequences, graphs, verbal descriptions or data provided in tables.
Compare, use and understand the benefits of the different forms of a linear function – slope-intercept, point-slope and standard forms
Interpret the parameters in a linear function in terms of their context – slope, intercepts
Understand the unique aspects of horizontal and vertical lines
IM 2 text: section 3.3
Sec 3.3 extension
IM 2 text: section 3.4
IM 2 text: section 12.1, 12.4
Algebra 1 text (standard form and point-slope form)
F-IF 6
F-IF 7
F-IF 8 F-LE 2 F-LE 5
F-LE 1

Approved 2013 Integrated Math 2
Unit 7: Linear Functions
8
Adapted from The Leadership and Learning Center “Rigorous Curriculum Design” model. *Adapted from the Arizona Academic Content Standards.
Linear Inequalities
Graph the solutions to a linear inequality in two variables as a half-plane (excluding the boundary in the case of a strict inequality)
Algebra 1 text:
F-LE 2 F-LE 5
Standardized Assessment Correlations (State, College and Career)
CAPT through 2014, Smarter Balance assessment thereafter.
Unit Assessments The items developed for this section can be used during the course of instruction when deemed appropriate by the teacher. End-of-unit test Performance task CAPT released items – see appendix

Approved 2013 Integrated Math 2
Unit 8: Systems of Linear Equations and Inequalities
Pacing: 6 days plus 2 days for enrichment and reteaching
Mathematical Practices Mathematical Practices #1 and #3 describe a classroom environment that encourages thinking mathematically and are critical for quality teaching and learning. Practices in bold are to be emphasized in the unit. 1. Make sense of problems and persevere in solving them. 2. Reason abstractly and quantitatively. 3. Construct viable arguments and critique the reasoning of others. 4. Model with mathematics. 5. Use appropriate tools strategically. 6. Attend to precision. 7. Look for and make use of structure. 8. Look for and express regularity in repeated reasoning.
Standards Overview
Create equations that describe numbers or relationships Solve systems of equations Represent and solve equations and inequalities graphically

Approved 2013 Integrated Math 2
Unit 8: Systems of Linear Equations and Inequalities
Priority and Supporting CCSS Explanations and Examples*
A-CED 3. Represent constraints by equations or inequalities, and by systems of equations and/or inequalities, and interpret solutions as viable or nonviable options in a modeling context...
Example: Given two sets of data that can be modeled with linear functions, find the intersection of the two trend lines, if it exists, and interpret the solution. For instance, if these trends continue, when will the women catch the men and what percentage of women will be earning $50,000 - $74,999?
Number of
years since 2000
% of men
earning
$50,000 - $74,999
% of women
earning
$50,000 - $74,999
3 20.2 13.3
4 20.5 14.2
5 20.7 15.1
A-REI 5. Prove that, given a system of two equations in two variables, replacing one equation by the sum of that equation and a multiple of the other produces a system with the same solutions.
Example: Given that the sum of two numbers is 10 and their difference is 4, what are the numbers? Explain how your answer can be deduced from the fact that they two numbers, x and y, satisfy the equations x + y = 10 and x – y = 4.

Approved 2013 Integrated Math 2
Unit 8: Systems of Linear Equations and Inequalities
Priority and Supporting CCSS Explanations and Examples*
A-REI 6. Solve systems of linear equations exactly and approximately (e.g., with graphs), focusing on pairs of linear equations in two variables.
.The system solution methods can include but are not limited to graphical, elimination/linear combination, substitution, and modeling. Systems can be written algebraically or can be represented in context. Students may use graphing calculators, programs, or applets to model and find approximate solutions for systems of equations. Examples: Solve the system of equations: x+ y = 11 and 3x – y = 5. Use a second method to check your answer. Your class is planning to raise money for a class trip to Washington, DC, by selling your own version of Connecticut Trail Mix. You find you can purchase a mixture of dried fruit for $3.25 per pound and a nut mixture for $5.50 per pound. The class plans to combine the dried fruit and nuts to make a mixture that costs $4.00 per pound, which will be sold at a higher price to make a profit. You anticipate you will need 180 pounds of trail mix. How many pounds of dried fruit and how many pounds of mixed nuts do you need?
A-REI 11. Explain why the x-coordinates of the points where the graphs of the equations y = f(x) and y = g(x) intersect are the solutions of the equation f(x) = g(x); find the solutions approximately, e.g., using technology to graph the functions, make tables of values, or find successive approximations. Include cases where f(x) and/or g(x) are linear ...functions.*
Students need to understand that numerical solution methods (data in a table used to approximate an algebraic function) and graphical solution methods may produce approximate solutions, and algebraic solution methods produce precise solutions that can be represented graphically or numerically. Students may use graphing calculators or programs to generate tables of values, graph, or solve a variety of functions.

Approved 2013 Integrated Math 2
Unit 8: Systems of Linear Equations and Inequalities
Concepts
What Students Need to Know Skills
What Students Need To Be Able To Do Bloom’s Taxonomy
Levels Systems of linear equations Solution to a system of linear equations Graphing method Substitution method Elimination method Systems of linear inequalities graphing method
Solve (systems using graphs) Solve (systems using algebraic methods) Model (with systems of linear equations) Interpret (solution of systems of linear equations)
3 3
3
2
Essential Questions
What does the number of solutions (none, one or infinite) of a system of linear equations represent?
What are the advantages and disadvantages of solving a system of linear equations graphically versus algebraically? What does the solution set of a system of linear inequalities represent?
Corresponding Big Ideas A system of linear equations is an algebraic way to compare two equations that model a situation and find the breakeven point or choose the most efficient or economical plan. A system of linear equalities is a graphic way to compare two inequalities that model a situation and find the feasibility region.

Approved 2013 Integrated Math 2
Unit 8: Systems of Linear Equations and Inequalities
Standardized Assessment Correlations
(State, College and Career) CAPT through 2014, Smarter Balance assessment thereafter.
Vocabulary
System of linear equations, system of linear inequalities, no solution, infinitely many solutions, substitution method, elimination method, constraints, scale, coordinate axes, labels, solutions, half-plane, boundary, intersection
Learning Activities
Topic Section in Text CCSS Systems of Linear Equations
Find approximate solution using graphing Find exact solution by substitution method Find exact solution by elimination method Explain why the x coordinate of the point of intersection is the
solution to the equation f(x)=g(x) Interpret solutions of systems (one solution, no solutions,
infinitely many solutions) Applications of Linear Systems
IM2 text: 3.7
Alg 1 text: 7.1 7-2 7-3
7-4
CC.9-12.A.CED.3
CC.9-12.A.REI.6
CC.9-12.A.REI.5
CC9.12.A.REI.11
Systems of Linear Inequalities
Find approximate solution using graphing Interpret solution of systems Applications of Linear Inequality Systems
Alg 1text: 7.6
CC.9-12.A.CED.3
CC9-12.A.REI.11
CC9-12.A.REI.12

Approved 2013 Integrated Math 2
Unit 8: Systems of Linear Equations and Inequalities
Unit Assessments The items developed for this section can be used during the course of instruction when deemed appropriate by the teacher. Performance Task End-of-Unit Test