Math Review Data Analysis and Probability. Possible Outcomes... Tossing a coin.
71
Math Review Data Data Analysis Analysis and and Probabilit Probabilit
-
Upload
lesley-cannon -
Category
Documents
-
view
219 -
download
0
Transcript of Math Review Data Analysis and Probability. Possible Outcomes... Tossing a coin.

Math Review
Data Analysis Data Analysis and and
ProbabilityProbability

Possible Outcomes...
Tossing a coin

Possible Outcomes...
Tossing a coin
Heads, TailsHeads, Tails

Possible Outcomes...
Rolling one of the six-sided dice

Possible Outcomes...
Rolling one of the six-sided dice
Rolling 1, 2, 3, 4, Rolling 1, 2, 3, 4, 5, or 65, or 6

Certain, Likely, Unlikely or Impossible?
They will be serving some kind of vegetable
in the cafeteria at lunchtime.

Certain, Likely, Unlikely or Impossible?
They will be serving some kind of vegetable in the cafeteria at
lunchtime.
LikelyLikely

Certain, Likely, Unlikely or Impossible?
This month is May, so next month will be June.

Certain, Likely, Unlikely or Impossible?
This month is May, so next month will be June.
CertainCertain

Certain, Likely, Unlikely or Impossible?
Lucas rolls one of his dice. What is the probability he will
roll a number less than 2?

Certain, Likely, Unlikely or Impossible?
Lucas rolls one of his dice. What is the probability he will
roll a number less than 2?
UnlikelyUnlikely

Certain, Likely, Unlikely or Impossible?
Situation: Kirena puts 6 yellow tiles, 2 red tiles, 6 blue tiles, and 21 green tiles in a bag.
What is the probability that Kirena will reach in and pull
out a red tile?

Certain, Likely, Unlikely or Impossible?
Situation: Kirena puts 6 yellow tiles, 2 red tiles, 6 blue tiles, and 21 green tiles in a bag.
What is the probability that Kirena will reach in and pull
out a red tile?
UnlikelyUnlikely

Certain, Likely, Unlikely or Impossible?
Situation: Kirena puts 6 yellow tiles, 2 red tiles, 6 blue tiles, and 21 green tiles in a bag.
What is the probability that Kirena will reach in and pull
out a green tile?

Certain, Likely, Unlikely or Impossible?
Situation: Kirena puts 6 yellow tiles, 2 red tiles, 6 blue tiles, and 21 green tiles in a bag.
What is the probability that Kirena will reach in and pull
out a green tile?
LikelyLikely

Certain, Likely, Unlikely or Impossible?
Situation: Kirena puts 6 yellow tiles, 2 red tiles, 6 blue tiles, and 21 green tiles in a bag.
Which two color tiles is Kirena equally likely to pull
out?

Certain, Likely, Unlikely or Impossible?
Situation: Kirena puts 6 yellow tiles, 2 red tiles, 6 blue tiles, and 21 green tiles in a bag.
Which two color tiles is Kirena equally likely to pull
out?
Yellow and BlueYellow and Blue

Certain, Likely, Unlikely or Impossible?
Situation: Kirena puts 6 yellow tiles, 2 red tiles, 6 blue tiles, and 21 green tiles in a bag.
How many tiles did Kirena put into the bag?

Certain, Likely, Unlikely or Impossible?
Situation: Kirena puts 6 yellow tiles, 2 red tiles, 6 blue tiles, and 21 green tiles in a bag.
How many tiles did Kirena put into the bag?
35 tiles35 tiles

What’s the mode?
0, 0, 1, 3, 4, 4, 4, 7, 8, 8

What’s the mode?
4

What’s the mode?
12, 15, 17, 19, 20, 20, 21, 23, 26, 26, 26

What’s the mode?
26

What’s the mode?
65, 70, 70, 75, 80, 80, 85, 85, 90, 90, 90
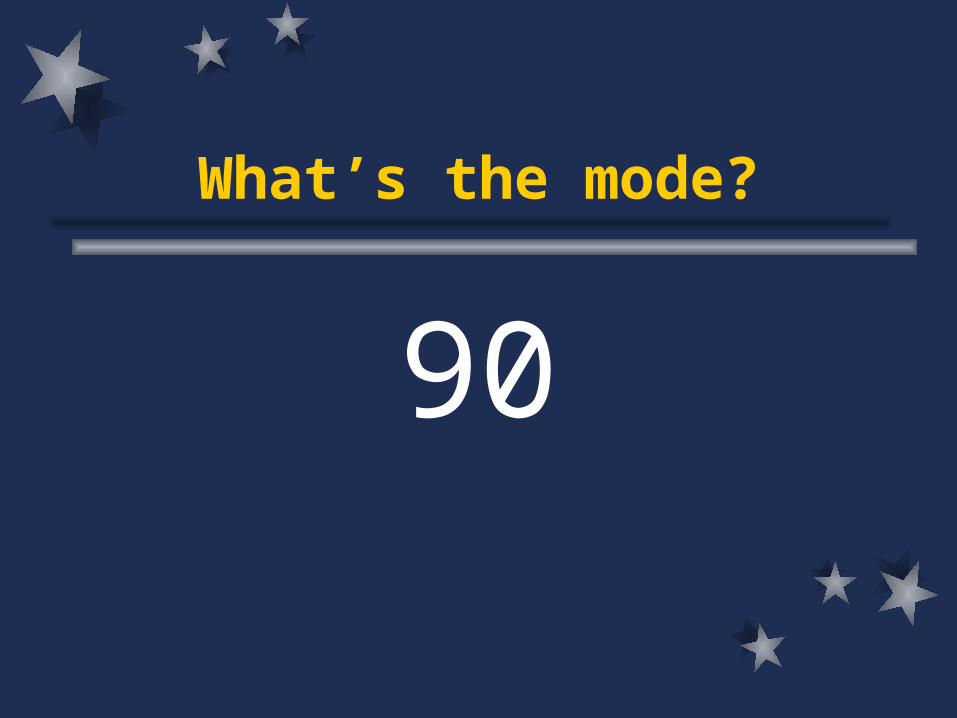
What’s the mode?
90

What’s the mode?
4, 7, 1, 8, 3, 9, 5, 1

What’s the mode?
1

What’s the mode?
34, 67, 43, 22, 34, 12, 12, 0, 34, 55,

What’s the mode?
34

What’s the median?
10, 14, 16, 20, 25

What’s the median?
10, 14, 16, 20, 25

What’s the median?
35, 45, 55, 70, 85

What’s the median?
35, 45, 55, 70, 85

What’s the median?
10, 0, 50, 25, 85, 100, 5

What’s the median?
0, 5, 10, 25, 50, 85, 100

What’s the median?
4, 8, 4, 6, 12, 10, 6, 5, 3

What’s the median?
3, 4, 4, 5, 6, 6, 8, 10, 12

Categorical or Numerical?
Students’ weekly spelling grades

Numerical
Students’ weekly spelling grades

Categorical or Numerical?
Favorite car

Categorical
Favorite car

Categorical or Numerical?
Number of homeruns in each
baseball game

Numerical
Number of homeruns in each
baseball game

Categorical or Numerical?
Number of pets

Numerical
Number of pets

Categorical or Numerical?
Type of pets

Categorical
Type of pets

Categorical or Numerical?
Hair color

Categorical
Hair color

Categorical or Numerical?
Money earned at lemonade stand

Numerical
Money earned at lemonade stand

Categorical or Numerical?
Kinds of drinks sold

Categorical
Kinds of drinks sold
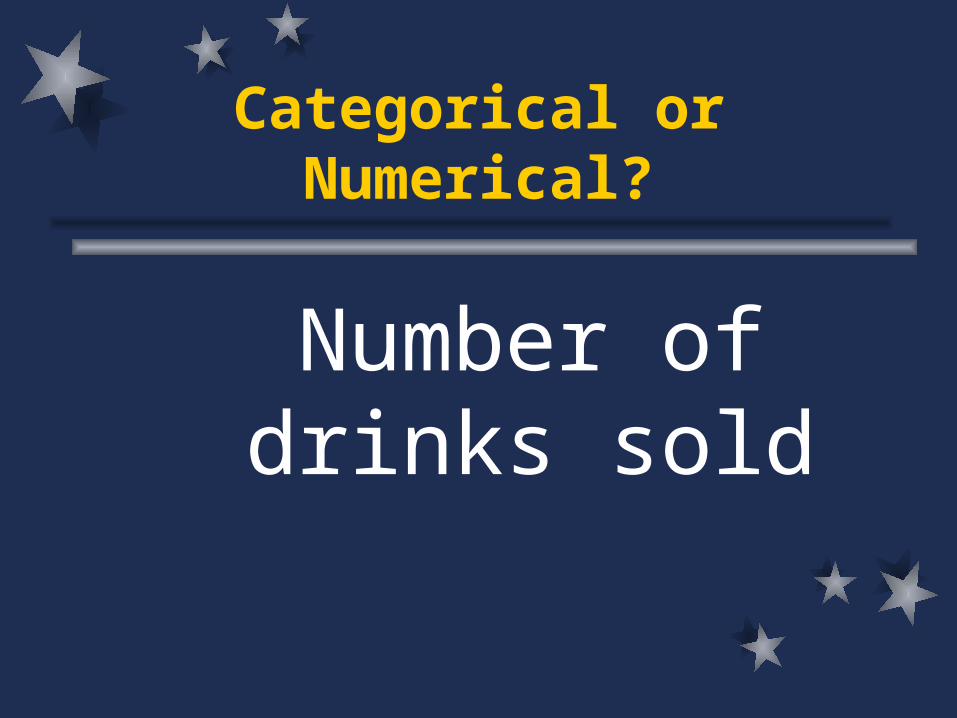
Categorical or Numerical?
Number of drinks sold

Numerical
Number of drinks sold

Bar Graphs
How many glasses of lemonade did Susie sell
during Week 3?
0
5
10
15
20
25
30
35
Week1
Week2
Week3
Week4
Gla
sses
of
Lem
onad
e S
old
Susie’s Lemonade Stand

Bar Graphs
How many glasses of lemonade did Susie sell
during Week 3?
10 glasses10 glasses0
5
10
15
20
25
30
35
Week1
Week2
Week3
Week4
Gla
sses
of
Lem
onad
e S
old
Susie’s Lemonade Stand

Bar Graphs
In which week did Susie sell the least
glasses of lemonade?
0
5
10
15
20
25
30
35
Week1
Week2
Week3
Week4
Gla
sses
of
Lem
onad
e S
old
Susie’s Lemonade Stand

Bar Graphs
In which week did Susie sell the least
glasses of lemonade?
Week 3Week 30
5
10
15
20
25
30
35
Week1
Week2
Week3
Week4
Gla
sses
of
Lem
onad
e S
old
Susie’s Lemonade Stand

Bar Graphs
What is the scale of this bar graph?
0
5
10
15
20
25
30
35
Week1
Week2
Week3
Week4
Gla
sses
of
Lem
onad
e S
old
Susie’s Lemonade Stand

Bar Graphs
What is the scale of this bar graph?
Scale of 5Scale of 5
0
5
10
15
20
25
30
35
Week1
Week2
Week3
Week4
Gla
sses
of
Lem
onad
e S
old
Susie’s Lemonade Stand

Bar Graphs
How many more glasses of lemonade did
Susie sell in Week 4 than Week 1?
0
5
10
15
20
25
30
35
Week1
Week2
Week3
Week4
Gla
sses
of
Lem
onad
e S
old
Susie’s Lemonade Stand

Bar Graphs
How many more glasses of lemonade did
Susie sell in Week 4 than Week 1?
35-15= 20 35-15= 20 glasses moreglasses more
0
5
10
15
20
25
30
35
Week1
Week2
Week3
Week4
Gla
sses
of
Lem
onad
e S
old
Susie’s Lemonade Stand

Graphing
What kind of graph is this?
Jean’s spelling test for the 2nd nine weeksXXXX X
X X XX X X X X X
75 80 85 90 95 100

Line Plots
What kind of graph is this?
Line plotLine plot
Jean’s spelling test for the 2nd nine weeksXXXX X
X X XX X X X X X
75 80 85 90 95 100

Line Plots
What is the mode of this data?
Jean’s spelling test for the 2nd nine weeksXXXX X
X X XX X X X X X
75 80 85 90 95 100

Line Plots
What is the mode of this data?
9090
Jean’s spelling test for the 2nd nine weeksXXXX X
X X XX X X X X X
75 80 85 90 95 100

Line Plots
How many times did Jean make 100 on her spelling test during the
2nd nine weeks?
Jean’s spelling test for the 2nd nine weeksXXXX X
X X XX X X X X X
75 80 85 90 95 100

Line Plots
How many times did Jean make 100 on her spelling test during the
2nd nine weeks?
onceonce
Jean’s spelling test for the 2nd nine weeksXXXX X
X X XX X X X X X
75 80 85 90 95 100
Line Plots
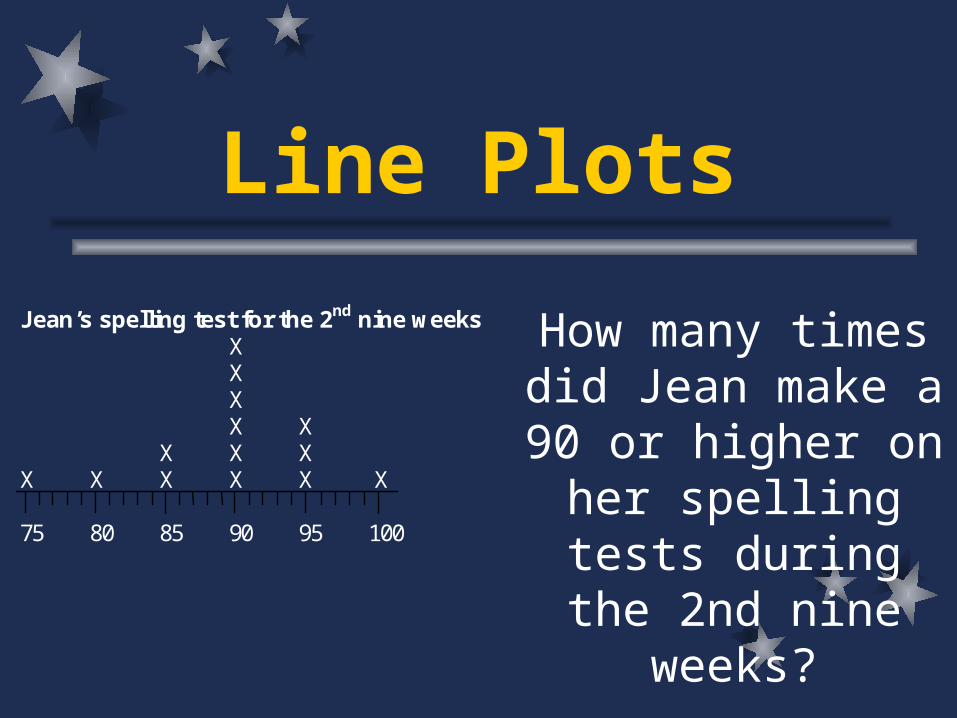
How many times did Jean make a 90 or
higher on her spelling tests during the 2nd
nine weeks?
Jean’s spelling test for the 2nd nine weeksXXXX X
X X XX X X X X X
75 80 85 90 95 100

Line Plots
How many times did Jean make a 90 or
higher on her spelling tests during the 2nd
nine weeks?
10 times10 times
Jean’s spelling test for the 2nd nine weeksXXXX X
X X XX X X X X X
75 80 85 90 95 100