Math Review #2 “I just got lost in thought. It was unfamiliar territory” “What happens if you...
32
Math Review Math Review #2 #2 “ “ I just got lost in I just got lost in thought. It was unfamiliar thought. It was unfamiliar territory” territory” “ “ What happens if What happens if you get scared you get scared half to death half to death twice?” twice?”
-
Upload
shanon-johns -
Category
Documents
-
view
215 -
download
0
Transcript of Math Review #2 “I just got lost in thought. It was unfamiliar territory” “What happens if you...

Math Review #2Math Review #2
““I just got lost in thought. It was I just got lost in thought. It was unfamiliar territory”unfamiliar territory”
““What happens if you What happens if you get scared half to get scared half to death twice?”death twice?”
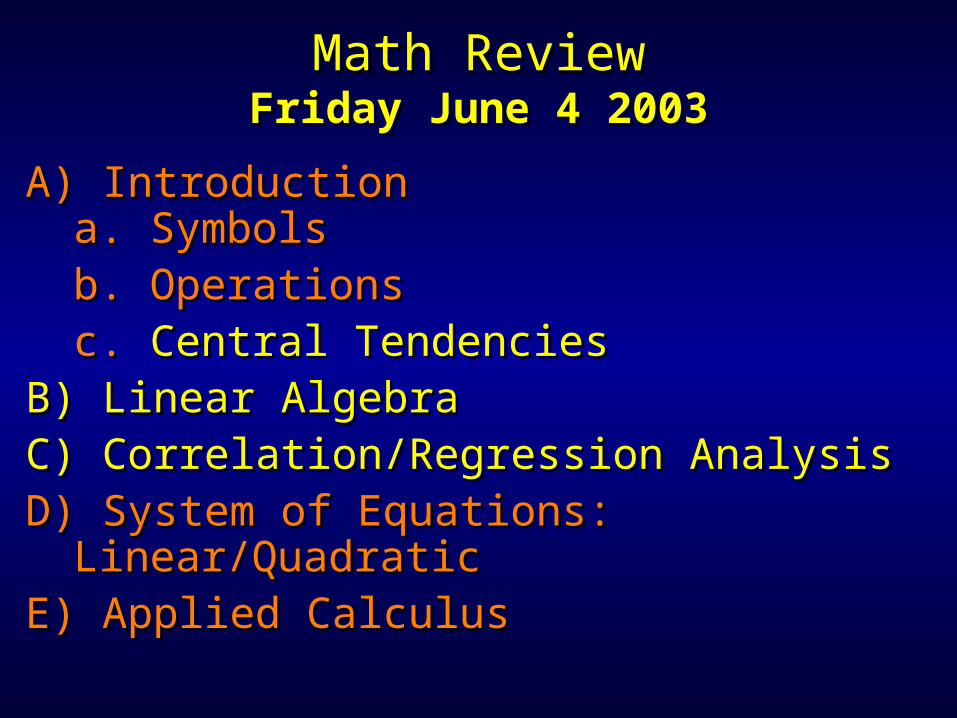
A)A) IntroductionIntroductiona.a. SymbolsSymbolsb.b. OperationsOperationsc.c. Central TendenciesCentral Tendencies
B)B) Linear AlgebraLinear AlgebraC)C) Correlation/Regression AnalysisCorrelation/Regression AnalysisD)D) System of Equations: Linear/QuadraticSystem of Equations: Linear/QuadraticE)E) Applied CalculusApplied Calculus
Math ReviewMath ReviewFriday June 4 2003Friday June 4 2003

b. OperationsBasic Math ReviewBasic Math Review
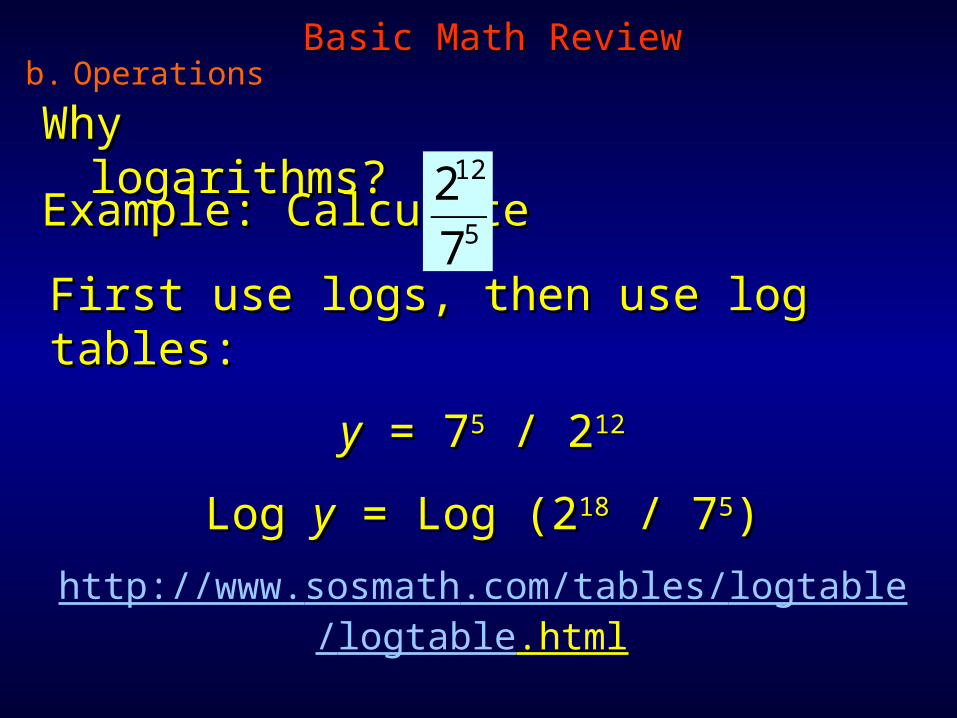
Why logarithms?Why logarithms?
Power and product rules:Power and product rules:loglogbb((xyxy) = log) = logbb((xx) + log) + logbb((yy))
loglogbb((xxnn) = nlog) = nlogbb((xx))
These rules motivated the introduction of These rules motivated the introduction of logarithms (by Napier, in early 17logarithms (by Napier, in early 17 thth Century) Century) and motivated their use in scientific and motivated their use in scientific computation until… computers!computation until… computers!
b. OperationsBasic Math ReviewBasic Math Review
Why logarithms?Why logarithms?
Example: CalculateExample: Calculate
First use logs, then use log tables:First use logs, then use log tables:
yy = 7 = 755 / 2 / 21212
Log Log yy = Log (2 = Log (21818 / 7 / 755))
http://www.sosmath.com/tables/logtable/logtable.html
€
212
75
b. OperationsBasic Math ReviewBasic Math Review
a)a) Solve for Solve for xx: ln(: ln(eeaa) = b) = bxx
b)b) Solve for Solve for yy using common using common logarithms (base 10): logarithms (base 10): y = 175
c)c) Find the exponent of 10 that solves Find the exponent of 10 that solves for for xx: : x2 = 5.5.10-12

c. Central TendenciesBasic Math ReviewBasic Math Review
€
x =x i∑
n=
1
nx i∑
The most commonly used descriptive The most commonly used descriptive statistics are measures of central tendencystatistics are measures of central tendencyThe The sample meansample mean (: pronounced “ (: pronounced “xx bar”) bar”) is:is:
Where Where xxii represents the sum of all values in represents the sum of all values in the sample and the sample and n n represents the sample sizerepresents the sample size

Mean: arithmetic averageMean: arithmetic average Median: middle value of a set of valuesMedian: middle value of a set of values Mode: the data value that occurs most Mode: the data value that occurs most
oftenoften
c. Central TendenciesBasic Math ReviewBasic Math Review
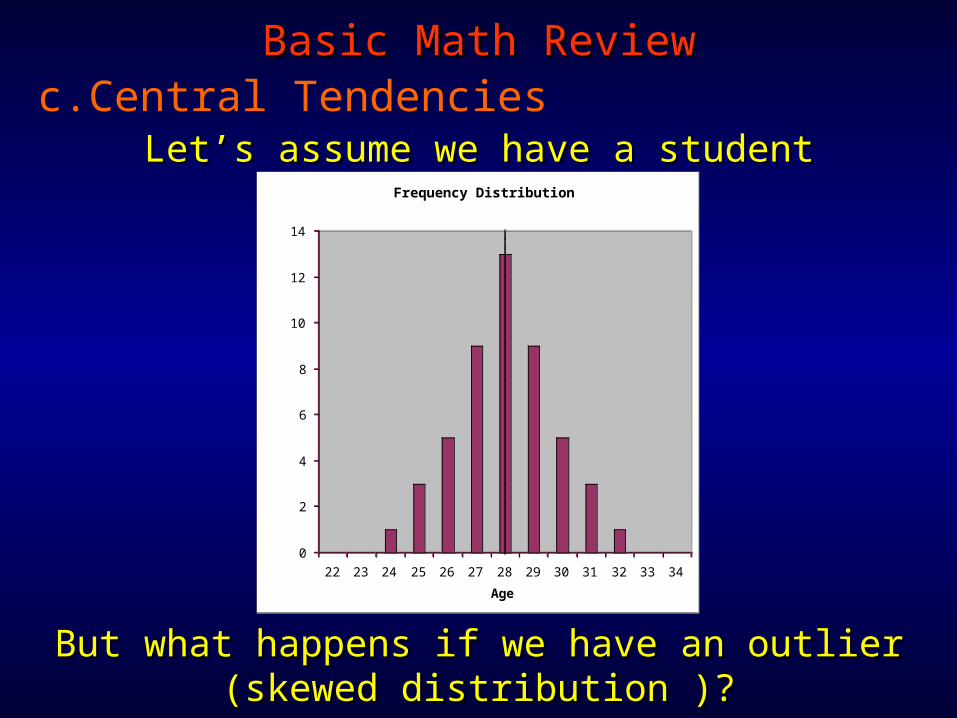
Let’s assume we have a student population (Let’s assume we have a student population (nn = 47)= 47)
But what happens if we have an outlierBut what happens if we have an outlier(skewed distribution )?(skewed distribution )?
Frequency Distribution
0
2
4
6
8
10
12
14
22 23 24 25 26 27 28 29 30 31 32 33 34
Age
Frequency
c. Central TendenciesBasic Math ReviewBasic Math Review
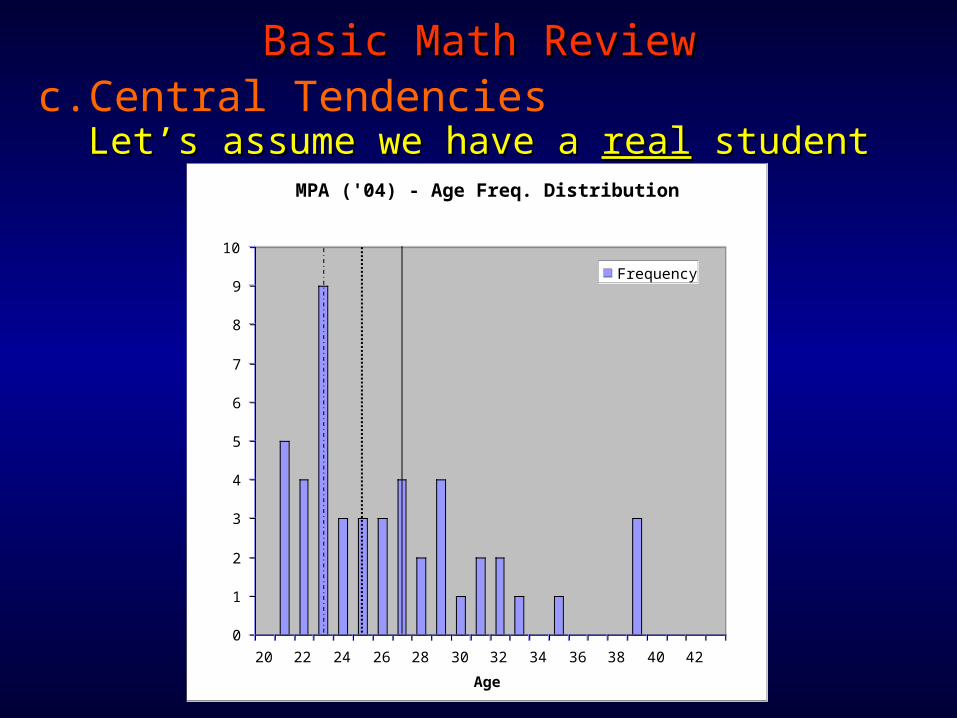
Let’s assume we have a Let’s assume we have a realreal student student populationpopulation
c. Central TendenciesBasic Math ReviewBasic Math Review
MPA ('04) - Age Freq. Distribution
0
1
2
3
4
5
6
7
8
9
10
20 22 24 26 28 30 32 34 36 38 40 42
Age
Frequency
Frequency
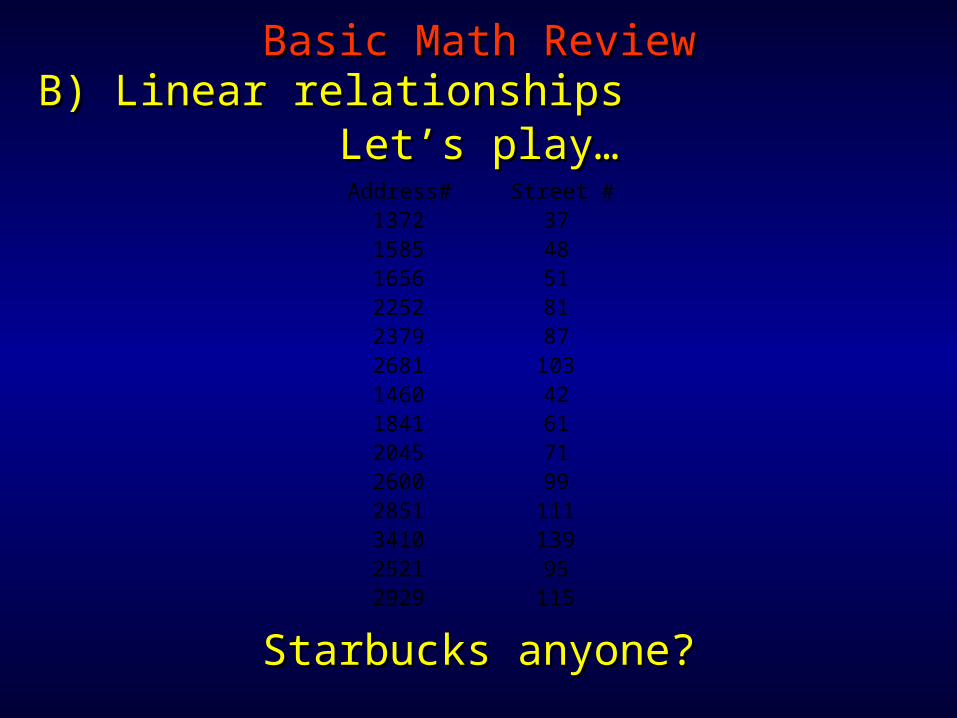
Let’s play…Let’s play…B)B) Linear relationshipsLinear relationships
Basic Math ReviewBasic Math Review
Starbucks anyone?Starbucks anyone?
Address# Street #1372 371585 481656 512252 812379 872681 1031460 421841 612045 712600 992851 1113410 1392521 952929 115
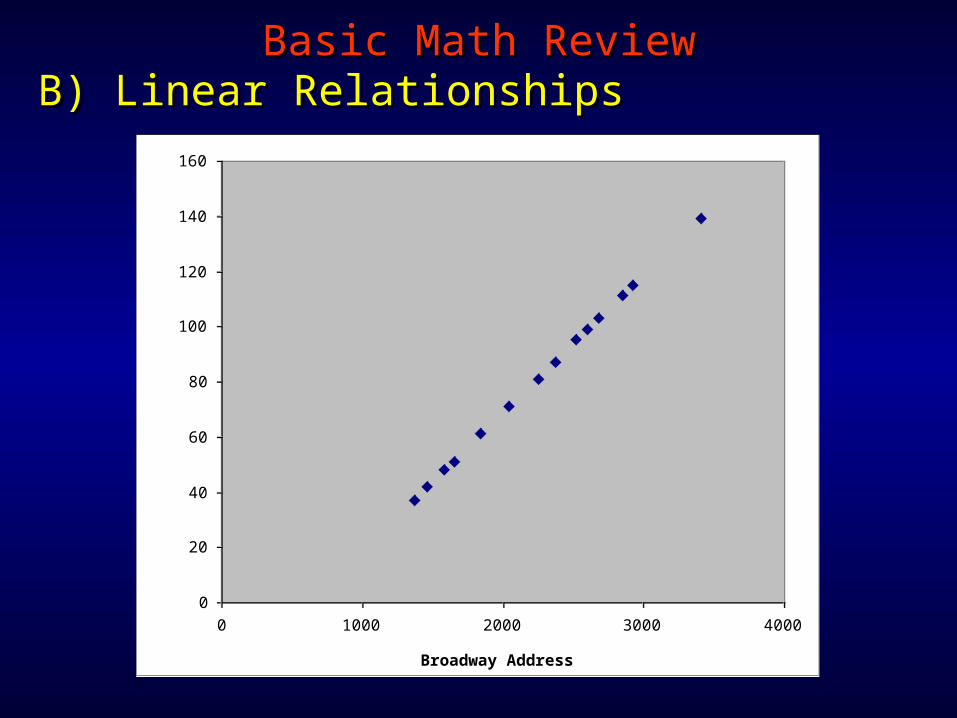
B)B) Linear RelationshipsLinear RelationshipsBasic Math ReviewBasic Math Review
0
20
40
60
80
100
120
140
160
0 1000 2000 3000 4000
Broadway Address
Street Number

The “slope” (m) of a line is its The “slope” (m) of a line is its rate of change:rate of change:B)B) Linear AlgebraLinear Algebra
Basic Math ReviewBasic Math Review
0
20
40
60
80
100
120
140
160
0 1000 2000 3000 4000
Broadway Address
Street Number
Slope:Slope:
y/y/xx
oror
(y(y22-y-y11)/(x)/(x22-x-x11))
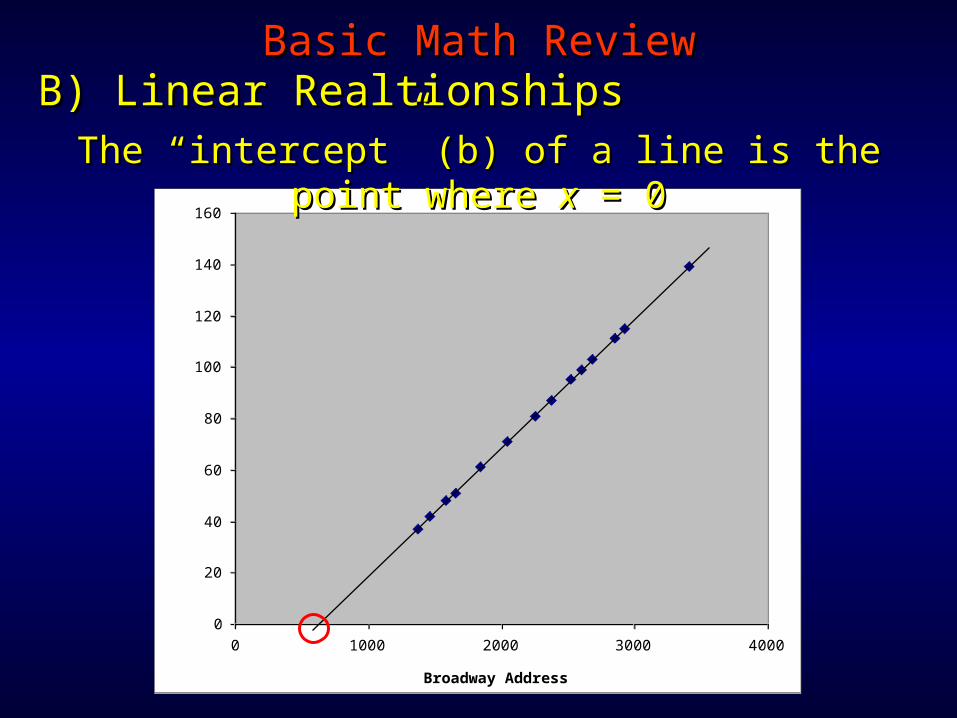
B)B) Linear RealtionshipsLinear RealtionshipsBasic Math ReviewBasic Math Review
0
20
40
60
80
100
120
140
160
0 1000 2000 3000 4000
Broadway Address
Street Number
The “intercept” (b) of a line is the point where The “intercept” (b) of a line is the point where xx = 0= 0

B)B) Linear RelationshipsLinear RelationshipsBasic Math ReviewBasic Math Review
y = 0.05x - 31.317
R2 = 0.9999
0
20
40
60
80
100
120
140
160
0 1000 2000 3000 4000
Broadway Address
Street Number
The function The function ff((xx) = ) = yy = m = mxx + + bbYou can use it to make predictionsYou can use it to make predictions

Let’s assume we have a Let’s assume we have a realreal fish population fish populationB)B) Graphing Linear RelationshipsGraphing Linear Relationships
Basic Math ReviewBasic Math Review
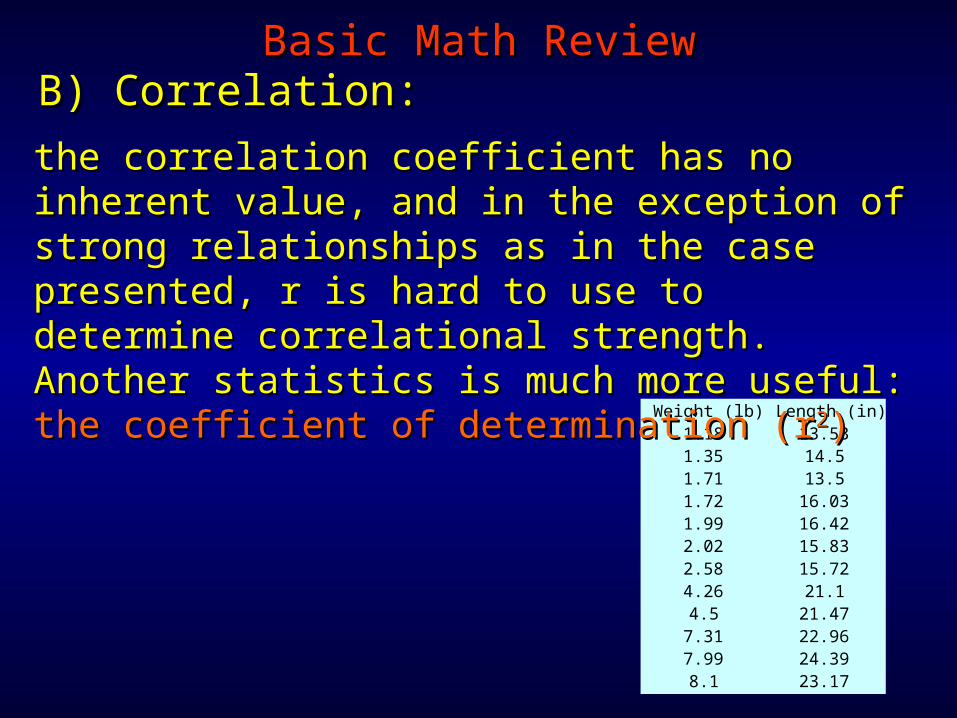
Weight (lb) Length (in)1.18 13.531.35 14.51.71 13.51.72 16.031.99 16.422.02 15.832.58 15.724.26 21.14.5 21.47
7.31 22.967.99 24.398.1 23.17
Any question regarding this data set?Any question regarding this data set?
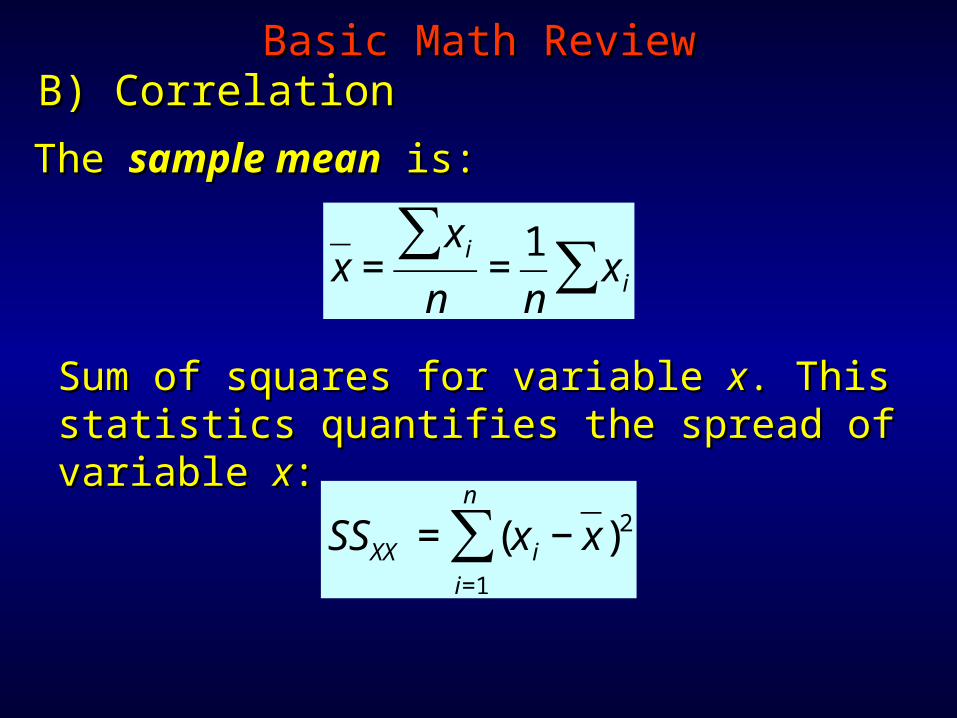
B)B) CorrelationCorrelationBasic Math ReviewBasic Math Review
The The sample meansample mean is: is:
€
x =x i∑
n=
1
nx i∑
Sum of squares for variable Sum of squares for variable xx. This . This statistics quantifies the spread of variable statistics quantifies the spread of variable xx::
€
SSXX = (x i − x)2
i=1
n
∑

B)B) CorrelationCorrelationBasic Math ReviewBasic Math Review
Sum of squares for variable Sum of squares for variable yy. This . This statistics quantifies the spread of variable statistics quantifies the spread of variable yy::
€
SSYY = (y i − y)2
i=1
n
∑

B)B) CorrelationCorrelationBasic Math ReviewBasic Math Review
Sum of the cross-products. This statistics is Sum of the cross-products. This statistics is analogous to the other sums of squares analogous to the other sums of squares except that it quantifies the extent to except that it quantifies the extent to which the two variables go together or which the two variables go together or apart:apart:
€
SSXY = (x i − x)(x i − x)i=1
n
∑

B)B) CorrelationCorrelationBasic Math ReviewBasic Math Review
Fish Data:Fish Data:Weight (lb) Length (in)
1.18 13.531.35 14.51.71 13.51.72 16.031.99 16.422.02 15.832.58 15.724.26 21.14.5 21.47
7.31 22.967.99 24.398.1 23.17
SSxx: 78.5SSxx: 78.5SSyy: 182.0SSyy: 182.0SSxy: 113.8SSxy: 113.8
))(( YYXX
XY
SSSS
SSr =
The correlation coefficient The correlation coefficient is:is:
Here r = 0.95Here r = 0.95

B)B) Correlation: Correlation: Fish DataFish DataBasic Math ReviewBasic Math Review
Weight (lb) Length (in)1.18 13.531.35 14.51.71 13.51.72 16.031.99 16.422.02 15.832.58 15.724.26 21.14.5 21.47
7.31 22.967.99 24.398.1 23.17
The correlation coefficient is positiveThe correlation coefficient is positive
0
5
10
15
20
25
0 2 4 6 8 10
Weight (lb)
Length (in)
B)B) Correlation:Correlation:Basic Math ReviewBasic Math Review
Weight (lb) Length (in)1.18 13.531.35 14.51.71 13.51.72 16.031.99 16.422.02 15.832.58 15.724.26 21.14.5 21.47
7.31 22.967.99 24.398.1 23.17
the correlation coefficient has no inherent the correlation coefficient has no inherent value, and in the exception of strong value, and in the exception of strong relationships as in the case presented, r is relationships as in the case presented, r is hard to use to determine correlational hard to use to determine correlational strength. Another statistics is much more strength. Another statistics is much more useful: useful: the coefficient of determination (rthe coefficient of determination (r22))
B)B) Correlation:Correlation:Basic Math ReviewBasic Math Review
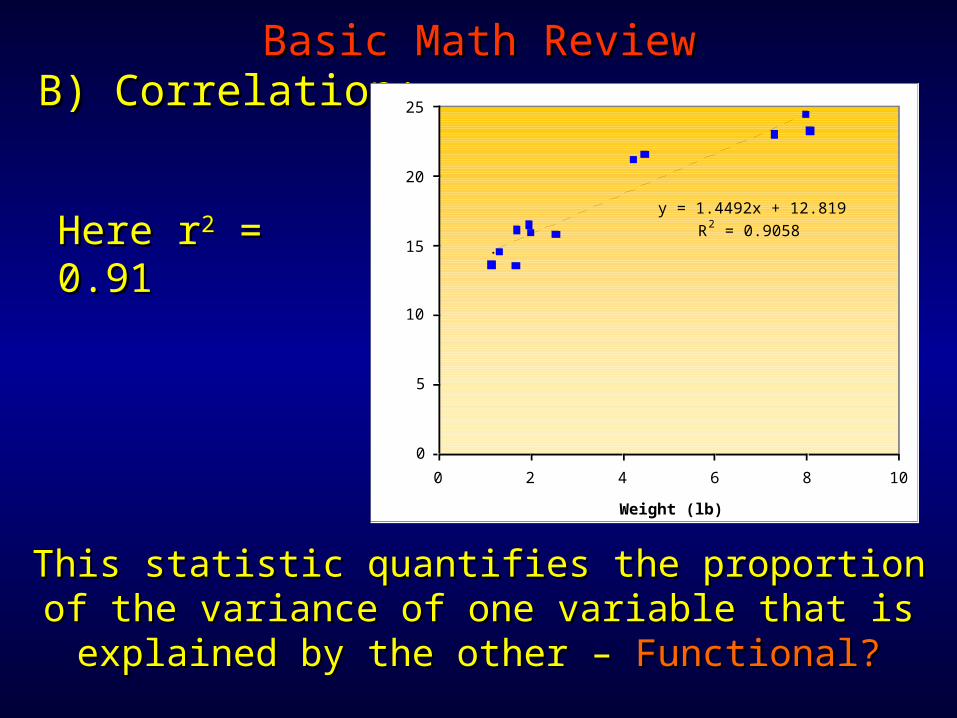
Here rHere r22 = = 0.910.91
y = 1.4492x + 12.819R2 = 0.9058
0
5
10
15
20
25
0 2 4 6 8 10
Weight (lb)
Length (in)
This statistic quantifies the proportion of the This statistic quantifies the proportion of the variance of one variable that is explained by the variance of one variable that is explained by the
other – other – Functional?Functional?

Forgot a section of the fish data setForgot a section of the fish data setB)B) Linear AlgebraLinear Algebra
Basic Math ReviewBasic Math Review
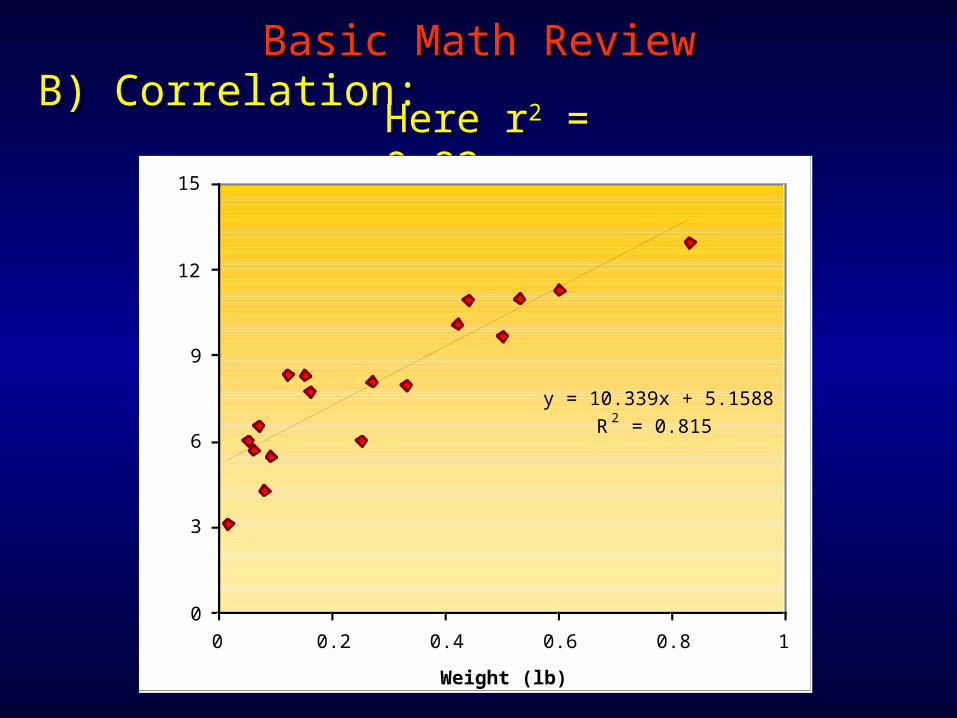
Weight (lb) Length (in)0.015 3.160.05 6.070.06 5.720.07 6.570.08 4.320.09 5.520.12 8.390.15 8.320.16 7.790.25 6.050.27 8.110.33 80.42 10.130.44 10.970.5 9.720.53 11.020.6 11.330.83 13
B)B) Correlation:Correlation:Basic Math ReviewBasic Math Review
Here rHere r22 = = 0.820.82
y = 10.339x + 5.1588R2 = 0.815
0
3
6
9
12
15
0 0.2 0.4 0.6 0.8 1
Weight (lb)
Length (in)
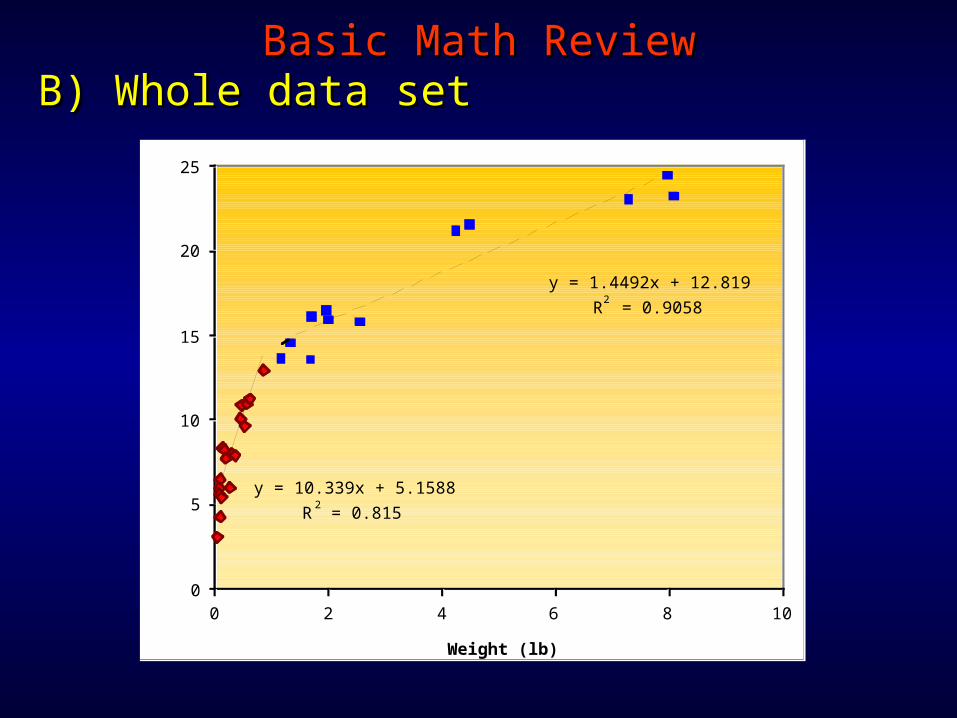
B)B) Whole data setWhole data setBasic Math ReviewBasic Math Review
y = 10.339x + 5.1588
R2 = 0.815
y = 1.4492x + 12.819
R2 = 0.9058
0
5
10
15
20
25
0 2 4 6 8 10
Weight (lb)
Length (in)
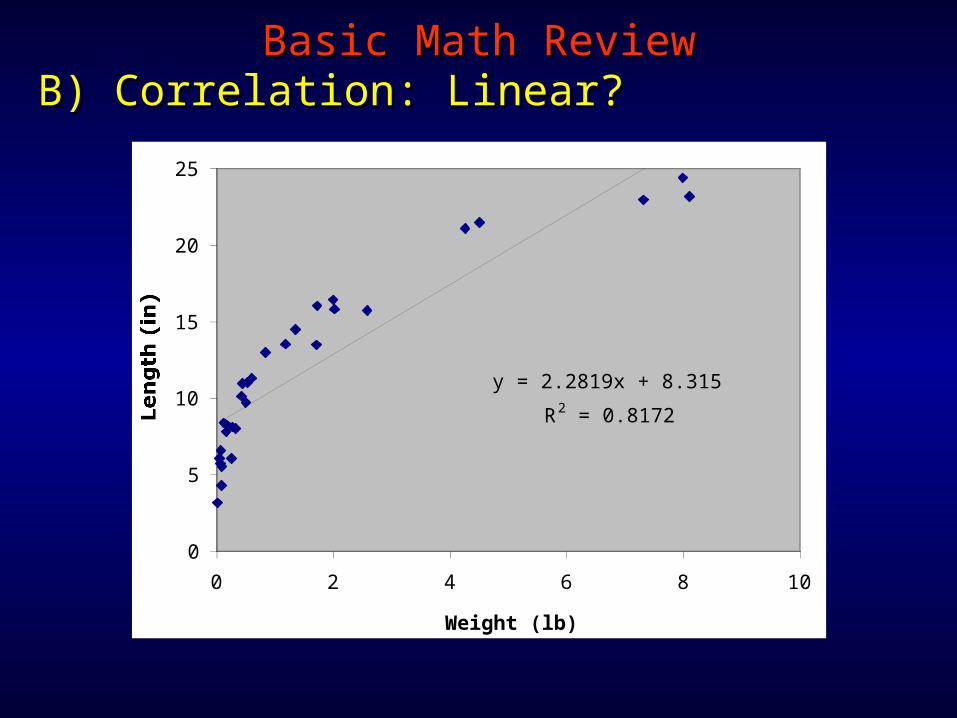
B)B) Correlation: Linear?Correlation: Linear?Basic Math ReviewBasic Math Review
y = 2.2819x + 8.3152
R2 = 0.8172
0
5
10
15
20
25
0 2 4 6 8 10
Weight (lb)
Length (in)
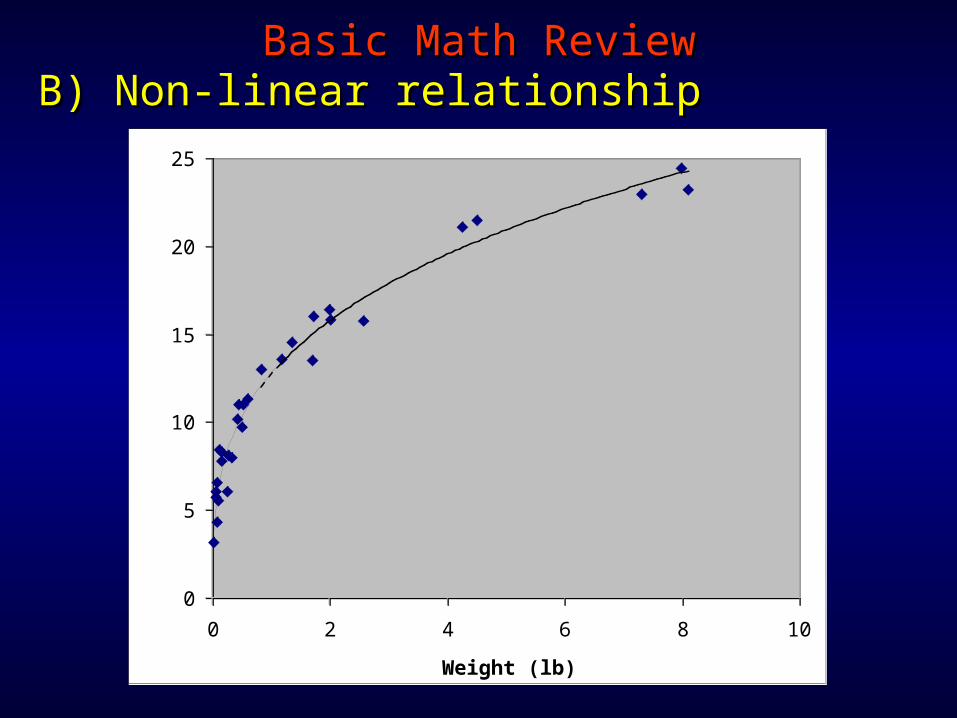
B)B) Non-linear relationshipNon-linear relationshipBasic Math ReviewBasic Math Review
0
5
10
15
20
25
0 2 4 6 8 10
Weight (lb)
Length (in)
B)B) Non-linear relationshipNon-linear relationshipBasic Math ReviewBasic Math Review
0
5
10
15
20
25
0 2 4 6 8 10
Weight (lb)
Length (in)
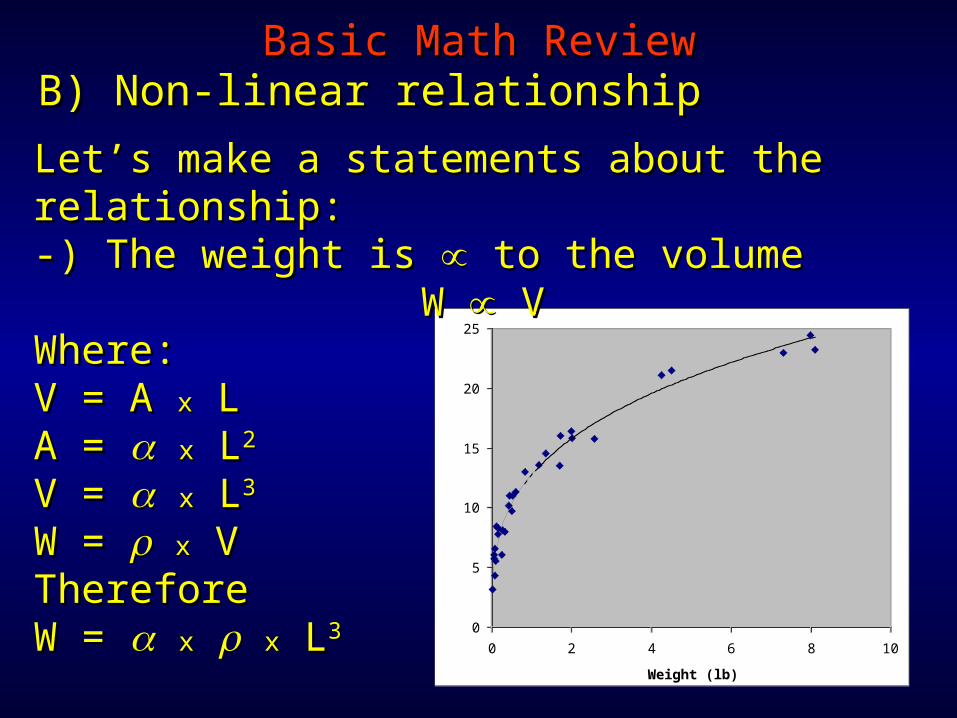
Let’s make a statements about the Let’s make a statements about the relationship:relationship:-) The weight is -) The weight is to the volume to the volume
W W V VWhere:Where:V = A V = A xx L LA = A = xx L L22
V = V = xx L L33
W = W = xx V VThereforeThereforeW = W = xx xx L L33
B)B) Non-linear relationshipNon-linear relationshipBasic Math ReviewBasic Math Review
0
5
10
15
20
25
0 2 4 6 8 10
Weight (lb)
Length (in)
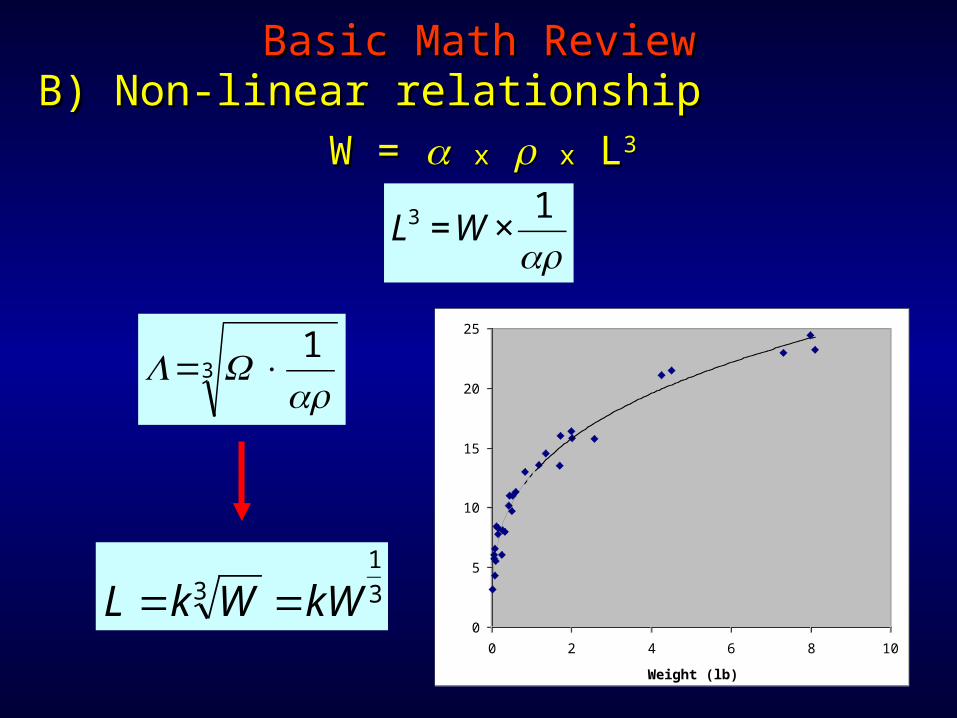
W = W = xx xx L L33
31
×= WL
3
13 kWWkL ==
13 ×=WL

B)B) Non-linear relationshipNon-linear relationshipBasic Math ReviewBasic Math Review
y = 12.797x0.307
R2 = 0.9462
0
5
10
15
20
25
0 2 4 6 8 10
Weight (lb)
Length (in)
31
×= WL 3
13 kWWkL ==
13 ×= WL

3
13 kWWkL ==
Log L = Log (k Log L = Log (k xx W W1/31/3))Log L = Log k + 1/3 Log WLog L = Log k + 1/3 Log W
yy = = b + b + mmxx
y = 0.307x + 1.1071R2 = 0.9462
0.0
0.4
0.8
1.2
1.6
-2.0 -1.6 -1.2 -0.8 -0.4 0.0 0.4 0.8
Weight (lb)
Length (in)
MondayMonday Lamont orientation (LDEO Exec. Director and DEES Lamont orientation (LDEO Exec. Director and DEES
Chair)Chair) Math Review #3: System of Equations: Math Review #3: System of Equations:
Linear/Quadratic - Applied CalculusLinear/Quadratic - Applied Calculus