MATERIALS AND METHODS - Information and Library...
24
113 MATERIALS AND METHODS
Transcript of MATERIALS AND METHODS - Information and Library...

113
MATERIALS AND METHODS

114
MATERIALS
Absolute alcohol Hayman,England Acetone, AR Rankem, New Delhi
Acetonitrile Rankem, New Delhi
Ammonia, AR E.Merk (I) Ltd., Mumbai Calcium Carbonate SD Fine Chemicals, Mumbai Calcium chloride, AR SD Fine Chemicals, Mumbai Chitosan Central Institute of Fisheries (Indian
Fisheries Institute, Coachin, India)
Chloroform Rankem, New Delhi
Chloroform, AR Rankem, New Delhi
Cholesterol estimation Kits Spans Diagnostcs Ltd., India Disodium hydrogen orthophodphate, AR
Rankem, New Delhi
D-Sphingosine Sigma Chemicals, Co., USA Dulbecco modified eagle medium
(DMEM)
Invitrogen life sciences, USA
Ethanol, AR Loba Chemicals, Mumbai Ethyl acetate Qualigens fine chemical, Mumbai Fetal bovine serum (FBS) Invitrogen life sciences, USA
Formaldehyde SD Fine Chemicals, Mumbai Formic acid Loba Chemie Pvt. Ltd., Mumbai
Human normal skin keratinocyte cell
line, (HaCaT)
Provided by Dr. Sudhir Krishna
(National Centre for Biological Sciences,
Bangalore, India)
Hydrochloric acid Rankem, New Delhi
Iso-amyl alcohol Loba Chemie Pvt. Ltd., Mumbai
Isobutanol Merk Ltd., Mumbai
Methanol, AR Rankem, New Delhi
n-Butanol, AR Rankem, New Delhi
Octanol Loba Chemie Pvt. Ltd., Mumbai
O-ohthaldehyde SRL, Mumbai
O-phosphoric acid, AR SD Fine Chemicals, Mumbai
Penicillin Invitrogen life sciences, USA

115
Polyethylene glycol 400, LR Rankem, New Delhi
Potassium Chloride, AR E. Merk (I) Ltd., Mumbai
Potassium dihydrogen phosphate,
AR
Rankem, New Delhi
Propylene glycol, AR E. Merk (I) Ltd., Mumbai
Repaglinide
Sodium azide, AR CDH, Ltd., New Delhi
Sodium Chloride E. Merk (I) Ltd., Mumbai
Sodium hydroxide, AR Rankem, New Delhi
Sodium Hyroxide Rankem, New Delhi
Streptomycin Invitrogen life sciences, USA
Streptozotocin Sigma Chemicals, Co., USA Sulphuric acid
Rankem, New Delhi
Triglyceride estimation Kits
(Enzokits)
Ranbaxy Laboratories Ltd., Gurgaon

116
EQUIPMENTS
12 well plate Cat No.-150628, Denmark
1ml/1ml pipette Cellstar, greiner bio-one
60mm dish
Becton Dickinson (USA) - 35 3002
Aqua check
(Roche Diagnostics, Germany).
Centifuge Remi Equipments, Mumbai
Centrifuge eppendroffs 5415R
Centrifuge eppendroffs 5415R
Confocal Lasar Scanning Microscope Zeiss Axioplan fluorescence microscope
Differential scanning calorimetry Mettler toledo, 821E, switzerland
Diffusion cell apparatus Fabricated by USIC, Punjabi University, Patiala
Electronic weighing balance
Afcoset (ER 182A)
Falcon (15 and 50 ml) Tarson
Gel Doch Uvipro Platinum(made in UK)
High performance liquid chromatography Water’s HPLC system with waters 600 controller pump, water’s inline degasser, Waters HPLC system equipped with 515 binary pump, degasser and a 2487 dual wavelength ultraviolet detector (UV), rheodyne manual injector and RP C-18 column (250 × 4.6 mm, particle size 5 µm) and Empower-2 software.
Homogenizer Remi Equipments, Mumbai
HPTLC
Camag, linomat IV sample applicator fitted with 100 µl syringe (hamilton, Bonaduz, Switzerland), Camag
117
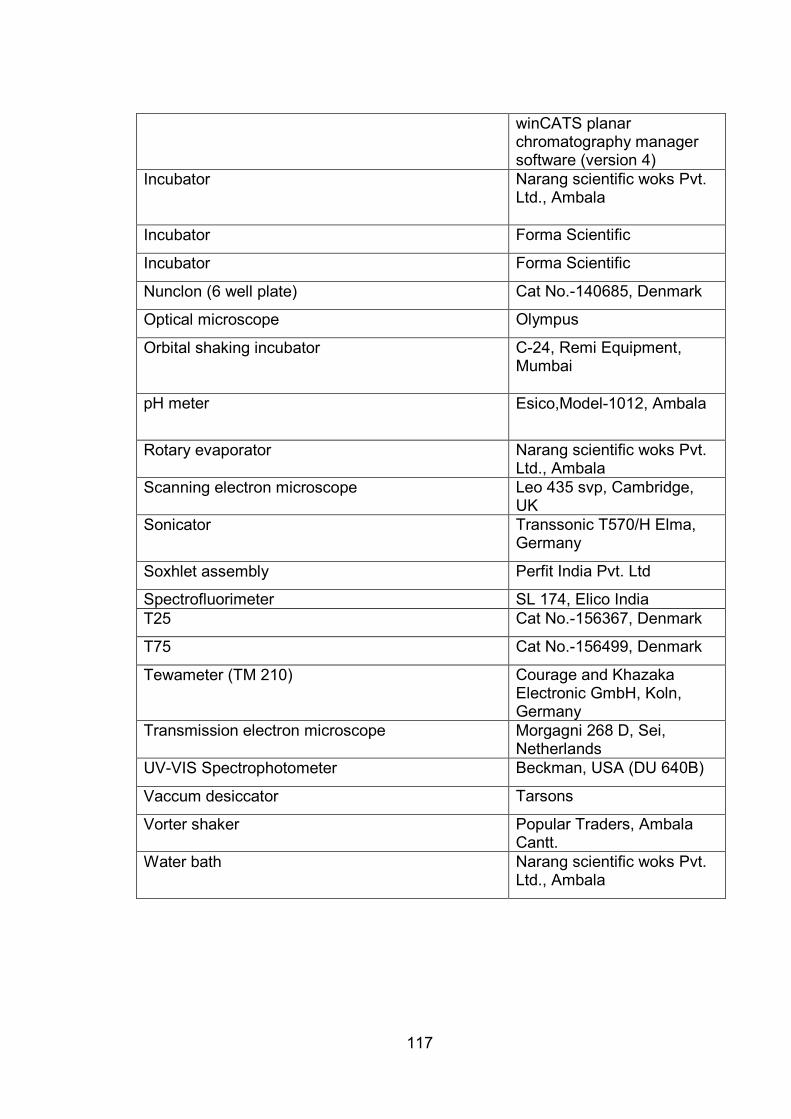
winCATS planar chromatography manager software (version 4)
Incubator
Narang scientific woks Pvt. Ltd., Ambala
Incubator Forma Scientific
Incubator Forma Scientific
Nunclon (6 well plate) Cat No.-140685, Denmark
Optical microscope Olympus
Orbital shaking incubator
C-24, Remi Equipment, Mumbai
pH meter
Esico,Model-1012, Ambala
Rotary evaporator Narang scientific woks Pvt.
Ltd., Ambala Scanning electron microscope Leo 435 svp, Cambridge,
UK Sonicator
Transsonic T570/H Elma, Germany
Soxhlet assembly Perfit India Pvt. Ltd
Spectrofluorimeter SL 174, Elico India T25 Cat No.-156367, Denmark
T75 Cat No.-156499, Denmark
Tewameter (TM 210) Courage and Khazaka Electronic GmbH, Koln, Germany
Transmission electron microscope Morgagni 268 D, Sei, Netherlands
UV-VIS Spectrophotometer Beckman, USA (DU 640B)
Vaccum desiccator Tarsons
Vorter shaker Popular Traders, Ambala Cantt.
Water bath
Narang scientific woks Pvt. Ltd., Ambala

118
METHODS
4.1 Preliminary studies on repaglinide (RGE)
4.1.1. Identification of RGE
Waters system equipped with 515 binary pump, degasser and a 2487
dual wavelength ultraviolet detector (UV), rheodyne manual injector and RP
C-18 column (250 mm × 4.6 mm, particle size 5 ìm) was used for HPLC
analysis. The mobile phase consisted of ammonium acetate: acetonitrile,
30:70 v/v. The drug solution (20 µl) was injected into the column (flow rate 1
ml/min) and the peak area and retention time was recorded.The output signal
was monitored and processed using Empower-2 software.
4.1.2. Analytical method validation of RGE
Stock solution of RGE was made by dissolving RGE in methanol and
further dilutions were made with phosphate buffer (PB) I.P pH 7.4 containing
polyethylene glycol 400 (10% v/v) and sodium azide (0.05%w/v). Polyethylene
glycol 400 and sodium azide were used in the receptor fluid, respectively, for
maintaining sink condition and as preservation of excised skin samples. All
solutions were stored at 4ºC and proctected from light. The stability of this
RGE solution was determined in presence as well as absence of light at 37ºC.
Spectrophotmetric conditions
All absorbances were measured at 243 nm wavelength
spectrophotometrically.
Spectrofluorimetric conditions
Solution of RGE prepared in different solvents were scanned
spectrofluorimeterically from 200-700 nm using SL-174 spectroflourimeter
(ELICO, India Ltd.). All fluorescence measurements were made using 20 nm
excitation and emission windows at a sensitivity of 450 nm. The fluorescence
spectra was recorded at a rate of 240 nm /min.
Chromatograhic conditions
Working standard solutions of RGE were prepared by suitable dilution
of the stock solution with the mobile phase (ammonium acetate: acetonitrile,
30:70 v/v). Each drug solution (20 µl) was injected into the column and the

119
peak area and retention time was recorded by HPLC method. The system
configuration was the same as detailed for identification purpose.
4.1.3. Standard Plot of RGE
In vitro standard plot of RGE using spectrophotometer/
spectrofluorimeter
The solvents used were methanol, phosphate buffer pH 7.4 (PB), PB
containing sodium azide and PEG 400 or PB containing constituents leached
from excised epidermis. Scans were performed in these systems with the
objective of ensuring that these materials did not interfere with excitation or
emission maxima of repaglinide. Fluorescence of different concentrations of
RGE solutions was read on both emission wavelength for each excitation
wavelength during pre excitation and pre emission scanning. Solution of RGE
prepared in different solvents were scanned spectrofluorimeterically from 200-
700 nm using SL-174 spectroflourimeter (ELICO, India Ltd.). Aliquotes of the
stock solution was serially diluted with buffer to obtain solutions ranging from
5 to160 µg/ml concentration of RGE. The fluorescence intensity of these
solutions was measured by employing emission wavelength of 379 nm and
excitation wavelength of 282 nm using PB containing 10% v/v PEG 400 and
0.05% sodium azide as blank. All fluorescence measurements were made
using 20 nm excitation and emission windows at a sensitivity of 450 nm. The
fluorescence spectra was recorded at a rate of 240 nm /min.
The influence of pH on fluorimetric attributes of RGE was assessed by
preparing solutions containing 50 µg/ml RGE in phosphate buffer (PB) in the
range of pH 1.2-12.2. Their spectra were recorded against a blank prepared
with the same reagent concentrations without RGE. The suitability of
fluorimetric analysis for estimating RGE during in vitro permeation
experiments across skin was assessed. Aliquots of stock solution of RGE
(1000 µgml-1) prepared in methanol were transferred to volumetric flasks and
volume adjusted with PB (pH 7.4), PB containing 10% v/v PEG and
(0.05%w/v) sodium azide or PB (pH 7.4) containing constituents leached
from excised epidermis. All solutions were scanned for excitation and
emission maxima.
120
In vivo standard plot of RGE using HPLC
The plasma samples were stored in the deep freezer. The samples
were thawn at room temperature before processing. The mobile phase
composed of acetonitrile–ammonium formate (pH 2.7; 0.01 M) (60:40, v/v).
The formate buffer was prepared fresh daily with double-distilled deionized
water. All solutions were filtered through a 0.45µm membrane (Sartorius,
Germany) prior to use. The flow rate was 1 ml/min and the column
temperature was maintained at 25 ºC. The volume of injection was 20 µl. The
column was equilibrated for at least 20 min with the mobile phase prior to
sample injection. Stock solutions of RGE (100 µg/ml) and indomethacin (100
µg/ml) were prepared by dissolving 1mg of each drug in 10 ml ethanol. The
standard solutions were stored at 4 ºC in a clear glass volumetric flask and
covered with aluminium foil. The data was aquired at 244 nm.
Calibration curve
The calibration curve of RGE in plasma was constructed in the range of
20-200 ng/ml to encompass the expected concentrations in measured
samples. Repaglinide concentrations in the working solution chosen for the
calibration curves were 20, 30, 60, 80, 100 and 200 ng/ml. Quality control
(QC) samples (of low, medium and high concentration) at 40, 70 and 150
ng/ml were prepared in the same way as the calibration standards. These
working solutions were prepared fresh daily by making further dilutions of the
stock solution in ethanol. Working standard solution of internal standard
indomethacin was prepared by diluting the stock solution prepared in ethanol
to obtain a final concentration of 500ng/ml. The internal standard
(indomethacin) and RGE solutions were added to blank plasma samples in
round bottom glass tubes. 1.0 ml extraction buffer (0.1 mol/l potassium
dihydrogen orthophosphate (KH2PO4, pH 5.9) was added to the tubes. The
mixture was vortexed. 5ml ethylacetate and 50µl isoamylalcohol were added
and the pH adjusted to 7.4 with 2MNaOH. The tubes were shaken on a rotater
for 10 min. This was followed by centrifugation at 3000 rpm for 30 min. After
centrifugation, the ethylacetate phase was transferred into V-tubes and
evaporated to dryness under a stream of nitrogen at 45 ºC. The dried extract
121
was reconstituted with 70µl of mobile phase, vortex and transferred to a clean
autosampler vial. 20µl of this solution was injected into the HPLC system.
Estimation of RGE in tablets by HPLC and spectrofluorimetric method
According to USP (2007) eight tablets were weighed to obtain the
average tablet weight and were then powdered. A sample of the powdered
tablets was dissolved in methanol and diluted with methanol:phosphate buffer
pH 4.0 (7:3) to obtain a solution having a concentration of 80 µg/ml. The
solution was filtered through a 0.45 um membrane filter and then injected for
HPLC analysis. The same samples were subjected to spectrofluorimetric
analysis.
4.1.4. Analytical Method Validation studies on RGE
Calibration curves
Calibration curves were prepared and assayed in triplicate on three
different days to evaluate linearity, precision, accuracy, limit of quantitation
(LOQ), limit of detection (LOD) and selectivity. The calibration curve was
constructed in the concentration range of 5-160 µg / ml for spectrofluorimeter
and spectrophotometer. The relative fluorescence intensity of solution was
measured against blank.
Precision and accuracy
The precision and accuracy of the fluorimetric assay were determined
by using solutions containing low (20 ng/ml), medium (40 ng/ml) and high (80
ng/ml) concentrations of RGE. The concentrations of RGE used for HPLC
method validation were 0.1µg/ml, 0.6 µg/ml, 1.2 µg/ml.
Limit of detection
Limit of detection (DL) is defined as the lowest amount of analyte in a
sample which can be detected but not necessarily quantitated as an exact
value. The limit of detection was calculated DL=3.3 σ/S
Limit of quantification
The limit of quantification was (DQ) calculated by using the
following formulas:
DQ=10 σ/S

122
Where, ‘σ’ was obtained from standard deviation of intercepts of the
regressed lines and ‘S’ was the average slope of the regressed line.
Linearity
The calibration curves were obtained by least square linear regression
analysis. The range of drug concentration over which calibration curves
showed linearity was noted.
Intra-assay Precision and Accuracy
For intraassay precision and accuracy, fluorescence of six replicates of
samples were observed and they were analyzed on three consecutive days
along with standard calibration curves.
Inter-assay Precision and Accuracy
Inter-assay precision and accuracy was evaluated by processing a set of
calibration and quality control samples (three levels analyzed twice) in six
separate batches.
4.1.5. Stability of RGE in receptor fluid (PB)
The stability of repaglinide was investigated in PB as well as in buffer
containing sodium azide (0.05%w/v) as preservative both in presence and
absence of light as well as in cold conditions. Samples were withdrawn at
different time intervals and scanned for excitation and emission spectra to
further determine the fluorescence. The study was continued through 48 h.
4.1.6. Dose designing of RGE
To achieve an effective plasma concentration of repaglinide, the
required release rate of RGE was calculated by using the following formula
CpxVdxKe, where,Cp is the effective plasma concentration,Vd is the volume
of distribution and Ke is the elimination rate constant.
4.2 Extraction of alkaloids and vanilloids
Various plants containing alkaloids and vanilloids were surveyed from
literature. Piper nigrum and Zingiber officinale were selected on the basis of
their high content of alkaloid and vanilloid, respectively. Piper nigrum contains
piperine (5-10%) and Zingiber officinale contains gingerol (similar to vanilloid
moiety).

123
4.2.1. Extraction of Piper nigrum
The dried fruits of piper nigrum (200 g) were coarsely ground to a fine
and extracted using Soxhlet Apparatus with 95% ethanol for 4 hours. The
extracted solution was cooled and filtered through fine filter paper. The
solution was concentrated under vacuum on water bath to remove ethanol. 10
mL of 10% w/v alcoholic KOH was added to the residue and left undisturbed
for 1h. The solution was decanted from the insoluble residue. The alcoholic
solution was allowed to stand undisturbed overnight to obtain long yellow
needles of piperine. The yellow needle shaped cryatals were separated and
washed by vacuum filtration and wash with minimum volume of 95% ethanol.
Finally the crystals were air dried and weighed.
4.2.2. Extraction method of Zingiber officinale
The dried rhizome (250g) was powdered mechanically and extracted
by cold percolation with 95% ethanol for 24 h. The extract was recovered and
95% ethanol was further added to the plant material and the extraction
continued. The process was repeated three times. The three extracts were
pooled together and the combined extract was concentrated under reduced
pressure (22–26 mmHg) at 45– 60°C. Solvent free extract (30 g) was
obtained.
4.3. Extraction of coumarins and furanocoumarins
4.3.1. Extraction method of Angelica archangelica
The dried roots of Angelica archangelica (200 g) was pulverized into
coarse powder. One-eighth of the coarse powder was further ground and
passed through a 200-mesh sieve (sample a). Seven-eighth of coarse powder
was orderly extracted by petroleum ether (bp 60–90 ◦C), 95% ethanol and
water under reflux for three times, respectively. The petroleum ether extract
was condensed under vacuum as yellow oil (3.50 g). The alcoholic extract
and aqueous extract were condensed under vacuum and dried to obtain
cream (19.25 g and sample d, 85.75 g), respectively. The material residue
was dried, ground and then passed through a 200-mesh sieve (59.50 g). All
extracts were frozen drying except the petroleum ether extract.

124
4.3.1. Extraction method of Melilotus officinalis
The freshly flowering tops were sorted, dried at room temperature
(about 20–25ºC) to constant weight and ground to obtain a homogenous drug
powder. The material was stored in stoppered glass jars protected from
sunlight. The powder was extracted with ethanol 95 %v/v for 8 h using 250 ml
ethanol. The solvent was then evaporated to obtain a dark green powder.
4.4. Standardization of alkaloids and vanniloids present in Piper nigrum
and Zingiber officinale as well as of coumarins and furanocoumarin
present in Angelica archangelica and Melilotus officinalis using HPTLC
IR spectroscopy and HPTLC analysis were done for characterizing the
purified sample of piperine where as for other plants HPTLC was done. The
samples were spotted in the form of band (6mm) with a camag microlitre
syring on precoated silica gel aluminium plate 60F-254 (20 cm x 10cm x 0.2
mm) Camag Linomat IV (Switzerland). The plate was prewashed by methanol
and activated at 60ºC for 5 minutes prior to chromatography. A constant
Application rate of 15 s/ul was used and space between two band was 7 mm.
The slit dimension was kept at 6 mm x 0.2 mm and 100 mm/s scanned thrice
and baseline correction was used. 10 ml of mobile phase was used per
chromatography. Linear ascending development was carried out in 10 cm x
10 cm twin through glass chamber (Camag Switzerland). Densitometric
scanning was performed on Camag TLC scanner III in the reflectance-
absorbance mode and operated by CATS software (V 4.06, Camag).
4.5. Solubility of RGE
The solubility of RGE in PB, PB containing 10% v/v PEG 400 and
0.05% w/v sodium azide or in PB solutions containing different concentrations
of piperine (0.004-0.1% w/v), Zingiber officinale extract (ZO-E) (0.025% w/v-
0.1 w/v), Angelica archengelica extract (AA-E) (1-6% w/v) or Melilotus
officinalis extract (MO-E) (1-6 % w/v) was determined. Excess RGE was
added and stirred at 37±2⁰C in shaker incubator for 24 h. The solutions were
filtered through G-4 filter and the filtrates were immediately analyzed for RGE
spectrophotometrically at 243 nm when piperine or ZO-E was used. AA-E and
MO-E was analyzed spectrofluorimetrically using excitation and emission

125
wavelength respectively, at 282nm and 379nm. Each experiment was
performed in triplicate.
4.6. Partition coefficient of RGE
The partition coeffcient (KO/PB) was determined by adding RGE (40mg)
to a 1: 4 saturated mixture of octanol (1ml) and PB (5ml) containing PEG 400
(10% w/v) in absence or presence of different concentrations of piperine, ZO-
E and AA-E and MO-E. The mixture was stirred at 37±2ºC in shaker incubator
for 24 h and analyzed spectrophotometrically at 243 nm when piperine or ZO-
E was used. AA-E and MO-E was analyzed spectrofluorimetrically using
excitation and emission wavelength respectively, at 282nm and 379nm. The
concentration of RGE partitioned into octanol was calculated by difference.
The ratio of amount of RGE in octanol to that in PB was calculated. All
experiments were performed in triplicate.
4.7. Dose dependent influence of extracts on skin cholesterol,
triglycerides and sphingosine content in excised rat epidermis.
4.7.1. Skin preparation
Excised dorsal skin obtained from Wistar rats (either sex) was used for
the study. Dorsal hair was removed with mechanical clipper followed by
shaving with electric razor. The animal was sacrificed after 24 h by spinal cord
dislocation and the dorsal skin excised.The skin was wiped clean with
physiological saline. The whole skin was soaked in water at 60ºC for 45 sec,
followed by careful removal of dermis by gentle scrApping to obtain epidermal
sheet (Kligman and Christophers, 1963). Freshly obtained epidermal skin was
used in all experiments.
4.7.2. Total lipid extraction
Epidermis obtained from excised skin after treatments with different
cocentrations of piperine, ZO-E, AA-E, MO-E, chitosan (CTN) (1% w/v), CTN
and selected concentration of herbal extracts was cut into small pieces and
dried to constant weight at 50°C. Extraction of the skin lipids was done by
Folch method (1957). Skin was homogenized in methanol (10ml) for 1 min,
followed by homogenization in chloroform (20 ml) for additional 2 in. The
mixture was filtered and the residue was again homogenized in a solution (30

126
ml) of chloroform-methanol (2:1) for 3 min. The solid obtained after filteration
of the mixture was washed once each with chloroform (20 ml) and methanol
(10 ml). These filtrates were combained and potassium chloride (0.88% w/v)
equal to one fourth the total volume of filtrate was added with stirring. After
allowing it to settle, the upper layer was aspirated and discarded after allowing
the mixture to settle. The chloroform layer obtained after evaporation was
used for determination of cholesterol, triglycerides or sphingosine content
using respective methods as reported earlier (Babita et al., 2005). The
process was repeated for determining the effect of these extracts on viable rat
skin.
4.7.3. Cholesterol (CHOL) estimation
The cholesterol content was determined by following the method
outlined by Ranbaxy Laboratories Ltd. (Enzokits). Briefly, three samples
blank, standard and test was prepared. The test sample obtained 0.025 ml of
lower layer obtained after the extraction process explained above along with
CHOL reagent (5ml). CHOL reagent (5ml). The standard contained CHOL
reagent (5ml) and 0.025 ml of working cholesterol standard. All the samples
were placed immediately I boiling water for 90 sec and then cooled. The
optical density (O.D) of all the three samples was measured at 560 nm. CHOL
content was calculated by using the formula (O.D of test sample / O.D of
standard sample) X 200.
4.7.4. Triglycerides (TGL) estimation
The TGL content was determined by following the method outlined by
Ranbaxy Laboratories Ltd. (Enzokits). Briefly, three samples blank, standard
and test was prepared. The test sample contained 10 µl of lower layer
obtained after the extraction process explained above along with working
reagent (1 ml). The blank contained only working reagent (1 ml). The standard
contained working reagent (1 ml) and 10 µl of triglycerides standard. The
respective solution was mixed and incubated at 37 ºC for 5 min. The
absorbance of test (AT), standard (AS) and blank (AS) were measured at 546
nm. The TGL content was calculated by using formula: [(AT- AS) ÷ (AS-AB)] X
100.

127
4.7.5. Sphingosine (SPE) estimation in excised skin
For SPE estimation, the residue obtained after evaporation in above
section was derivatized with o-phthalaldehyde solution (0.5 mg/ml containing
3% boric acid, pH 10.5 0.05% 2-mercaptoethanol). SPE content was
estimated spectroflouometrically by utilizing excitation wavelength of 340 nm
and emission wavelength 455 nm (Sabbadini et al., 1993). A standard plot of
D-sphingosine (50-400 µg/ml) was prepared spectroflourimetrically after its
derivatization with o- phthalaldehyde.
4.8. Cholesterol, triglyceride and sphingosine estimation in epidermis
obtained from piperine, ZOE or AA-E, MOE treated viable rat epidermis
Two patches were prepared on dorsal side of rat by shaving with
mechanical clipper. One patch was treated with PG: Alcohol (7:3) that served
as control. The second patch received tretment with CTN (1% w/v) or
piperine, ZOE or AA-E, MOE or a mixture containing CTN (1% w/v) or selectd
concentration of respective alkaloid/vanniloid or comarin or furanocoumarin.
Surface area exposed to treatment was kept constant. The animals were
sacrificed after (4 h, 12 h, 24 h, or 48 h). The treated skin patches were
excised and epidermis separated. These epidermal sheets were dried to
constant weight and total lipids were extracted respectively by Folch method.
CHOL, TGL and SPE content in these extracts were determined by using
methods described above. Percentage of CHOL / TGL / SPE extracted was
calculated by using the formula: [1 − (content remaining in skin after treatment
÷ content in normal skin) × 100]. All the experiments wer carried out in
triplicate.
4.9. Thermotropic studies on piperine, ZOE or AA-E, MOE treated
excised skin
The skin was excised, adhering fat and visceral debris removed and
washed with physiological saline solution. Epidermis was separated and
treated with different concentrations of piperine, ZO-E or AA-E, MO- E, CTN
(1% w/v) or selected dose of extract–CTN mixture for 48 h. After washing, it
was dried to get constant weight and then stored in a chamber containing a
saturated solution of sodium chloride (75% RH at 25°C) for 3–4 days. DSC

128
analysis of these samples were performed using heating rate of 1°C/min over
ambient to 120°C. All DSC curves were evaluated especially with regard to
the phase-transition enthalpies (peak areas) and maximum temperatures
(Tm) of lipid phase transitions. The percentage reduction in enthalpy (H) of
endothermic transitions (j/g) was evaluated by using the formula:
of lipid endotherm due to treatment100 *100
of lipid endotherm in untreated epidermis
H
H
∆−
∆
All the experiments were carried out in triplicate.
4.10. In vitro permeation of RGE
4.10.1. Selection of Donor vehicle
Permeation of RGE was studied across epidermis obtained from
excised full thickness rat skin. The epidermal sheets were stabilized in
receptor fluid for 4 hr. RGE was dispersed in ethanol, propylene glycol:
ethanol (7:3), ethanol: propylene glycol (3:7) or octanol: ethanol (9.5:0.5) and
loaded in donor compartment. The receptor fluid (25 ml) consisted of PB,
sodium azide (0.05% w/v) as preservative and polyethylene glycol 400 (10%
v/v) for maintaining sink condition. The stirring rate was at 120 rpm. The entire
cell assembly was securely positioned in a thermostatically controlled water
bath maintained at 37±2ºC and was protected from light. Samples (1ml) were
withdrawn repeatedly through 48h and the samples were analyzed for the
amount of RGE permeated by spectrophotometer at λmax 243 nm as well as
by spectrofluorimetric analysis using 282 nm as excitation and 379 nm as
emission wavelengths. An equal amount of PB containing sodium azide
(0.05% w/v) and polyethylene glycol 400 (10% v/v) maintained at 37±2ºC was
replaced into receptor compartment after each sampling.
4.10.2. In vitro permeation of RGE across treated excised rat epidermis
Excised dorsal skin obtained from Wistar rats (either sex) was used for
the study. Dorsal hairs were removed with mechanical clipper followed by
shaving with electric razor. The skin was wiped clean with physiological
saline. The whole skin was soaked in water at 60 ºC for 45 sec, followed by
careful removal of dermis by gentle scrapping to obtain epidermal sheet

129
(Kligman and Christophers, 1963). . Freshly obtained epidermal sheets were
mounted between the donor and receptor compartments. Different
concentrations of piperine, ZO-E, AA-E or MO-E were admixed with RGE
dispersed in 5 ml of PG: EtOH (7:3) solution. The donor compartment was
sealed using a parafilm. Receptor fluid contained phosphate buffer saline (pH
7.4), sodium azide (0.05%) and PEG 400 (10% v/v). The receptor fluid
samples were withdrawn repeatedly through 48 h and analyzed
spectrophometrically at 243 nm when piperine or ZO-E were used as
enhancers and spectrofluorimetrically for amount of RGE permeated into the
receptor compartment employing excitation and emission wavelength of,
respectively, 282 nm and 379 nm when AA-E or MO-E was used as
enhancer.
4.10.3. In vitro permeation of RGE across epidermis obtained from
treated viable rat epidermis
One patch was prepared on dorsal side of rat by shaving with
mechanical clipper. The patch received treatment with selected dose of
piperine, ZO-E, AA-E or MO-E mixture for different studies. Surface area
exposed to treatment was kept constant. The animals were sacrificed after (4
h, 8h, 12 h, 24 h, 36 h and 48 h). The treated skin patches were excised;
epidermis separated and used for in vitro permeation studies as outlined
earlier. Experiments were carried out in triplicate.
4.11. Microscopic studies
4.11.1. Transmission electron micrograph (TEM)
TEM investigations were carried out to visualize the change in ultra
structure of rat epidermis. Selected concentrations of extracts, CTN or mixture
of CTN and selected concentrations of extracts were treated for 48 h when
applied to excised epidermis for different time intervals (4 h, 8 h, 12 h, 24 h,
48 h) to viable skin. The treated samples were fixed in Karnovosky’s fixative
(2% paraformaldehyde and 1% (w/v) glutaraldehyde in 0.1M phosphate buffer
(pH 7.4) and processed (Van den Bergh et al., 1997). Ultra-thin (60–90 ° A)
sections were cut and double stained with uranyl acetate and lead citrate for
TEM observation (Morgani-268).

130
4.11.2. Scanning electron microscopy (SEM)
The epidermal samples (as obtained for TEM studies) were fixed for 4
h at 4°C in a 2.5% w/v gluteraldehyde in 0.1 M cacodylate buffer (pH 7.2). The
samples were washed three times in 0.1 M cacodylate buffer (pH 7.2) for 10
min each to remove excess fixative. Post fixation was performed for 1 h at
4°C in 1% w/v osmium tetraoxide solution in 0.1 M cacodylate buffer (pH 7.2).
After rinsing two times in buffer, these specimens were dehydrated by placing
into graded ethanol solutions and critically dried in a critical point drier. The
samples were then mounted on a clean aluminum stubs with silver PAG-915
and coated with gold palladium alloy (160 angstrom thickness) on a sputter
coater (Singh et al., 1998). Specimens were then observed under scanning
electron microscope (LEO 435VP) and photographed.
4.12. Transeidermal water loss measurements:
Wistar rats (Approximately 250 g) were anesthetized. The hair of the
dorsal skin was shaved with electric clippers. Two patches (7 cm2), one on
either side of spinal cord, were prepared by shaving with mechanical clipper
and left undisturbed for 24 h. One patch was left utreated and served as
control. The other patch received treatment with selected dose of extract,
CTN (1% w/v) or solution containing mixture of CTN (1% w/v) and selected
concentrations of extracts. The laboratory temperature and humidity were
maintained at, respectively, 25± 2°C; 55 ± 5% RH. The control and treatment
sites were marked as circular area (~7 cm2) with a felt tip marker on the dorsal
surface of the rat. Surface area exposed to treatment was kept constant.The
rats were anaesthetized during the measurements of TEWL. TEWL was
recorded on each site after (4 h, 8h, 12 h, 24 h, 36 h or 48 h) after removal of
the patch by using Tewameter TM 210 (Courage + Khazaka Electronic
GmbH, Koln, Germany). Data was stored and analyzed by the
TEWAMETERÒ computer software. The probe of the Tewameter was placed
perpendicular to the surface of the skin and a stable reading of TEWL was
reached in about 60 s. The results were expressed in g/hm2. Each experiment
was replicated on three skin patches prepared on different rats.

131
4.13. Draize Test:
The study employed albino rabbits (1.2-2.5 kg) of either sex (n=5)
for testing skin irritation. The procedure adopted for this study was in
accordance to that described earlier. The area on the back of each rabbit
was shaved so as to accommodate two patches each of two square inch
area. Patch made from two layers of light gauze was dipped in crude
extracts solutions prepared in PG: EtOH (7:3). The animals were
immobilized in the special holder during the 24-hour patch exposure.
Upon removal of the patches the animals were observed for any sign of
erythema or oedema for a period of 72 hours and scored as reported by
Mullerdecker et al. (1994). The observations were repeated after 72
hours.
4.14. Evaluation of pharmacokinetic parameters of RGE in animals:
Wistar rats of either sex (230-250g) were used for the bioavailability
studies. The animals were selected after superficial examination of the skin
surface for abnormalities. The Wistar rats were housed under controlled
environmental conditions (temperature, 25± 2°C; humidity, 55 ± 5%) and fed
with a commercial diet with free access to water. About 10 cm2 of skin was
shaved on the dorsal side. Rats were observed for 24 hours for any untoward
effect of shaving. The rats were divided into the following groups each
comprising of 6 rats.
Group I : Oral administration of RGE (1 ug/kg) after overnight fasting.
Group II : Application of transdermal patch containing RGE + piperine
(0.008% w/v) mixture dispersed in donor vehicle.
Group III : Application of transdermal patch containing RGE + piperine
(0.008% w/v) - CTN (1% w/v) mixture dispersed in donor
vehicle.
Group IV : Application of transdermal patch containing RGE + ZO-E
(0.05%w/v) mixture dispersed in donor vehicle.
Group V : Application of transdermal patch containing RGE + ZO-E
(0.05%w/v) - CTN (1% w/v) mixture dispersed in donor vehicle.

132
Group VI : Application of transdermal patch containing RGE + AA-E
(5%w/v) mixture dispersed in donor vehicle.
Group VII : Application of transdermal patch containing RGE + AA-E
(5%w/v) - CTN (1% w/v) mixture dispersed in donor vehicle.
Group VIII : Application of transdermal patch containing RGE + MO-E
(3%w/v) mixture dispersed in donor vehicle.
Group IX : Application of transdermal patch containing RGE + MO-E
3%w/v) - CTN (1% w/v) mixture dispersed in donor vehicle.
Blood sample (0.3 ml) via the post-orbital venous plexus veins was
collected in heparinized tubes at 1, 2, 4, 6, 8, 12, 24, 28, 36, 42 and 48 h. The
protocol for the study was approved by Animal Ethics Committee of the
Department of Pharmaceutical Sciences and Drug Research Punjabi
University, Patiala. The blood samples were transferred to a heparinized
eppendoff tube, mixed gently, and then centrifuged (4000 rpm, 5 min) to
obtain 200µl plasma, which was kept at −20°C until analysis. The
concentration of RGE in the plasma was determined by HPLC analysis. The
plasma samples (1 ml) were extracted using extraction buffer (0.1 mol/l
potassium dihydrogen orthophosphate (KH2PO4, pH 5.9) 1 ml, ethylacetate 5
ml and isoamylalcohol 50µl. The pH was adjusted to 7.4 with NaOH 2M. The
tubes were vortexed for 10 min. This was followed by centrifugation at 3000
rpm for 30 min. After centrifugation, the ethylacetate phase was transferred
into vials and evaporated to dryness under a stream of nitrogen at 45°C. The
dried extract was reconstituted with 70 µl of mobile phase, vortex-mixed and
transferred to a clean autosampler vial. This solution was injected into the
HPLC system for analyzing RGE.
4.15. Confocal laser scanning microscopy
4.15 .1. Cells, media and culture conditions
Human normal skin keratinocyte cell line (HaCaT), provided by Dr.
Sudhir Krishna (National Centre for Biological Sciences, Bangalore, India)
was maintained in Dulbecco modified eagle medium (DMEM) with 10% fetal
bovine serum (FBS), 100 units/ml penicillin and 100 µg/ml streptomycin
(Invitrogen life sciences, USA). The FBS for culturing HaCaT cells was heat

133
inactivated for 30 mins at 55°C. HaCaT cells were cultivated according to the
method described by Brandner (2000). The cells were maintained at 37°C in a
humified atmosphere with 5% CO2. Second or third passage HaCaT cells
were plated on coverslips in a 12 well plate at a density of about 5,000 cells/
cm2. After overnight incubation at 37°C in a humified 5% CO2 incubator, cells
were supplemented with fresh DMEM medium containing 10% FBS. The cells
were incubated untill they were approximately 50-60% confluent. Cells were
made serum free 16-24 hrs prior fixation and treated with solutions containing
different concentrations of piperine, ZO-E, AA-E or MO-E for 6 h. Extract in
%age w/v were prepared in PG: EtOH (7:3) solution and the solution was
sterilized by filtering (Sartolab. vl15, pore size 0.2 lam), followed by serial
dilution in DMEM to obtain solutions. The 100% confluent cells in 12 well plate
were treated with solutions containing concentrations of extracts. A control
without addition of different extracts was also prepared. The cells were
cultured under the conditions described above for 6 h. The growth of cells was
monitored on an inverted-phase Nikon TMS light microscope. All experiments
were repeated three times.
4.15.2. Immunoflourescence
Fixation was performed by immersing the cells into freshly prepared
4% paraformaldehyde for 10 minutes. Immediately after fixation, cells were
permeabilized with 0.1% TritonX-100 (sigma) for 5 minutes. Cells were then
rinsed with phosphate buffer saline (PBS) for 3 minutes and blocked in 10%
FBS in PBS for 1hr. This was followed by incubation with primary anti-TJP1
(ZO-1) antibody (1:100 dilution) for 2hr at room temperature (or overnight at
4°C). After three rinses in PBS for 10 minutes each, coverslips were
incubated with FITC-conjugated anti rabbit IgG at 10ug/ml in PBS containing
2% FBS for 2h. Slides were then rinsed three times in PBS and coverslips
were mounted in antifade mounting medium (Vector laboratories). Nucleus
was stained using propidium iodide (5 µg / ml). Control for antibody specificity
was prepared by omitting the primary antibody. The control demonstrated
minimal or no staining. For microscopic examination, a Zeiss Axioplan

134
fluorescence microscope (Zeiss) equipped with a confocal scanning unit
MRC-600 (Bio-rad) and an argon-Krypton laser were used.
4.16 Efficacy of transdermal patches in hyperglycemic rats
Wistar rats, weighing 150–200 g, fasted overnight were used for
induction of diabetes. The experimental protocol was approved by Institutional
Animal Ethics Committee of the Punjabi University, Patiala and the care and
handling of the animals was in accordance with the National Institutes of
Health guidelines. The animals were allowed to acclimatize for 2 weeks
before the experiment. The animals were housed in polypropylene cages
inside a well-ventilated room. Each cage consists of not more than 3 rats.
They were maintained under standard laboratory conditions of temperature,
25± 2°C; humidity, 55 ± 5% and 12 hour light/dark cycle. They were fed a
standard commercial pellet diet and water ad libitum. The diet consisted of
71% carbohydrate, 18% protein, 7% fat, 4% salt mixture and adequate
minerals and vitamins.
4.16.1Experimental groups and protocol:
Diabetes was induced in wistar rats by i.p injection of STZ (60 mg/kg).
STZ was dissolved in 0.01 M sodium citrate buffer, pH 4.5 to overnight fasted
rats and always prepared freshly. During the first 24 h of diabetes induction,
STZ-treated animals were allowed to drink 5% glucose solution to overcome
drug-induced hypoglycemia. Forty-eight hours after STZ administration,
diabetes was confirmed by the presence of hyperglycemia. The blood glucose
concentration was measured every week from the day of STZ injection.
Rats were divided into 11 groups (n=6). Animals were placed into
different groups after 7 days of induction of diabetes. The hair on the backside
of the rats was removed with an electric hair clipper on the previous day of the
experiment. The rats were treated as following:
Group I (control): Citrate buffer
Group II : Oral administration of RGE (1µg/g body weight) after
overnight fasting.
Group III : Application of transdermal patch containing RGE + PG:
EtOH (7:3).

135
Group IV : Application of transdermal patch containing RGE + piperine
(0.008% w/v) mixture dispersed in donor vehicle.
Group V : Application of transdermal patch containing RGE + piperine
(0.008% w/v) - CTN (1% w/v) mixture dispersed in donor
vehicle.
Group VI : Application of transdermal patch containing RGE + ZOE
(0.05%w/v) mixture dispersed in donor vehicle.
Group VII : Application of transdermal patch containing RGE + ZO-E
(0.05%w/v) - CTN (1% w/v) mixture dispersed in donor
vehicle.
Group VIII : Application of transdermal patch containing RGE + AA-E
(5%w/v) mixture dispersed in donor vehicle.
Group IX : Application of transdermal patch containing RGE + AA-E
(5%w/v) - CTN (1% w/v) mixture dispersed in donor
vehicle.
Group X : Application of transdermal patch containing RGE + MO-E
(3%w/v) mixture dispersed in donor vehicle.
Group XI : Application of transdermal patch containing RGE + MO-E
(3%w/v) - CTN (1% w/v) mixture dispersed in donor
vehicle.
Blood samples via the post-orbital venous plexus veins was
collected and blood glucose levels were determined using Aqua check
(Roche Diagnostics, Germany).
4.17 Data and statistical analysis:
Castesian plots with a cumulative amount of RGE present in the
receptor compartment Vs. time were plotted. The RGE cocentration of
the receptor compartment was corrected for sample removal by use of
the equatonderived by Hayton and Chen (1982):
C1n=Cn (VT/VT-VS) (C1
n-1/Cn-1)
Where C1n and Cn are the corrected and measured concentrations
of RGE in the nth sample, respectively.
VT is the total volume of the receptor compartment.

136
VS is the total volume of the sample withdrawn.
C1n-1 and Cn-1 are the corrected and measured concentrations of
RGE in the (n-1)th sample, respectively.
The cumultive amount of RGE permeated per unit surface area
was plotted against the time and slope of the linear portion of the
graph was estimated as steady state flux (JSS).
Enhancement ratio of RGE after vrious tretments (ER) was
calculated as:
ER=Ptreatment / Pcontrol
Where, Ptreatment is the flux of RGE through enhancer treated
epidermis and Pcontrol is the flux of RGE through untreated
epidermis.
ANOVA was followed by Dunnett’s test when data of treated
groups were compared with control group. However, Turkey test
was employed after ANOVA for all pair-wise multiple comparisons
among groups. The levelf significance was fixed at P<0.05.