Material flammability, combustion, toxicity and fire hazard in
53
Material flammability, combustion, toxicity and fire hazard in transportation Indrek S. Wichman * Department of Mechanical Engineering, Michigan State University, East Lansing, MI 48824-1226, USA Received 30 October 2001; accepted 4 March 2003 Abstract Many materials used in transportation vehicles are combustible, often dramatically so. These materials may include gases, liquids and solids. They are sometimes employed in order to increase fuel efficiency, reduce manufacturing cost or meet other market demands such as durability or appearance. Extensive research has been conducted on such materials both with and without the expressed intent of applying the results directly to transportation. Combustion and fire research, considered generally, are much broader than (and in fact encompass), the specific applications to transportation issues discussed here. Much if not most of fire and combustion research, therefore, has a direct bearing on transportation. This review ties together disparate subjects of fundamental fire and combustion research that have relevance to transportation fire. The goal is to provide a technical overview of the combustion literature related to, but not exclusively concerned with or focused on, transportation fire safety. Although they are not a large percentage of transportation-related fatalities, fires can be costly in human and economic terms. In the United States, post-collision fires occur in 1 – 5% of fatal motor vehicle accidents, while approximately 20% of air traffic fatalities are attributed to fire. This review addresses scientific and technical engineering issues in the fields of fire initiation; fire spread; products of combustion and their toxicity; and practical fire prevention in vehicles and other modes of transportation. q 2003 Elsevier Ltd. All rights reserved. Keywords: Material flammability; Combustion; Transportation Contents 1. Introduction ................................................................... 248 1.1. Fire safety ................................................................ 248 1.1.1. Fire initiation ........................................................ 250 1.1.2. Fire growth ......................................................... 251 1.1.3. Fire chemistry ....................................................... 251 1.1.4. Summary ........................................................... 251 1.2. Discussion ................................................................ 251 2. Fire initiation .................................................................. 252 2.1. Ignition of gases, liquids and solids.............................................. 252 2.1.1. Gases .............................................................. 252 2.1.2. Liquids ............................................................ 255 2.1.3. Solids ............................................................. 255 2.2. Flammability and ignition..................................................... 256 2.2.1. Fundamentals of flammability and ignition (an example) ........................ 257 2.2.2. Flammability and ignition literature review .................................. 258 0360-1285/03/$ - see front matter q 2003 Elsevier Ltd. All rights reserved. doi:10.1016/S0360-1285(03)00027-3 Progress in Energy and Combustion Science 29 (2003) 247–299 www.elsevier.com/locate/pecs * Corresponding author. Tel.: þ 1-517-355-5131; fax: þ1-517-353-1750. E-mail address: [email protected] (I.S. Wichman).
Transcript of Material flammability, combustion, toxicity and fire hazard in

Material flammability, combustion, toxicity and fire
hazard in transportation
Indrek S. Wichman*
Department of Mechanical Engineering, Michigan State University, East Lansing, MI 48824-1226, USA
Received 30 October 2001; accepted 4 March 2003
Abstract
Many materials used in transportation vehicles are combustible, often dramatically so. These materials may include gases,
liquids and solids. They are sometimes employed in order to increase fuel efficiency, reduce manufacturing cost or meet other
market demands such as durability or appearance. Extensive research has been conducted on such materials both with and
without the expressed intent of applying the results directly to transportation.
Combustion and fire research, considered generally, are much broader than (and in fact encompass), the specific applications
to transportation issues discussed here. Much if not most of fire and combustion research, therefore, has a direct bearing on
transportation. This review ties together disparate subjects of fundamental fire and combustion research that have relevance to
transportation fire. The goal is to provide a technical overview of the combustion literature related to, but not exclusively
concerned with or focused on, transportation fire safety.
Although they are not a large percentage of transportation-related fatalities, fires can be costly in human and economic terms.
In the United States, post-collision fires occur in 1–5% of fatal motor vehicle accidents, while approximately 20% of air traffic
fatalities are attributed to fire. This review addresses scientific and technical engineering issues in the fields of fire initiation; fire
spread; products of combustion and their toxicity; and practical fire prevention in vehicles and other modes of transportation.
q 2003 Elsevier Ltd. All rights reserved.
Keywords: Material flammability; Combustion; Transportation
Contents
1. Introduction . . . . . . . . . . . . . . . . . . . . . . . . . . . . . . . . . . . . . . . . . . . . . . . . . . . . . . . . . . . . . . . . . . . 248
1.1. Fire safety . . . . . . . . . . . . . . . . . . . . . . . . . . . . . . . . . . . . . . . . . . . . . . . . . . . . . . . . . . . . . . . . 248
1.1.1. Fire initiation . . . . . . . . . . . . . . . . . . . . . . . . . . . . . . . . . . . . . . . . . . . . . . . . . . . . . . . . 250
1.1.2. Fire growth . . . . . . . . . . . . . . . . . . . . . . . . . . . . . . . . . . . . . . . . . . . . . . . . . . . . . . . . . 251
1.1.3. Fire chemistry . . . . . . . . . . . . . . . . . . . . . . . . . . . . . . . . . . . . . . . . . . . . . . . . . . . . . . . 251
1.1.4. Summary . . . . . . . . . . . . . . . . . . . . . . . . . . . . . . . . . . . . . . . . . . . . . . . . . . . . . . . . . . . 251
1.2. Discussion . . . . . . . . . . . . . . . . . . . . . . . . . . . . . . . . . . . . . . . . . . . . . . . . . . . . . . . . . . . . . . . . 251
2. Fire initiation . . . . . . . . . . . . . . . . . . . . . . . . . . . . . . . . . . . . . . . . . . . . . . . . . . . . . . . . . . . . . . . . . . 252
2.1. Ignition of gases, liquids and solids. . . . . . . . . . . . . . . . . . . . . . . . . . . . . . . . . . . . . . . . . . . . . . 252
2.1.1. Gases. . . . . . . . . . . . . . . . . . . . . . . . . . . . . . . . . . . . . . . . . . . . . . . . . . . . . . . . . . . . . . 252
2.1.2. Liquids . . . . . . . . . . . . . . . . . . . . . . . . . . . . . . . . . . . . . . . . . . . . . . . . . . . . . . . . . . . . 255
2.1.3. Solids . . . . . . . . . . . . . . . . . . . . . . . . . . . . . . . . . . . . . . . . . . . . . . . . . . . . . . . . . . . . . 255
2.2. Flammability and ignition. . . . . . . . . . . . . . . . . . . . . . . . . . . . . . . . . . . . . . . . . . . . . . . . . . . . . 256
2.2.1. Fundamentals of flammability and ignition (an example) . . . . . . . . . . . . . . . . . . . . . . . . 257
2.2.2. Flammability and ignition literature review . . . . . . . . . . . . . . . . . . . . . . . . . . . . . . . . . . 258
0360-1285/03/$ - see front matter q 2003 Elsevier Ltd. All rights reserved.
doi:10.1016/S0360-1285(03)00027-3
Progress in Energy and Combustion Science 29 (2003) 247–299
www.elsevier.com/locate/pecs
* Corresponding author. Tel.: þ1-517-355-5131; fax: þ1-517-353-1750.
E-mail address: [email protected] (I.S. Wichman).
2.3. Rate of heat release (RHR): the cone calorimeter and other diagnostic devices . . . . . . . . . . . . . . 260
2.3.1. Background and principles of the cone calorimeter . . . . . . . . . . . . . . . . . . . . . . . . . . . . 260
2.3.2. Practical uses of the cone calorimeter and other fire diagnostic devices. . . . . . . . . . . . . . 263
3. Fire spread . . . . . . . . . . . . . . . . . . . . . . . . . . . . . . . . . . . . . . . . . . . . . . . . . . . . . . . . . . . . . . . . . . . . 265
3.1. Fire spread over liquid fuels . . . . . . . . . . . . . . . . . . . . . . . . . . . . . . . . . . . . . . . . . . . . . . . . . . . 265
3.2. Theory of fire spread over liquid and solid fuels . . . . . . . . . . . . . . . . . . . . . . . . . . . . . . . . . . . . 267
3.3. Fire and flame spread over materials . . . . . . . . . . . . . . . . . . . . . . . . . . . . . . . . . . . . . . . . . . . . . 269
4. Fire chemistry . . . . . . . . . . . . . . . . . . . . . . . . . . . . . . . . . . . . . . . . . . . . . . . . . . . . . . . . . . . . . . . . . 272
4.1. Products of thermal decomposition and combustion . . . . . . . . . . . . . . . . . . . . . . . . . . . . . . . . . . 273
4.1.1. A case study: the sunshine mine . . . . . . . . . . . . . . . . . . . . . . . . . . . . . . . . . . . . . . . . . . 276
4.2. Toxicity. . . . . . . . . . . . . . . . . . . . . . . . . . . . . . . . . . . . . . . . . . . . . . . . . . . . . . . . . . . . . . . . . . 277
4.2.1. PVC and fire-gas toxicity . . . . . . . . . . . . . . . . . . . . . . . . . . . . . . . . . . . . . . . . . . . . . . . 280
4.2.2. Polymer decomposition and toxicity . . . . . . . . . . . . . . . . . . . . . . . . . . . . . . . . . . . . . . . 281
4.2.3. PU foam toxicity . . . . . . . . . . . . . . . . . . . . . . . . . . . . . . . . . . . . . . . . . . . . . . . . . . . . . 282
4.2.4. Toxicity of fire-retarded materials; toxicity of foams and fabrics; influences of heating rates
on toxicity . . . . . . . . . . . . . . . . . . . . . . . . . . . . . . . . . . . . . . . . . . . . . . . . . . . . . . . . . . 283
4.3. Smoke and retardants . . . . . . . . . . . . . . . . . . . . . . . . . . . . . . . . . . . . . . . . . . . . . . . . . . . . . . . . 284
5. Vehicle fires. . . . . . . . . . . . . . . . . . . . . . . . . . . . . . . . . . . . . . . . . . . . . . . . . . . . . . . . . . . . . . . . . . . 286
5.1. Buses . . . . . . . . . . . . . . . . . . . . . . . . . . . . . . . . . . . . . . . . . . . . . . . . . . . . . . . . . . . . . . . . . . . 286
5.2. Railway and subway cars . . . . . . . . . . . . . . . . . . . . . . . . . . . . . . . . . . . . . . . . . . . . . . . . . . . . . 286
5.3. Aircraft cabins . . . . . . . . . . . . . . . . . . . . . . . . . . . . . . . . . . . . . . . . . . . . . . . . . . . . . . . . . . . . . 287
5.4. Motor vehicles . . . . . . . . . . . . . . . . . . . . . . . . . . . . . . . . . . . . . . . . . . . . . . . . . . . . . . . . . . . . . 288
6. Conclusions . . . . . . . . . . . . . . . . . . . . . . . . . . . . . . . . . . . . . . . . . . . . . . . . . . . . . . . . . . . . . . . . . . . 291
Acknowledgements . . . . . . . . . . . . . . . . . . . . . . . . . . . . . . . . . . . . . . . . . . . . . . . . . . . . . . . . . . . . . . . . 292
References . . . . . . . . . . . . . . . . . . . . . . . . . . . . . . . . . . . . . . . . . . . . . . . . . . . . . . . . . . . . . . . . . . . . . . . 292
1. Introduction
In the past, the vehicles used for transportation were
constructed almost exclusively of wood and metal. The
general fire behavior of these materials, for example whether
or not they readily burn, was common knowledge, and
alternative materials were limited both in their availability
and in their use.
With time and technological advancement, larger num-
bers of potentially combustible materials have been used in
transportation vehicles. The precise reasons are many,
although two prominent design considerations have been
(1) mass reduction, resulting in increased fuel efficiency, and
(2) reduced manufacturing costs. Numerous complicated
physical processes occur during the combustion of materials
frequently used in transportation: these include, but are not
limited to dripping and running of liquefied surface layer
during burning; by-products of combustion; loss of material
integrity and desirable physical performance properties;
production of lightweight, combustible, decomposition
gases; and flame spread to nearby combustible materials.
This review was prepared in accordance with an
agreement between General Motors (GM) and the US
Department of Transportation. The document outlining this
research agreement is described in the settlement agreement
between the United States Department of Transportation
and the General Motors Corporation dated March 7, 1995.
Part of the research program established by this agreement
required a literature search of articles related to transpor-
tation fire and materials flammability. Of the more than
1000 articles culled from research journals by GM
engineers, approximately 150 were abstracted at Michigan
State University (MSU). To avoid copyright infringement,
copyrighted abstracts were not included in the Transpor-
tation Fire Safety (TFS) Bibliography developed by LaDue
[1]. Original abstracts for the approximately 150 selected
articles were written by me and included in the GM TFS
Bibliography. The present article is, in part, a topically
organized and condensed version of these abstracted
articles. Nevertheless, in addition to the works abstracted
in the TFS bibliography, numerous additional works are
described and discussed when they shed light on the
particular subjects discussed. These additions were carried
out at my discretion without significant input from GM.
The intent in this review is to provide a systematic
examination of the combustion, flammability and toxicity
features of materials associated with transportation and
transportation fires. The reader is assumed to have sufficient
scientific or engineering background to understand the
technical content of this review. The background discus-
sions found in each subsection are meant to outline relevant
fundamental concepts and methods in each research field.
1.1. Fire safety
Three means are employed for addressing the problem of
fire safety in vehicles and other modes of transportation.
I.S. Wichman / Progress in Energy and Combustion Science 29 (2003) 247–299248

Nomenclature
B pre-exponential factor ((mol/L3)2(n 2 1)
t21)
cpg specific heat per unit mass (of gas)
(e=m K)
cps specific heat per unit mass (of solid)
(e=m K)
Ci concentration of species i (mol/L3)
E activation energy (e/mol)
h heat loss coefficient (e/L3 t K)
k rate constant, k ¼ R expð2E=RTÞ
((mol/L3)2(n 2 1) t21)
l material thickness (L)
lq distance from flame tip to fuel surface (L)
_m00 mass flux of fuel from surface of decom-
posing fuel (m/L2 t)
_m00ig mass flux at ignition (m/L2 t)
_q00 heat flux (e/L2 t)_Q heating rate (e/t)
R universal gas constant (e/mol K)
S surface area (L2)
tig ignition time (t)
Tf flame temperature (K)
Tig ignition temperature (K)
Tv surface gasification or ‘vaporization’ tem-
perature (K)
T1 ambient temperature (K)
V velocity (L/t)
Vf velocity of flame spread (L/t)
Vg velocity of gas flow (L/t)
V volume (L3)
w width of material (L)
xf flame tip position (in wind-aided flame
spread) (L)
xp pyrolysis front position (wind-aided flame
spread) (L)
Yo oxidizer mass fraction
Subscripts
c combustion
f flame
g gas
ig at ignition
O oxidizer
s solid
1 ambient
Greek symbols
a thermal diffusivity, a ¼ l=rcp (L2/t)
d heated segment of solid fuel in the plane
of flame travel (L)
Dh enthalpy difference ðe=mÞ
Dhc enthalpy of combustion per unit mass ðe=mÞ
DHc enthalpy of combustion per mole (e/mol)
lg gas phase thermal conductivity (e/L t K)
ls solid phase thermal conductivity (e/L t K)
r density (m/L3)
Acronyms
ABS acrylonitrile–butadiene–styrene
APB ammonium pentaborate
ATF automatic transmission fluid
ASTM American Society for Testing and
Materials
BART Bay Area Rapid Transit System
CB cement block
CFD computational fluid dynamics
CN cyanide
CP chloroparaffins
CWSS cabin water spray system
DIMS direct inlet mass spectrometry
DMMP dimethyl phosphate
DOT Department of Transportation
DSC differential scanning calorimetry
DTA differential thermal analysis
EHOC effective heat of combustion
EP epoxy
EU European Union
EVA ethylene-vinyl-acetate
FAA Federal Aviation Administration
FHA fire hardening assessment
FINN finnacryl
FMRC Factory Mutual Research Corporation
FR fire retardant
FRA Federal Railway Administration
GB gypsum board
GC gas chromatography
GC–MS gas chromatographic mass spectrometry
GM general motors
HC hydrocarbon
HCL hydrogen chloride
HCN hydrogen cyanide
HDPE high density polyethylene
HR heat release
HR high resistance
HVAC heating, ventillation, and air conditioning
IPS or ImpPS impact polystyrene
IR infra-red
ISO International Standards Organization
LDPE low density PE
LDV laser Doppler velocimetry
LIFT lateral ignition and flame spread test
LOI limiting oxygen index
LSF low smoke and fume
MAR marinite
N nylon
NBS National Bureau of Standards
I.S. Wichman / Progress in Energy and Combustion Science 29 (2003) 247–299 249
These are fire prevention, fire minimization and fire
suppression.
In fire prevention, the choice of materials and minimiz-
ation of potential ignition sources are of principal concern.
Also important, if combustibles are used, are geometrical
placement, orientation, and choice of the materials. The
objective is to prevent ignition. For example, a tube
constructed of a flammable material can safely carry
premixed combustible gases when its inner diameter is
smaller than the quench distance [2]. Provided that the
external environment surrounding the tube is not itself hot.
Despite their apparent simplicity, tube-quenching studies
[3] may be especially relevant for fire safety in complex
systems laden with potentially combustible liquid and gas–
vapor fuels.
In fire minimization, one might employ fire resistant
materials in locations where fire is believed likely to
propagate. As in prevention, the choice of materials may
vary. The geometrical configuration may be altered to
reduce oxygen crossflow, for example, or the radiative view
factor directed towards other, possibly non-combustible,
surfaces, or the materials may be treated with additives to
reduce their flammability. Additives may also be employed
to reduce the toxicity of combustion by-products.
In fire suppression, one seeks to extinguish fire once it
has begun. The location of the suppressant stream is
important, as are the suppressant delivery rate, its chemical
structure, the intensity and location of the fire and its
exposure to the environment, all of which can alter the
suppression effectiveness. Fire suppression is important in
forms of transportation where large volumes of highly
volatile fuel are stored near physically combustible
surrounding materials.
The scientific and technical questions raised in all
aspects of fire prevention, fire minimization and fire
suppression are distilled into three research categories,
namely (1) fire initiation, (2) fire growth, and (3) fire
chemistry. All aspects of fire prevention, minimization or
suppression can be discussed in terms of (1)–(3). In each of
these research categories, it is helpful to picture the specific
question under study in terms of an actual, physical model
problem, or a set of model problems whose mutual
similarities exceed their differences. The model problem
may form the basis for a rational, interpretable technical
engineering test.
1.1.1. Fire initiation
Fire initiation occurs when ignition yields self-sustained
combustion, such as a propagating flame in a gas or a
spreading flame over a liquid or a solid. Initiation is
influenced by geometry (position and placement of
materials), airflow, type and duration and placement
of ignition source, ambient temperature, temperature of
ignition source, and heat flux from the ignition source. For
liquids and solids, the simplest case of fire initiation is the
one-dimensional, transient exposure of a material to a heat
flux or a high temperature. Fire initiation may thus be
visualized as a one-dimensional, semi-infinite slab of
material subjected to thermal insult. We note that fire
above a liquid or solid requires gasification of the
condensed-fuel phase because the flame is commonly
situated in the gas. Exceptions such as combustion in
unusual solids (e.g. propellants) and smolder fronts are not
considered in this review. Pure gas-phase initiation occurs
when a combustible gaseous mixture of fuel and oxidizer
has been formed and ignited. The process of flame and fire
NHTSA National Highway and Transportation
Safety Administration
NIST National Institute for Standards and Tech-
nology
NT Nord Test
NYCTA New York City Transit Administration
OSU Ohio State University
PA polyamide
PA-6 polycapolactum
PA-7 polyoenantholactum
PA-8 polycapylolactum
PA-11 rislin
PAR policy accident report
PC polycarbonate
PE polyethylene
PET polyethylene terephthalate
PEU polyether urethane
PH phenolic resin
PMMA polymethylmethacrylate (‘plexiglass’)
POM polyacetyl
PP polypropylene
PRHR peak rate of heat release
PS polystyrene
PU polyurethane
PVC poly vinyl chloride
PX perspex
RHR rate of heat release
RUF rigid urethane foam
TC thermocouple
TFS transportation fire safety (Bibliography
compiled at GM)
TGA thermogravimetric analysis
THR total heat release
TPRHR time to peak RHR
TTI time to ignition
UFF urea formaldehyde foam
UMTA urban mass transit authority
VE vinylester
W wood
I.S. Wichman / Progress in Energy and Combustion Science 29 (2003) 247–299250

initiation is complicated, and one must realize that in nearly
all applications, nearby surfaces are strongly involved and
cannot be ignored. Indeed, the concept of pure gas phase
initiation may be an unrealistic and counterproductive
engineering-science simplification. A simple fire initiation
configuration with relevance to real-world fire initiation
involves a sample material placed horizontally, say, and
then subjected to a constant heat flux in the presence of a
nearby ‘pilot’ flame that provides the ignition source.
A model apparatus now commonly employed for fire
initiation testing is the cone calorimeter [4–6]. It is the most
widely used device for static material flammability tests
although other methods are used, like the French ‘epir-
adiateur.’ The cone calorimeter will be extensively
discussed in Section 2.
1.1.2. Fire growth
The incipient flame kernel may propagate (in the gas, as
in SI engines or vapor-filled fuel tanks, for example) or
spread (over a liquid or solid fuel). The expansion of the
flame is referred to as fire growth, although some
qualifications are necessary. A small O (1–10 cm) flame
is seldom referred to as ‘fire’. A large conflagration is never
referred to as a ‘flame’, but instead as a fire. However, a fire
may consist of individual flames.1 Thus, the words flame
and fire are commonly and ordinarily associated with scale.
The former is an element of the latter, never vice versa. We
refer to ‘fire growth’ in this review because fire safety
analysis requires that we deal at a minimum with human-
scale conflagrations, not laboratory-scale flames.
Fire growth is therefore a multi-dimensional process
involving airflow, products of combustion, flame and
surface radiation, and other physical phenomena. It is useful
to visualize fire growth as a partially burning surface with
fire spreading from the burned (involved) region to the
unburned (virgin) region. In wind-aided fire spread the gas
flow assists spread (e.g. upward fire spread over a wall)
whereas the gas flow opposes spread in wind-opposed
spread (e.g. downward fire spread over a wall). These two
model configurations have in common the advancement, or
spread, of the fire front from one location to the next.
However, they are almost completely different processes
because wind-aided spread is intrinsically distinct from
wind-opposed spread.
The model apparatus associated with fire spread either
upward, downward or sideways is the LIFT (Lateral Ignition
and Flame Spread Test) apparatus, devised by Quintiere [7].
Test devices like the LIFT apparatus make dynamic fire
measurements because they examine the propagation of a
flame front. In the cone calorimeter the flame does not move,
hence it is referred to as a static test even though the burning
sample surface is consumed. This consumption can be
compensated by supplying new fuel at the same rate, in
which case the Cone test would truly be static.
1.1.3. Fire chemistry
Fire chemistry differs from ordinary chemistry in the
more specialized sense of referring (generally) to hydro-
carbon fuel oxidation. Fire chemistry also differs from
laboratory chemistry in the fact that in real fires, unlike
small-scale laboratory flames, the reactants and products of
combustion convect and diffuse into the surroundings. In
addition, reactants and products of combustion can also mix.
These real-world complications can produce differences
from laboratory experimental studies in which fire toxins
and other products of combustion are examined in idealized
homogeneous chemical calorimeters or similar scientific
apparatuses. In fires, the transport of these substances is
generally transient, three-dimensional and highly dependent
on geometry and flow patterns. The following quotation
reiterates the importance of flow and transport in fire [8]:
“…During the (last 25 years) it (has become) clear that
while chemists had done excellent chemistry, this had little
to do with fire. For most, but not all fire processes, chemical
kinetics is essentially infinitely fast. The rate-controlling
steps in the fire are the dynamic processes which mix, heat,
and ignite the fuel and air.” We add that the rate is also
affected by processes that transport the products of
combustion. In this review the only aspects of fire chemistry
that are considered are those occurring after the principal
heat releasing reactions are finished. Combustion toxicity,
for example, deals with the consequences of the formation
of ‘slow’ chemical species that linger and cause harm due to
their very nature and concentration as chemical species, not
because they release heat.
The chemical bomb calorimeter and other standard
chemical diagnostics are used for chemical testing [9]. It has
been recognized, however, that species movement or
transport by convection and diffusion are also important
processes, as textbooks in combustion amply illustrate [10].
1.1.4. Summary
Fire initiation, fire growth and fire chemistry are relevant
in different stages of transportation fires and the aspects of
transportation fires can be discussed in terms of these three
categories of fire processes. If no fire is to be permitted,
growth and chemistry need not be discussed: initiation is the
most important steps. If initiation cannot be absolutely
prevented, growth and chemistry must be carefully
examined. If initiation and growth are possible, the chemical
production and transport of species (chiefly products of
combustion) are important. All articles in this review deal
with one or another of these stages of fire.
1.2. Discussion
This review is organized as follows. In Section 2 we
examine fire initiation, subdivided into flammability and
1 A very small flame is called a ‘flamelet’ in turbulent
combustion. A flame may consist of many flamelets.
I.S. Wichman / Progress in Energy and Combustion Science 29 (2003) 247–299 251

ignition studies and testing based on the rate of heat release
(RHR), cone calorimetry, and diagnostic methods for
material degradation and combustion. In Section 3 we
examine fire growth, subdivided into sections focused on fire
and flame spread and the influences of external variables
such as ambient temperature and oxygen delivery rate,
among others. In Section 4 we consider fire chemistry. The
principal focus is on products of combustion, with emphasis
on toxins. The subcategories are products of combustion,
toxicity, smoke, retardants, and inhibition. In Section 5 some
practical studies related to transportation fires and com-
monly used combustible materials like polyurethane (PU)
are addressed. A brief conclusion section is provided.
2. Fire initiation
Fire initiation is defined as the onset by ignition of self-
sustained combustion. Thus, gas-phase ignition must
generally occur before fire initiation is possible because
solid-phase combustion of the kind observed in propellants,
for example, seldom occurs in transportation: ignition of a
gas, liquid or solid is therefore usually a gas-phase process.
Combustion, whether intended (as in an engine cylinder)
or unintended (as in an accidental fire) is defined as an
exothermic (heat releasing) chemical reaction between a
fuel and an oxidant. Most combustion reactions in
transportation involve hydrocarbon (HC) fuels with air as
the ordinary oxidant. The HC fuel may be in any phase: gas,
liquid, solid or any combination of the three (e.g. melting
plastics, sprays with liquid droplets and fuel vapors, burning
solids with liquid melt layers underneath gaseous flames).
Some of the possible ignition mechanisms are thermal
radiation, electrical spark, adjacent flame, and conductive
heating. The most common ignition mechanism in trans-
portation is likely the spark plug in IC engines: gas turbine
engines employ a pilot flame. Any or all of these
mechanisms are possible in fire, singly and in combination.
In an unplanned or accidental fire it is often a confluence of
events that may lead to ignition. Quantities employed to
describe ignition include time to ignition, ignition tempera-
ture, ignition heat flux, ignition mass flux of volatiles from a
heated liquid or solid surface.
2.1. Ignition of gases, liquids and solids
2.1.1. Gases
Ignition will occur when a volume of gas reaches a
temperature sufficiently high that self-sustaining exothermic
chemical reaction can prevail against heat losses by
conduction, convection and radiation to the surroundings.
In the simplest case of a stationary, homogeneous, fixed
volume V of gas, ignition is a balance between rate of heat
generation by chemical reaction and rate of heat loss by
conduction or radiation. If the gas temperature is sufficiently
high, the former will exceed the latter, leading to ‘thermal
runaway’ or ignition [11, pp. 284–291, pp. 576–581,12].
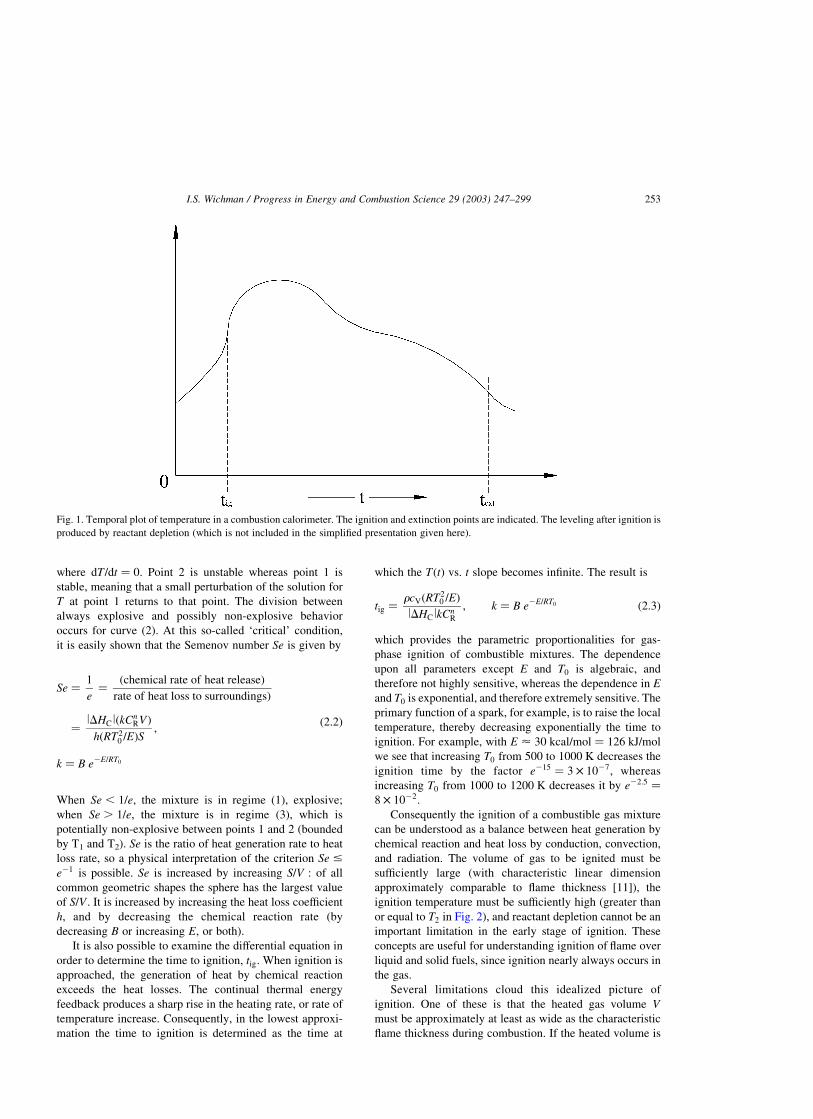
As combustion proceeds, the burning gas volume will
extinguish when the reactant in shortest supply (the
‘limiting’ reactant [12]) is finally consumed. A representa-
tive graph of the ignition event, including eventual
extinction, is shown in Fig. 1. Note the rapid rise of
temperature at ignition. Thermal runaway (a rapid rise
of temperature of the order of 103 8C in a short time interval
of the order of 1 ms) is followed by a temperature plateau of
steady combustion. A simple global or ‘lumped’ equation
illustrating this balance is
rcVVdT
dt¼ _Qgen 2 _Qloss: ð2:1Þ
If the heat generated in the volume V is greater than the
heat lost, the temperature will rise, and vice versa. The
global chemical heat generation term is of the form_Qgen ¼ lDHclVBCn
R expð2E=RTÞ; which increases expo-
nentially with temperature ðTÞ rise and decreases algeb-
raically with decrease of reactant concentration, CR: Here,
n is the order of the chemical reaction, lDHcl is the
chemical heat release per mole of reactant R; B is the pre-
exponential factor (units t21(concentration)2(n 2 1)) and E
is the activation energy for the reaction. The heat loss
term depends algebraically (not exponentially) upon
temperature, and is often represented in the form _Qloss ¼
hSðT 2 T0Þ; where S is the surface area of the volume of
gas and h is a ‘heat-loss coefficient’ [9,11, pp. 579–580,
13]. Such models with lumped parameters are useful for
characterizing the complex phenomena of ignition. The
principal assumption in such lumped models is that
transport is infinitely fast and all gradients of T ;CR are
instantaneously leveled in the region under examination.
Needless to say, such ideal conditions are not met in
ordinary practice, hence Eq. (2.1) is simply a model that is
used to characterize the general features of ignition
problems. The goal is to produce reasonable order-of-
magnitude estimates and functional dependencies.
The analysis of the most simplified version of Eq. (2.1),
with CR ¼ constant (i.e. no reactant depletion!), V ¼
constant; S ¼ constant; h ¼ constant is straightforward.
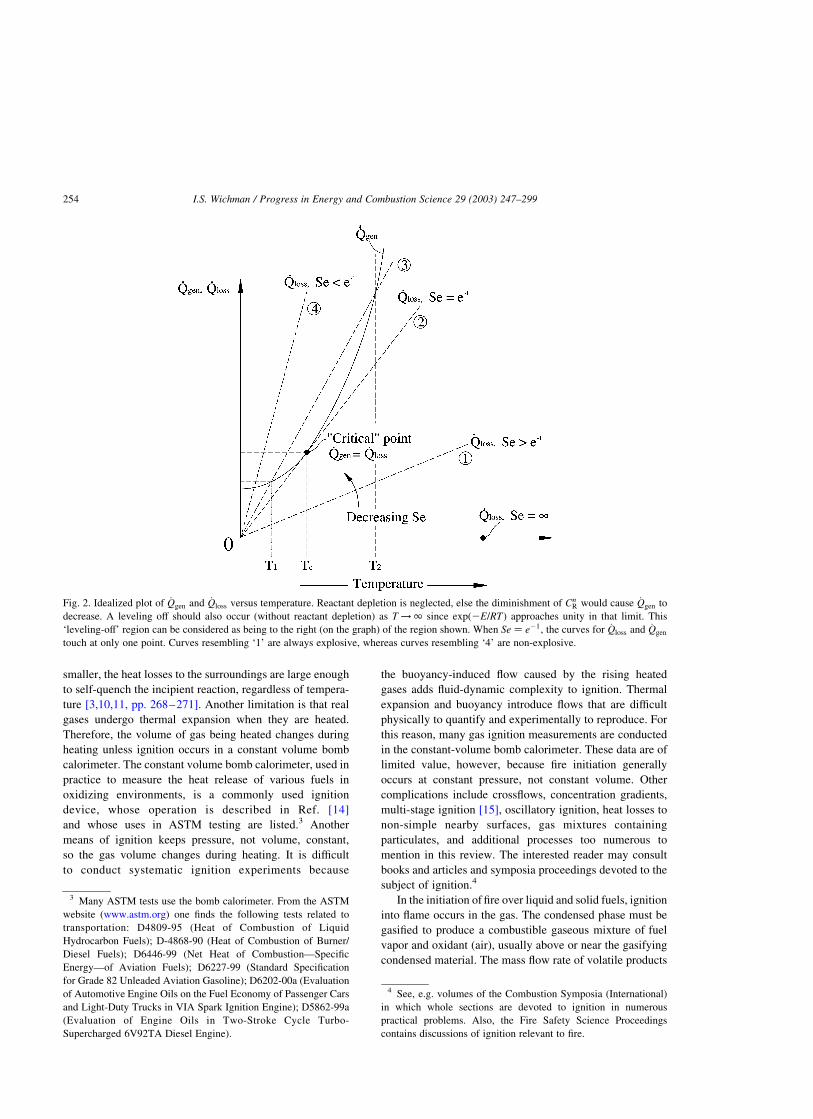
Consider a plot of the two heating terms as functions of
temperature, see Fig. 2. Shown is a single _Qgen and four _Qloss
terms, each with a different hS value. The _Qgen term can also
be changed by varying, for example, lDHcl; CR; B or E: For
low temperatures the term _Qgen is larger than _Qloss:
Depending on the value of h; however, the loss term may
subsequently: (1) never intersect the generation term; (2)
intersect (touch) it at one point; (3) intersect it at two
points.2 Case (1) is always explosive, case (3) is explosive
only when T . T2: The intersections defined by the
locations T1; T2 are the stationary solutions of Eq. (2.1),
2 The real case in which reactant depletion finally diminishes the
generation term is not examined here. The extension can be found in
the literature [13].
I.S. Wichman / Progress in Energy and Combustion Science 29 (2003) 247–299252
where dT =dt ¼ 0: Point 2 is unstable whereas point 1 is
stable, meaning that a small perturbation of the solution for
T at point 1 returns to that point. The division between
always explosive and possibly non-explosive behavior
occurs for curve (2). At this so-called ‘critical’ condition,
it is easily shown that the Semenov number Se is given by
Se ¼1
e¼
ðchemical rate of heat releaseÞ
rate of heat loss to surroundingsÞ
¼lDHClðkCn
RVÞ
hðRT20 =EÞS
;
k ¼ B e2E=RT0
ð2:2Þ
When Se , 1=e; the mixture is in regime (1), explosive;
when Se . 1=e; the mixture is in regime (3), which is
potentially non-explosive between points 1 and 2 (bounded
by T1 and T2). Se is the ratio of heat generation rate to heat
loss rate, so a physical interpretation of the criterion Se #
e21 is possible. Se is increased by increasing S=V : of all
common geometric shapes the sphere has the largest value
of S=V : It is increased by increasing the heat loss coefficient
h; and by decreasing the chemical reaction rate (by
decreasing B or increasing E; or both).
It is also possible to examine the differential equation in
order to determine the time to ignition, tig: When ignition is
approached, the generation of heat by chemical reaction
exceeds the heat losses. The continual thermal energy
feedback produces a sharp rise in the heating rate, or rate of
temperature increase. Consequently, in the lowest approxi-
mation the time to ignition is determined as the time at
which the TðtÞ vs. t slope becomes infinite. The result is
tig ¼rcVðRT2
0 =EÞ
lDHClkCnR
; k ¼ B e2E=RT0 ð2:3Þ
which provides the parametric proportionalities for gas-
phase ignition of combustible mixtures. The dependence
upon all parameters except E and T0 is algebraic, and
therefore not highly sensitive, whereas the dependence in E
and T0 is exponential, and therefore extremely sensitive. The
primary function of a spark, for example, is to raise the local
temperature, thereby decreasing exponentially the time to
ignition. For example, with E < 30 kcal=mol ¼ 126 kJ=mol
we see that increasing T0 from 500 to 1000 K decreases the
ignition time by the factor e215 ¼ 3 £ 1027; whereas
increasing T0 from 1000 to 1200 K decreases it by e22:5 ¼
8 £ 1022:
Consequently the ignition of a combustible gas mixture
can be understood as a balance between heat generation by
chemical reaction and heat loss by conduction, convection,
and radiation. The volume of gas to be ignited must be
sufficiently large (with characteristic linear dimension
approximately comparable to flame thickness [11]), the
ignition temperature must be sufficiently high (greater than
or equal to T2 in Fig. 2), and reactant depletion cannot be an
important limitation in the early stage of ignition. These
concepts are useful for understanding ignition of flame over
liquid and solid fuels, since ignition nearly always occurs in
the gas.
Several limitations cloud this idealized picture of
ignition. One of these is that the heated gas volume V
must be approximately at least as wide as the characteristic
flame thickness during combustion. If the heated volume is
Fig. 1. Temporal plot of temperature in a combustion calorimeter. The ignition and extinction points are indicated. The leveling after ignition is
produced by reactant depletion (which is not included in the simplified presentation given here).
I.S. Wichman / Progress in Energy and Combustion Science 29 (2003) 247–299 253
smaller, the heat losses to the surroundings are large enough
to self-quench the incipient reaction, regardless of tempera-
ture [3,10,11, pp. 268–271]. Another limitation is that real
gases undergo thermal expansion when they are heated.
Therefore, the volume of gas being heated changes during
heating unless ignition occurs in a constant volume bomb
calorimeter. The constant volume bomb calorimeter, used in
practice to measure the heat release of various fuels in
oxidizing environments, is a commonly used ignition
device, whose operation is described in Ref. [14]
and whose uses in ASTM testing are listed.3 Another
means of ignition keeps pressure, not volume, constant,
so the gas volume changes during heating. It is difficult
to conduct systematic ignition experiments because
the buoyancy-induced flow caused by the rising heated
gases adds fluid-dynamic complexity to ignition. Thermal
expansion and buoyancy introduce flows that are difficult
physically to quantify and experimentally to reproduce. For
this reason, many gas ignition measurements are conducted
in the constant-volume bomb calorimeter. These data are of
limited value, however, because fire initiation generally
occurs at constant pressure, not constant volume. Other
complications include crossflows, concentration gradients,
multi-stage ignition [15], oscillatory ignition, heat losses to
non-simple nearby surfaces, gas mixtures containing
particulates, and additional processes too numerous to
mention in this review. The interested reader may consult
books and articles and symposia proceedings devoted to the
subject of ignition.4
In the initiation of fire over liquid and solid fuels, ignition
into flame occurs in the gas. The condensed phase must be
gasified to produce a combustible gaseous mixture of fuel
vapor and oxidant (air), usually above or near the gasifying
condensed material. The mass flow rate of volatile products
Fig. 2. Idealized plot of _Qgen and _Qloss versus temperature. Reactant depletion is neglected, else the diminishment of CnR would cause _Qgen to
decrease. A leveling off should also occur (without reactant depletion) as T !1 since expð2E=RTÞ approaches unity in that limit. This
‘leveling-off’ region can be considered as being to the right (on the graph) of the region shown. When Se ¼ e21; the curves for _Qloss and _Qgen
touch at only one point. Curves resembling ‘1’ are always explosive, whereas curves resembling ‘4’ are non-explosive.
3 Many ASTM tests use the bomb calorimeter. From the ASTM
website (www.astm.org) one finds the following tests related to
transportation: D4809-95 (Heat of Combustion of Liquid
Hydrocarbon Fuels); D-4868-90 (Heat of Combustion of Burner/
Diesel Fuels); D6446-99 (Net Heat of Combustion—Specific
Energy—of Aviation Fuels); D6227-99 (Standard Specification
for Grade 82 Unleaded Aviation Gasoline); D6202-00a (Evaluation
of Automotive Engine Oils on the Fuel Economy of Passenger Cars
and Light-Duty Trucks in VIA Spark Ignition Engine); D5862-99a
(Evaluation of Engine Oils in Two-Stroke Cycle Turbo-
Supercharged 6V92TA Diesel Engine).
4 See, e.g. volumes of the Combustion Symposia (International)
in which whole sections are devoted to ignition in numerous
practical problems. Also, the Fire Safety Science Proceedings
contains discussions of ignition relevant to fire.
I.S. Wichman / Progress in Energy and Combustion Science 29 (2003) 247–299254

of condensed phase pyrolysis or gasification must, in
general, be sufficient to produce what may simplistically
referred to as the lower flammable limit of the fuel/oxidizer
mixture. This mixture can be ignited by an external (pilot)
source. Numerous complications arise, however. Among
these are spatially inhomogeneous temperatures and reac-
tant concentrations, heat losses from gas to condensed
phase, flows in both phases, influences of buoyancy. For all
of these real-world reasons, the ‘lower flammability limit’
referred to previously is usually an unmet and unrealized
idealization, and as such is unable to properly characterize
the actual condition of the gas at ignition. In other words, it
is not the flammability of the mixture itself, rather it is a
combination of conditions met by the mixture and the
surroundings that permits ignition to occur. Self-ignition is
generally not relevant to many applications in fire. Piloted
ignition tests are more common [16,17]. In such ignition
tests, a small ‘pilot’ flame is placed at or near the condensed
phase surface (where the fuel vapor and air are most nearly
well mixed) for a fixed time interval, then it is withdrawn.
Ignition occurs when combustion is sustained without the
pilot flame.
2.1.2. Liquids
In order to ‘ignite a liquid fuel,’ the liquid must be
sufficiently heated for a flammable fuel vapor/air mixture to
form above the liquid phase. As for pure gases, two limits of
flammability or ignitability are employed. These limits are
the lean limit (where the vapor-phase mixture is fuel-lean)
and the rich limit (where the vapor-phase mixture is fuel-
rich). Sustained ignition, or flaming, is attained when the
fuel production rate from the vaporizing liquid fuel can
generate a flame whose heat release rate is large enough to
overcome heat losses to the liquid, the ambient gas and any
nearby walls or surfaces. Three common measures of liquid
fuel flammability form the bases for liquid flammability
tests. These are the closed-cup flash point, the open-cup
flash point and the theoretical flash point. The closed-cup
flash point, which is measured in a closed, uniformly heated
vessel, is the temperature at which the vapor pressure of the
liquid fuel rises to the lower limit of flammability of the fuel
vapor in air (or other oxidizer). The flash point is the fuel
liquid surface temperature at which the fuel vapor above the
liquid will ignite into flame in the presence of a pilot flame.
In the open-cup flash point test the vessel is open to the
ambient atmosphere.
The closed cup flash point test overlooks the important
role of concentration and temperature gradients in the gas
mixture and possibly the liquid fuel. It is a homogeneous
measure, which provides a thermodynamic ignitability
criterion ideally independent of the actual surroundings.
The open-cup flash point test accounts for gas phase
gradients of concentration. These can be altered by buoy-
ancy (natural convection) and forced convection, as well as
the constituents of the prevailing gas mixture (air, diluted
air, oxygen, …) If the pilot flame is very small, ignition can
depend upon pilot location, whether too far from the surface
for significant diffusion of fuel or too close to the surface
(i.e. within the flame quenching distance). The optimum
pilot location may differ for each fuel, for it may depend
upon fuel density, specific heat and conductivity and other
properties. Additionally, ignition depends upon the liquid
fuel in-depth temperature, not merely on the (higher)
temperature of the heated surface layer. Consequently,
inhomogeneity and transient evolution may alter ignitability
in the flash point test [16,17].
2.1.3. Solids
To describe the flammability of specific combustible
materials in the simplest possible burning configuration (the
burning slab) one attempts to answer the question “How
does the heated surface ignite into flame?” Four expla-
nations have been put forth. Two are based on attainment of
a critical surface temperature or a minimum volatile mass
flux into the adjacent gas. The remaining two explanations
require a minimum oxygen concentration and a minimum
external heat flux. Complications arise because these four
criteria are closely related and may depend upon other,
external variables. The surface temperature and mass flux
depend on the oxygen mass fraction and heat flux, and the
surface mass flux may be a function of the surface
temperature, and the influence of the air velocity and
velocity field may need to be quantified. The flow field is
one of the ‘external’ factors whose influence is difficult to
quantify. The incident heat flux is the most primitive
flammability ‘property’. The practical measure of interest is
the time to ignition. Most tests specify the oxygen
concentration and the ‘applied’ heat flux.
Heated gaseous fuels and warm air, mixed to the
correct proportions, can self-ignite. In many fires thermal
radiation from nearby flames, or a nearby layer of hot
product gases, or hot walls in close proximity to the
surface are the primary reasons why as-yet-unburned
materials ignite into flame. This ignition may be
spontaneous (self-ignition) or piloted. The most rigorous
test of flammability exposes the heated sample to a pilot
flame. The two kinds of pilot flames are continuous and
intermittent. Unless a gas flow is present, the continuous
pilot may alter the energetics of the flammability test,
bathing the sample in an additional stream of heat. Hence,
the intermittent pilot is often preferred. The intermittency
interval should be a mere fraction of the characteristic
sample heat-up time, which is measured as the quotient of
the square of the sample thickness and its thermal
diffusivity, theat-up < L2=a; a ¼ l=rc: In the limit as the
intermittency level approaches the sample heat-up time
there really is no intermittency and heating is in fact
continuous. Since a knowledge of the influences of the
heat flux is crucial, the conditions at the rear of the heated
sample (Fig. 3) are important, because the overall energy
balance can be influenced by this region. If the sample is
‘thick’, the conditions at the rear face do not influence
I.S. Wichman / Progress in Energy and Combustion Science 29 (2003) 247–299 255
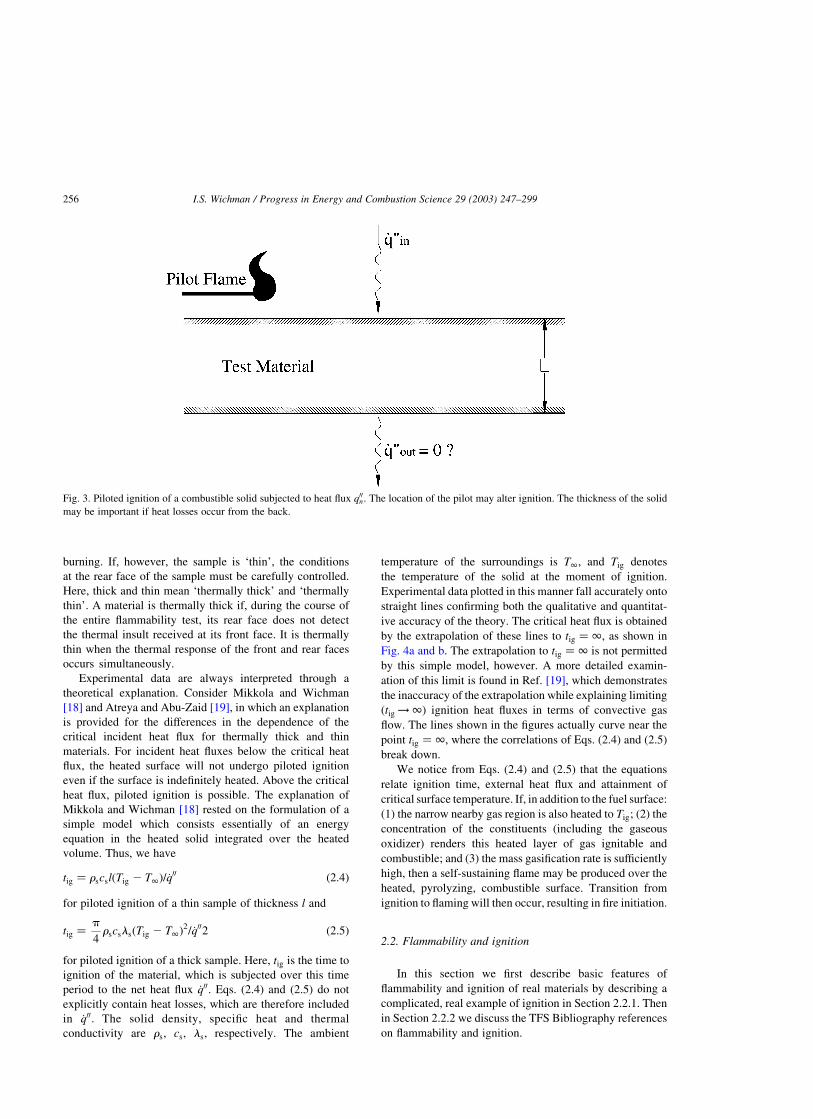
burning. If, however, the sample is ‘thin’, the conditions
at the rear face of the sample must be carefully controlled.
Here, thick and thin mean ‘thermally thick’ and ‘thermally
thin’. A material is thermally thick if, during the course of
the entire flammability test, its rear face does not detect
the thermal insult received at its front face. It is thermally
thin when the thermal response of the front and rear faces
occurs simultaneously.
Experimental data are always interpreted through a
theoretical explanation. Consider Mikkola and Wichman
[18] and Atreya and Abu-Zaid [19], in which an explanation
is provided for the differences in the dependence of the
critical incident heat flux for thermally thick and thin
materials. For incident heat fluxes below the critical heat
flux, the heated surface will not undergo piloted ignition
even if the surface is indefinitely heated. Above the critical
heat flux, piloted ignition is possible. The explanation of
Mikkola and Wichman [18] rested on the formulation of a
simple model which consists essentially of an energy
equation in the heated solid integrated over the heated
volume. Thus, we have
tig ¼ rscslðTig 2 T1Þ=_q00 ð2:4Þ
for piloted ignition of a thin sample of thickness l and
tig ¼p
4rscslsðTig 2 T1Þ
2=_q002 ð2:5Þ
for piloted ignition of a thick sample. Here, tig is the time to
ignition of the material, which is subjected over this time
period to the net heat flux _q00: Eqs. (2.4) and (2.5) do not
explicitly contain heat losses, which are therefore included
in _q00: The solid density, specific heat and thermal
conductivity are rs; cs; ls; respectively. The ambient
temperature of the surroundings is T1; and Tig denotes
the temperature of the solid at the moment of ignition.
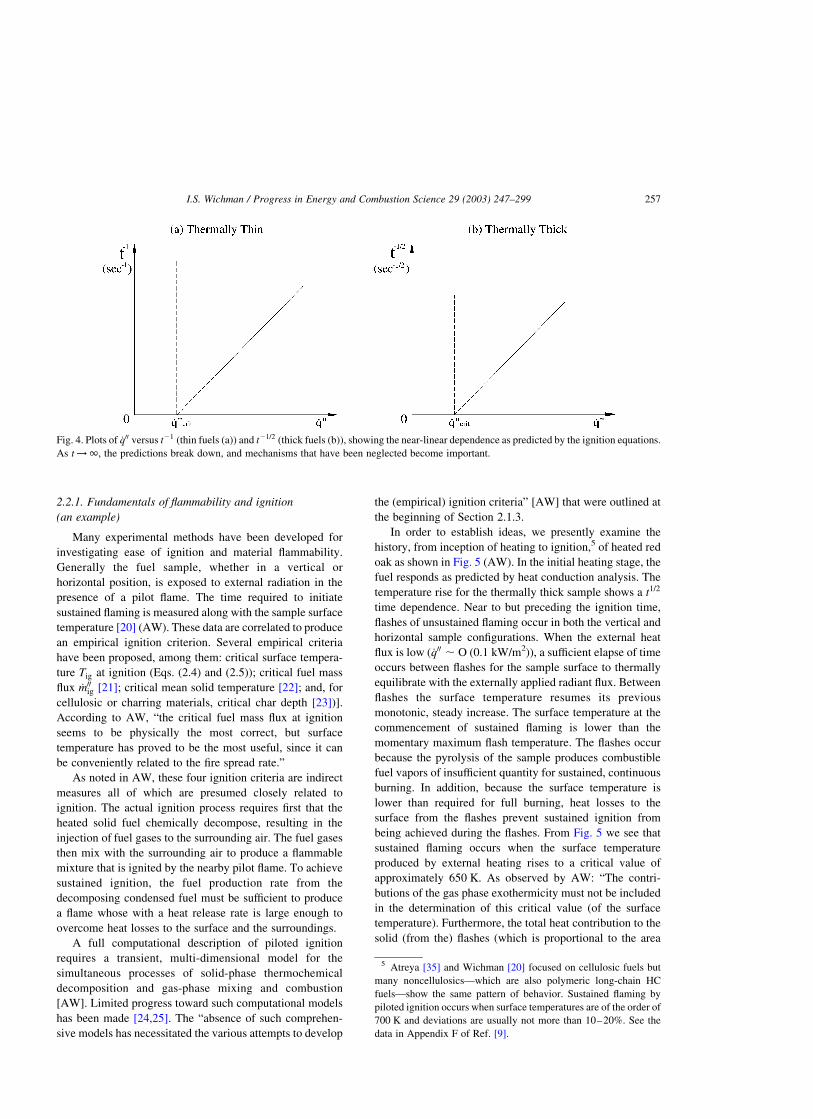
Experimental data plotted in this manner fall accurately onto
straight lines confirming both the qualitative and quantitat-
ive accuracy of the theory. The critical heat flux is obtained
by the extrapolation of these lines to tig ¼ 1; as shown in
Fig. 4a and b. The extrapolation to tig ¼ 1 is not permitted
by this simple model, however. A more detailed examin-
ation of this limit is found in Ref. [19], which demonstrates
the inaccuracy of the extrapolation while explaining limiting
ðtig !1Þ ignition heat fluxes in terms of convective gas
flow. The lines shown in the figures actually curve near the
point tig ¼ 1; where the correlations of Eqs. (2.4) and (2.5)
break down.
We notice from Eqs. (2.4) and (2.5) that the equations
relate ignition time, external heat flux and attainment of
critical surface temperature. If, in addition to the fuel surface:
(1) the narrow nearby gas region is also heated to Tig; (2) the
concentration of the constituents (including the gaseous
oxidizer) renders this heated layer of gas ignitable and
combustible; and (3) the mass gasification rate is sufficiently
high, then a self-sustaining flame may be produced over the
heated, pyrolyzing, combustible surface. Transition from
ignition to flaming will then occur, resulting in fire initiation.
2.2. Flammability and ignition
In this section we first describe basic features of
flammability and ignition of real materials by describing a
complicated, real example of ignition in Section 2.2.1. Then
in Section 2.2.2 we discuss the TFS Bibliography references
on flammability and ignition.
Fig. 3. Piloted ignition of a combustible solid subjected to heat flux q00n: The location of the pilot may alter ignition. The thickness of the solid
may be important if heat losses occur from the back.
I.S. Wichman / Progress in Energy and Combustion Science 29 (2003) 247–299256
2.2.1. Fundamentals of flammability and ignition
(an example)
Many experimental methods have been developed for
investigating ease of ignition and material flammability.
Generally the fuel sample, whether in a vertical or
horizontal position, is exposed to external radiation in the
presence of a pilot flame. The time required to initiate
sustained flaming is measured along with the sample surface
temperature [20] (AW). These data are correlated to produce
an empirical ignition criterion. Several empirical criteria
have been proposed, among them: critical surface tempera-
ture Tig at ignition (Eqs. (2.4) and (2.5)); critical fuel mass
flux _m00ig [21]; critical mean solid temperature [22]; and, for
cellulosic or charring materials, critical char depth [23])].
According to AW, “the critical fuel mass flux at ignition
seems to be physically the most correct, but surface
temperature has proved to be the most useful, since it can
be conveniently related to the fire spread rate.”
As noted in AW, these four ignition criteria are indirect
measures all of which are presumed closely related to
ignition. The actual ignition process requires first that the
heated solid fuel chemically decompose, resulting in the
injection of fuel gases to the surrounding air. The fuel gases
then mix with the surrounding air to produce a flammable
mixture that is ignited by the nearby pilot flame. To achieve
sustained ignition, the fuel production rate from the
decomposing condensed fuel must be sufficient to produce
a flame whose with a heat release rate is large enough to
overcome heat losses to the surface and the surroundings.
A full computational description of piloted ignition
requires a transient, multi-dimensional model for the
simultaneous processes of solid-phase thermochemical
decomposition and gas-phase mixing and combustion
[AW]. Limited progress toward such computational models
has been made [24,25]. The “absence of such comprehen-
sive models has necessitated the various attempts to develop
the (empirical) ignition criteria” [AW] that were outlined at
the beginning of Section 2.1.3.
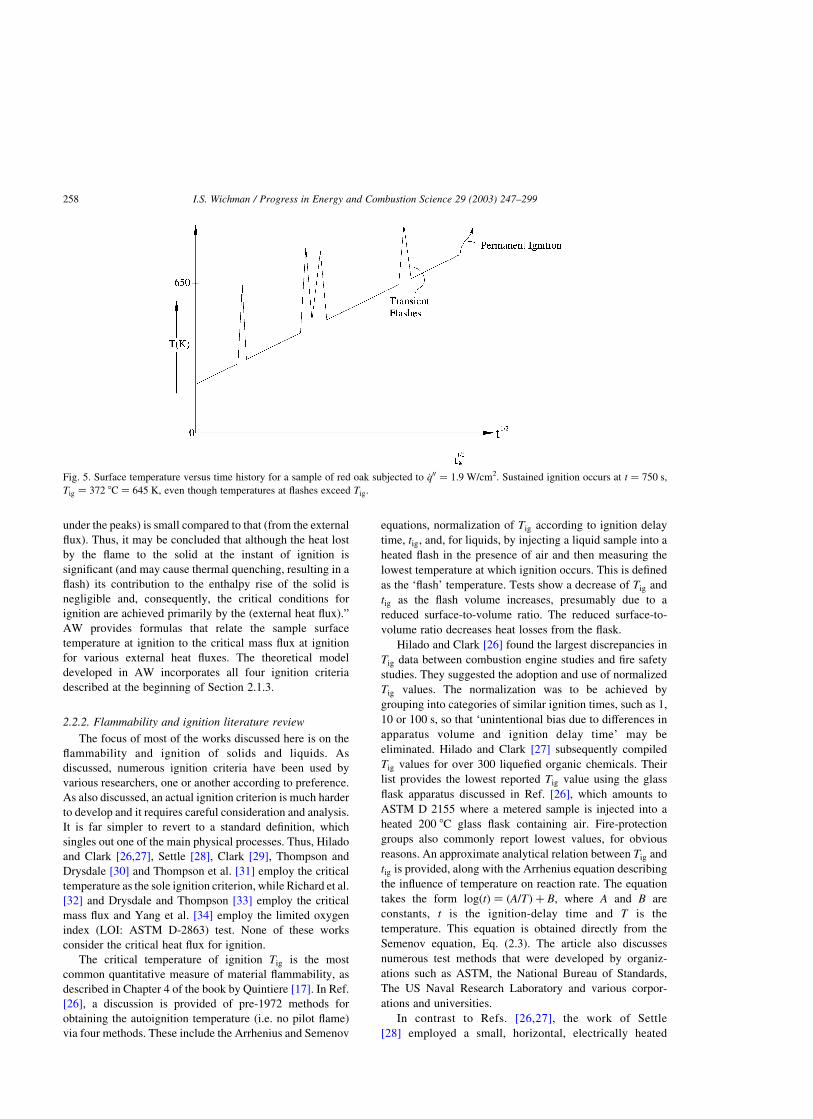
In order to establish ideas, we presently examine the
history, from inception of heating to ignition,5 of heated red
oak as shown in Fig. 5 (AW). In the initial heating stage, the
fuel responds as predicted by heat conduction analysis. The
temperature rise for the thermally thick sample shows a t1=2
time dependence. Near to but preceding the ignition time,
flashes of unsustained flaming occur in both the vertical and
horizontal sample configurations. When the external heat
flux is low (_q00 , O (0.1 kW/m2)), a sufficient elapse of time
occurs between flashes for the sample surface to thermally
equilibrate with the externally applied radiant flux. Between
flashes the surface temperature resumes its previous
monotonic, steady increase. The surface temperature at the
commencement of sustained flaming is lower than the
momentary maximum flash temperature. The flashes occur
because the pyrolysis of the sample produces combustible
fuel vapors of insufficient quantity for sustained, continuous
burning. In addition, because the surface temperature is
lower than required for full burning, heat losses to the
surface from the flashes prevent sustained ignition from
being achieved during the flashes. From Fig. 5 we see that
sustained flaming occurs when the surface temperature
produced by external heating rises to a critical value of
approximately 650 K. As observed by AW: “The contri-
butions of the gas phase exothermicity must not be included
in the determination of this critical value (of the surface
temperature). Furthermore, the total heat contribution to the
solid (from the) flashes (which is proportional to the area
Fig. 4. Plots of _q00 versus t21 (thin fuels (a)) and t21=2 (thick fuels (b)), showing the near-linear dependence as predicted by the ignition equations.
As t !1; the predictions break down, and mechanisms that have been neglected become important.
5 Atreya [35] and Wichman [20] focused on cellulosic fuels but
many noncellulosics—which are also polymeric long-chain HC
fuels—show the same pattern of behavior. Sustained flaming by
piloted ignition occurs when surface temperatures are of the order of
700 K and deviations are usually not more than 10–20%. See the
data in Appendix F of Ref. [9].
I.S. Wichman / Progress in Energy and Combustion Science 29 (2003) 247–299 257
under the peaks) is small compared to that (from the external
flux). Thus, it may be concluded that although the heat lost
by the flame to the solid at the instant of ignition is
significant (and may cause thermal quenching, resulting in a
flash) its contribution to the enthalpy rise of the solid is
negligible and, consequently, the critical conditions for
ignition are achieved primarily by the (external heat flux).”
AW provides formulas that relate the sample surface
temperature at ignition to the critical mass flux at ignition
for various external heat fluxes. The theoretical model
developed in AW incorporates all four ignition criteria
described at the beginning of Section 2.1.3.
2.2.2. Flammability and ignition literature review
The focus of most of the works discussed here is on the
flammability and ignition of solids and liquids. As
discussed, numerous ignition criteria have been used by
various researchers, one or another according to preference.
As also discussed, an actual ignition criterion is much harder
to develop and it requires careful consideration and analysis.
It is far simpler to revert to a standard definition, which
singles out one of the main physical processes. Thus, Hilado
and Clark [26,27], Settle [28], Clark [29], Thompson and
Drysdale [30] and Thompson et al. [31] employ the critical
temperature as the sole ignition criterion, while Richard et al.
[32] and Drysdale and Thompson [33] employ the critical
mass flux and Yang et al. [34] employ the limited oxygen
index (LOI: ASTM D-2863) test. None of these works
consider the critical heat flux for ignition.
The critical temperature of ignition Tig is the most
common quantitative measure of material flammability, as
described in Chapter 4 of the book by Quintiere [17]. In Ref.
[26], a discussion is provided of pre-1972 methods for
obtaining the autoignition temperature (i.e. no pilot flame)
via four methods. These include the Arrhenius and Semenov
equations, normalization of Tig according to ignition delay
time, tig; and, for liquids, by injecting a liquid sample into a
heated flash in the presence of air and then measuring the
lowest temperature at which ignition occurs. This is defined
as the ‘flash’ temperature. Tests show a decrease of Tig and
tig as the flash volume increases, presumably due to a
reduced surface-to-volume ratio. The reduced surface-to-
volume ratio decreases heat losses from the flask.
Hilado and Clark [26] found the largest discrepancies in
Tig data between combustion engine studies and fire safety
studies. They suggested the adoption and use of normalized
Tig values. The normalization was to be achieved by
grouping into categories of similar ignition times, such as 1,
10 or 100 s, so that ‘unintentional bias due to differences in
apparatus volume and ignition delay time’ may be
eliminated. Hilado and Clark [27] subsequently compiled
Tig values for over 300 liquefied organic chemicals. Their
list provides the lowest reported Tig value using the glass
flask apparatus discussed in Ref. [26], which amounts to
ASTM D 2155 where a metered sample is injected into a
heated 200 8C glass flask containing air. Fire-protection
groups also commonly report lowest values, for obvious
reasons. An approximate analytical relation between Tig and
tig is provided, along with the Arrhenius equation describing
the influence of temperature on reaction rate. The equation
takes the form logðtÞ ¼ ðA=TÞ þ B; where A and B are
constants, t is the ignition-delay time and T is the
temperature. This equation is obtained directly from the
Semenov equation, Eq. (2.3). The article also discusses
numerous test methods that were developed by organiz-
ations such as ASTM, the National Bureau of Standards,
The US Naval Research Laboratory and various corpor-
ations and universities.
In contrast to Refs. [26,27], the work of Settle
[28] employed a small, horizontal, electrically heated
Fig. 5. Surface temperature versus time history for a sample of red oak subjected to _q00 ¼ 1:9 W/cm2. Sustained ignition occurs at t ¼ 750 s,
Tig ¼ 372 8C ¼ 645 K, even though temperatures at flashes exceed Tig:
I.S. Wichman / Progress in Energy and Combustion Science 29 (2003) 247–299258
stainless-steel plate to examine Tig for the instantaneous
(non-piloted) ignition of nylon, viscose, acrylic, polypropy-
lene (PP) and wool. The plate temperature was fixed, the
sample and plate touched for 2 s, then the plate was lowered
and its temperature rose by 25 8C until ignition occurred upon
subsequent two-second contact. The maximum temperatures
for non-ignition lay between 650 8C (for nylon, viscose) and
750 8C (for wool). The minimum Tig ranged from 675 8C
(nylon, viscose) to 760 8C (wool). On an absolute tempera-
ture scale, the relative difference between these ignition
temperatures is lower than 10%. Methods of measuring
ignition temperature and autoignitability generally no longer
employ direct contact between test sample and heat source
because of the complexities associated with the direct contact
test configuration. Direct contact is also problematic because
of the complicated nature of the heat and mass transfer
processes that take place when a material is heated: it changes
phase, releases volatile vapors and internally degrades. The
conductivity of the heater plate, the formation of a liquidous
melt, the duration of contact, the accessibility of oxidizer to
the heated surface are difficult to account for, describe,
rationally specify, or calculate, respectively. These or other
phenomena may account for the fact that constant ignition
temperatures are nearly 300 K higher than those measured
using non-contact techniques (see footnote 5).
Subsequent work has emphasized radiant heating, which
mirrors more accurately the situation in many real fires.
Clark [29] studied the ignition of solid polymers using a
radiant heater and a pilot in the form of a periodically
discharged Tesla coil. Samples, whose sizes ranged from
5 £ 5 £ 4 mm3 to 20 £ 20 £ 17 mm3 (last dimension is
depth), included plexiglass (PMMA), polyethylene (PE),
polycarbonate (PC), and red oak. Some of these materials
melt under heating. Some, such as oak, PC, and PE form
char. PMMA was the only material that did neither char nor
self-extinguish following ignition. The smooth-burning
characteristics of PMMA are well known and form the
basis for its common use as a test material [36]. It was not
clear from Ref. [29] why small (25 mm2) samples were
harder to ignite than large (400 mm2) samples, although
edge losses are a possible explanation for this phenomenon.
For small samples the ratio of the edge area to the sample
surface area can become large. In Ref. [30], times to ignition
(tig) and Tig were measured for six thermoplastics using a
conical radiant heater. The plastics were perspex (PX),
finnacryl (FINN), polyacetyl (POM), PE, PP and poly-
styrene (PS). The external radiant flux varied from 10 to
40 kW/m2. The data ‘show too much scatter to reveal any
pronounced trend’ except for PMMA, ‘which showed a
decrease in Tig at the lowest heat flux used.’ Below 20 mm2
surface area, however, Tig became a function of the
irradiated area. The sample surface temperature was
monitored using thermocouples. PS had the highest Tig of
370 8C (643 K) at a heat flux of 19 kW/m2. The time to
ignition at this heat flux was little over a minute, tig ¼ 67 s.
The authors found between PX and POM that the latter had
the lower Tig but the higher tig: This seeming paradox was
explained though the influence of higher thermal inertia
(product of density, specific heat and thermal conductivity,
rcl; see Eq. (2.5)) of POM. The results for tig were much
more sensitive to the flux level, leading to the call for a
‘better understanding of the interrelationship between the
spectral characteristics of the source and the absorption
characteristics of the target polymer.’
A similar experiment was carried out in Ref. [31],
although this latter study employs an International Stan-
dards Organization (ISO) apparatus. The ignition was
piloted. It was found that significant temperature increases
of the heated sample surface up to 15 K occurred following
pilot flame applications near Tig: As the external heat flux
increased, the value of tig decreased. The two test heat fluxes
used were approximately 12 kW/m2 (ranging from 10 to
15 kW/m2) to 50 kW/m2. The tig values averaged approxi-
mately 1400 s at the former and 44 s for the latter heat flux.
An increase of the external heat flux by a factor of four
decreased the time to ignition by a factor of 30. The authors
concluded that the critical surface temperature for piloted
ignition was a ‘suitable for use in engineering predictions of
piloted ignition of solids’ because qualitative and quanti-
tative agreement was obtained from the ISO tests and tests
using another apparatus (the EU test). Interestingly, the
authors also concluded that the spectral radiant properties of
the solids are important in determining the ignition
behavior: for the same incident heat flux, for example,
‘radiation from the hot layer in a compartment fire will
cause ignition significantly faster than from a diffusion
flame.’
One of the measures of material flammability is critical
mass flux at ignition _m00ig; see Section 2.1.3. An advantage
of this measure is high accuracy using precise weight-
measurement techniques such as TGA [20]. As discussed
in Section 2.1.3, Ref. 3 of Ref. [20] and in Refs. [26–31]
the surface temperature and the heat flux are also
important even though most of these studies use only
one criterion, namely the temperature. The study of Ref.
[33], though focused primarily on critical mass fluxes at
flash point [17] for radiant fluxes between 13 and 33 kW/
m2, demonstrated that convective heat transfer at the
surface must be included in a complete ignition analysis.
Recall from Ref. [19] that convection was especially
important as the external flux decreased and the time to
ignition increased. Indicative of the fact that they believed
mass flux cannot be the sole criterion for sustained
ignition, Drysdale and Thompson [33] examined flame-
retarded PP and PS, finding the following: (1) flame
retarded PP and PS could only be ignited for heat fluxes
between 25 and 33 kW/m2 (unlike the non-retarded PP
and PS, which could be ignited between 3 and 25 kW/m2).
(2) The critical mass flux at ignition decreased as the
radiant intensity decreased. (3) The fire point appeared to
be sensitive to surface boundary conditions and sample
configuration.
I.S. Wichman / Progress in Energy and Combustion Science 29 (2003) 247–299 259

The results of Drysdale and Thompson [33] show that
flammability is dependent on the chemical nature of the
evolved decomposition gases, and that flammability can be
altered with chemical additives or suppressants. Similar
conclusions are made by Nyden et al. [37] and Nyden and
Brown [38]. These works examined the flammability of
honeycomb composites, which are used in interior cabin
compartments of commercial aircraft. The phenol–formal-
dehyde resin was found to alter flammability. The authors
examined many resins, which differed in relative amounts of
phenol and formaldehyde. The flammabilities of resins
synthesized in excess phenol were lower than those
synthesized in excess formaldehyde.
Practical materials whose flammability has been scruti-
nized include various fluids [39,40] and electrical cables
[41,42]. In Ref. [39] a general theory is developed for the
prediction of closed-cup flash points of mixtures of
flammable and non-flammable liquids. Experimental values
of flash points of pure liquids are available. For example,
Ref. [40] contains data for 22 physical properties of
automatic transmission fluid (ATF) including composition,
viscosity, thermal conductivity, volumetric thermal expan-
sion, heat capacity, specific gravity, density, bulk modulus,
boiling range, gas solubility, shear resistance, surface
tension, electrical resistivity, heat of vaporization, flash
point and fire point. As described in Section 2.1.2, the flash
point is the lowest liquid surface temperature at which the
fuel vapor will ignite in air in the presence of an open flame.
For typical ATFs, the flash point is approximately 200 8C.
The fire point, at which sustained combustion occurred, was
approximately 210 8C. In Ref. [39], the flammability of two
types of mixtures was studied. In the first, all components
were separately flammable. In the second, some components
were non-flammable. These non-flammable additives sup-
press flammability through vapor-phase inhibition. Thus,
consistent with results for solid flammability [33,37,38],
combustible fluid flammability can be altered by additives.
The flammability of materials used for the insulation and
sheathing of electrical cables was studied by Matheson et al.
[41] and Tewarson et al. [42]. In the former, various fire
retardant (FR) and low smoke and fume (LSF) materials
were examined. The fire parameters considered were
flammability temperature, oxygen index, and hydrogen
chloride (HCL) emission. It was found that the addition of
fire retardant (e.g. fire-retarded PVC) could produce higher
HCL emissions. The work of Tewarson et al. [42] examined
31 wire and cable samples, which were ranked according to
seven parameters, among them ignition and flame spread,
electrical failure, fire product corrosivity, generation of fuel
vapors, heat, gaseous compounds and light obscuration.
The several conclusions of this subsection include: Tig
varies relatively little across tests and heating methods,
generally under 10% for absolute temperatures, making it a
suitable ignition criterion for solid ignition; tig is a sensitive
quantity, varying across orders of magnitude according to
Eq. (2.3); radiant spectral properties of the materials are
important and dictate that the levels of absorption may be
very different depending on the type of emitter; ignition also
depends on the type and nature of the emitted pyrolysis and
decomposition gases, and ignitability can thus be altered by
the addition of certain additives and suppressants; the
flammability of many commonly used liquids has been
thoroughly studied, showing that ignition temperatures are
usually lower (around 570 K) than for solids (around
700 K); the formation of a vapor phase is an important
aspect of ignition, both for liquids and solids, and means are
available for suppressing both the amount of vapor formed
and its chemical reactivity; somewhat negatively, the
addition of fire retardant could in some cases produce
increased HCl emission levels. Correlations of the data are
extremely helpful, and for use correlations given in the form
logðtÞ ¼ ðA=TÞ þ B appear to be useful for engineering
practice, although as shown in Ref. [20] the actual
correlations are much more detailed and sophisticated.
Insufficient knowledge of detailed surface physics prevents
replacing empirical engineering correlations with numerical
model simulations, although key parameters appear to be
radiant absorption, degradation chemistry, emission of
degradation products into the surrounding gas, and the
properties of the vapor molecules, including the collective
radiant transfer properties.
2.3. Rate of heat release (RHR): the cone calorimeter
and other diagnostic devices
In this section we first describe the principal features of
devices used to measure material flammability and ignition.
According to Babrauskas [43], two principal testing
strategies are deployed: The first creates a test exposure,
usually of a small scale, that directly mimics the expected
actual exposure. The second is a controlled but simple
exposure condition that can be modeled and described
scientifically. A substantially lower emphasis is placed in
the latter on simulating actual burning conditions than in the
former, hence the controlled exposures usually now involve
radiant heat sources, which can be accurately monitored,
unlike convective heating. Principal focus is placed on the
cone calorimeter. Then in Section 2.3.2 the various uses of
the cone calorimeter are described in some detail.
2.3.1. Background and principles of the cone calorimeter
As it became ever more necessary to quantify the
flammability of materials, methods were devised that could
measure flammability parameters. These tests include the
oxygen index (OI) test, pyrolysis and thermal analysis, and
gas analysis, as described in Ref. [44]. In the OI test [ASTM
D2863-77] the material being tested is burned in a ‘candle-
like flame and the oxygen concentration of the ambient air is
reduced to the limit where the flame just (barely) exists.’
The measured oxygen concentration is the OI of the tested
material. According to Elomaa et al. [44], the “benefits of
the method are… simplicity, ease of execution, small
I.S. Wichman / Progress in Energy and Combustion Science 29 (2003) 247–299260

demand of material, and good reproducibility.” The
principal use of the OI test is as a research and development
tool for new flame-retardant fabrics and plastics, chiefly
because the test is not considered acceptable for fire hazard
assessment. The ASTM standard states: “…this test should
not be used for the description or appraisal of the fire hazard
of materials, products or systems under actual fire
conditions” [44]. Pyrolysis and thermal analysis involves
the rapid heating of small, presumably homogeneous,
material samples to a specified ‘pyrolysis’ temperature,
then the application of various chemical and other
diagnostic techniques to examine their pyrolysis products,
rate of weight loss, decomposition kinetics, and other
quantities of technical interest. An inherent limitation of this
method is the impossibility of achieving the test temperature
without proceeding through all lower temperatures at a
certain rate: this rate can influence subsequent measure-
ments, as examination of the equations of decomposition
kinetics clearly demonstrates [45]. As stated in Ref. [44], the
pyrolysis of polymers has been ‘often’ studied by thermo-
analytical methods, the most common being thermogravi-
metry (TG), which is “…(routinely) used for determination
of the (polymer) degradation temperatures and the for-
mations of char.” Numerous methods are used for analyzing
the gaseous by-products of combustion and pyrolysis. Also
the report ISO/TR 9122-3 [46] provides “suitable methods
for the analysis of gases and vapors in fire effluents.” The
principal method for numerous gases (CO, CO2, O2, CN,
HCl, NOx) is gas chromatography. Other methods (FTIR:
Fourier Transform infrared), GC–MS (gas chromatog-
raphy–mass spectrometry) are also discussed in Ref. [44]
including numerous references to their particular uses.
Experimental diagnostics in ignition and flammability
testing have increasingly placed principal emphasis on rate
of heat release (RHR). The following quotation from
Babrauskas and Peacock [47] is therefore apt: “Perhaps
the most important quantity related to fire is the energy
release rate (because it) represents the size of the fire and its
potential for damage.” It may be defined as _Q ¼ _m00A Dhc
where _m00 is the mass flux from the burning surface, A is its
surface area and Dhc is the ‘effective heat of combustion’
per unit mass [17]. The function _Q is also commonly
referred to as RHR.
The importance of RHR in fire is discussed in Refs. [47,
48]. The former authors explain in detail why RHR
characterizes the flammability and fire hazard of combus-
tible materials. Many years before, Tewarson [48] had
pointed out that although fire deaths are primarily caused by
emitted toxic gases, RHR is the best predictor of the
subsequent fire hazard. The logical ordering of fire hazard is
thus a local ignition, with a RHR sufficient to sustain fire,
which, in turn, produces toxic gases. Without fire sustenance
by RHR, no toxins are produced. Additionally, Tewarson
[48] provided a definition of the heat of combustion. The
complete (or theoretical) heat of combustion is an inaccurate
measure of Dhc because complete combustion is generally
not attained in real fires. Tewarson [48] therefore discusses
means for defining realistic estimates of heats of combus-
tion. Quintiere [17] provides a concise, precise means for
determining RHR. Noting that the oxygen consumption
calorimeter ‘works on the principle that the heat of
combustion per unit mass of oxygen consumed is nearly a
constant (13 kJ/g) for a wide range of ordinary (hydro-
carbon) fuel compounds,’ a simple calculation of RHR by
the principle of oxygen consumption proceeds as follows.
The object being burned is placed in a flow-through
chamber. The incoming air has oxygen mass fraction
0.233, the exhaust has oxygen mass fraction YO2ex ,
0:233: The incoming mass flow rate is _min; the exiting
mass flow rate is _mex: The oxygen consumed in the fire is
(0:233 _min 2 YO2ex _mex:). Multiplication by the constant
13 kJ/g heat release per unit mass of oxygen gives the
RHR. Shown in Table 1 are values of the heats of
combustion per unit mass of oxygen consumed for
numerous pure hydrocarbon fuels. RHR can be measured
during the course of a flammability test. Typically, it is
initially low, then rapidly rises because of fire growth and
spread, then slowly decays as fire burnout is approached.
Although flame spread is a complicated dynamic process
involving flow and transport, limited attempts have been
made to relate ignition time and fire RHR to the actual flame
spread rate over a surface [49]. This subject deserves much
more attention than it has received since it asks a
fundamental question: to what degree can one-
dimensional overall measurements be applied to a transient,
Table 1
The heat release per kilogram of O2 is calculated from the
stoichiometric reaction CnHm þ aO2 ! nCO2 þ (m/2)H2O. The
O-atom balance gives a ¼ n þ m/4 as the entry in the fourth
column. The quantity in the fifth column is obtained from the
quantity in the third column after multiplying it by 1023 MJ/KJ and
then dividing by 32akg O2/kmole fuel. Note the near constancy of
the heat release normalized per kg of oxidiser, and note also that
certain unsaturated hydrocarbons can deviate, though not by much
more than ^ 15% from the average value of , 14 MJ/kg O2
Hydro-
carbon
fuel
Chemical
symbol
Heat of
combustion
per mole
of fuel |DHc|kj/
kmole fuel)
Stoichio-
metric
coeffi-
cient a
Heat of
combustion
per kg of
O2/DHCOx
(MJ/kg O2)
Methane CH4 890,360 2 13.91
Ethane C2H6 1,559,900 3.5 13.93
n-Butane C4H10 2,877,100 6.5 13.93
n-Hexane C6H14 4,194,800 9.5 13.80
n-Octane C8H18 5,512,200 12.5 13.78
Toluene C7H8 3,947,900 9 13.61
Benzene C6H6 3,301,500 7.5 13.76
Acetylene C2H2 1,299,600 2.5 16.25
Ethylene C2H4 1,410,970 3 14.70
Propylene C3H6 2,058,500 4.5 14.30
I.S. Wichman / Progress in Energy and Combustion Science 29 (2003) 247–299 261

three-dimensional process? This question has lain in the
background of nearly all investigations using the cone
calorimeter, and led in the late 1970s and early 1980s to the
rapid development of devices for measuring material
flammability for evaluating fire hazard. Among them was
the furniture calorimeter [50,51]. In the former article, the
influences of fabric type, padding type (cotton, PU foam,
etc.) and frame types were assessed. The advantages of
furniture calorimeter testing over conventional room-fire
testing are primarily a lesser ability to specify fire growth in
a vague, undefined region (such as a ‘room’) as compared
with a well-defined, single object (such a piece of furniture,
whose flammability properties can be nominally measured).
In the latter article, the analysis of a large number of tests
demonstrated that for most specimens a good approximation
to the graph of RHR as function of time is a suitably drawn
triangle. Methods for generating triangular RHR vs. time
curves, which are used for fire protection engineering hazard
determinations, were developed.
The furniture calorimeter, however, suffered from the
same vagueness with respect to individual items of
furniture as did the room fire with respect its contents.
This ambiguity resulted in the subsequent development of
the individual material calorimeter, which measured the
flammability of a single, individual, isolated substance.
Although numerous calorimeters were designed, including
models from France (the epiradiateur) and other countries
of Europe, the Ohio State University (OSU) calorimeter
(ASTM E906), and the cone calorimeter (ASTM E 1354
and ISO 5660, among other listings), only the latter has
become a universally accepted testing device.
The cone calorimeter, developed by Babrauskas [4,5]
consists of a cone-shaped array of electrically heated
radiant coils that impose a known heat flux up to
approximately 100 kW/m2 on a small sample of material
in the vicinity of a nearby pilot flame. The apparatus is
usually horizontal, enabling the capture, by the heater
cone and attached flow pipe of the decomposition off-
gases, see Fig. 6. Nevertheless, the cone calorimeter can
also be oriented vertically. The cone calorimeter can
measure [52] rate of heat release, peak rate of heat
release, time to peak rate of heat release, total heat
released after a specified time interval, time to ignition,
smoke production rate, chemical composition of product
gases (and toxic gas production), mass loss rate during
burning, as well as time to ignition, heat flux at ignition
and all other parameters related to fire initiation
discussed in Section 2.1.3. Certain conditions are
encountered in practice that are difficult for the cone
calorimeter and other diagnostic devices to examine.
Among these are ignition and flammability for weakly
reacting materials, conditions of low or fluctuating
Fig. 6. Diagram of the cone calorimeter showing the heater cone, the heated horizontal sample, the gas collection system and the load cell used
to measure sample weight.
I.S. Wichman / Progress in Energy and Combustion Science 29 (2003) 247–299262

oxygen concentration, and variable material thickness and
composition. Thermally thin materials also appear to be
limited in the cone calorimeter, unless means can be
developed to eliminate the heat losses associated with the
sample holder. Under some of these conditions the
materials may gasify vigorously, but ignition cannot be
sustained. Flammability is also altered where the absence
of buoyant flow produces conditions favorable or
unfavorable to ignition [53]. In other words, in cases
where buoyant flow is absent (as in outer space) the cone
calorimeter may provide inaccurate measures of flamm-
ability, requiring the development of other more
representative test methods that account for the influences
of buoyancy more systematically. Despite these qualifiers,
however, according to Babrauskas [43], the cone
calorimeter is currently ‘the most common apparatus
used in laboratories worldwide for measuring the radiant
ignitability of materials.’
2.3.2. Practical uses of the cone calorimeter and other fire
diagnostic devices
The cone calorimeter ‘was inspired by the earlier…ISO
5657 test,’ [43] which was developed around 1970, and
which differed from the cone calorimeter in certain minor
details, such as sample size and use of a ‘dipping duck’
pilot ignition process, in which a propane gas flame is
periodically lowered every 4 s into the vicinity of the
sample surface. The similarities and differences between
the two devices are presented in tabular form in Ref. [43].
According to the latter, the differences in ignition data
‘are no more than the scatter of the data.’ The cone
calorimeter has been described as ‘The most versatile
instrument available for small-scale fire hazard assessment
under conditions of uniform, adjustable irradiance
levels…which allows the simultaneous determination of
a number of parameters and utilizes the oxygen consump-
tion principle’ [54].
In its development stages, the cone calorimeter was quite
extensively compared with other bench-scale test methods,
and also with some large-scale tests. Babrauskas [55]
studied low-flammability wall lining materials representa-
tive of aircraft cabin walls. The cone calorimeter, the FMRC
flammability apparatus and the flame height apparatus gave
similar results. The OSU calorimeter results were typically
half these three methods. Babrauskas [55] examined
techniques for predicting full-scale performance from
bench-scale tests. Babrauskas et al. [56] addressed the
issues of sample preparation and mounting. It is believed
that edge flow and heat transfer produced by sample edge
frames may alter flammability measurements. Thus, one
phenomenon that the cone calorimeter wishes to avoid,
namely two-dimensional lateral cross-sample flow, never-
theless apparently enters into consideration. Babrauskas
et al. [56] showed that insulated edge frames produce
measurements that are more consistent and ‘slightly closer
to expected true values.’ For routine fire testing, the authors
do not advocate the use of an edge frame unless the sample
presents ‘special difficulties, such as due to intumescence.’
When an edge frame is used (e.g. a steel frame), the effective
exposure area is reduced, providing near-constant con-
ditions away from the frame. In other words, the uniformly
heated area for flammability testing is smaller with the edge
frame.
The cone calorimeter has been used to examine many
kinds of materials. These include fabrics and PU foams
[57–61,63], polymeric materials including PVCs, PE, PP,
acrylonitrile–butadiene–styrene and polyphenylene oxide/
PS, polyetheimide, polyethersulfone, polycarbonate, poly-
ether ethylketone, polyphenyleneoxide, high impact PS,
polybutylene terephthalate, and PVC [62], polymer compo-
site materials containing combustible reinforcing fibers and
combustible matrix resins, e.g. extended-chain PE, and
aramid fiber-reinforced composites containing epoxy (EP),
vinylester (VE) and phenolic (PH) matrix resins [54]. In
Refs. [57,59] the influences of melamine content on PU
foam flammability were quantified. The peak rate of heat
release (PRHR) of the PU foam was significantly reduced
with the melanine additive [57], with an average reduction
of 37 kW/m2 for every 10 pphp. Melamine addition greatly
decreased the rate of burning and the smoke yield.
Chlorinated phosphate fire retardant produced results
similar to melamine in RHR reduction, but was opposite
in smoke yield. Much of the information is presented in
convenient graphical form. Results were obtained by
Vanspeybroeck et al. [59] for three commercial PU foams
and cotton, polyester and polypropylene. The three foams
tested were (1) not modified, (2) melamine filled, (3) highly
melamine filled. Tests measured the effective heat of
combustion (EHOC), total heat release (THR), time to
ignition (TTI), PRHR, and time to peak rate of heat release
(TPRHR). The sample dimensions were 10 £ 10 £ 2.5 cm3,
the exposure heat flux was 25 kW/m2. Vanspeybroeck et al.
[63] measured the relative contributions of fabric and foam
to fire-hazard parameters. The EHOC of the individual
foams and fabrics was determined with a flux of 25 kW/m2.
The high-resilience (HR) PU foam had the highest EHOC.
PP had the highest EHOC of the fabrics tested. As shown in
Ref. [58], measurements of large heat release were
associated with large sample densities. The work of
Vanspeybroeck et al. [60] adds comparisons of cone
calorimeter results with those of the Nordtest NT 032
calorimeter (NT032). The empirical trends of the two
devices were similar, but quantitative correlations were not
developed in this work. These investigators concluded that
post-ignition performance of the materials was determined
mostly by the fabric, whereas ignition characteristics were
determined by foam and fabric. This appears to make sense
because during ignition, which is a go/no-go event, a limit
condition is encountered, in which heat losses often play a
major role. Thus, the interior to the fabric, or the ‘backing’
or ‘substrate’ represented by the foam under the fabric
appears to play a large role in the ignition regime. Once open
I.S. Wichman / Progress in Energy and Combustion Science 29 (2003) 247–299 263
burning is achieved, the importance of the backing wanes by
comparison.
Costa et al. [61] compare the combustion behavior of
some polymeric materials in the cone calorimeter with
behaviors in some ‘traditional’ tests that have been widely
used to assess fire retardancy, such as the oxygen index (OI),
glow wire, rate of combustion and an ASTM D 1929
ignition test. These authors believe that the evaluation of
relative material fire hazard can vary greatly with the
evaluation method, but that the cone calorimeter has ‘high
potential’ for providing mechanistic insight into the
combustion of organic materials.
Measurements for the composite materials of Brown
et al. [54] showed that the combination of two combustible
components in a single composite material produced a
complicated RHR behavior. The maximum RHR for the
individual components may not be representative of the
RHR for the entire composite. For most tests TTI appeared
to correlate with the component having the higher
ignitability. Phenolic composites had superior fire perform-
ance, as demonstrated by their propensity for char
formation. The authors measured TTI, RHR, time to reach
maximum RHR, Dhc; smoke density, CO and CO2, and
sample mass loss. The smoke density ‘is measured by the
decrease in transmitted light intensity of a helium–neon
laser beam photometer, and expressed in terms of a specific
extinction area (SEA) with units m2 kg21.’ It was observed
that in many case the RHR does not diminish to zero
asymptotically but that the asymptote after long heating
times is constant. This behavior coincided with a lower rate
of mass loss and an increase in Dhc; ‘which is consistent
with char formation in the latter stages of combustion.’ The
authors also state that ‘it is significant that smoke is
observed (for the Aramid/Epoxy composite) well before
ignition’ indicating that the release of volatile vapors into
the gas phase is an important preliminary step. They also
state that when the charring regime is attained for the
phenolic and aramid components, the SEA decreases to
zero, i.e. the smoke vanishes. In this case, volatiles are
sealed off from the gas. Finally, the authors conclude that a
RHR averaged over the first 180 s is ‘the most appropriate
variable for predicting full-scale fire properties’ because the
overall average RHR has the disadvantage of an arbitrary
choice of an endpoint for data collection. These obser-
vations are singled out for this particular study because of
their apparent universality and because they were made in
the context of a rigorous examination of a specific,
increasingly important class of materials, namely compo-
sites. Additional bench-scale cone calorimeter tests on
composites were conducted by Brown et al. [64].
Cleary and Quintiere [65] attempted to ‘more completely
characterize foamed plastic flammability’ by subjecting 10
foamed plastics to cone calorimeter and Lateral Ignition and
Flame Spread Tests (LIFT). The flammability parameters
obtained from these apparatuses describe the dynamic flame
spread properties found from the LIFT tests in addition to
the static parameters of the cone calorimeter. The word
‘dynamic’ is interpreted here as implying a transient
spreading process, in which previously unburned material
is heated and pyrolyzed and consumed by the flame,
whereas ‘static’ implies no such spread of flame to unburned
surface. To a laboratory observer, little or no change is
evident in the static test, whereas significant visible changes
are evident in the ‘dynamic’ test.
A large number of cone calorimeter tests was conducted
on 28 materials classified as thermoplastics, thermosets,
textiles and cellulosics [66]. The results showed a
dependence of ignition on method of exposure to the heat
source, and on the thickness of the samples. The authors
pointed out that mean and peak values alone did not fully
represent material RHR. As discussed in Ref. [17], the width
of the RHR curves, or more accurately, the area under the
RHR curves, is a measure of the quantity of fuel burned. The
authors also described various smoke tests using the SEA
method proposed by in theoretical terms by Babrauskas and
Mulholland [67]. The actual development of quantitative
means for making smoke production measurements and
species evolution measurements using the cone calorimeter
is described in Ref. [68]. The smoke measurements are
made by the SEA method described previously. In order to
measure gas chemical species, gas samples are extracted
from the exhaust line. Smoke production measurements and
toxic species production measurements are needed for
toxicity determinations to compare fire-retarded and non-
retarded materials [58–60,63]. As pointed out by Scuda-
more et al. [66], however, in order to use the cone
calorimeter for toxicity measurements, variation of the
oxygen concentration in the atmosphere and the ventilation
stream is necessary.
A fundamental discussion of the use of the cone
calorimeter in conjunction with other diagnostic methods
(TGA and DSC) for studying charring on ethylene-vinyl-
acetate (EVA) copolymers and polyethylenes (HDPE and
LDPE) both with and without phosphorous-containing
additives was carried out by Wang et al. [69]. The cone
calorimeter was used to determine RHR. Oxygen was found
to play an important role in material thermal degradation in
agreement with previous OI testing.
The cone calorimeter has proven itself to be an extremely
useful device for measuring flammability properties of a
wide class of materials. It provides many important
indicators of fire hazard, perhaps none more important
than RHR. Nevertheless, parameters such as PRHR,
TPRHR, TTI, SEA, Dhc; smoke density, CO and CO2
species mass fractions, and sample mass loss and mass loss
rate are also important indicators of expected fire perform-
ance in an ignition-like mode and in full scale (non-spread)
burning. Direct evidence for this assertion is found in the
large number of articles in which these quantities are
measured, categorized, compared, and tabulated. Indirect
evidence, perhaps even more compelling, is found in the fact
that the cone calorimeter is almost universally used in fire
I.S. Wichman / Progress in Energy and Combustion Science 29 (2003) 247–299264

hazard assessment tests in any industry that produces
materials susceptible to or used in fields where fire safety
is a concern: in short, it has become an industry standard.
Certain limitations to the cone calorimeter, however, cannot
be ignored. One of these is the difficulty of assessing the
behavior of thermally thin materials, as discussed by
Vanspeybroeck et al. [60], where it was determined for
fabrics that post-ignition performance was determined
mostly by the fabric, whereas ignition characteristics are
determined by the supporting foam and fabric. This
indicates that for thermally thin materials it is difficult to
separate the influences of the material and its ‘backing’ or
‘substrate.’ Another difficulty, briefly mentioned in this
section, is that various important properties that are needed
to predict flame spread rates cannot be obtained from a cone
calorimeter type apparatus [70,71]. In order to predict
spread rates, and thus evaluate what in many cases is an
important fire hazard variable, different tests are needed.
Among these flame spread tests are the LIFT apparatus of
Quintiere [7], the Fire Tunnel apparatus of Wichman et al.
[72], and the Downward Spread Test of Delichatsios [71,
73]. As discussed in Ref. [71], important limitations are
found in the LIFT, which the other two devices largely
avoid.
3. Fire spread
The objective of fire-spread studies is to address the
question ‘How fast does the flame (or fire) spread over the
sample surface?’ The rate of fire spread has obvious fire
safety implications, and (as discussed) it cannot be
measured through static tests such as the cone calorimeter.
Sections 3.1 and 3.2 describe the principles of fire spread
over liquid and solid fuels, respectively. Section 3.3
discusses the various applications of these principles in
transportation.
3.1. Fire spread over liquid fuels
Spread over liquids in fire safety applications can be
preceded by a fuel spill, hence the liquid layer over
which flame spreads may be thin. Regardless whether or
not the liquid fuel is thin or thick, however, during flame
spread a gradient of surface tension is formed at the
surface given by ds=dx ¼ ðds=dTÞðdT =dxÞ ¼ g dT=dx;
where g ¼ ds=dT is the surface tension temperature
coefficient. In front of the advancing flame, the
temperature gradient, dT=dx; is negative. Similarly, as
temperature increases, the surface tension decreases, so
that g ¼ ds=dT is negative. Consequently, the gradient of
surface tension ds=dx is positive, indicating that the cold
surface in front of the flame ‘pulls’ hot surface toward it
thereby explaining the experimentally observed move-
ment of liquid in the same direction as the flame spread
[74–76]. This surface-tension driven mechanism of flame
spread with accompanying liquid phase motion, which
obviously cannot occur for solid fuels, is an important
reason why flame spread over liquids is ordinarily at
least one to two orders of magnitude faster than flame
spread over solids. Another reason flame spread over
liquids is faster is that flame enthalpy is employed only
to heat and vaporize a layer of fluid, whereas for solids
the ‘gasification’ of the surface requires the transmission
to the condensed phase of a much greater percentage of
the flame heat release. For the latter, some solid
materials must both liquefy and then vaporize, requiring
the supplying by the flame of both liquefication and
vaporization enthalpies.
Research on flame spread over liquids has demonstrated
that if the liquid fuel layer is ‘deep enough,’ a complicated
convective flow pattern can be established in the liquid. The
flow involves a vortical inflow from below, followed by a
surface flow toward the cooler upstream, see Fig. 7. Such
flows can be visualized in ordinary candle flames by
observing the circular motion of ash and contaminant
Fig. 7. Flame spread over a liquid fuel showing the characteristic pre-flame circulation cell and the gas-phase circulation cell produced by the
interfacial no-slip condition. The flame spreads to the left.
I.S. Wichman / Progress in Energy and Combustion Science 29 (2003) 247–299 265
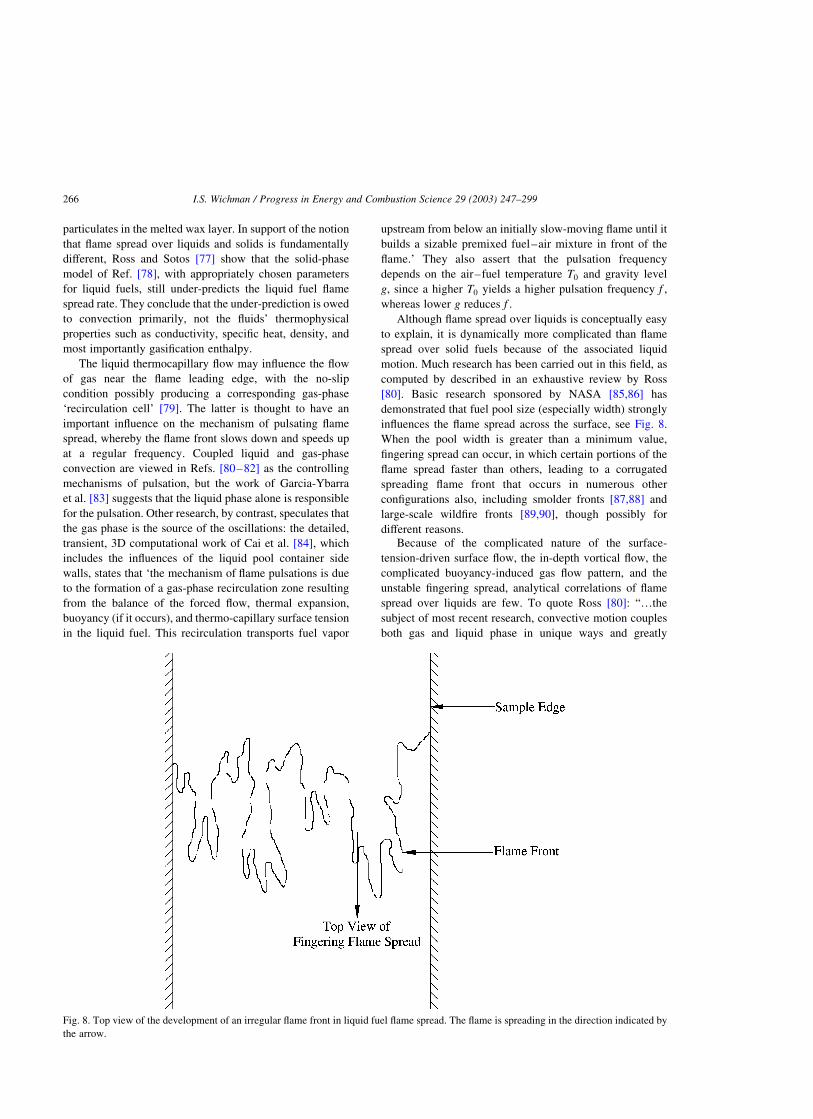
particulates in the melted wax layer. In support of the notion
that flame spread over liquids and solids is fundamentally
different, Ross and Sotos [77] show that the solid-phase
model of Ref. [78], with appropriately chosen parameters
for liquid fuels, still under-predicts the liquid fuel flame
spread rate. They conclude that the under-prediction is owed
to convection primarily, not the fluids’ thermophysical
properties such as conductivity, specific heat, density, and
most importantly gasification enthalpy.
The liquid thermocapillary flow may influence the flow
of gas near the flame leading edge, with the no-slip
condition possibly producing a corresponding gas-phase
‘recirculation cell’ [79]. The latter is thought to have an
important influence on the mechanism of pulsating flame
spread, whereby the flame front slows down and speeds up
at a regular frequency. Coupled liquid and gas-phase
convection are viewed in Refs. [80–82] as the controlling
mechanisms of pulsation, but the work of Garcia-Ybarra
et al. [83] suggests that the liquid phase alone is responsible
for the pulsation. Other research, by contrast, speculates that
the gas phase is the source of the oscillations: the detailed,
transient, 3D computational work of Cai et al. [84], which
includes the influences of the liquid pool container side
walls, states that ‘the mechanism of flame pulsations is due
to the formation of a gas-phase recirculation zone resulting
from the balance of the forced flow, thermal expansion,
buoyancy (if it occurs), and thermo-capillary surface tension
in the liquid fuel. This recirculation transports fuel vapor
upstream from below an initially slow-moving flame until it
builds a sizable premixed fuel–air mixture in front of the
flame.’ They also assert that the pulsation frequency
depends on the air–fuel temperature T0 and gravity level
g; since a higher T0 yields a higher pulsation frequency f ;
whereas lower g reduces f :
Although flame spread over liquids is conceptually easy
to explain, it is dynamically more complicated than flame
spread over solid fuels because of the associated liquid
motion. Much research has been carried out in this field, as
computed by described in an exhaustive review by Ross
[80]. Basic research sponsored by NASA [85,86] has
demonstrated that fuel pool size (especially width) strongly
influences the flame spread across the surface, see Fig. 8.
When the pool width is greater than a minimum value,
fingering spread can occur, in which certain portions of the
flame spread faster than others, leading to a corrugated
spreading flame front that occurs in numerous other
configurations also, including smolder fronts [87,88] and
large-scale wildfire fronts [89,90], though possibly for
different reasons.Because of the complicated nature of the surface-
tension-driven surface flow, the in-depth vortical flow, the
complicated buoyancy-induced gas flow pattern, and the
unstable fingering spread, analytical correlations of flame
spread over liquids are few. To quote Ross [80]: “…the
subject of most recent research, convective motion couples
both gas and liquid phase in unique ways and greatly
Fig. 8. Top view of the development of an irregular flame front in liquid fuel flame spread. The flame is spreading in the direction indicated by
the arrow.
I.S. Wichman / Progress in Energy and Combustion Science 29 (2003) 247–299266
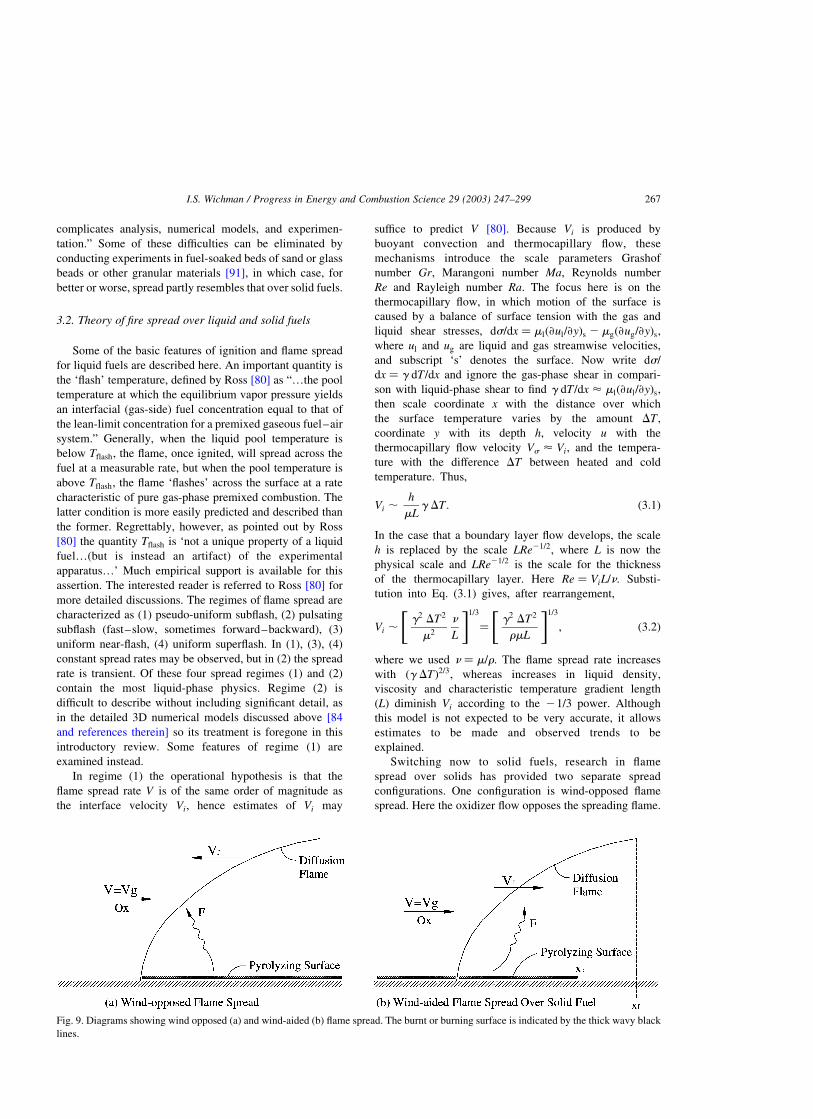
complicates analysis, numerical models, and experimen-
tation.” Some of these difficulties can be eliminated by
conducting experiments in fuel-soaked beds of sand or glass
beads or other granular materials [91], in which case, for
better or worse, spread partly resembles that over solid fuels.
3.2. Theory of fire spread over liquid and solid fuels
Some of the basic features of ignition and flame spread
for liquid fuels are described here. An important quantity is
the ‘flash’ temperature, defined by Ross [80] as “…the pool
temperature at which the equilibrium vapor pressure yields
an interfacial (gas-side) fuel concentration equal to that of
the lean-limit concentration for a premixed gaseous fuel–air
system.” Generally, when the liquid pool temperature is
below Tflash; the flame, once ignited, will spread across the
fuel at a measurable rate, but when the pool temperature is
above Tflash; the flame ‘flashes’ across the surface at a rate
characteristic of pure gas-phase premixed combustion. The
latter condition is more easily predicted and described than
the former. Regrettably, however, as pointed out by Ross
[80] the quantity Tflash is ‘not a unique property of a liquid
fuel…(but is instead an artifact) of the experimental
apparatus…’ Much empirical support is available for this
assertion. The interested reader is referred to Ross [80] for
more detailed discussions. The regimes of flame spread are
characterized as (1) pseudo-uniform subflash, (2) pulsating
subflash (fast–slow, sometimes forward–backward), (3)
uniform near-flash, (4) uniform superflash. In (1), (3), (4)
constant spread rates may be observed, but in (2) the spread
rate is transient. Of these four spread regimes (1) and (2)
contain the most liquid-phase physics. Regime (2) is
difficult to describe without including significant detail, as
in the detailed 3D numerical models discussed above [84
and references therein] so its treatment is foregone in this
introductory review. Some features of regime (1) are
examined instead.
In regime (1) the operational hypothesis is that the
flame spread rate V is of the same order of magnitude as
the interface velocity Vi; hence estimates of Vi may
suffice to predict V [80]. Because Vi is produced by
buoyant convection and thermocapillary flow, these
mechanisms introduce the scale parameters Grashof
number Gr; Marangoni number Ma; Reynolds number
Re and Rayleigh number Ra: The focus here is on the
thermocapillary flow, in which motion of the surface is
caused by a balance of surface tension with the gas and
liquid shear stresses, ds=dx ¼ mlð›ul=›yÞs 2 mgð›ug=›yÞs;
where ul and ug are liquid and gas streamwise velocities,
and subscript ‘s’ denotes the surface. Now write ds=
dx ¼ g dT=dx and ignore the gas-phase shear in compari-
son with liquid-phase shear to find g dT=dx < mlð›ul=›yÞs;
then scale coordinate x with the distance over which
the surface temperature varies by the amount DT ;
coordinate y with its depth h; velocity u with the
thermocapillary flow velocity Vs < Vi; and the tempera-
ture with the difference DT between heated and cold
temperature. Thus,
Vi ,h
mLg DT : ð3:1Þ
In the case that a boundary layer flow develops, the scale
h is replaced by the scale LRe21=2; where L is now the
physical scale and LRe21=2 is the scale for the thickness
of the thermocapillary layer. Here Re ¼ ViL=n: Substi-
tution into Eq. (3.1) gives, after rearrangement,
Vi ,g2 DT2
m2
n
L
" #1=3
¼g2 DT2
rmL
" #1=3
; ð3:2Þ
where we used n ¼ m=r: The flame spread rate increases
with ðg DTÞ2=3; whereas increases in liquid density,
viscosity and characteristic temperature gradient length
ðLÞ diminish Vi according to the 21/3 power. Although
this model is not expected to be very accurate, it allows
estimates to be made and observed trends to be
explained.
Switching now to solid fuels, research in flame
spread over solids has provided two separate spread
configurations. One configuration is wind-opposed flame
spread. Here the oxidizer flow opposes the spreading flame.
Fig. 9. Diagrams showing wind opposed (a) and wind-aided (b) flame spread. The burnt or burning surface is indicated by the thick wavy black
lines.
I.S. Wichman / Progress in Energy and Combustion Science 29 (2003) 247–299 267

Examples are vertically downward flame spread against a
buoyantly induced opposed flow and lateral flame spread
across a horizontal surface in an initially quiescent
environment, see Fig. 9a. For the latter, buoyancy induces
an inflow of oxidizer. The second fundamental configuration
of flame spread over solid fuels is wind-aided flame spread.
Here the oxidizer flow assists the spreading flame by flowing
in the same direction. An example of wind-aided flame
spread is vertically upward flame spread, see Fig. 9b. Under
most conditions, wind-aided flame spread is at least an order
of magnitude faster than wind-opposed flame spread. It is
also more difficult to predict because acceleration is an
inherent feature of wind-aided flame spread.
It is convenient to view flame spread over solids (and
in some cases liquids) as a sequence of piloted ignitions.
Here the advancing flame acts as its own pilot, and
various notions arising in the study of fire initiation
discussed in Section 2 can be carried over directly to fire
spread. In order to motivate this hypothesis, consider the
equation of flame spread proposed by Williams [92],
rsVA Dh ¼ _Q; where rs is the fuel density, V is the flame
spread rate, A ¼ wl is the fuel cross-sectional area
(width £ depth), Dh ¼ cpsðTv 2 T1Þ is the mass-based
enthalpy difference between the ambient ðT1Þ and
gasifying ðTvÞ fuel slab, and _Q is the heat transfer rate
from the flame to the surface, see Fig. 10. The heating
rate can be rewritten, in terms of the flame heat flux ð_q00Þ;
and the characteristic flame tip extent ðdÞ; and its lateral
width ðwÞ; as _Q ¼ _q00dw; whereupon V ¼ _q00d=rscpslðTv 2
T1Þ: The quantity rscpslðTv 2 T1Þ=_q00 can be interpreted
with the support of Eq. (2.4) as the ignition time. Thus, in
its general form the equation of flame spread is
V ¼ d=tig; ð3:3Þ
where V and d retain their previous definitions and tig is
the characteristic time to piloted ignition. For a thermally
thin solid fuel, whose entire sample cross-section is
simultaneously heated to the gasification temperature Tv;
Eq. (3.3) gives
V ¼_q00d
rscpslðTv 2 T1Þ:
The relevant points to notice from this simple equation
are the following. The flame spread rate V is proportional
to the flame heat flux and is inversely proportional to the
material density, specific heat, thickness and gasification
temperature.
If we write the heat flux from the flame to the surface as
lgðTf 2 TvÞ=lq; where Tf is the flame temperature, lg is
the gas thermal conductivity, and lq is the distance from the
flame tip to the fuel surface, we obtain the flame spread
equation for a thin fuel
V ¼ls
rscpsl
Tf 2 Tv
Tv 2 T1
� �; ð3:4Þ
where lq < d was assumed. For thermally thick fuels, on the
other hand, the relevant solid sample heated area thickness
is not the sample thickness l but rather a characteristic
heated layer depth, d < ffiffiffiffiffiffiastig
p; where as ¼ ls=rscps and tig
is the time from inception of heating to ignition. With tiggiven by Eq. (2.5) we obtain by substitution into Eq. (2.3)
the result V ¼ dð_q00Þ2=½rscpsðTv 2 T1Þ2�: When we write
_q00 < lgðTf 2 TvÞ=lq; where the flame quenching distance lqis approximately equal to the characteristic extent of the
flame tip, d; we obtain
V ¼ Vg
rgcpglg
rscpsls
Tf 2 Tv
Tv 2 T1
� �2
: ð3:5Þ
Here we used d ø lq < lg=rgcpgVg for the characteristic
gas-phase conduction length and the streamwise extent of
surface heating under the flame tip. We have defined Vg is
the opposed oxidizer velocity (see Fig. 9a). Equation (3.5)
describes the functional dependencies for wind-opposed
flame spread over thermally thick solid fuels. Its range of
applicability and its limitations are extensively discussed by
Wichman [36]. Fig. 11a and b shows diagrams of the
thermally thick and thin configurations.
Despite the success of these models in providing flame
spread formulas when spread is considered to consist of a
series of ignitions, the simple fact is that actual flame spread
is strongly influenced, if not actually controlled, by the
oxidizer inflow rate, which is ordinarily not measured in an
ignition test such as the cone calorimeter. Thus, relating the
above formulas, which generally depend on the oxidizer
Fig. 10. A schematic diagram representing the fundamental equation of flame spread. The flame front is the line shown. Flame spread occurs in a
direction locally perpendicular to this line.
I.S. Wichman / Progress in Energy and Combustion Science 29 (2003) 247–299268
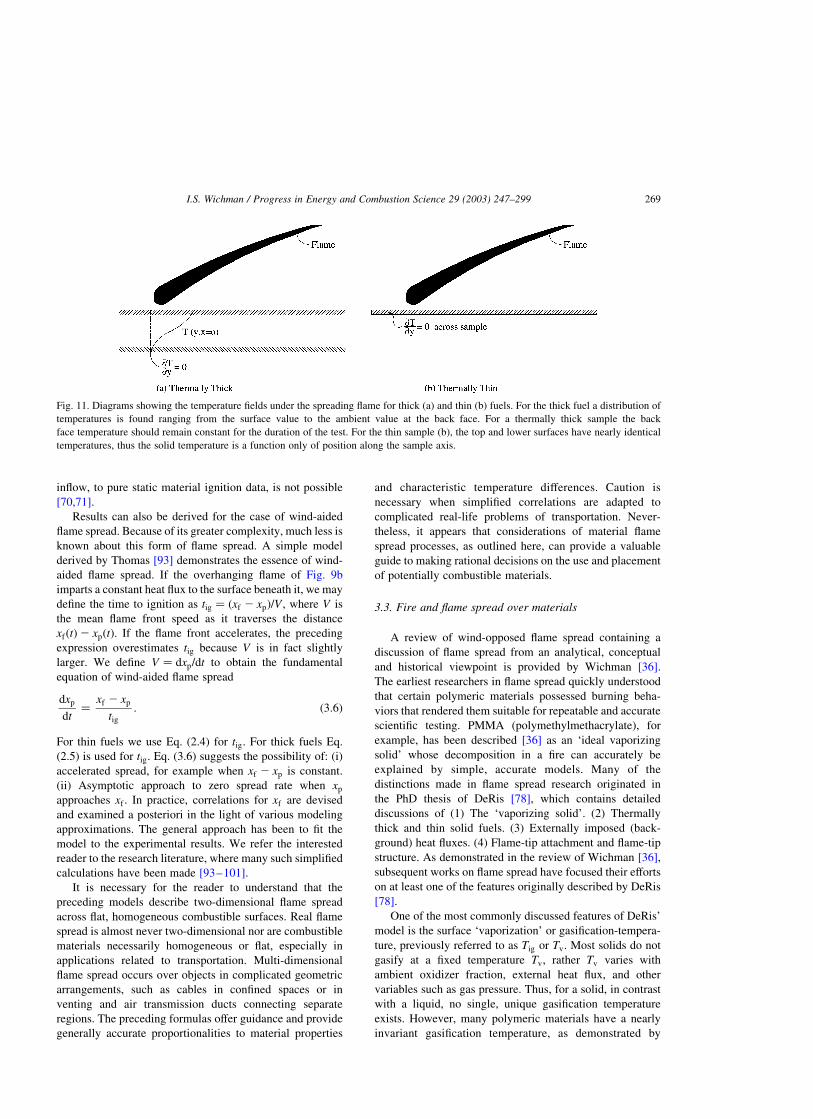
inflow, to pure static material ignition data, is not possible
[70,71].
Results can also be derived for the case of wind-aided
flame spread. Because of its greater complexity, much less is
known about this form of flame spread. A simple model
derived by Thomas [93] demonstrates the essence of wind-
aided flame spread. If the overhanging flame of Fig. 9b
imparts a constant heat flux to the surface beneath it, we may
define the time to ignition as tig ¼ ðxf 2 xpÞ=V ; where V is
the mean flame front speed as it traverses the distance
xfðtÞ2 xpðtÞ: If the flame front accelerates, the preceding
expression overestimates tig because V is in fact slightly
larger. We define V ¼ dxp=dt to obtain the fundamental
equation of wind-aided flame spread
dxp
dt¼
xf 2 xp
tig: ð3:6Þ
For thin fuels we use Eq. (2.4) for tig: For thick fuels Eq.
(2.5) is used for tig: Eq. (3.6) suggests the possibility of: (i)
accelerated spread, for example when xf 2 xp is constant.
(ii) Asymptotic approach to zero spread rate when xp
approaches xf : In practice, correlations for xf are devised
and examined a posteriori in the light of various modeling
approximations. The general approach has been to fit the
model to the experimental results. We refer the interested
reader to the research literature, where many such simplified
calculations have been made [93–101].
It is necessary for the reader to understand that the
preceding models describe two-dimensional flame spread
across flat, homogeneous combustible surfaces. Real flame
spread is almost never two-dimensional nor are combustible
materials necessarily homogeneous or flat, especially in
applications related to transportation. Multi-dimensional
flame spread occurs over objects in complicated geometric
arrangements, such as cables in confined spaces or in
venting and air transmission ducts connecting separate
regions. The preceding formulas offer guidance and provide
generally accurate proportionalities to material properties
and characteristic temperature differences. Caution is
necessary when simplified correlations are adapted to
complicated real-life problems of transportation. Never-
theless, it appears that considerations of material flame
spread processes, as outlined here, can provide a valuable
guide to making rational decisions on the use and placement
of potentially combustible materials.
3.3. Fire and flame spread over materials
A review of wind-opposed flame spread containing a
discussion of flame spread from an analytical, conceptual
and historical viewpoint is provided by Wichman [36].
The earliest researchers in flame spread quickly understood
that certain polymeric materials possessed burning beha-
viors that rendered them suitable for repeatable and accurate
scientific testing. PMMA (polymethylmethacrylate), for
example, has been described [36] as an ‘ideal vaporizing
solid’ whose decomposition in a fire can accurately be
explained by simple, accurate models. Many of the
distinctions made in flame spread research originated in
the PhD thesis of DeRis [78], which contains detailed
discussions of (1) The ‘vaporizing solid’. (2) Thermally
thick and thin solid fuels. (3) Externally imposed (back-
ground) heat fluxes. (4) Flame-tip attachment and flame-tip
structure. As demonstrated in the review of Wichman [36],
subsequent works on flame spread have focused their efforts
on at least one of the features originally described by DeRis
[78].
One of the most commonly discussed features of DeRis’
model is the surface ‘vaporization’ or gasification-tempera-
ture, previously referred to as Tig or Tv: Most solids do not
gasify at a fixed temperature Tv; rather Tv varies with
ambient oxidizer fraction, external heat flux, and other
variables such as gas pressure. Thus, for a solid, in contrast
with a liquid, no single, unique gasification temperature
exists. However, many polymeric materials have a nearly
invariant gasification temperature, as demonstrated by
Fig. 11. Diagrams showing the temperature fields under the spreading flame for thick (a) and thin (b) fuels. For the thick fuel a distribution of
temperatures is found ranging from the surface value to the ambient value at the back face. For a thermally thick sample the back
face temperature should remain constant for the duration of the test. For the thin sample (b), the top and lower surfaces have nearly identical
temperatures, thus the solid temperature is a function only of position along the sample axis.
I.S. Wichman / Progress in Energy and Combustion Science 29 (2003) 247–299 269
Flint and Magill [102] for polycarbonate, for which Tv ø580 8C ¼ 850 K: As discussed in Section 2.2.1 (footnote 5),
the piloted ignition temperatures for many combustible
hydrocarbon fuels vary less than 10–20% on an absolute
temperature scale, hence the designation of a representative
Tv is a reasonable theoretical modeling approximation.
Another feature of DeRis’ theory amounted to making
the distinction between thermally thick and thin flame
spread. Wichman [36] showed that this distinction was not
clearly made before DeRis published his PhD thesis (1968).
This matter is still an open question, however, and means for
resolving it are still not completely apparent. For example,
under some conditions certain physically thin materials can
still display thickness-dependent responses [103] that make
it difficult to classify them as thermally thin. In this case, the
temperature between front and back faces can vary
appreciably, and if the solid decomposes as, for example,
cellulose (which degrades to a char) the composition and
thus the thermo-physical properties of the sample can be
different between the front and rear of the sample.
Numerous experimental investigators examined flame
spread over varying fuel-bed thicknesses. Hirano and
Tazawa [104], for example, conducted an experimental
study to examine the influences of fuel thickness on
downward flame spread over thin solid-fuel sheets. Four
different paper thicknesses were used, the air-flow rate
opposing the flame spread was varied, and particle tracing
techniques along with thermocouple (TC) measurements
were used to diagnose the spread behavior. Measurements
showed that the spread rate decreased as the sample
thickness increased (consistent with Eq. (3.4)). The gas
velocity profile in the vicinity of the flame tip and the gas
temperature in the preheat zone were nearly independent of
the sample thickness. Although the spread rate decreases,
the mass-burning rate increases with increasing l: This was
believed to be caused, in part, by forward heat transfer from
the flame to the unburned material though the solid. A
perhaps more important explanation is the solid-phase
temperature gradient normal to the paper surface. This
gradient will ‘drive’ the volatile mass flux from the paper
surface into the gas. This discussion of fuel mass burning
rate and spread rate points to the fact that they are
quantitatively different subjects, which should be con-
sidered with appropriate caution. Flame spread rate is
relatively easily measured, whereas the mass burning rate is
not easily measured (unless static tests such as the cone
calorimeter are used).
Another study by Hirano et al. [105] examined opposed
flow flame spread over thick and thin sheets of PMMA. For
l , 0:2 cm; they found V / l21 as predicted by Eq. (3.4).
The authors suggested that for thin samples the heat flux
from the flame into the preheat zone in front of the flame tip
was larger than the flux to the pyrolyzing surface behind the
flame tip, whereas the reverse occurs for thermally thick
ðl . 2 cmÞ fuels. These measurements suggest that the heat
flux near the flame leading edge has a complicated structure
that must yet be carefully elucidated.
A simplified model of flame spread developed by
Quintiere [7] incorporated the radiation term and led to
the subsequent development at NBS (now NIST) of the
LIFT apparatus discussed in Section 2.3.2. This test couples
the ignitability criteria described for the cone calorimeter
(and similar devices) in Section 2.3.2 with the subsequent
evaluation of radiantly assisted creeping flame spread.
Parameters defined in an analytical correlation for transient
heat conduction to a semi-infinite solid are measured in the
LIFT apparatus, which employs a radiant panel inclined at
an acute angle to the sample surface. Flame spread rates and
ignition events can be measured as functions of incident
radiation and exposure time. The flame may spread both
laterally and upward, the lateral rate being slower than the
upward rate. The flame spread data are correlated for
varying exposure conditions by plotting the inverse square
root of the flame spread rate over thick materials against a
product of the heat flux and a time function. The work of
Harkleroad et al. [106] contains test and analysis results for
six materials representative of aircraft (interior panels,
carpeting, seat cushions) and buildings (plywood, PMMA,
rigid foam). A detailed study of ignition and flame spread
over two composites was conducted using the LIFT
apparatus by Ohlemiller and Dolan [107]. One composite
was a honeycomb panel, the other a composite armor. The
ignition behavior of all materials was correlated by a simple
predictive model. As already discussed, however, limi-
tations with the LIFT and LIFT correlations have been
examined in detail by Delichatsios [70,71]. The reader is
referred to these references for extensive consideration of
LIFT limitations and potential LIFT improvements.
Another feature of the spreading flame discussed by
DeRis, namely the flame tip structure, is not yet resolved.
Accurate measurements of gas velocity, temperature and
concentration fields are needed, as are well-constructed
theoretical models of flame tip structure. The information
and insight provided by careful experiment and theory can
lead to interpretable numerical simulations. An important
step in describing the gas-phase flow structure was made
with the introduction of laser-Doppler velocimetry (LDV)
methods of measurement described by Fernandez-Pello
[108]. Other sophisticated diagnostic methods have since
been used to measure features of the spreading flame, see the
rather extensive review of Fernandez-Pello and Hirano
[109].
An area of great practical concern for flame spread
involves flame spread along with wires and cables. Fires can
begin in confined spaces near wiring and cable lines, hence
this form of flame spread should be examined. A review of
the literature on fire tests for wire and cable has been
published by Babrauskas et al. [110]. Comparisons are made
to British and other international standards for such
materials. Approximately 300 references are compiled in
this article. The scientific study of flame spread in
I.S. Wichman / Progress in Energy and Combustion Science 29 (2003) 247–299270

cylindrical geometries is, however, not highly developed.
Except for some dimensional correlations and scaling
arguments, the literature on the basic mechanisms of this
form of flame spread is scant [111]. One important
difference between cylindrical and planar spread is the
presence in the former of ‘side relief’ for the flowing gases.
The thermal expansion may produce a secondary flow in the
circumferential direction along the cylinder or rod. Such a
lateral flow is not possible for strictly two-dimensional
planar flame spread.
Several other important physical variables can strongly
influence the rate of flame spread. Among these variables
are sample; ambient gas temperature; oxygen concentration
in the ambient gas; regression of pyrolyzing surface; char
formation at the pyrolyzing surface; fire retardant additions;
and geometrical shape of the sample. As shown in Eqs. (3.4)
and (3.5) the ambient temperature T1 can strongly influence
V : As T1 ! Tv; the flame speed approaches infinity, which
is flashover. Brauman [112] performed a study that included
variations of sample temperature for various polymers,
although other influences were also studied, such as
enhanced heat losses, additives, and char formation. An
indication of what might happen as the ambient gas
temperature is raised is provided in Ref. [113], where PE,
PP and PS samples were pyrolyzed in quiescent hot air at
varied temperatures. To the knowledge of the author of this
review, no studies of the influence of ambient air (or, more
generally, oxidizer) temperature have been carried out for
the flame spread problem. The influences of oxidant gas
composition also enter Eqs. (3.4) and (3.5) through the
enthalpy ratio, this time though Tf ; the flame temperature.
As the oxidizer mass fraction YO is increased, Tf
dramatically increases [36,114–116].
Brown et al. [117] conducted a detailed and fundamental
material fire spread evaluation for US Navy shipboard
structures and installations. In addition to carrying out the
various tests, criteria for ranking the tested materials are
described, data from non-standard tests of fire performance
are discussed, a review of data and results for selected tests
is provided, and recommendations are made for test
developments and for the future direction of the US Navy’s
fire spread evaluation of composite materials. No such
systematic test procedure appears to be available, hence the
fire spread/hazard evaluation of composite materials is still
an open subject of research.
Another fundamental question concerns quantifying the
influences of fire retardant chemicals on flame spread.
Babrauskas et al. [118] studied the influences of fire
retardants on total fire hazard (not flame spread). They
employed the cone calorimeter, NBS furniture calorimeter
and NBS toxicity tests. In all categories except overall smoke
production, the chemically treated samples performed better
than the non-treated samples. In particular, reduced
burning rates were obtained without increased combustion
by-product toxicity. Systematic studies of the influences of
retardants specifically on flame spread have not been
conducted, to the knowledge of the author of this review.
Flame heat fluxes to nearby surfaces have been
analyzed and described. This is an important practical
problem because in most real fires numerous surfaces are
simultaneously burning and transmitting radiant and
convective heat fluxes to each other. Quintiere and Cleary
[119] produce simple dimensionless correlations that
require empirical support. These correlations can become
extremely useful, if further developed, but they require
accurate experimental measurements. A literature search
was conducted by Babrauskas [120] to determine how
much is known about the heat fluxes from flame to surface
in opposed-flow spread. There were few reported studies,
and among those the reported data varied widely, even for
similar materials under similar spread conditions. Inter-
estingly, no data were found for the geometry of the LIFT
test (ASTM 1321). This was considered surprising
because LIFT is one of the few flame-spread tests for
which a theory is systematically applied to the data. The
LIFT theory, however, employs an empirical formula for
the ‘driving force’ for flame spread and does not explicitly
quantify the heat flux. Thus, is necessary to experimen-
tally measure flame heat fluxes in LIFT and in other
geometries. Questions abound, such as whether the heat
fluxes are total, whether significant fractions are lost to the
environment, whether the lost heat is lost primarily by
radiation, and so on. Delichatsios [70,71,121] wrote a
series of articles on this subject. In the latter article, a
version of the LIFT is proposed that combines features of
the cone calorimeter and downward flame spread tests:
specifically, the flame spread test sample is cylindrical,
mounted vertically in a larger cylinder consisting of
radiant heater coils, with the exhaust effluent exiting
vertically as in the cone calorimeter.
Various other features of flame spread must be well
understood, particularly as materials and their uses become
more sophisticated. The Army, for example, is interested in
assessing composites for performance of armored combat
vehicles under conditions that may lead to fire. The study of
Tewarson [122] describes a fire hardening assessment
(FHA) methodology applied to five composites. Four
separate tests were conducted for ignition, combustion,
fire spread, and extinction. These data were used to establish
the critical heat flux, thermal response parameter, fire
propagation index, heat release rate, product generation
parameter, smoke damage parameter, corrosion index, and
flame extinction parameter.
Numerous simplified versions of Eqs. (3.4) and (3.5)
have been deduced based on the YO-response of V : For
example, V / YbO should give b , 1 for thin fuels and b , 2
for thick fuels because Tf / YO: Initial experimental work
on flame spread [36,109] was founded on such correlations,
which are used to ascertain the influences of finite-rate
chemistry [123]. If the pure heat-transfer dependence b is
known, the difference, a; between V / YbþaO and V / Yb
O
I.S. Wichman / Progress in Energy and Combustion Science 29 (2003) 247–299 271
can be determined and ascribed to finite chemistry. A
fundamental discussion of the influences of oxygen
concentration in the ambient oxidizing gas on the pyrolysis
and combustion of various polymers (PP, PE) is found in
Ref. [124]. In the absence of flame spread and dynamic flow
mechanisms, polymer combustion is found to have a single
degree of freedom, namely YO: This determines the fuel
consumption rate at the flame and the fuel production rate
through surface gasification. The exothermic heat flux from
the flame must be sufficient to balance the endothermic
degradation and volatilization of the polymer.
Finally, the influences of charring on flame spread have
been examined. Questions have been raised concerning
radiant heat losses from charred surfaces and whether the
losses are sufficient to produce a slowdown of the flame
spread rate. Radiant extinction appears to be possible for
charring materials, see the numerical and theoretical work of
Bhattacharjee and Altenkirch [125] and Bhattacharjee et al.
[126]. Experimental work and limited comparisons are
available, especially in the microgravity limit [127]. A
plausible theoretical explanation, which proposes the use of
a revised Damkohler number correlation including radiant
heat losses has been advanced in Ref. [36] (Sections 4.4.1–
4.4.3). This proposed correlation is based on the results of
Bhattacharjee and Altenkirch [125] and Bhattacharjee et al.
[126]. West et al. [128] conducted a detailed numerical
examination of flame spread with heat losses, including
comparisons to theoretical predictions. This numerical study
showed that fuel surface radiation from thermally thick fuels
is always important and can never be neglected, unlike for
thin fuels. Essentially, the reason for this is that the ratio of
conduction to radiation transfer ahead of the flame front is of
order unity over nearly the entire range of airflow velocities
into the flame front. Energy losses from the surface can
produce extinction if they are sufficiently large. In many
polymers, char formation is not a dominant consideration.
However, certain polymers produce a char or carbonized
surface layer, as described in Ref. [129]. Optical methods
including reflected and refracted light along with X-rays,
were used to study char formation on heated PS, PVC-
powder, PVC-plasticized and polyamide (PA). Polarized
light was used to detect the dependence of optical properties
on direction. The degree of anisotropy increased with the
intensity of thermal degradation (i.e. rapidity of heating) and
the amount of carbonization.
4. Fire chemistry
The objective of fire chemistry studies is to describe the
details of chemical reactions responsible for propagating the
reaction, releasing thermal energy, forming combustion
products and diffusing and convecting these product gases to
certain ‘sites of action.’ An important distinction must be
made between reactant species, which usually disappear
quickly and release great quantities of heat as they are
consumed, and product species, with which the engineer
must deal with both during and after the heat-releasing
stages of the fire. As Emmons [8] noted, “For most, but not
all fire processes, chemical kinetics is essentially infinitely
fast. The rate-controlling steps in the fire are the dynamic
processes which mix, heat, and ignite the fuel and air.” This
statement is certainly true for most reactant species,
however many combustion product species are ‘slow’ and
therefore ‘linger’ for long periods of time. In transportation
fire research it is therefore fitting and proper to emphasize
the production and subsequent fate of the product gases,
which may be toxicants.6 Consequently, much fire and fire
safety research focuses on combustion by-products because
(1) these may contain toxicants and (2) the decay of these
by-products to final or ultimate products (usually CO2 and
H2O) is much slower than the nearly instantaneous heat
releasing reactions.
Perhaps the single most important toxicant in fire
research is carbon monoxide (CO), which is a product of
almost all hydrocarbon combustion processes. CO toxicity
is a vital consideration in structural fires, where occupants
may be subjected to long-term exposures of the order of
several hours. For example, approximately two-thirds of all
fire-related deaths are attributable to CO poisoning [130].
Transportation fires, however, usually occur over consider-
ably shorter times scales so that unless the CO levels are
high, times of exposure will be insufficient to produce the
longer term toxic results found in buildings. Thus, we expect
in transportation that events are relatively rapid, therefore
toxicity studies must account for all of the compounds
released, particularly those with the capacity to act over
shorter time scales.
The field of fire and flame chemistry, with principal
emphasis on rates of individual reactions and energy release
for individual elementary reaction steps and their relation to
entire reaction mechanisms, has a large and burgeoning
research literature with many reviews and articles of
technical interest [131–135]. Much was learned in the
decade from the mid-1980s to the mid-1990s about detailed
HC reaction mechanisms, particularly for lower-order HC
fuels such as methane, ethane, propane and other saturated
HCs. We shall not review this literature because, as
indicated, our principal interest in transportation fire safety
is to quantify the types of combustion by-products produced
in fire and their potential toxicological effect. The details of
the reaction mechanisms (important individual reaction
steps, individual reaction rates) are not as relevant presently
as the number, concentration, nature and influence of the
combustion by-products. Nevertheless, in more detailed
investigations the influence of chemical formation rates on
6 Defined as toxic compounds that are somehow produced, e.g. by
a chemical reaction or in material thermal degradation, in contrast to
toxins, which appear naturally.
I.S. Wichman / Progress in Energy and Combustion Science 29 (2003) 247–299272

the ultimate concentrations of combustion by-products must
be examined.
This section describes three principal areas of fire
chemistry. These are products of combustion, toxicity, and
smoke and retardants. Overlap clearly occurs in these
categories (e.g. the analysis of combustion products of fire-
inhibited combustibles).
4.1. Products of thermal decomposition and combustion
The release of products of thermal decomposition and
combustion for materials used in transportation occurs over
a range of temperatures, ranging from relatively low
(O(300 8C)) for smoldering and initial thermal degradation
of thermoplastic materials to relatively high (O(1500 8C))
for gas-phase combustion and open flaming. The former
range of low temperatures characterizes the thermal break-
down of the material and perhaps the smoldering stage of
combustion undergone by many materials. This temperature
range, however, is associated with long time scales and
implies low-level largely undetected fires. The latter range
of high temperatures is more characteristically and vividly
associated in the imagination with transportation fires:
an accident involving a car or train or other large vehicle
followed—inevitably in the Hollywood version—by a
massive explosion and fireball. On the one hand, in this
much shorter time scale the chemical product species that
produce a harmful toxic effect may be less important than
the disastrous effects of the heat release such as burns. On
the other hand, if the high-temperature toxicant is very
effective, perhaps only a very short time is needed for
feeling its full effect. In either case it is clear that the range
of temperatures and conditions in which transportation fires
can occur is wide and no set range of conditions applies to
all cases. It proves helpful in a review, however, to
distinguish between low and high temperature product
formation processes.
In order for a possibly lethal event to occur in a
prolonged low-temperature thermal degradation process or
in smoldering [130], active flaming is not necessary [16,17].
The low-temperature smoldering and moderate-temperature
thermal decomposition of most HCs releases gaseous
volatiles and toxicants [136]. For example, at approximately
300 8C cellulosic materials such as wood and paper readily
decompose [137], emitting CO and other potential toxicants.
These toxicants often linger for long time periods because at
such low temperatures they react slowly to form additional
(or ultimate) products such as CO2 and H2O.
In high-temperature gas-phase combustion of even the
simplest hydrocarbon (HC) fuel, methane, the final products
CO2 and H2O do not appear instantaneously
upon disappearance of the reactants CH4 and O2 as
implied by the global formula CH4 þ 2(O2 þ 3.76N2) !
CO2 þ 2H2O þ 7.52N2 that describes stoichiometric
methane oxidation in air. In actuality, the reactants CH4
and O2 quickly form a set of intermediate compounds,
which subsequently combine to form the final products CO2,
H2O when the surrounding gas temperature is sufficiently
high. An important intermediate is CO, which is slowly
oxidized to CO2 after it has been produced by the
decomposition of the reactants. Thus, the oxidation of a
HC fuel generally proceeds in two or more stages. These
stages can be qualitatively7 represented as a rapid
production of CO from the parent fuel (the ‘essentially
infinitely fast’ reaction described by Emmons [8]) followed
by a slow oxidation of the CO to the final product CO2. A
qualitative rendering of the previous 1-step global methane
oxidation reaction is to divide it into two steps. The first step
is the very fast oxidation of CH4 to CO and H2O, viz.
CH4 þ 1.5(O2 þ 3.76N2) ! CO þ 2H2O þ 5.64N2. The
second step is the slow oxidation of the intermediate CO
to CO2 via CO þ 0.5O2 ! CO2. It has been forcefully
argued that it is impossible to reduce the methane oxidation
sequence to fewer than three ‘global’ reactions. A four-step
methane reduced chemistry sequence, which has success-
fully modeled aspects of combustion such as laminar
premixed flame speeds and flame quenching, contains the
steps (1) CH4 þ 2H þ H2O ! CO þ 4H2; (2) CO þ H2-
O ! CO2 þ H2; (3) 2H þ M ! H2 þ M and (4) O2 þ
3H2 ! 2H þ 2H2O. The latter two steps describe the
formation of H2O (and are common to all hydrocarbon
oxidation reduced schemes) whereas the former two steps
are concerned with the consumption of the particular
carbon-containing species, in this case CH4. We note from
this scheme also that the methane oxidation contains CO as
an intermediate, and that the second reaction is generally
much slower than the first. CO oxidation chemistry, which is
very sensitive to trace amounts of impurities, moisture and
other influences, is discussed in detail by Yetter et al. [134]
and Rightly [138]. For the purposes of this review it suffices
to observe that CO is a potentially highly toxic gas whereas
CO2 is relatively non-toxic by comparison.
Toxicity measures depend upon both the location of their
application and the time of toxicant application. The spatial
location of both the source and the target are important
because combustion products are not static and therefore
move under the influence of mass diffusion and convection,
both forced and natural. Similarly, the time of exposure is
crucial to the target, but is also important for delivery:
toxicant production rates can vary in time even if the source
that produces them is spatially homogeneous.
Heavy HC fuels and non-stoichiometric HC oxidation
produce large numbers of potential toxins. The analysis of
intermediate products of combustion and toxins has been
enhanced by the advent of new and sophisticated chemical
diagnostic methods (e.g. FTIR spectrometry, gas chromato-
graphy/mass spectrometry (GC–MS)). GC–MS was used to
examine the thermal decomposition products of HDPE
7 As discussed in Refs. [131–135] the oxidation of any
hydrocarbon fuel proceeds through long, intricate reaction
mechanisms containing up to 103 elementary reaction steps.
I.S. Wichman / Progress in Energy and Combustion Science 29 (2003) 247–299 273
[139]. The samples were exposed for 20 min to relatively
low pre-combustion temperatures of 375 8C. The decompo-
sition products included propane, ethane, butane, propylene,
ethylene and 1-hexane, with propane as the most abundant
volatile product. At sufficiently high gas temperatures, such
volatile gases may begin reacting with the available O2 to
form products of combustion such as CO, CO2 and H2O. The
375 8C ¼ 650 K temperature is lower, we note, than the
usual ignition temperature for solid combustibles (Section
2.2.2). Morimoto et al. [140] examined various polymers
(PE, PS, nylon 66, PU, etc.) for their degradation products in
two gas atmospheres, one hot but inert (all N2), the other hot
but oxidizing (air). The heated gas temperature ranged
between 700 and 800 8C, sufficient for the air to ignite a
flame and to produce flaming combustion. The main
gaseous HCs produced in flaming were CH4, C2H6 and
C2H2. Hydrogen cyanide (HCN) was produced by all N-
containing compounds and also for all polymers tested in the
N2 flows. Ammonia was produced from flaming combustion
only for nylon 66 and polyacrylamide, but in N2 it was
produced in all cases except for PU. Compounds containing
sulfur produced SO2 in the gaseous products. These studies
confirm the general truth that low-temperature pyrolysis and
degradation produce a variety of heavier degradation
products whereas high temperature degradation, as for
example in the presence of a flame, produces lighter
degradation products. The low-temperature products are
often referred to as ‘volatiles’ because they can sub-
sequently easily be ignited by a suitable heat source and they
are generally heat-releasing reactants. To the author’s
knowledge, relatively few studies have examined the full
range of degradation products for familiar materials under
heating.
One work that attempts this is by Chien and Kiang [141]
who examine the oxidative pyrolysis of PP, finding that the
pyrolyzed polymer liberates oxygenated compounds that
undergo subsequent oxidation by the gas-phase flame. These
authors begin by noting there has been ‘surprisingly little
fundamental study of high temperature oxidations’ of
polymers in the stages between polymer surface and
flame. They note, in addition, that ‘there does not seem to
be any thorough study of polypropylene oxidation above
200 8C.’ TGA was used to show that polymer degradation
begins at 200 8C and ends at 400 8C. The pyrolysis is called
‘oxidative’ because pyrolysis occurs in the presence of
oxygen in the circumambient gas. As the amount of O2 in
the gas increased, the yields of acetaldehyde, acetone,
butanol, and water all decrease, whereas in their place ‘the
yield of CO2 increases rapidly.’ This trend especially
increases for %O2 greater than 60%. The dominant and
ultimate oxidation products for all %O2 are CO2 and H2O
but the predominant secondary oxidation products are CO
and CH3OH, which arise from formaldehyde and acet-
aldehyde. The oxidative pyrolysis of PP showed first-order
kinetics in the narrow range between 240 and 289 8C. The
authors wrote a simple Lindemann-like kinetic mechanism
which, using the steady-state approximation for the
intermediate hydroperoxide (ROOH), was able to provide
a first-order expression for the overall kinetics. We note that
PP is a ‘versatile polymer’ that does not melt below 160 8C
and is often used to make indoor–outdoor carpeting since it
does not absorb water [142].
Thermoplastic polyamides form a large sector of the
adhesives industry and thus may be utilized in the various
transportation industries. Related compounds such as
adhesives, printing inks, and reactants for epoxies are
formed from a dimer acid (a polymerized fatty acid). Nylons
are polyamides are not, however, made from dimer acids.
Thermoplastic polyamides can vary from semi-solids with
low molecular weight to solids of high molecular weight;
polyamide adhesives can adhere to metals, glass, cellulosic
substrates and many plastics; and these adhesives often have
good impact resistance, thermal stability and flexibility
[143]. The thermal decomposition of the polyamides
polycaprolactum (PA-6), polyoenantholactam (PA-7), poly-
caprylolactam (PA-8) and rislin (PA-11) in 510, 610 and
770 8C atmospheres for heating rates of 15 8C/min was
examined by Michal et al. [144]. As for Tsuchiya and Sumi
[139], weight loss began at T ¼ 200 8C: The polyamides
began to decompose at T ¼ 400 8C : major decomposition
was completed by T ¼ 500 8C: Approximately 80% of the
volatiles were produced between 400 and 500 8C. The most
toxic products were the nitriles, such as acrylonitrile and
acetonitrile, which comprised up to ‘half of the total volatile
products’ of thermooxidative degradation. Other main
products of thermo-oxidation were long-chain nitriles,
alteanes and olefins. The decomposition gases formed
from these polyamides are dense, which according to the
authors ‘can be regarded as a warning signal of the
dangerous nature of the pyrolysis and thermoxidative
products of polyamides’.
Polyethelene, polypropylene, polystyrene and poly-
amides were examined by Mitera and Michal [145]. They
studied flaming and non-flaming combustion of these
thermoplastics using two different combustion chambers.
One, the ‘CAB 4.5’ simulated the combustion of large
samples in a small space while the other, the ‘CAB 650’
modeled the opposite: the stage of fire in which a flow of air
over the burning material is employed. The higher-
temperature flaming combustion in CAB 650 produced
more CO2 and more aromatic HCs. For PS, flaming
combustion produced a complicated mixture of monomers,
dimers and trimers in contrast to the non-flaming CAB 4.5
test. This study drew attention to the difference between the
pre-burning degradation stage and the actively burning post-
degradation stage, showing that flaming combustion pro-
duced greater quantities of products although overall
proportions of the species remained similar. The authors
also showed that for flaming combustion in the CAB 650, PS
produced a more complicated mixture of monomers, dimers
and trimers than in non-flaming degradation (i.e. the CAB
4.5). The authors concluded that the CAB 650 test was
I.S. Wichman / Progress in Energy and Combustion Science 29 (2003) 247–299274
a useful supplement to the CAB 4.5 for determining
individual toxic substances, optical smoke density, and
chemical evaluation of polymers in possible fire
environments.
Grand [146] used the University of Pittsburgh Toxicity
Test Apparatus to examine PP, PS, Douglas fir and cotton
for the evolution of CO and CO2. Consistent with previous
discussions, CO evolved in higher concentrations when
conditions inside the test device led to active flaming, and
thus higher rates of decomposition of the material. CO and
CO2 measurements were also performed by Brauman [147]
and Michal [148]. For PP, mixed polyester (PMPS), and
polystyrene, Brauman [147] showed that increased CO
formation was accompanied by smoke formation and that
the flame retardant Sb2O3 increased CO and decreased CO2
levels during combustion. The tests were not static but
employed vertical sample rods that were radiantly heated in
a 10 l/min air crossflow. Enhanced radiant fluxes produced
accelerated rates of decomposition. Michal [148] demon-
strated, as have several of the preceding studies, that CO
production is sensitive to the gas-mixture oxygen content.
An added complication in real fires is that combustion
temperatures vary significantly from the beginning to the
end of the fire. As the temperature increases, so does the CO
content in the intermediate combustion products of
polymeric materials. A measure of the sensitivity of the
CO measurements of Michal [148] was the experimental
reproducibility, which varied with respect to the chemical
diagnostic technique used.
PU foams, which are commonly used in transportation,
have been studied for their degradation and potential
toxicity. Comeford [149] developed a flash-fire cell test
method for PU foams in which samples are pyrolyzed in air
while measurements are made for the time of onset of a flash
fire and pyrolysis gases are simultaneously withdrawn for
analysis. Comparisons were made for various PU foams and
other polymers of potential interest to the aircraft industry.
Einhorn et al. [150,151] examined the thermal degradation
of ‘model’ rigid PU foams to determine the influence of
chemical structure, fire-retardant structure and fire-retardant
chemistry in order to ‘gain insight into the burning
mechanism of the rigid-urethane foam and fire retardancy
by studying the products of degradation of both fire-retarded
and non-fire-retarded model rigid-urethane foams.’ The
retardants used were tris(2,3-dibromopropyl)phosphate and
tris(2,3-dichloropropyl)phosphate in concentrations ranging
from 4 to 16% by weight. The LOI was determined for
foams with different retardant levels. As the temperature of
pyrolysis was increased, the quantity of light volatile gases
increased. The major product at 500 and 1000 8C was CO2,
whose concentration depended more on pyrolysis tempera-
ture than retardant concentration. The pyrolysis products of
the non-fire-retarded foams depended very strongly on the
pyrolysis temperature. The basic degradation mechanism
was unchanged with addition of retardant. The retardant did
not influence the breakage of the urethane bond
(which would lead to the formation of CO2). Unretarded
PU lost 100% weight at 620 8C, whereas 8%-concentration
retarded PU remained charlike at 800 8C. Retardant type had
little influence on charring, since either retardant produced
nearly the same TGA sample weight loss thermal decompo-
sition curves (Figs. 14 and 15 of the article). Interestingly,
the fire retardant catalyzed reactions leading to the
formation of light and ‘noxious’ gases. At low heating
rates a large portion of the retardant volatilized, whereas at
high heating rates it caused the formation of light gases.
In Ref. [150] model urethane foams were examined for
combustion products and polymeric structural changes
using thermoanalysis, direct-probe analysis, and residue/
volatile analysis. Pyrolysis consisted of heating and then
igniting foams in He at 500, 750 and 1000 8C. The
degradation process was divided into two distinct stages, a
char-formation stage (250–400 8C) and a char-degradation
stage (400–700 8C). The former stage was independent of
heating rate. The latter stage occurred via slow thermal
degradation and chain unzipping of the high-molecular-
weight molecules, and an increase of degradation
temperature appeared not to affect the urethane foam
degradation mechanism, since the major reaction was still
the breakage of the urethane bond, which released the CO2.
The main reaction occurring in this latter stage of heating
produced predominantly CO2 and H2O indicating that the
dominant reaction was oxidation of the char. The degra-
dation products during the char-erosion stage were NO,
CO2, H2O and benzene (in air), showing that the charring
stage, for these model foams, produces few toxicants. A
kinetic model with rate parameters was also derived.
Rotival et al. [152] examined small 100–200 mg
thermoplastic samples heated at 5 8C/min in a 30 ml/min.
airflow using TGA and gas analysis techniques. The thermal
decomposition of PP, PU and PP/PU mixtures produced
very low mass percentages of aldehydes–ketones, HCN,
and isocyanates relative to CO and CO2. The gases emitted
from PP/PU mixtures differed from emissions for individual
PP and PU samples. The mass percentages of CO and CO2
were functions of temperature, O2-level, and sample
decomposition rate (i.e. weight loss).
PVC [(C2H3Cl)n] is an important polymeric material in
common use. PVC flame resistance can be attributed to the
release upon heating of the Cl atom, which inhibits flaming
combustion. However, a chemical pathway is formed for the
production of the toxicant HCl. Boettner et al. [153], Zinn
et al. [154], and Statheropoulos [155] studied the decompo-
sition products of primarily PVC under external heating.
Boettner et al. [153] used DTA and TGA along with IR and
mass spectroscopy to identify pyrolysis products. The
results showed that (1) endothermic peaks caused by the
release of Cl occurred between 300 and 600 8C; (2) weight
loss rate varied with temperature and was most rapid below
280 and above 510 8C; (3) different PVCs had different
volatile products; (4) CO, CO2, and HCl evolution was
largely independent of airflow variation; (5) HCl production
I.S. Wichman / Progress in Energy and Combustion Science 29 (2003) 247–299 275
appeared to be independent of sample heating rate. The
study of Zinn et al. [154] examined 11 PVC samples of
varying compositions (and also seven PP samples) under
non-flaming conditions for smoke particle size distribution,
total smoke particulate mass generated, smoke mean
particle diameter, smoke optical density, and sample weight
loss. The smoke characteristics are altered for PVC and PP
by the different chemical additives. Statheropoulos [155]
used direct-inlet mass spectrometry (DIMS) to study and
identify PVC degradation products in 30 min constant-
temperature tests. At low temperatures of 160 and 180 8C
the volatiles (defined as HCl and the aromatic HCs) were
100% HCl. At 200 and 220 8C they were 96% HCl and 4%
aromatics. At 240 and 280 8C a change occurred. A rapid
evolution of HCl and aromatics occurred in the first minute
of degradation, followed by a decreasing evolution rate
thereafter. These studies state that the formation of HCl
upon PVC degradation is an experimental fact, and that
various sophisticated diagnostic methods can be used to
make accurate measurements of its rate of evolution under
thermal insult.
The decay of the combustion by-product HCl is itself a
question of fire science. Galloway et al. [156] studied HCl
decomposition in a 3L chamber, varying humidity, tem-
perature, HCl concentration, and wall materials (PMMA,
ceiling tile (CT), marinate (MAR), gypsum board (GB),
cement block (CB), etc.) The research supports the assertion
that HCL reacts rapidly with surfaces leading to peak HCl
fire concentrations much lower than predicted from
equilibrium chemical analysis. Almost all of the surface
materials tested readily consume HCl, for which evidence is
provided by progressively decreased consumption rates in
repeat experiments with the same material. This study, in
addition to demonstrating the uptake of HCl by nearby
surfaces that may be present in transportation fires,
demonstrates the importance of mass transport on toxicant
behavior: according to these experiments, this particular
toxicant appears to have a propensity for removing itself
from the carrier gas.
Finally, Fardell et al. [157] conducted a ‘fingerprint’
sampling and analysis to study the chemical nature of fires
of wood, PP, PMMA, and PS foam, using a 24 m3
compartment-corridor fire-test rig. Gas samples of 250 ml
were extracted during various stages of the fire and analyzed
using gas chromatography and mass spectrometry. It was
found that the combustion products were similar for all fuels
used, but their concentrations varied widely. CO concen-
trations were usually higher than the total concentrations for
all other compounds at the same point in the fire. After CO,
the most toxic substance measured was acrolein. The
acrolein concentrations were low: CO was still the dominant
toxic product even when the acrolein concentration
exceeded the lethal limit of 10 ppm.
These studies of thermoplastic materials commonly used
in transportation suggest that, for nearly all materials
studied, a large difference is found in products of material
degradation when temperatures are low and when they are
high, as in a flaming environment. In low temperatures the
degradation products appear to be heavier, including species
such as methane, ethane, acetylene, HCN, acetaldehyde,
butenol, acetone, and many others. At higher temperatures
the formation of CO seems to dominate the intermediate
product stage, and if the supply of oxidizer is sufficient and
the temperature is sufficiently high the ultimate oxidation of
the CO to CO2 proceeds as expected. Nitrogen-containing
compounds produce nitrogen-containing products, just as
Cl-containing materials (PVC) produce Cl-containing
products (like HCl). What are needed, apparently, are
chemical rate formulas and rate parameters that allow the
type and quantity of these species to be calculated in both
pre-flaming and flaming environments. The overall mech-
anism of material breakdown followed by eventual
oxidation to CO2 and H2O is understood, but the
intermediate species distributions, their concentrations
during degradation and subsequent combustion, cannot, it
appears, yet be calculated. If mechanisms such as these are
ultimately to be used in anything more than a descriptive
and prescriptive manner, calculating the species concen-
tration field evolution must become possible.
4.1.1. A case study: the sunshine mine
We study an example that illustrates many of the
principles discussed to this point of the review, namely the
Sunshine Mine (Idaho) fire of May 2, 1972, which killed 91
men. Wilde [158], whose study was commissioned by a
legal firm investigating the fire, undertook to simulate the
actual mine fire conditions in a large tunnel that is 200 m
long, has a 1:30 rise/run ratio, a cross-sectional area of
4.25 m2 (max height of 2.2 m), a width of 1.67 m, and a
curved semi-circular ceiling. The main test section was
approximately 25 m long. It was ventilated by a fan giving
an air-speed of 4.9 m/s. The inside of the tunnel was lined
with either polyurethane (two tests) or plywood (two tests).
Ignition of the wall materials was achieved using wood cribs
(about 100 kg), which were set afire in approximately the
middle of the test section, providing a maximum of about
100 kW. At ignition, a door that separated the ignition
‘pilot’ flame and the test tunnel was opened both to the
upwind and downwind sides of the test section. Measured
quantities included O2, CO and CO2 concentrations, fume
temperature, and flame speed using gas analysis, TCs at
various tunnel locations, and visual camera measurements,
respectively. For the PU tests, the igniting flame caused the
heated foam ‘to emit a grayish white vapor which formed a
cloud in the upper levels of the tunnel.’ When this cloud
ignited, the fire very rapidly propagated downwind through
the tunnel at speeds around 2 m/s and completely filled the
tunnel with intense flames. The fire spread upwind O(100)
times more slowly at approximately 0.02 m/s. These results
show the necessity of piloted ignition, the phenomenon of
vapor release from surfaces before they fully ignite, the
stratification of the hot vapor layer in the upper section of
I.S. Wichman / Progress in Energy and Combustion Science 29 (2003) 247–299276
the tunnel, and the rapid rate of spread of flames through the
stratified mixture. Each of these phenomena can be
explained in fundamental, science-of-engineering terms.
The rapid propagation of fire through combustible mixtures
in the ceiling fire arrangement is particularly to be noted.
The measurement by Wilde [158] of the transient species
concentrations also supports fundamental observations
made in this review. As the fire progressed, measured O2
fell from the initial 23% (by volume) in air to ,1.5 % (by
volume). CO reached a maximum at that same instant. The
CO2 level attained its maximum value slightly later when
CO was decreasing. Therefore, combustion of the fuel and
air initially gives products that include large quantities of
CO, which is subsequently oxidized to CO2. The measure-
ments clearly show that the CO% falls as the CO2% rises.
The toxic effect consisted of the very rapid buildup of
‘fumes’ consisting of these oxides of carbon (CO and CO2)
coupled with the indicated severe oxygen depletion. The
author speculated that the depletion of oxidizer, the
formation of toxic fire fumes, and the high temperature of
these fumes ‘could each have proved fatal almost
instantaneously to anyone caught directly in them.’ Foam
fires are of short duration because of their high burn rate.
There was no discussion in Ref. [158] of other toxicants
such as HCN, which would have shown up as trace
quantities. The author states, however, that the fume toxicity
cannot be ascribed to CO, CO2 and O2 depletion alone. The
trends described for the PU foam case were repeated, though
much less dramatically. For the wood wall cases the fire-
spread rate was much slower, about 0.02 m/s downwind and
about 10X slower upwind. Finally, consistent with Eq. (2.5)
the importance of rscsls was reiterated. A low value
produces a high rate of temperature rise at the surface and
vice versa. Wilde [158] notes that “If, in addition to heating
up rapidly, a material decomposes at low temperature to
yield gases and vapors which ignite easily, it is likely to be
defined as highly flammable.”
The elongated tube-like shape of the test tunnel, the rapid
buildup of a combustible ceiling gas/vapor layer, the
dramatic speed of combustion, the depletion of the oxygen,
the rapid heat release and temperature rise, and the sheer
force of their combined effect appears to make this
simulated mine shaft study quite relevant to transportation
fire safety analyses.
4.2. Toxicity
This subject is vast and the number of articles reviewed
is large. Hence, we subdivide this section as follows: After
an initial discussion of the basic scope and nature of toxicity
analysis, with specific emphasis on the general subject of fire
and combustion gas toxicity, we discuss PVC toxicity in
Section 4.2.1. This discussion is an extension and
specialization of Section 4.1. In Section 4.2.2 we discuss
polymer decomposition and toxicity, including polymers
considered generally, as well as specific polymers such as
ABS and polymers that contain nitrogen. In Section 4.2.3 we
consider the broad class of PU foam toxicity. Finally,
Section 4.2.4 provides a summary of several reviewed
articles describing toxicity of fire-retarded materials,
practical materials and foams, and the influences of physical
variables, such as heating rate, on toxicity.
Chemical research on fire toxicity and fire retardant
chemistry usually involves the withdrawal, for chemical
analysis, of very small, presumably homogeneous samples
of gas or material. Since toxicology is the study of the
harmful effects of chemicals on living organisms, properly
homosapiens, it focuses on the amount of chemical that
reaches a site in the organism as well as the ability of the
chemical to initiate a harmful effect at that site. The ‘target’
site (e.g. the liver) may not be identical with the initial
application site of the toxicant (e.g. the bloodstream). This is
known as intrinsic toxicity of the substance. It is commonly
observed that the concentration of chemicals at the internal
site of action is proportional to the intensity of the observed
toxic effect. Because the amount of chemical at the internal
site of action (e.g. lung tissue) depends upon the quantity of
chemical presented to the organism (e.g. its concentration in
air), exposure of the organism to the toxic substance is an
important consideration in predicting the intensity of the
toxic effect. It is not the only consideration, however.
Another important issue in chemical toxicity is the
chemical’s fate inside the organism prior to reaching its
internal site of toxic action. Toxicologists in their research
generally concentrate on the variables controlling chemical
toxicity in the organism itself. The type of chemical and the
degree of exposure of the organism (e.g. concentration,
exposure time) are typical variables in toxicological
experiments. In summary, most toxicological research
focuses on quantifying the response of the organism to
received chemical insult8 and does not as often address the
environment in which and through which that toxicant is
delivered. Ethical concerns associated with human exper-
imentation have led to the practice of using surrogate test
species (e.g. rats, mice, monkeys) to help characterize the
potential health hazard associated with exposure to toxicants
such as combustion by-products.
Nearly all substances can be considered toxic, for
example, O2 is toxic when concentrations are high and
times of exposure are long.9 Such qualifiers, though
important, cannot change the fact that it is not the toxicity
of compounds like O2 and air that causes concern, rather it is
a limited, specific subset of compounds that causes the
majority of injuries, incapacitations, and deaths. This review
8 The author is indebted to Professor L.J. Fisher, Director of the
Michigan State University Environmental Toxicology Institute and
Professor of Pharmacological Toxicology for this definition of
toxicological research.9 The famous quote of Paracelsus (1493–1541) embodies this
viewpoint: ‘All substances are poisons: there is none which is not a
poison. The right dose differentiates a poison from a remedy.’
I.S. Wichman / Progress in Energy and Combustion Science 29 (2003) 247–299 277
focuses on this subset of compounds, some of which were
already discussed in Section 4.1.
Active (non-smoldering) fires in transportation typically
exhibit times scales in the range of minutes to tens of
minutes, unlike building fires where time scales range from
tens of minutes to tens of hours. Overlap occurs, of course,
for very large vehicles like warships and passenger ships,
whose fire scenarios may resemble buildings more than
automobile accidents, but generally (even in the case of
ships) the emphasis is on immediate detection and rapid
extinguishment. The time scales also become large for
smoldering and thermal degradation events. Generally,
therefore, the time scales associated with transportation
fire safety should be an order of magnitude smaller than
those associated with building fire safety, particularly as the
size scale of the vehicle diminishes.
Real fires occur in regions where inhomogeneities
produced by flow and diffusive transport can influence the
nature and concentration of combustion by-products. The
products of degradation or combustion are often hot and
light so buoyancy can carry them away from their location
of origin rendering concentration fields of the chemical by-
products of combustion both transient and inhomogeneous
(see, e.g. the case study of Section 4.1.1). In an ordinary
room fire, for example, the gases are stratified in the lowest
approximation into a hot gas layer in the upper part of the
room, where the average temperature is O(1000 K), and a
cold gas layer in the lower part of the room, where the
temperature is much closer to 300 K. Firemen are taught in
their training programs to understand this fact, and to
respond appropriately. The non-homogeneity of a concen-
tration field is known to have a dramatic influence on its
flow behavior (particularly since density and pressure
gradients are involved) and the combustion behavior (if,
for example, the concentration of reactants depends on the
location). Although there has been some research on product
gas movement and dispersion in the context of fire hazard,
there has not appeared a systematic emphasis on this subject
analogous to research on flame propagation and fuel
degradation chemistry.
Since toxicants can be oxidized or transported in fires
away from their place of origin by forced or free convection,
the determination of ‘toxic hazard’ in terms of actual room
or external fire conditions is difficult. It is far easier to
produce a homogeneous test environment for laboratory
animals that are forced to inhale the gases that later appear
in their bloodstream and vital organs. The decay and change
of these measures is relatively slow, and animals exposed to
known concentrations of specific combustion by-products in
homogeneous testing environments can provide accurate
information on toxic effects (for the animals). Extrapolation
to the response of humans to similar homogeneous dosage
levels is both common and controversial [159], thus the
advent of the descriptor ‘selective toxicity’ as a measure of
the differential response between different types of animals
[160]. Recent research has shown that the toxicant uptake
differs between humans and surrogate species such as rats
and monkeys. The transport of the by-products of combus-
tion in non-homogeneous environments and in the nasal and
other passages of the animal species themselves is thus as
important, if not determining, part of their ultimate toxic
influence.
Two approaches to the transport of potentially toxic
combustion by-products have been followed in the research
literature. In one approach, the movement of the products
through the large-scale atmosphere is described with flow
models that seek to predict downstream effluent concen-
trations. The objective is to determine which regions
downwind of the source will be most severely subjected to
the products. In the other approach, the host is ‘exposed’ to
the toxicant, but the actual passage of the chemical from its
entry into the nasal passage to the lung surface is carefully
examined and modeled. Thus, Nikula et al. [161] demon-
strated that for equal exposures “…relatively more particu-
late material was retained in monkey than in rat lungs…” for
all groups tested. Their results, in which rats showed
significantly more inflammatory and other responses in their
nasal passages ‘…suggest that intrapulmonary particle
retention patterns and tissue reactions in rats may not be
predictive of retention patterns and tissue responses in
primates exposed to poorly soluble particles…’ Kimbell and
colleagues [162,163] have employed computational fluid
dynamics (CFD) methods to model inspiratory nasal airflow
in rats and monkeys with the objective of determining
whether nasal flow geometry and associated differences in
flow patterns may be partly responsible for these differences
of inhaled gas uptake. Kepler et al. [162] determine that
“…uptake simulations…compared with published observa-
tions…indicated a strong correspondence between airflow-
dependent transport patterns and local lesion sites.”
Additional details of the CFD simulations are provided by
Subramanian et al. [163] and references cited therein. These
authors state that “this model can be used to reduce
uncertainty in human health risk assessment for inhaled
materials.” The research generally questions the appropri-
ateness of employing certain animal species (e.g. rats) in the
assessment of toxicological influences on other species (e.g.
monkeys). The differences between rats and monkeys
suggest that toxicity assessments for primates may require
revised approaches.
Toxicological measurements often include such quan-
tities as times to incapacitation, staggering, convulsions,
collapse and death. According to Eaton and Klaassen [160]
“simply recording a death is not an adequate means of
conducting a lethality study of a new substance,” rather “a
careful, disciplined, detailed observation of the intact animal
extending from the time of administration of the toxicant to
the death of the animal.” Respiratory rates and other vital
organ responses (e.g. heart rate) may in some cases be
recorded to determine the pre-death influences of chemical
toxins. Histological examinations of possible abnormalities
in the animal’s major tissues and organs can yield additional
I.S. Wichman / Progress in Energy and Combustion Science 29 (2003) 247–299278
information about the nature of the toxic response
mechanism. Tissue damage and toxin concentrations can
be systematically examined, leading to the accumulation of
‘specific information about the events leading to the lethal
effect, the target organs involved, and often a suggestion
about the possible mechanism of toxicity at a relatively
fundamental level’ [160]. For example, the study by Farrar
and Galsten [164] assessed toxicity from material combus-
tion using various ‘toxicological endpoints.’ Two of the
endpoints were incapacitation and death (lethality). Others
included ‘post-exposure complications’ and ‘leg-flexion
avoidance response,’ which is a response to various
combustion products.
Specific types of observed response can sometimes be
used to help identify the specific toxicant to which the test
subject was exposed. Farrar and Galsten [164] state that
the exposure period (a crucial variable that must be
recorded in such toxicity tests) alone is insufficient for
determining which toxins were present, and that histologi-
cal examination was necessary to determine all of the
toxins. In their research on Long-Evans rats exposed (head
only) to the decomposition products (flaming and non-
flaming) of Douglas fir, phenolic foam, urea formaldehyde
foam (UF) and flexible PU foam, the material comparison
was based on the following five measures: (1) potency of
combustion product atmospheres, (2) animal observation,
(3) blood analysis, (4) gross pathology, (5) atmospheric
analysis. For (1), the EC50 (concentration of chemical in air
causing incapacitation in 50% of the exposed rats) and
LC50 (lethal concentration ¼ concentration of chemical in
air causing death in 50% of the exposed rats) values were
highest and approximately the same for Douglas fir and PU
foam. Under non-flaming conditions phenolic foam had
higher EC50 and LC50 values than UF, vice versa under
flaming conditions. A higher LC50 value means simply that
the dose (usually measured in units of moles of dose per
kilograms of animal body weight, i.e. mole/kg) that causes
50% lethality is higher, or the substance is comparatively
safer. See, e.g. Ref. [160] for an excellent description of
this particular dose–response evaluation method, where
many of its limitations are discussed. Specifically, they
note that it is generally ‘only necessary to characterize the
LD50 (lethal dose) (or LC50) within an order of magnitude
range such as 5–50 mg/kg.’ Greater differences between
these four materials of their incapacitating effects were
determined by the leg-flexion avoidance response than
EC50 and LC50. A concentration–response diagram (their
Fig. 1) showed that incapacitation caused by non-flaming
products was greater in UF followed (in order) by phenolic
foam, PU and Douglas fir. Large differences between
materials were observed in the COHb levels at time of
incapacitation, with the highest value for phenolic foam
followed by Douglas fir, PU and UF. The authors state for
phenolic foam that the ‘most valuable piece of information
was the determination of COHb levels…clearly implicating
CO as the intoxicating agent under the conditions of
the experiment.’ The authors determined that the incapa-
citating effects of UF foam, however, could be attributed to
HCN, not CO. For PU the situation was complicated by the
‘wide range of incapacitation times and low atmospheric
levels of CO and HCN at incapacitating doses.’ The
authors stressed the importance of lethality assessment,
particularly the ‘degree of involvement of CO in exposure
deaths’ in order to ‘preclude the involvement of additional
toxicants.’ They conclude that ‘a multi-component test is
required to detect the toxicity of an acknowledged multi-
component insult.’
Herpol [165] examined the toxicity of 35 building
materials using Wilson rats. Cessation of respiration was
employed to measure time of death from exposure to
products of decomposition for materials falling in the general
categories of woods, synthetic polymers, and textiles. Three
different combustion temperatures were used. Histological
examinations included measurements of COHb levels. The
author divides animal toxicological evaluation into two
groups: (1) simple methods using death, incapacitation, or
both as endpoints, (2) more elaborate methods using many
physiological parameters (e.g. electrocardiograms) and
behavioral characteristics. Methods for type (1) ‘seem
preferable in relation to the problem of acute toxicity’
whereas (2) seems ‘more appropriate in assessing long-term’
permanent damage in survivors. This particular research
gave priority to acute toxicity. The author concludes (1)
‘…toxicity results are extremely dependent on test con-
ditions, thus giving the general impression that any
combustible material will become dangerous because of
toxicity when placed in its own critical condition.’ (2)
Determining whether or not a material produces an ‘unusual’
toxic environment (as required by an ISO Technical
Committee in 1976 to study ‘toxic hazards in fire’) is
possible using present tests, but additional tests are
necessary. (3) Present (circa 1980) ‘state-of-the-art’ research
‘does not permit…establishing…well-founded toxicity
safety regulation for materials in buildings.’
Herpol and Vandervelde [166] developed toxicity
indices to express mortality rates as a function of time of
exposure. Twenty materials, including plastics, textiles, and
wood species were tested at 600 8C. The proposed mortality
index penalizes materials that produce earlier deaths when
compared with materials that give high mortality rates later
in the experiments, meaning that early mortality is weighted
less than late mortality. This may be important in building
fires (which the authors mention in their article), but for
transportation fires it may be valuable to weight early
mortality more than late mortality. Nevertheless, these
authors have suggested a means for carrying out the
weighting process.
Hilado et al. [167] showed that for numerous polymeric
combustibles the influences of pyrolysis gases on toxic
response could be quantified. The responses of the freely
moving mice were visually observed and they were recorded
over the entire test time, with specific attention paid to
I.S. Wichman / Progress in Energy and Combustion Science 29 (2003) 247–299 279

staggering, convulsions, collapse and finally death. Each of
these measures is carefully defined, and the time is recorded
of the first instance of such response. The authors used
different test conditions to simulate different fire situations,
with the intent of simulating pre-flashover conditions in a
developing fire, e.g. 200–800 8C rising temperature at
40 8C/min with no forced airflow. Various post-flashover
conditions were also simulated. Here the temperature was
fixed and a cross-flow of air was employed for all cases. The
specific gaseous toxicants arising as either pyrolysis
products or combustion products were CO, HCl, HF,
HCN, NO2, SO2 and NH3. The authors state that “In
contrast to the 8 h and longer exposures considered in
evaluating long-term toxicity in the occupational environ-
ment, exposure periods of less than 1 h, preferably 30 min or
less, are more relevant to fire situations because the time
available for escape and rescue is often measured in
minutes.” The authors further assert: “Specific toxicant
test data under the latter conditions, however, are meager
relative to data under longer-term exposures.” As noted in
this review that the time scales associated with transpor-
tation are perhaps even one order of magnitude shorter than
for homes and buildings. It was shown for tests at fixed
temperatures 300, 350, 400, 450, 500, 600 and 800 8C for a
PE polymer that generally (with only one exception at
350 8C, caused apparently by the release of acrolein) the
animal response times decreased with increasing
temperature.
The subject of fire-gas toxicity has been examined from
the standpoint of fire research and not simply as a branch of
Toxicology or Chemistry in the works of Babrauskas et al.
[168], Gann and Levin [169], Babrauskas [170], Babrauskas
et al. [171], Babrauskas [172]. We shall discuss these
articles in chronological order. In Ref. [168] the authors
discuss a ‘new approach’ to fire toxicity evaluations of fire
hazard, emphasizing the comprehensive nature of the role of
physical features of the fire, the building, the rate of smoke
production, the rate of smoke loss (e.g. from windows), and
occupant susceptibility. According to the authors, only
when all of these criteria are properly accounted for does a
complete fire hazard have logical meaning. We may
compare these physics/engineering-based criteria to con-
strained, head-only toxicity tests on mice and rats relying on
chemically based measures of toxicity. The work of Gann
and Levin [169] summarizes the previous methods of
measuring toxic potency while emphasizing numerous
issues that require study. According to this work “…direct
comparison of only toxic potency values is not a valid
means of determining the fire safety of materials and is not
sufficient for evaluation of fire hazard.” Babrauskas [170]
describes experimental techniques for the measurement of
heat, smoke, and toxic gas release from real fires. The need
for minimizing apparatus dependence is discussed, as are
differences between the data obtained from large-scale fire
tests and bench-scale tests. In Ref. [171] the NIST group
determined that the proper subject of smoke and fume
inhalation deaths is the post-flashover fire. In addition, the
authors discuss criteria for useful bench-scale toxic potency
measurements, their validation with respect to actual fires,
computational methods for correcting CO levels obtained in
real-scale post-flashover fires, and methods for interpreting
chemical data using the ‘N-Gas Model’ of Babrauskas
[170]. Much of this work is summarized in Ref. [172] in the
form of a model that amounts to a fire hazard analysis using
available test data. Examples of the use of the test data on
various products can be obtained from the National Bureau
of Standards Toxicity Test and from the cone calorimeter.
The method described here represents an attempt to ‘place in
correct context…the toxic potency and burning rate
variables.’ In terms of human hazard one cannot discuss
‘toxic hazard’ when the rate of removal of toxins (by
buoyancy-induced flows or forced flows) is comparable to
their rate of production. In other words, the first step of the
toxic mechanism, delivery of the toxicant [173], must be
carefully assessed before venturing into detailed evaluations
of neurophysiological biochemical response.
These works demonstrate that a characterization of
toxicity on the basis of qualitative and quantitative chemical
analysis is not only inadequate but may be misleading if
applied without an understanding of the larger problem of
which it is part. The implications for transportation are
clear: without knowledge of the specific conditions includ-
ing characteristic exposure times, temperature distributions,
concentration distributions and movements, ventilation
flows and air and oxygen delivery conditions, extrapolations
of toxicity in terms of simple head-fixed toxicity tests or
small-scale homogeneous chemical tests is, at best,
questionable.
4.2.1. PVC and fire-gas toxicity
For toxicants whose dose–response relationships are
well characterized (e.g. CO, HCN, HCl) it is not always
necessary to perform animal experiments to characterize the
toxic hazard associated with known concentrations of the
toxicant of interest. In such instances, toxicity evaluation
can be performed using measured toxicant concentrations
and known dose–response relationships. Such is the case for
many but not all of the following reviewed studies.
A compendium of the toxicity of individual gases such as
CO, CO2, reduced O2, HCN and two, three and four-gas
combinations of these gases was compiled for data taken
using Fisher 344 rats exposed for 30 min, observed over at
least 14 days [174]. The Center for Fire Research at NIST
has developed a model to predict the toxicity of these
compounds acting alone and in combination. Except for
CO2, the toxicity of mixtures of these gases appears to be
additive. The synergistic and additive effects of toxic gases
was apparent over nearly all times of exposure from 5 to
60 min. Most sublethal concentrations of individual gases
were lethal in combination, as has been extensively
discussed by Eaton and Klaassen [160] among others.
Briefly, the superposition of effect resulting from two or
I.S. Wichman / Progress in Energy and Combustion Science 29 (2003) 247–299280

more toxicants is not always linear, in fact some toxicants
may actually cancel one-another’s responses. In some cases,
however, they are additive as, apparently, in Levin et al.’s
[174] study.
The articles by Barrow et al. [175], Murrell [176] and
Huggett and Levin [177] studied specifically the toxicity of
PVC degradation products. Barrow et al. [175] tested live
Swiss-Webster mice exposed for 3–5 min in the head-only
configuration. The sensory irritation response (change in
respiratory rate) was measured and compared with similar
experiments using HCl. The PVC products were more
potent sensory irritants than HCl. Murrell [176] measured
the degradation products of PVC combustion and pyrolysis
(kiln temperatures ranging from 10 to 1000 8C in an air or
N2 flow of 100 ml/min) using gas chromatography (GC) and
GC–mass spectrometry (GC–MS). High yields of HCl
were measured, along with smaller yields of benzene,
toluene, xylene, indene, and naphthalene. A toxicity table
was constructed, which listed the toxicant concentration
products of degradation. Their anticipated influences on
humans were discussed and the duration of exposure to the
(potentially) toxic compounds was assessed. HCl was found
to be the most (potentially) toxic compound. It was followed
by chloromethane and HCN. Huggett and Levin [177] have
performed the valuable service of compiling the PVC
thermal degradation literature over 1969–1984 (in English
only). The complications entailed in such a compilation
were extensively discussed, and they directed attention to
the facts that (1) Pure PVC is almost never the sole material
tested in such experiments as it is always mixed with various
quantities of plasticizers and additives that ‘improve their
properties.’ (2) Methods of thermal decomposition vary
widely between studies, especially given the different
thermal and atmospheric conditions. (3) The type and
condition and time of exposure and other factors associated
with the test animals are extremely variable. (4) A ‘plethora
of methods for measuring responses have been employed,’
including the use of different endpoints and often non-
comparable units. Generally, the pyrolysis of PVC homo-
polymer reveals poor thermal stability even at 100 8C, with
HCl production rapidly increasing with rising temperature.
Dehydrochlorination in air and nitrogen had activation
energies of 151 and 174 kJ/mol, respectively. Approxi-
mately 70 compounds have been identified but among these
HCl is the principal toxicant. It is both a sensory and
pulmonary irritant. At 500 8C, fire retarded PVC is more
toxic than non-fire retarded PVC: toxicities were approxi-
mately equal in the 600–700 8C range.
4.2.2. Polymer decomposition and toxicity
We first discuss chronologically the types of toxic
compounds produced by polymer decomposition, then we
consider ABS decomposition, and nitrogen-containing
polymer degradation and toxicity.
The study of Wagner [178] presages some of the later
work such as Babrauskas et al. [168], Babramskar et al.
[171], and Babrauskas [170,172]. They determined that
additives, which may impart desirable mechanical and
thermal properties to polymeric products also generate
toxins when these materials are pyrolyzed under thermal
insult. Thus, it was thought to be simpler and more
systematic to examine virgin plastics with fixed and
known amounts of specific additives, in order to simulate
actual materials. A need was mentioned for a long-term
program to study the synergistic effects of the various toxins
produced when materials degrade under heating. Stark [179]
examines PVC and flexible PU foams along with other
materials, including cellulosics. The PVC results are
consistent with the later work of Murrell [176] and Huggett
and Levin [177]. Both PVC and PU can produce lethal
concentrations of toxic gases. PU smoke production
increased with fire retardant for foams burned in the open;
it decreased when burned in a compartment.
Michal et al. [180] examined PE and isotactic PP, which
are used in automobile parts, insulations, piping, and
industrial production. Small 50 mg samples were tested in
air and analyzed using GC and GC–MS. PE thermo-
oxidation produced aldehydes (48.2%), ketones (2.8%),
olefins (25%), and paraffins (11.9%). For PP, the principal
products were methylalkylketones (57.4%). For tempera-
tures up to 800 8C an increase of atmospheric O2 increased
the smoke production. The authors concluded that combus-
tion and pyrolysis of PE and PP did not result in the
production of ‘markedly toxic’ compounds, although small
amounts of toxic gases did arise, e.g. acrylic acid for PE,
crotonaldehyde for PP. The smoke had a high optical density
and thus was ‘rich in solids.’ Significantly, CO was not
measured by these authors. The products of PE pyrolysis
were listed in a table, whose columns include 71 combus-
tion, pyrolysis and thermo-oxidation by-products, their
‘toxicological comparison’ by the Marhold danger index,
critical concentration for shock exposure, and the physio-
logical danger (e.g. irritation, nausea, narcotic effect).
Another similar table containing 55 combustion by-products
was constructed for PP. The degree of actual danger
according to Marhold employs the following numerical
comparison scale: 9 ¼ HCN, H2S; 8 ¼ CO; 7 ¼ phosgene;
5 ¼ Cl; 4 ¼ ethylene oxide, carbon disulphide; 3 ¼ sulfur
dioxide; 2 ¼ ammonia; 1 ¼ methane. Note that CO, which
was not measured, is the second-most dangerous compound
on this scale.
The study of Hilado and Cumming [181] used two
toxicity test methods separately on two groups of animals
(Swiss albino male mice, Sprague–Dawley male rats). The
compounds tested were polycarbonate, PE, PS, and ABS
polymers. A general toxicity measure used time to
incapacitation or death. The results of the tests were
inconsistent. Nevertheless, Hilado and Cumming [181]
showed that fixed-temperature testing yielded the ‘more
rapid incapacitation and death.’ According to the authors,
the rising-temperature testing, ‘involves the time period
before the sample reaches its particular decomposition
I.S. Wichman / Progress in Energy and Combustion Science 29 (2003) 247–299 281

temperature, and provides an advantage to more thermally
stable materials because they evolve toxicants later in the
test.’ The authors conclude that relative material toxicity
rankings are ‘highly dependent on the test conditions and on
the choice of incapacitation or death as the criterion of
toxicity.’
A review of publications in English through 1984 on PE
products of decomposition, and their toxicity, appeared in
Ref. [182]. The principal influences on PE degradation are
temperature and oxygen availability of the surroundings.
The amounts of saturated and unsaturated HCs produced
rise as the oxygen content of the atmosphere rises. Toxicity
was evaluated by forming a correlation of animal response
time with product concentration level. Generally, oxidative
PE degradation produced fewer toxins than non-oxidative
degradation. CO was the ‘predominant toxicant’. Acrolein,
produced in non-flaming (non-oxidative) degradation, was
the next most significant toxicant. Non-flaming combustion
‘favored the production of acrolein and other irritant gases,’
whereas flaming combustion ‘favored the production of
CO2, hydrocarbons, and aromatics.’ In general, the authors
state that ‘polyethylenes are more toxic in the non-flaming
mode than in the flaming (mode).’ Consistent with our
discussion of toxic hazard assessment in real-fire conditions,
which include spatially and temporally variable concen-
tration fields, convection, buoyancy, and large temperature
variations, these authors state that “The only available
comparative study of full-scale versus bench-scale exper-
iments suggests that small-scale testing may produce
toxicity results which overestimate those found under full-
scale testing.” Consistent with Michal et al. [180], PE was
considered relatively ordinary with respect to toxicant
production under fire conditions. To compare [180]: “The
products (of PE, excluding CO) do not contain a markedly
toxic component,” [182]: “…the toxicity of the combustion
products (of PE) are not highly or unusually toxic.”
Another summary of the literature on the thermal
decomposition of various commercial and industrial grade
plastics is found in Ref. [183]. The seven most predominant
synthetic materials identified by the authors were ABS,
nylons, polyesters, PE, PS, PVCs and rigid PUs. Over 400
decomposition products are produced in their degradation.
Oxygen-containing polymers, such as nylons, polyesters,
and PU, produce CO and CO2, whereas ABSs, PUs, nylons
and PVCs with nitrogen additives produce nitrogen-
containing compounds like HCN. The conclusion was that
the decomposition products of these seven polymers were
‘not unusually toxic’ when compared with the toxicity of
other natural and synthetic materials.
Morikawa [184] examines the toxicity of numerous
polymeric compounds such as PE, PP, PMMA, nylon-6,
PAN, PU and hemlock spruce wood. Toxicants analyzed
were CO, HCN, HCl, acrolein, formaldehyde, and NOx. As a
general rule, the author’s total toxicity index, Ci=Cif (Ci ¼
concentration of component i; Cif ¼ lethal value at 5–
10 min exposure), increases with degree of completeness of
combustion. Of the three fire hazard threats, toxicity,
oxygen deficiency and heat, the most important threat
(compared on the basis of a total toxicity index) was stated
to be toxicity followed by heat and oxygen deficiency. The
author employed small-scale tests in his research.
Finally, Larsen et al. [185] examined the toxic effect of
11 substrate plastics with and without various metallic
coatings on unrestrained male NIH Swiss mice subject to
30 min exposure. The ‘most toxic materials’ belonged to the
ABS family, and uncoated PE (note the contrast with Michal
et al. [180] and Paabo and Levin [182]). In the animals that
died with exposure, the materials that produced the most
toxic product gases also produced the most severe lung
damage. In most cases, toxicity correlated with amount of
CO and CO2 produced. Comparison tests with restrained
mice showed that the lethality index LC50 was ‘significantly
greater for unrestrained mice.’
Rutkowski and Levin [186] reviewed the literature of
ABS degradation and toxicity. ABS decomposition had
been studied in both inert and oxidative atmospheres, and in
various temperature ranges. Toxicity was evaluated using
the following fire test methods: NBS (National Bureau of
Standards, now NIST), UM (Univ. of Michigan), PITT
(Univ. of Pittsburgh), DIN 53436 (West Germany) and USF
(Univ. of San Francisco). The general results showed that
CO and HCN were the principal toxicants. Overall ABS
toxicity was found in this review to be comparable to
materials such as Douglas fir.
Sumi and Tsuchiya [187] examined exclusively nitro-
gen-containing polymers. The materials examined included
acrylic fiber (AF), nylon-6 (N), wood (W), urea-formal-
dehyde foam (UFF), and rigid urethane foam (RUF).
Decomposition gases were analyzed for CO, CO2, and
HCN. A toxicity index similar to the Morikawa [184] index
but extended to 30 min exposure showed that the toxicity of
HCN was up to 55 times greater than that due to CO for AF,
five times greater for N, eight times greater for W, 26 times
greater for UFF and identical for RUF.
4.2.3. PU foam toxicity
PU foam toxicity is addressed in this section. The
earliest studies [188–190] were concerned primarily with
determining whether or not toxins of sufficient quantity
were generated by PU thermal decomposition. Hilado and
Schneider [188] and Hartung et al. [189] showed that the
decomposition products were indeed toxic, but that
unusual toxic gases were not produced in real-fire
conditions. Herrington [190] used the Ohio State Univer-
sity Heat Release Apparatus to measure the levels of CO,
HCN and unburned hydrocarbons released. Different
ventilation rates were found to alter the toxicant
generation rates. Subsequent studies [191–196] distin-
guished between rigid and flexible PU foams, and
quantified the earlier work. When animals were used
[192,193,196] the LC50 test protocol was employed.
Hartzell [195] did not use the LC50, instead he examined
I.S. Wichman / Progress in Energy and Combustion Science 29 (2003) 247–299282

the irritant capability. The principal toxicants released
were CO and HCN [192–196]. Prager et al. [196]
concluded that death in the test rats occurred from CO
inhalation, while HCN had no significant effect. This
contrasted with Levin et al. [191] in which it was asserted
that deaths could not be attributed to either CO or HCN
alone. The work of Levin et al. [192] suggests an additive
effect for CO and HCN. This work was followed up [193]
in an attempt to simulate ‘real PU fires’ in which the
combustion stage is preceded by a longer interval of
smoldering. Paabo and Levin [194], essentially a rigid-PU
literature review, concluded that (1) Rigid PU foam
toxicity was essentially not dependent on the specific
foam type; (2) Flaming PU was 2–3 times more toxic
than non-flaming PU; (3) Addition of flame retardants did
not significantly alter combustion product toxicity. Hart-
zell [195] added that in the case of both flaming and non-
flaming combustion for rigid and flexible PU, the smoke
toxicity levels were ‘average’, whereas for the flaming
combustion of rigid PU the smoke toxicity was ‘slightly
higher than average.’ Thus, in flaming combustion, rigid
PU smoke appears to be more toxic than flexible PU
smoke. Prager et al. [196] showed that under ‘developing
fire conditions’ the acute toxicity of flexible PU was lower
than that of flame-retarded cotton, wool, wood, and other
upholstery materials.
Research discussed previously (Sections 2.3.2, 3.3 and
4.1) suggests that the products of combustion released into
the gas are greatly reduced when a char layer forms on the
PU. Charring and its promotion therefore appear to have
fire-safety value.
4.2.4. Toxicity of fire-retarded materials; toxicity of foams
and fabrics; influences of heating rates on toxicity
The toxicity of fire-retarded and unretarded materials
was examined by Herpol [197] and Petajan et al. [198].
Herpol [197] examined samples of 35 materials including
woods, synthetics, and textiles, which were burned for
30 min at 500, 600 and 700 8C with effluents analyzed for
CO, CO2; in addition, O2 and COHb determinations were
made on the test animals. The only parameter that was
changed was temperature. The author concluded that
“…(flame retardant effect on) toxicity has been proven to
be variable depending both on the original material and on
the applied treatment.” Also, ‘…this…suggests that pre-
dicting toxic characteristics of a material without submitting
it to a series of tests in different conditions is impossible.’
Thus, the authors demonstrate that it appears difficult to
state general trends, even though some materials showed
improved ignitability resistance (with enhanced toxicity)
when treated with fire retardants.
The research of Petajan et al. [198] compared fire-
retarded and non-retarded materials. Among these was PU
foam, which was fire-retarded with O–O-diethyl-N, N-bis-
(2-hydroxyethyl)-aminomethyl phosphate. Exposure to
untreated PU combustion by-products produced mild
to moderate COHb level elevations, whereas treated PU
combustion by-products produced seizures whose severity
and frequency in Long–Evans rats increased with exposure
time. The authors postulated that seizures were caused by
bicyclic phosphate formed during the thermal decompo-
sition of the fire retardant. Only very small quantities were
needed to produce seizures. Because such compounds are
usually not detected by conventional gas analysis tech-
niques, the authors concluded that toxicity tests must
employ chemical analytical methods coupled with biologi-
cal tests.
The toxicity of foams and fabrics of common commer-
cial use were examined by Hilado and Cumming [199],
Braun and Levin [200], and Hilado [201]. Hilado and
Cumming [199] examined 270 materials under conditions of
gradually rising, then fixed, temperature to simulate a
developing fire. Wool, silk, and polyester fabrics were the
most toxic. The relative material rankings were unchanged
despite changes in test conditions and test material. Braun
and Levin [202] examined aliphatic polyamides (nylons).
The results were compared to earlier research on other
materials, showing that the combustion products of nylon
were less toxic than cotton and rayon, although the toxicity
of nylon combustion by-products was approximately
the same as for most other polymeric materials. In Ref.
[200] the same authors examined polyesters, finding that
temperature and atmosphere were the principal influences
on toxicity. The LC50 values for flame-retarded polyester
combustion by-products were in the same general ranges as
those for commercial materials and non-flame-retarded
polyesters. Assorted fabrics and flexible PU foams with and
without flame retardant additives were examined by Hilado
[201] to ascertain the relationship between heating rate and
relative toxicity. There were no consistent observed trends
between samples characterized by varying flame retardants,
foam densities, and heating rates. The relative toxicities of
tested materials’ combustion by-products were, in decreas-
ing order, PVC, wool, Nomex, and urethanes.
Hilado et al. [203,204] also examined the influences of
heating rate on the release rates of potentially toxic
combustion by-products. Hilado et al. [203] showed that
some materials (PE and PC polycarbonate) released more
toxic gases at ‘intermediate’ (600 8C) than ‘high’ (800 8C)
temperatures. Perhaps some of the toxicants are oxidized at
higher temperatures. Some materials such as ABS appeared
insensitive to different heating schemes. Hilado et al. [204]
conducted two series of tests, one constant at 800 8C, the
other starting at 200 8C and incremented by 40 8C/min. until
800 8C. Greater quantities of toxic gases were produced
under fixed temperature conditions. This result contradicts
Hilado [201] where there was no apparent trend with
variable heating rate. Here the heating rate is varied between
two plausible limiting cases (a successive ramp-up and an
impulsive one-step ramp) with the latter apparently produ-
cing more toxicants.
I.S. Wichman / Progress in Energy and Combustion Science 29 (2003) 247–299 283

4.3. Smoke and retardants
One method of reducing fire hazard is to add chemicals
to the test material in order to render the products of thermal
decomposition as innocuous as possible. The fire retardancy
literature review [1] considered test materials composed of
fire-retarded synthetic polymers. Most of this review
addresses the measured influences of fire retardants such
as halogens (e.g. chlorine, fluorine or bromine), intumes-
cents, and phosphorous, on the fire performance of various
materials, such as PU foams, polyolefins, and
chloroparaffins.
The studies of Guyot et al. [205], Smith [206] and Purser
[207] address PVC ‘smoke performance.’. Guyot et al. [205]
examined additives for their effect on smoke production.
They determined that certain additives: (1) Resisted char
residue volatilization; (2) Decreased benzene emissions,
which reduced smoking; (3) Increased flammability and
smoke production through their mutual synergism (plasti-
cizer additives). Smith [206] compared PVC smoke
production with smoke production from other common
materials. A smoke parameter evaluation demonstrated that
PVC occupies the low end of the smoke spectrum, only
above PC. This behavior was attributed to the low RHR of
PVC. Hirschler and Purser [207] examined the irritancies of
numerous PVC compounds common in wire coatings. The
degree of irritancy was greater than could be accounted for
by the relatively low HCl quantities detected. The authors
postulated that the incremental irritancy was caused by ‘free
radicals.’
Methods of fire retardance in common polymeric
substances include chemical addition of various retardant
substances during processing. These retardants are intended
to reduce the tendency to burning, smoking, and toxicant
volatile production. One such group of five elements are the
halogens (fluorine, chlorine, bromine, iodine, astatine). The
work of Brauman and colleagues in the mid 1970s discussed
“substrate interactions in degrading Sb2O3–halogen sys-
tems and the general mode of action of Sb2O3–halogen fire
retardance. In Sb2O3-chlorinated wax (CW) combinations,
the major volatile products are the known flame inhibitors
Sb2Cl3 and some HCl, along with H2O, which chemically
and possibly physically inhibit the flame.” Brauman et al.
[208] examined the following additives to the polymers PE,
PP, PS, Impact PS (ImpPS), PVC and other compound
mixtures: Sb2O3: a chlorinated wax (CW) containing
71.91% Cl; Dechlorane Plus 25 (an adduct of perchlor-
ocyclopentadiene and cyclooctadiene); antimony oxychlor-
ide; Sb2Cl3; carbon black. Burning rates were studied in
three configurations: the driven rod, a high thermal mass
puddle, and a low thermal mass puddle. When the
compound materials charred at lower temperatures, their
burning rates decreased. But when ‘the temperature is
sufficiently high…the rate of fuel production can become
sufficient to sustain combustion, even if some char is
formed.’ For some materials the rate of flame spread
decreased (PP, PS, ImpPS). The ‘general effect of Sb2O3–
halogen fire retardance…(depended)…on (whether the
process being measured was) ignition, fire spread, burning,
extinction, or smoke generation.’ The ‘results confirm’ that
‘added Sb2O3–chlorine…promotes extinction and limits
fire spread.’ For burning and ignition, ‘Sb2O3-chlorine can
have a beneficial or detrimental effect, depending on…test
conditions and sample types.’ They concluded that under
some conditions ‘Sb2O3-chlorine can…promote fuel (vol-
atile) production…’ and that ‘If the environment is hot
enough…Sb2O3–CW will react with most polymers…to
promote (their) decomposition, often resulting in increased
weight loss or fuel production.’ Thus, the fire retardants
described here appear to be more effective at lower
temperatures.
The work of Harris et al. [209] used the cone calorimeter
to demonstrate that various non-halogenated compounds
were more effective than halogenated compounds at fire
retardancy. They reduced the amount of mass consumed,
as well as PRHR, THR, EHOC, and the amount of smoke.
The halogenated retardants, by contrast, increased smoke
production and CO yield, and produced the acid-gas irritants
HCl and HBr.
Another group of materials used for fire retardance is
intumescent materials. Their mechanism of action is entirely
different from that of chemical fire retardant additives
described above. Upon heating, intumescent materials form
internal gas bubbles and swell, thereby restricting outward
mass transport from the interior of the heated material.
Certain intumescents also form external carbon layers (i.e.
char) at the surface to inhibit subsequent surface decompo-
sition. Ballisteri et al. [210] demonstrated, however, that an
intumescent PC was not self-extinguishing. The review of
intumescents provided by Camino et al. [211] discusses
desirable and undesirable properties of intumescent
materials. Among the latter is an exothermic intumescent
reaction. This limits the value of the additive compound.
The tendency to form char in a surface layer is a positive
feature, for it acts as a physical barrier against heat
transmission and oxygen diffusion, thus preventing further
in-depth pyrolysis to volatile combustibles. This preventa-
tive mechanism may extinguish the flame by decreasing the
supply of fuel volatiles for gas-phase combustion. The
authors concluded that the effectiveness of various intumes-
cence-promoting additives was ‘inadequate’ to justify their
general use.
Myers et al. [212] examine the use of ammonium
pentaborate (APB) for PUs, finding it an effective additive
for providing a thermal barrier, although its drawbacks are
its lack of high-temperature stability and water solubility.
However, these were considered minor compared with its
advantages.
Another class of flame retardants is chloroparaffins
(CP) [213–216]. Camino and Costa [213] demonstrated
that CP inhibited oxygen use during combustion. The
authors state that “in addition to the flame poisoning effect
I.S. Wichman / Progress in Energy and Combustion Science 29 (2003) 247–299284
of HCl evolved by the CP, the solid phase
effect…result(s) in a less flammable fuel being supplied
by the thermal degradation of PP burning in mixtures with
CP.” In other words, the volatiles produced and provided
to the flame also contribute to the flame retardation effect
of the CP additive. The HCl ‘poisons’ the combustion
reaction sequence by suppressing the branching step
H þ O2 ! OH þ O. The authors employed an oxygen
index (OI) defined as the percentage of oxidant in an
O2-N2 mixture that sustained the flame over molded rod
specimens over 30 s, and they noted generally that
saturated HCs such as methane, ethane, propane, etc.
have higher OI than unsaturated HCs such as ethylene,
propylene, etc. Their experiments suggest that the CP
additive causes a higher production of the saturated HCs
in the volatile products. Since these require more O2 for
their consumption, the fire retardant effect is enhanced. A
companion study by Camino et al. [214] suggested that
under some conditions the PP–CP compounds produced
greater quantities of volatiles, some of which were highly
reactive at room temperature. The ‘competition’ pathways
between two volatilization mechanisms of PP (one to light
HCs formed by chain end radicals, the other to longer
chain fragments formed by radical scission) are ‘shifted in
the presence of the CP,’ forming primarily through
the second mechanism. Thus, although a smaller quantity
of light HC volatiles (modified in composition) is
produced in the thermally degraded PP–CP blend, an
increase in the quantity of high boiling point chain
fragments is measured, ‘possibly due to interactions
between the evolving HCs and the charring CP.’ A
similar pair of companion studies was later published by
the same authors for CP–PE combinations [215,216],
though in the former they also examine CP–PP and CP–
PS combinations as well. The CP–PP blend was the only
combination that produced a gas-phase ‘flame poisoning’
flame-retardant response. However, consistent with the
mechanism described by Camino and Costa [213] a
condensed-phase influence of CP was observed for PE, PP
and PS. This suggested that chlorinated additives might
possibly produce a condensed phase method of fire
suppression that is more effective than gas-flame poison-
ing. Costa and Camino [216] examined the thermal
degradation modifications of CP-PE mixtures. For the
CP–PE mixture, 90% of the total weight loss was by CP
volatilization, which rendered the PE insoluble. Since the
gas-phase retardancy of CP in PE was poor, its primary
influence was to act as a heat sink for the gas-phase flame.
This additional heat loss from the flame could weaken or
perhaps extinguish it.
The fire retardant influences of phosphorus (P) additives
on various synthetic polymers is described by Brauman
[217], where it is determined that P-additives work in both
condensed and gaseous phases to decrease combustion.
These P-additive retardants are acid precursors, which act
primarily in the condensed phase to decrease heat evolution,
fuel production, and also increase charring.
Flame retardance was also examined for various
standard commercially common materials such as PU
foams [218–221] and polyolefins [222,223]. Benbow and
Cullis [218] review the (then) three most common PU
foam flame-resistant treatments. These are (1) Inorganic
salts like calcium and magnesium ammonium phosphate,
which form a ‘protective coating…during burning and
thus a barrier between…flame and…fuel-source’; (2)
Alteration of the PU structure, such as by forming a
‘nonburning rigid foam…’; (3) Organic flame retardants
containing P, Cl, Br, or halogens. They focus on (3),
suggesting that possible mechanisms causing retardance
include: (1) phosphoric acid formation, which prevents
normal fuel species formation in the degraded PU, (2)
volatilization of nonhalogenated P-esters to ‘blanket’ the
reaction, (3) catalysis of depolymerization leading to
dripping and running with heat loss from the combustion
zone, (4) volatilization of halogenated P-esters to yield
hydrogen halides, an effective group of ‘flame poisons.’
Three additional reasons were presented why tris(2,3-
dibromopropyl) phosphate and tris(2-chloroethyl) phos-
phate are more effective than suggested by (4) above: (1)
catalysis of surface charring, (2) flame retardant action of
phosphoric acid [217], (3) chemical incorporation of P and
halogen into the PU structure. In general, this article
demonstrates that PU flame retardance can be significantly
altered by chemical additives, in agreement with Bon-
signore and Levandusky [220] and McBrayer [221].
Hilado and Damant [219] treated various PUs with
retardants (antimony trioxide/PVC, brominated organo-
phosphate). The flame retardants hindered ignition,
produced acceptable smoke densities, resisted flame
spread, and produced fewer toxic gases. Similar results
were obtained by Bonsignore and Levandusky [220] using
hydrated aluminum in rigid HDPU (high density). Some
samples also added calcium carbonate and dimethyl
phosphate (DMMP). It was found that smoking decreased,
flame resistance increased, aluminum trihydrate outper-
formed calcium carbonate, and DMMP accentuated flame
resistance and smoke decline. Finally, McBrayer [221]
demonstrated that the improvements in PU flame retar-
dancy obtained by treatments with various commercial
compounds (FIREMASTER LVT-238, PHOSOGARD
2XC20, THERMOLIN 101, BROMINEX 257) were
only slightly degraded by accelerated aging. Most of the
PU foams showed almost no reduction of their capacity
for fire retardancy with accelerated aging.
Polyolefin flame retardance is described by Handa et al.
[222] and Rychla and Rychla [223]. The retarded PP
behavior depends upon the retardant’s reactivity with Sb2O3
at high temperature, coupled with the interaction between Br
release and thermal degradation [222]. Also, the formation
of HBr produced lower burning rates at higher temperatures.
The latter study shows that for flame retarded polyolefins,
I.S. Wichman / Progress in Energy and Combustion Science 29 (2003) 247–299 285

ignition delay and the ignition temperature decreased
relative to unretarded samples. Their theoretical model
supported this conclusion.
It is difficult to distinguish between inhibition, suppres-
sion, and flame retardancy. Some clarification occurs when
inhibition or suppression is defined with reference solely to
gas-phase reduction of flaming [224]. This suggests the
possibility of injection of flame inhibitors or suppressants
from sources distinct from the decomposing fuel source
itself. A reliable distinction is the following: in fire
retardancy the flame above the material that feeds it must
be weakened by the evolution of chemical additives in the
material itself, whereas flame inhibition or suppression
incorporates external sources of fire retardant which do not
necessarily originate in or near the material closest to the
fire.
The GM/DOT literature search did not address inhibition
and suppression in detail. Two publications describing fire
suppression in engine nacelle fires in aircraft have appeared
[225]. These publications are extensive (over 400 pages)
and provide detailed compilations of previous and currently
active research on the problem of fire suppression in
confined geometries. Also, inhibition flame chemistry is
described in detail, as are numerous technical and
technological aspects of such fires.
5. Vehicle fires
This section is divided into separate discussions of
references for four types of vehicles. These are (1) buses, (2)
railway and subway cars, (3) aircraft cabins, and (4)
automobiles, light trucks and heavy trucks.
5.1. Buses
In one of the earliest studies of school bus fire safety
conducted at the National Bureau of Standards (NBS, now
NIST) in the mid-1970s, it was determined from three full-
scale tests and small-scale laboratory tests that a variety of
ignition mechanisms are possible [226]. These ignitions all
originate at or near the seats, arising from (1) paper trash on
a seat, (2) newspaper under a seat, (3) lighter fluid on the
seat. Fire growth and spread in the bus occurs mostly
through involvement of the seat cushioning, spreading from
seat to seat with little apparent involvement of other interior
materials. Additionally, within a few minutes after seat
cushion (urethane) ignition, dense smoke filled the bus and
greatly reduced the visibility. The study suggested that the
burning characteristics of individual seats has the greatest
influence on the burning of the bus interior. Thus,
flammability and fire-retardant studies of seat materials
seems warranted.
The study of Braun et al. [227] examined six seat
assemblies using small scale tests (cone calorimeter, LIFT,
and NBS Toxicity Protocol). Large-scale tests (Furniture
Calorimeter) were additionally conducted on single seat
assemblies. Full-scale tests were performed on a simulated
2.44 m wide £ 2.13 m high £ 8.23 m long bus enclosure
with three seat assemblies. The ignition sources were 50 and
100 kW (large scale) and 100 kW (full scale) burners. The
small-scale tests could not predict the full-scale fire
behavior. Based on the full-scale tests, a general full-scale
test protocol for seat assembly evaluation was developed. It
combines testing in an enclosure with an analysis that
determines the time at which burning becomes ‘untenable.’
The procedure describes conditions for toxicity testing, and
procedures for instrumentation and material orientation are
explained.
A report summarizing and updating school bus safety
activities at NHTSA is provided in a USDOT report on
School bus safety [228]. This report describes congressional
mandates and NHTSAs actions to improve school bus
safety, including human behavior and motor vehicle safety
performance.
5.2. Railway and subway cars
A Metrorail subway car mock-up interior was ignited
and smoke density, heat flux, temperature and gaseous
products were examined [229]. The interior materials were
primarily plasticized PVC, acrylic PVC, and PU. Ignition
was achieved [226] by lighting a newspaper or paper bag on
a seat, or a newspaper against a wall. Presumably, the mode
of ignition was not an important variable. Some trials
subjected three Wistar rats to the fire in order to measure
toxicity effects. CO and CO2 production rates were
measured as a function of temperature. Other experimental
data indicate that: (1) HCl concentration was below the
detectable 50 ppm limit, (2) HCN was present due to PU and
the acrylonitrile in PVC, (3) PU combustion caused loss of
balance of the rats in rotating cages, apparently from their
elevated CO and HCN exposures as inferred from their CO
and HCN blood levels.
An assessment of the San Francisco Bay Area Rapid
Transit (BART) subway cars was made by Braun [230].
Upon analysis of the car’s interior and exterior design, five
recommendations were made that, once implemented, might
improve passenger safety by diminishing fire hazard.
Among these suggestions were urethane seat assembly
upgrading and development of a fire detection system
appropriate to rapid rail transit vehicles.
Rakaczky [231] provided a literature review of the
flammability characteristics of materials either in use, or
potentially in use, in rail passenger cars. Characteristics of
interest included the main fire safety measures described in
this review, including toxicological influences of combus-
tion products. The information thus compiled was meant to
assist the Federal Railway Administration (FRA) and the
DOT in establishing rail passenger car material flammability
safety standards. Miniszewski et al. [232] studied
I.S. Wichman / Progress in Energy and Combustion Science 29 (2003) 247–299286

the feasibility and cost effectiveness of the use of heat/
smoke/fire sensors and automotive extinguishing systems in
rail transit vehicles. The major rail transit lines were
surveyed for their fire experience, the available hardware
was surveyed, and placement and cost effectiveness were
described. A testing program was outlined.
Since rail transport in Europe is more extensive than in
North America, Kaminski [233] surveyed fire research and
fire practical experience for European railways, including a
summary of causes of fire, fire characteristics and European
fire protection strategies. Test methods for various railcar
materials were described, techniques for smoke emission
measurement are outlined, and ignitability and surface flame
spread were described. The British full-scale ‘Phoenix’ test
facility was described. Detailed drawings of the facilities
and test apparatuses were provided in the report. A
discussion of transit undercar fire detection and suppression
is found in Ref. [234]. Electrical cable fires may originate in
the undercar area, after which rapid and dangerous upward
spread of smoke and flame may occur. This report includes
results of a laboratory test program using an instrumented
motor control-group box for a New York City Transit
Authority (NYCTA) transit car. A report was provided by
the FRA’s [235] updated guidelines on performance of
materials (flammability, smoke emission, etc.) in new or
rebuilt rail passenger cars. These guidelines are similar to
the Urban Mass Transportation Administration (UMTA)
recommendations to the rapid transit industry.
Peacock et al. [236] present a comparison of approaches
used in the United States, Germany and France for assessing
the influences of vehicle design, material selection, detec-
tion/suppression systems, and emergency egress on fire
safety. They suggest that science-oriented fire policy
dictates the rational use of fire hazard and fire risk
assessment methods, which are supported by measurements
based on RHR.
A recent area of emphasis in the transportation industry is
the construction and use of large-scale wind tunnels in the
automotive and aerospace industries. For example, Aiolos
Engineering Corporation designed and managed the con-
struction of the Ford Environmental Test Laboratory (ETL)
in Dunton, UK. The facility contains an altitude/climatic
wind tunnel, a climatic wind tunnel, a cold start and drive test
cell, and an altitude/climatic chamber. The test sections
(where the vehicle is placed and tested) are capable of
simulating driving environment ranging from arctic to
tropical conditions, and from the low to high altitudes. The
test sections are large enough to accommodate cars, light
trucks and four-wheel drive vehicles. Wind tunnels can, in
principle, be built to accommodate buses and railroad cars,
although the author is not aware of any such facilities. It is
also not clear whether such large-scale facilities can be used
for burn tests or the simulation offire ignition and spread. The
closest facility of which the author is aware is the full-scale
building fire simulator being constructed at the University of
Waterloo. In this facility, a full-scale two-story house can be
equipped (fire-loaded) and then burned inside a second,
larger facility through which a controlled flow is passed.
Instrumentation is used to track the fire progress. Facilities
such as these are costly, thus they require a commitment to
their financing and use.
5.3. Aircraft cabins
Aircraft cabin fire research has been sponsored by the
FAA and NASA. The problem of aircraft fire safety is
complicated by the absence of easy egress. In this feature,
aircraft safety has much in common with submarine fire
safety, ship fire safety and spacecraft fire safety. The latter
three vehicle types are not considered in this review. Haley
et al. [237] examined the development offire resistant aircraft
interior materials. The thermoplastics that can be considered
in the design must be suitable for compression molding,
injection molding and thermoforming. The promotion of
‘pilot plant polymers’ by various chemical companies was
encouraged. Preliminary toxicity data were gathered by
the NASA Ames Research Center. Dokko and Ramohalli
[238] described the thermochemical modeling of aircraft
cabin fire safety. The research was directed mostly to the
performance of carpets and seat cushions with the objective
of predicting burning rate as a function of material property
values, geometry, and heat flux. It was determined that (1)
condensed phase degradation of the polymeric material is the
rate-limiting step of the overall process (Sections 2.2 and
3.2); and (2) diffusion and mixing of the pyrolysis products
with air is the rate-limiting step of vapor phase combustion
(Section 3.2). (3) Certain materials like carpet cannot burn on
their own but require augmentation by an external radiation
source or another burning surface. Global zone models for
aircraft cabin fires occurring in flight or crash were developed
by Delichatsios [239]. Simple-to-use expressions were
derived for wall burning, flame heights and flame spread
rates. Material properties controlling flammability were
identified. Radiation and charring were discussed, as well
as gas flows along aircraft ceilings.
More recent work on aircraft fire safety has focused on
practical means of addressing specific, often perception-
driven issues related to fire safety.10 Reynolds and Porter
[240] and Garner [241] examined the CWSS (cabin water
10 We excerpt the following quote from NASA TM-1999-209198
‘Microgravity Combustion Research: 1999 Program and Results,’
Friedman, R., Gokoglu, S.A., and Urban, D.L. (Eds.): ‘An
immediate concern of aircraft fire safety is that of the hazards of
the onboard aviation fuel. Two fire scenarios are possible: in flight
tank fires and post-crash spilled-fuel fires. These are very rare fire
events, but they are extremely feared and well publicized when they
do occur.’ For the first scenario, research ‘contemplated or in
progress includes…’ studies of ‘fuel flammability properties, such
as minimum ignition energy, flammability limits, and flash point, as
functions of fuel properties and aircraft tank designs and dynamic
conditions.’ Research proposed for the second scenario ‘includes
basic studies of so-called ‘fire-safe’ fuels…’
I.S. Wichman / Progress in Energy and Combustion Science 29 (2003) 247–299 287

spray system) proposed to increase passenger evacuation
and survival time following an accident. Disadvantages of
CWSS were described in the former study including
potential evacuation delays, ‘common cause failure’ in
redundant fire safety systems, physiological problems for
passengers, high cost of refurbishment following inadver-
tent discharge, and potential to negatively influence other
safety systems. The latter study addressed the physiological
damage that may occur to the respiratory system, with the
goal of estimating the risk posed by a ‘more hazardous cabin
environment by activation of CWSS.’ The activation of
CWSS can potentially produce a small volume within the
aircraft cabin that would experience an increase in heat
content, which could result in ‘thermal injury’ to the
respiratory systems of nearby passengers. Tapscott [242]
summarized various fire suppressants, their properties, and
their applicability in aircraft. Certain classes of agents were
recommended for use in test protocol development. A
similar study was carried out by Reinfurt [243] on Halon
replacement in aircraft fire suppression.
5.4. Motor vehicles
Studies dealing with motor vehicle fires as a whole
vehicle in a systematic, scientific manner are largely absent
in the available public literature. The motor vehicle fires that
are of most interest because of the potential for enhancing
injuries are post-crash fires. It is generally easy for
occupants to exit a vehicle in the event of a non-crash fire.
In the US approximately 1250 annual crash fatalities
involve fire. In these accidents, the fire is not necessarily
the cause of fatality. The percentage of fatal car accidents
involving fire is approximately 2% of all fatal car crashes.
The Federal Motor Vehicle Fire Safety Standard 301
Fuel System Integrity test (FMVSS301) has been used as a
benchmark for evaluating automotive safety by Reinfurt
[243], Flora and O’Day [244] and Parsons [245]. Of the 50
states covered by this Federal Standard, only the data from
certain individual states could be statistically analyzed in
each study (e.g. only Illinois and Michigan in Ref. [244],
only five states in Ref. [245] with primary emphasis on
Michigan). The FMVSS301, according to Parsons [245], is
“a death and injury reduction Standard which includes
requirements on the limits of leakage from the fuel tank,
filler pipes, and fuel tank connections during and after
30 mph frontal barrier crashes.”
Flora and O’Day [244] examined police accident data to
estimate the influence of FMVSS301 in real crashes.
Passenger car and light truck fire rates were estimated as
1.5 and 2.4 per thousand crashes. The Standard appeared to
produce reductions in fuel leakage from crashed vehicles.
Parsons [245] stated that FMVSS301 has (1) ‘significantly
reduced post-crash fires’ in car crashes, (2) the reduction in
(1) has resulted in ‘400 fewer fatalities and 520 fewer serious
injuries’ in the United States per year, and (3) the Standard
has increased the annual consumer vehicle cost by $850
annually.
Tesmer [246] carried out a more detailed statistical study
of fire occurrence in fatal and less serious crashes.
Particularly helpful to this study was the fact that the
Michigan policy accident report (PAR) collected data on
fuel leaks, which were used to estimate the statistical
relationship between fires and fuel leaks. The work of
Mowrer et al. [247] indicates that even though truck fires are
rare, they are often lethal, especially for heavy trucks. The
study addresses various physical and chemical aspects of
truck fires and discusses the breach vulnerability of various
truck fuel components. Berkowitz [248] concluded that
motor vehicles have remained in operation longer and have
been driven further than previous estimates had indicated.
This may influence their fire performance.
As explained in Section 1, the GM research program on
fire safety of automobiles included simultaneous research
efforts in numerous disciplines. These included occupant
crash dynamics; biological response (e.g. head and neck
injuries); numerical simulation of crash, heating, and
burning; heat generation underhood and its transmission to
the passenger compartment; ignition of materials; chemical
composition of common vehicle materials; and so on. This
research, which spanned the five years between 1995 and
2000, has been assembled at the NHTSA (Department of
transportation, DOT) website, at http://dms.dot.gov. The
‘GM Docket’ is found by entering ‘simple search’ and then
typing the last four numerical reference digits of the docket,
namely 3588. The GM Docket contains 200 articles, letters
and reports written during this 5-year research project.
Attention is focused in the following discussion on articles
1, 70, 77, 104, 119, 158, 178, 179, 182, 184, 189, 190, 191,
193, and 199 of the docket. These articles deal directly with
fire hazard and fire-related research.
The studies of Shields et al. [249] and Scheibe et al.
[250] presented case studies from vehicle fire investigations
of actual crash incidents involving automobiles, pickup
trucks, vans and sport utility vehicles (SUVs). The case
study method was chosen in this study because of the
difficulty of isolating the precise conditions that produced
the fires. Case studies illustrate the variety and complexity
of the problem by inviting the reader to synthesize the
information available for individual events without attempt-
ing yet to generalize it to all events. One of the main
difficulties in these two studies is the necessary reliance on
‘eye-witnesses’ for determining a substantial number of the
measured parameters. Shields et al. [249] and Scheibe et al.
[250] recognize that the few (approximately 21) cases they
analyze are insufficient for a comprehensive overview,
stating that ‘databases containing thousands’ of cases are
more appropriate to make conclusions regarding trends. The
data presented ‘include a wide variety of post-collision
ignition times, fluid system breaches, ignition source
availability, impact types and impact severity.’ Three
crash fires are examined in detail by Scheibe et al. [249].
I.S. Wichman / Progress in Energy and Combustion Science 29 (2003) 247–299288

Data for the 21 field investigations are compiled in an
appendix. These data categorize the vehicle type; impact
description (e.g. frontal impact with tree, frontal with rear of
a pickup truck, etc.); most likely ignition source (e.g.
gasoline, coolant/electrical spark, hot manifold surface,
power steering fluid, mechanical spark, transmission fluid,
shorted power distribution box); estimated time to ignition
and time to interior in minutes (ranging from ignition at
1 min to fully engulfed by fire at 10 min); initial fire location
(e.g. engine compartment, rear end, exhaust system, pool
fire under car, passenger compartment, rear end); reported
injuries (lacerations, bruising, concussion, burns, death);
assistance in egress (yes, no, unnecessary (fatal)). Despite
the authors’ description of a ‘wide variety’ of ignition and
burn times, what stands out from these data (if they are at all
representative) is that a time scale of O(10 min) often
already characterizes a fully involved full-scale fire. Ignition
usually occurs under 5 min. Thus, the characteristic time for
ignition events in such accidents is of the order of minutes,
and by times of O(10 min) the fire is fully engaged:
consideration of ignition are no longer either applicable or
relevant. The fire scenario is thus, in chronological order: a
collision; possible incapacitation (if only temporary) of the
occupant or occupants, including injuries and vehicle
geometry changes that make egress difficult or impossible;
a rapid ignition on the order of minutes; full-scale flaming
and flame/fire spread with the distinct possibility of burns
and serious post-crash thermal injury in under approxi-
mately 10 min from the crash. This is different from
the building fire scenario, where time scales can range
over hours from incipient smolder to final and ultimate fire
break-out. Scheibe et al. [249] concluded that coolant, oils
and gasoline, all liquid combustibles, had the potential to
initiate fire, and that electrical system damage ‘provides a
potential source of both fuel and ignition.’ Discussions
similar to those of Scheibe et al. [249] are found in the
article by Shields et al. [249], although this report provides
more background information (such as the background for
the databases used and data collection details). The authors
note the difficulty of recreating vehicle fire scenarios in the
laboratory, noting that ‘small differences in the crash
configuration can make significant differences in the
propensity to burn.’
One of the major efforts of the GM program was to
examine the flammability of the various materials in
vehicles. The report by Tewarson [251] examined the
flammability of plastic vehicle components and parts, by
subjecting them to ignition and burn tests in the factory
mutual research corporation flammability apparatus, which
resembles a large cone calorimeter. The measured quantities
were critical heat flux (CHF) (below which ignition did not
occur), thermal response parameter (TRP) (an indicator of
ignition delay that relates the time to ignition to the net heat
flux [252,253], the fire propagation index (FPI) (which
measured the fire propagation behavior), and the yields of
CO, CO2, and smoke. This particular part of the GM project
was carried out by examining components and parts of a
Dodge Caravan under the following rationale: current (late
1990s) ‘market segment leaders’ were always examined,
these being passenger vans (Dodge Caravan), SUVs (Ford
Explorer), front-wheel drive vehicles (Honda Accord) and
rear-wheel drive vehicles (Chevrolet Camaro). The com-
ponents and parts included headliner materials, instrument
panels, resonators, air ducts, steering column boot, brake
fluid reservoir, wheel well cover, windshield wiper tray,
HVAC unit, headlight components, battery casing and
cover, bulkhead insulation, and so on. The materials
from which these components are made are standard
thermoplastics (ABS, Nylon, PC, PE, PET, PEU, PP,
PVC, etc.).11 The tests were performed under a ‘natural
air flow condition’ in which buoyancy was not suppressed
nor was there a forced imposed flow. The parameters were
measured and also calculated from property values, and then
compared in several tables. Ignition temperatures were also
tabulated and compared with literature values. Tewarson
[251] concluded: ‘The CHF values of the… components and
parts of the 1996 Dodge Caravan…are comparable to the
values for ordinary plastics.’ The TRP values were about
30% larger than calculated values based on thermal property
measurements made by GM researchers [254]. The FPI
showed that of the 15 parts tested, 12 ‘were expected’ to
show either steady or accelerating fire propagation, whereas
only three were expected to show decelerating fire
propagation rates beyond the ignition location.
Santrock [255] examined the thermophysical properties
of engine compartment fluids (other than gasoline). The data
can potentially facilitate ignition calculations of the type
carried out by Tewarson [251] for solid polymers. These
fluids included used and unused motor oil, synthetic motor
oil, transmission fluid, power steering fluid, brake fluid,
engine coolant; and unused windshield washer fluid and
gear lubricant. GC–MS was used to analyze the components
of these fluids, and boiling ranges were determined using
ASTM D 2887-01. The liquid heat capacities were also
measured, by using ASTM D 2890-92. A total of 52 fluids
were analyzed (for example, 22 of these fluids were either
synthetic or non-synthetic motor oils in varying conditions).
Subsequent to these GC–MS tests, Santrock and
Kononen [256] performed ignition tests on essentially the
same set of 52 fluids (some were eliminated and others were
added). Fluid ignition was achieved by pouring them onto
heated solid surfaces. The minimum temperatures required
11 A study by Santrock [267] used several diagnostic techniques to
identify the base polymers from which automotive parts such as
body front ends, cooling and radiator sytems, engine air intakes,
instrument panels, windshields, gauges and controls, HVAC
systems, doors, seats, carpets, roofs, rear quarters, and rear
bumpers are made. The automobile examined was a 1997 Ford
Explorer (a market segment leader). All of the polymers identified
[267], or apparently minor variants thereof, have been discussed in
this review either in sections on ignition tests, flame spread, toxicity
or suppression.
I.S. Wichman / Progress in Energy and Combustion Science 29 (2003) 247–299 289

to self-ignite the resulting fluid vapors were measured. The
heated surfaces consisted of a cast iron crucible and a cast
iron hemisphere. For the crucible three temperature regimes
were observed. In the lowest range, ignition never occurred,
so that PðiÞobserved ¼ 0 for each of these tests, where PðiÞ is
the probability of observing ignition. For the highest range,
PðiÞobserved ¼ 1 and ignition always occurred. In the
intermediate temperature range, 0 , PðiÞobserved , 1: The
authors examined these ignition tests using a type of
statistical regression analysis commonly referred to as
‘probit’ analysis. In probit analysis the log-normal or
Gaussian distribution serves as the ‘link’ function, analo-
gous with examinations of toxicity data [159] that lead to
definitions such as LC50 and LD50. The ignition probit
analysis determines, for example (subject to the hypoth-
esized mathematical relationship) the temperature at which
50% of the samples ignite, or the probability PðiÞ of ignition
at a particular test temperature. The data showing the
highest 0% response and lowest 100% response were
presented, and various graphs were provided of the
calculated (probit) and measured ignition probabilities PðiÞ
versus T : Variations in ignition temperature were observed
for the two surfaces used (the crucible was convex upward,
the hemisphere convex downward), which produced
different residence times of the fluids (for the convex-
downward hemisphere the fluid had a tendency to roll off the
surface) along with different buoyant flow patterns near the
surface. In some cases for the hemisphere a cross-flow was
applied. For a 2.2 m/s cross-flow (hemisphere geometry)
ignition was not achieved for power steering fluid with a
surface temperature of 650 8C even though at zero cross-
flow it ignited with PðiÞ ¼ 1 at 370 8C.
Full-automobile tests were conducted as part of the
GM/DOT research agreement. Several vehicles that were
crash-tested were subsequently fire-tested at the Factory
Mutual Research Corporation’s full-scale fire test facility.
Ignition sources were varied in each test (e.g. underhood,
gasoline pool fire ignition).
The report by Santrock [257] describes a full-scale
vehicle fire test for a 1997 Chevrolet Camaro. These tests
were conducted in order to (1) determine the principal fire
paths and flame-spread time-lines into the passenger
compartment. (2) Identify the components that burn and
measure the thermal environments around those com-
ponents. (3) Measure temperatures, heat fluxes, gas
concentrations in the passenger compartment. For the
Camaro, gasoline apparently consistent with a ruptured
tank was flowed onto the surface under the vehicle for
approximately half a minute before it was ignited, deposit-
ing approximately 16 l. The vapor above the pool was
ignited with a torch. Within 10–20 s of ignition flames had
entered the passenger compartment. Three pathways were
observed: (1) Crash-induced ‘seam-openings’; (2) Gaps
produced by crash damage (between door and door-frame);
(3) Floor panel drain hole. Thus, fire spreads into the
compartment through either designed openings and conduits
or openings produced by the crash. After 45 s, no flames
were visible in the passenger compartment (i.e. the
compartment was nearly smoke-filled). It was determined
by comparing CO/CO2 production ratios that in its initial
stages the gasoline fire was under-ventilated, but that after
approximately 60 s well-ventilated conditions were
attained. At this time, the gasoline burning stage appears
to have ended and other combustible materials had begun to
ignite. Measurements suggest that the passenger compart-
ment combustibles were ignited between 140 and 160 s
post-ignition. It was speculated that the flame plume
extending away from the vehicle produced a higher
entrained flow and therefore increased the combustion
efficiency (i.e. the ventilation). The heat release appeared to
correlate with ventilation. In addition to these direct fire
propagation measurements, two models of toxicity were
examined using the data. These models were BURNSIM
[258] and Purser’s model [259]. Both of these models
examine exposure risk to ‘hot air, reduced oxygen, CO,
CO2, HCN, HCl, HF, HBr, acrolein, and NO2.’ BURNSIM
also evaluates the potential damage to exposed human skin
without factoring in ‘variations in skin thickness,…
presence of facial or head hair,… clothing,… (or)…skin
pigmentation.’ According to Santrock [257] ‘the accuracy of
the estimated skin temperature profiles in humans…ob-
tained using BURNSIM has not been determined.’ Rela-
tively high heat fluxes (,30 kW/m2, which are fire-level)
were recorded inside the passenger compartment. Both
models utilize a ‘Fractional Effective Dose’ for Incapacita-
tion (i.e. FED(I)) and Lethality (FED(L)), although the
measured results ‘cannot be used to predict precisely when
the gas concentrations… would have resulted in incapaci-
tating narcosis or death for a vehicle occupant’ [255]. Both
models assume that humans respond the same as laboratory
animals, and none of the model predictions of the FAA or
Purser model (except for CO2 exposure) ‘have been
validated for humans’ [257]. Furthermore, the FED
methodology assumes the toxic effects are additive, i.e.
FEDtotal ¼P
(FED)I, where I ¼(CO2, CO, HCl, HCN, O2).
When FEDtotal ¼ 1, 50% of the exposed population is
assumed to experience incapacitating narcosis; lethality
occurs in 50% of subjects when FEDtotal $ 1. Values in this
range were obtained for the tests after approximately 200 s
from ignition. Santrock [257] notes, however, that ‘the
effect of the trauma caused by the crash on the occupant’s
tolerance to these toxic gases in impossible to quantify.’ It
would seem to be a reasonable goal, in future analyses of
human response to trauma and subsequent fire, to assess the
coupled set of responses. The limited time of safe egress
would appear to make such studies essential.
A battery of similar full-scale vehicle fire tests for
different vehicles (market standards) with different ignition
source locations was conducted for a front-end impact 1996
Dodge Caravan [260], a front-end impact 1997 Camaro
(steel pole impact at 55 mph, offset from centerline by 10)
[261], a 1998 Ford Explorer underbody fire [262] and
I.S. Wichman / Progress in Energy and Combustion Science 29 (2003) 247–299290
a front-wheel drive vehicle test [263]. The interested reader
is invited to examine this literature.
An important consideration in the propagation of vehicle
fires is the potentially ameliorating effect that may be
possible with fire-retarded materials. Such materials, used in
strategic locations like necessary and unavoidable conduits
(e.g. for HVAC or the ‘floor drain hole’ referred to above),
might conceivably slow the fire in its spread from outside to
inside the cabin. Given the rather rapid spread rates, even
perhaps a small improvement might constitute a noteworthy
achievement. Ohlemiller and Shields [264] determined in
direct-fire tests involving a 2.4 and 6 kW heat source in
configurations modeling (if only very approximately) those
of an engine compartment that the tested materials showed
the same ‘observed physical behavior.’ The fire-retarded PP
was ‘distinctly less flammable’ than the non-retarded PP,
although Nylon resins showed ‘more complex’ behavior.
Tests that examine exposure to full fire, however, are
different from developing-fire tests and transient flame
spread tests, where the nature of the material may not be as
important as the manner in which the growing fire seeks to
provide oxygen for itself.12 In Ref. [265] the author
evaluates the use of plastic resins containing fire retardant
chemicals in the HVAC modules of a fire-tested 1999
Chevrolet Camaro. The retardant treated vehicle was
compared with a ‘control’ vehicle that contained a non-
fire retarded HVAC module. The fires were underhood and
spread to the passenger compartment (cabin). The author
found that the use of fire-retarded plastics ‘did not affect the
rate of flame spread from the engine compartment to the
passenger compartment during these tests.’ This suggests (to
the author of this review) that the underhood fires are under-
ventilated and use the conduits as a means for consuming
fresh air from the passenger compartment, not as a means
for consuming additional combustible HVAC ducting
materials. Thus, model studies of connected vehicle
compartments may provide important information on the
propagation of medium-scale fires between adjacent med-
ium-scale compartments.
Finally, we review a detailed numerical computation of
the spread of fire from outside the passenger compartment
into the passenger compartment [266]. The numerical
simulation was intended to describe the hazards of both
heat and toxicant gases in a numerical model of a post-crash
fire in a minivan. The CFD model includes the turbulence
controlled eddy break up model, conjugate heat transfer,
radiant heat transfer, gas radiation, and buoyancy-driven
airflow. The BURNSIM [258] model is used to simulate the
passenger skin response. This model computes the depth
(and hence the severity) of the burns produced by radiant
and convective heating of the subject’s skin. This model is
intended as a complement to the full-scale vehicle fire tests
conducted by Santrock [260]: the model uses the full-scale
experiments as ‘validation data’ but according to the authors
‘cannot exactly reproduce the experimental results.’ Exper-
imental heat release data measured during an actual vehicle
fire test served to calibrate the model combustion par-
ameters and set the fuel input rate to mimic the experimental
heat release rate curve. The model combustion products
consisted only of CO, CO2, soot and heat. The purpose of
this model was primarily ‘to provide insight, not predictions
of future behavior.’ In the simulations, the passenger
compartment was modeled in its deformed state after the
descriptions provided in previous crash tests. The fuel was
metered into the compartment at a fixed rate: the metered
fuel combined with oxidizer to form the compartment fire
combustion process. The fire was well ventilated. The fire
did not spread to other materials in the cabin and increasing
the fuel metered into the cabin was the only means of
enhancing fire growth. This appears to be a major
shortcoming of the model, since experiments make it
abundantly clear that numerous internal surfaces ignite
readily to flame. Incapacitating conditions were reached
between approximately 1–4 min, depending on the venting
rate and heat production rate, which could be enhanced by
metering more fuel or by preventing the issuance of the
heated gases from upper-level vents (such as slightly opened
windows, for example). Burn injuries were computed from a
simplified burn simulation model that does not include
effects of skin pigmentation, skin thickness, superficial hair,
the flushing response and the cooling effect of perspiration.
In addition, the skin was uncovered by clothing. The thermal
insult to the skin surface produced a ‘response’ in the layers
simulating the skin. A drawback of the model appears to be
over-prediction, by nearly a factor of two, of the incident
radiation. Nevertheless, the model indicated that hazardous
conditions could readily be achieved when fuel supply rates
produced compartment or cabin fires of magnitudes similar
to those of experiments. The time scale was of the order of
minutes.
6. Conclusions
This review has examined the selected literature of
material flammability with focus on technical issues
relevant to transportation-related fires. The review has
been topically organized into technical subjects arising in
fire progression. These include fire initiation, fire spread,
and fire chemistry. Each of these subfields is broad and
multifaceted, and contains numerous areas of overlap with
the others. The necessity of having agreed-upon testing
methods is apparent in each subfield. Tests to measure
flammability properties have been developed, for example,
the cone calorimeter. Other tests that measure flame spread
rates and dynamic flame spread properties have also been
devised but their utility and accuracy are lower than the cone
12 The hypothesis based on ‘final cause’ [268] is that a flame or fire
will spread in such a manner that optimizes its consumption, under
prevailing conditions, of the available oxidizer.
I.S. Wichman / Progress in Energy and Combustion Science 29 (2003) 247–299 291

calorimeter. Tests for toxicity are varied and numerous so
the literature of toxicology is vast and enormous, but a
toxicity test that also accounts for fire hazard is not presently
available. Measuring concentrations and specifying LC50
indices in homogeneous test cells will not suffice to
determine the actual threat posed by the tested chemical in
an actual transportation fire. The toxicant must act in a
certain, often restricted, time interval, which requires
consideration of its transport and possible chemical reaction
(and therefore consumption) by other present chemical
species. Finally, full-scale testing for transportation is
expensive and technically challenging although facilities
are being constructed that have the capability for making
useful technical measurements. If such tests are not carried
out the assurance of fire safety can never be complete.
Acknowledgements
This research was supported by General Motors, under
an agreement between GM and the US Department of
Transportation. The author gratefully acknowledges the
assistance of B. Mackie, M. Franklin, D. Rege, S.
Hammerschmidt, N. Von Sprecken, and S. Tanaya, as
well as the extensive, detailed, and helpful comments and
criticisms of the PECS referees.
References
[1] LaDue III, Douglas E. Fire Safety Group, Safety Research
Department, General Motors Research and Development
Center, Development of the Searchable Transportation Fire
Safety Bibliography. This was prepared in accordance with
the March 7, 1995 agreement between GM and the U.S.
Department of Transportation, submitted to NHTSA on
November 11, 1997; receipt was acknowledged by NHTSA
on December 23, 1997. It was placed in Docket No.
96-GMRSRCH-GR in NHTSA’s Technical Information
System, accessible at http://dms.dot.gov, the last four digits
of the docket number being 3588. There are 200 documents
in this docket.
[2] Glassman I. Combustion. 3rd ed. San Diego, CA: Academic
Press; 1996. p. 330–5. See also Kanury M. Introduction to
combustion phenomena. New York, NY: Gordon & Breach;
1993. p. 95–104.
[3] Lewis B, Von Elbe G. Combustion, flames and explosions of
gases. 3rd ed. NY: Academic Press; 1987.
[4] Babrauskas V. Development of the cone calorimeter: a bench
scale heat release rate apparatus based on oxygen consump-
tion. Fire Mater 1984;8:81–95.
[5] Babrauskas V. The cone calorimeter. 2nd ed. The SFPE
handbook of fire protection engineering. Quincy, MA:
National Fire Protection Association; 1995 [Section 3/
chapter 3]. p. 3–37.
[6] Babrauskas V, Grayson SJ, editors. Heat release in fires.
London: E&F Spon; 1992.
[7] Quintiere JG. A simplified theory for generalizing results
from a radiant panel rate of flame spread apparatus. Fire
Mater 1981;5(2):52–60.
[8] Emmons H. Fire safety in the twenty-first century. Proc
Central States Sect Combust Inst 1997;1–2.
[9] Glassman I. Combustion. 3rd ed. San Diego, CA: Academic
Press; 1996.
[10] Turns SR. An introduction to combustion. 2nd ed. Boston,
MA: McGraw-Hill; 2000.
[11] Williams FA. Combustion theory. 2nd ed. Menlo Park, CA:
Benjamin/Cummings; 1985.
[12] Gray PP, Scott SK. Chemical oscillations and instabilities.
Oxford: Clarendon Press; 1990.
[13] Shouman AR. Solution to the dusty gas explosion problem
with reactant consumption. Part 1. The adiabatic case.
Combust Flame 1999;.
[14] Hemminger W, Hohne G. Calorimetry: fundamentals and
practice. Weinheim: Verlag; 1984. p. 177 [chapter 8].
[15] Tanabe M, Kono M, Sato J, Koenig J, Eigenbrod C,
Dinkelacker F. Two-stage ignition of n-heptane isolated
droplets. Combust Sci Technol 1995;108:103–19.
[16] Drysdale DD. An introduction to fire dynamics. New York:
Wiley; 1985.
[17] Quintiere JG. Principles of fire behavior. Albany, NY:
Delmar; 1999.
[18] Mikkola E, Wichman IS. On the thermal ignition of
combustible materials. Fire Mater 1989;14:87–96.
[19] Atreya A, Abu-Zaid M. Effect of environmental variables on
piloted ignition. Proceedings of the Third International
Symposium on Fire Safety Science. International Association
for Fire Safety Science (IAFSS)/Hemisphere Press; 1989.
p. 177–86.
[20] Atreya A, Wichman IS. Heat and mass transfer during piloted
ignition of cellulosic solids. J Heat Transfer 1989;111:
719–25.
[21] Bamford CH, Crank J, Malan DH. The combustion of wood.
Proc Cambridge Philos Soc 1945;42:166–82.
[22] Martin S. Diffusion-controlled ignition of cellulosic
materials by intense radiant energy. Tenth Symposium
(International) on Combustion. Pittsburgh, PA: The Com-
bustion Institute; 1965. p. 877–96.
[23] Sauer FM. The charring of wood during exposure to thermal
radiation: correlation analysis for semi-infinite solids.
Interim T.R. AFSWP-868, USDA Forest Service; 1956
[24] DiBlasi C, Crescitelli S, Russo G, Fernandez-Pello AC.
Predictions of the dependence on the opposed flow
characteristics of the flame spread rate over thick solid
fuel. Proceedings of the Second International Symposium on
Fire Safety Science. New York, NY: Hemisphere; 1988.
p. 119–28.
[25] DiBlasi C. Modeling and simulation of combustion processes
for charring and non-charring solid fuels. Proc Energy
Combust Sci 1992;19:71–104.
[26] Hilado CJ, Clark SW. Discrepancies and correlations of
reported autoignition temperatures. Fire Technol J 1972;8(3):
218–27.
[27] Hilado CJ, Clark SW. Autoignition temperatures of organic
chemicals. Chem Engng J 1972;75–80.
[28] Settle GE. Temperature of instantaneous ignition. Fire Mater
1980;6:163.
I.S. Wichman / Progress in Energy and Combustion Science 29 (2003) 247–299292
[29] Clark FRS. Radiative ignition of thermoplastics and
char-forming materials. Fire Mater 1984;8(4):196–8.
[30] Thomson HE, Drysdale DD. Flammability of plastics.
I. Ignition temperatures. Fire Mater 1987;11:163–72.
[31] Thomson HE, Drysdale DD, Beyler C. An experimental
evaluation of critical surface temperature as a criterion for
piloted ignition of solid fuels. Fire Safety J 1988;13:185–96.
[32] Richard JR, Vovelle C, Delbourgo R. Flammability and
combustion properties of polyolefinic materials. Fifteenth
Symposium (International) on Combustion. Pittsburgh, PA:
The Combustion Institute; 1974. p. 205–16.
[33] Drysdale DD, Thomson HE. Flammability of plastics. II.
Critical mass flux at the firepoint. Fire Safety J 1989;14:
179–88.
[34] Yang YP, Brewer DG, Venant JES. The influence of
antimony trihalides on flammability and ignition of poly-
ethylene. Fire Mater 1991;15:127–30.
[35] Atreya A, Carpentier G, Harkleroad M. Effect of sample
orientation on piloted ignition and flame spread. First inter-
national symposium on fire safety science; 1985. p. 97–109.
[36] Wichman IS. Theory of opposed flow flame spread. Prog
Energy Combust Sci 1992;18:553–93.
[37] Nyden MR, Brown JE, Lomakin SM. Flammability proper-
ties of honeycomb composites and phenol–formaldehyde
resins. In Fire and Polymers II, ACS Symposium Series 599;
1994. p. 245–55 [chapter 16].
[38] Nyden MR, Brown JE. Investigation into the flammability
properties of honeycomb composites. National Institute of
Standards and Technology, NISTIR #5509, PB95-143293;
1994.
[39] Thorne PF. Flash points of mixtures of flammable and non-
flammable liquids. Fire Mater 1976;1:134–40.
[40] Kemp SP, Linden JL. Physical and chemical properties of a
typical automatic transmission fluid. SAE Technical Paper
No. 902148; 1990.
[41] Matheson AF, Charge R, Corneliussen T. Properties of PVC
compounds with improved fire properties for electrical
cables. Fire Safety J 1992;19:55–72.
[42] Tewarson A, Khan MM, Steciak J. Combustibility of
electrical wire and cable for rail rapid transit systems, vol.
1, flammability. Urban Mass Transportation Administration
PB83-233742. Report No. UMTA-MA-06-0025-83-6; 1983
[43] Babrauskas V. Ignition handbook. Issaquah, WA: Fire
Science Publishers; 2003.
[44] Elomaa M, Sarvaranta L, Mikkola E, Kallonen R, Zitting A,
Zevenhoven CAP, et al. Combustion of polymeric materials.
Crit Rev Biochem Mol Biol 1997;27(3):137–97.
[45] Wichman IS, Melaaen MG. Modeling the pyrolysis of
cellulosic materials. In: Bridgewater T, editor. Advances in
Thermo-Chemical Biomass Conversion. London: Chapman
& Hall; 1993.
[46] ISOTR 9122-3. Toxicity testing of fire effluents. Part 3.
Methods for the analysis of gases and vapours in fire
effluents. 1st ed. 1993. 1993-05-15.
[47] Babrauskas V, Peacock RD. Heat release rate: the single
most important variable in fire hazard. Fire Safety J 1992;18:
255–72.
[48] Tewarson A. Heat release rate in fires. Fire Mater 1980;4(4):
185–91.
[49] Quintiere JG. An assessment of correlations between
laboratory and full-scale experiments for the FAA aircraft
fire safety program. Part 2. Rate of energy release in fire.
National Bureau of Standards NBSIR 82-2536, DOT/FAA/
CT-82/108; 1982.
[50] Babrauskas V. Upholstered furniture heat release rates:
measurement and estimation. J Fire Sci 1983;1(1):9–32.
[51] Babrauskas V, Walton WD. A simplified characterization of
upholstered furniture heat release rates. Fire Safety J 1986;
11:181–92.
[52] Hirschler MM, Shakir S. Fire performance in poly(vinyl
chloride) products. Rec Adv Flame Retardancy Polym Mater
1990;227–34.
[53] Fernandez-Pello AC, Cordova JL, Torero JL, Walther DC.
Oxidizer flow effects on the flammability of solid combus-
tible materials. Combust Sci Technol 2001;164:253–78.
[54] Brown JR, Fawell PD, Mathys Z. Fire-hazard assessment of
extended-chain polyethylene and aramid composites by cone
calorimetry. Fire Mater 1994;18:167–72.
[55] Babrauskas V. Comparative rates of heat release from five
different types of test apparatuses. J Fire Sci 1986;4:148–59.
[56] Babrauskas V, Twilley WH, Parker WJ. Effect of specimen
edge conditions on heat release rate. Fire Mater 1993;17(2):
51–63.
[57] Hume J, Pettett K, Jenc J. Cone calorimetry of CMHR
polyurethane foam: an evaluation of the effects of melamine
additive. Flame Retardants, Conference Proceedings.
London, England; 1990. p. 234–41.
[58] Vanspeybroeck R, VanHees P, Vandevelde P. Combustion
behavior of polyurethane flexible foams under cone calori-
metry test conditions. Cellular Polym 1992;11(2):96–117.
[59] Vanspeybroeck R, Van Hees P, Vandevelde P. Combustion
behavior of fabric and polyurethane flexible foam mock-up
combinations under cone calorimetry test conditions. Cel-
lular Polym 1992;11(2):118–28.
[60] Vanspeybroeck R, Van Wesemael E, VanHees P, Vande-
velde P. Calorimetric combustion assessment of PU flexible
foam and fabric composites. Cellular Polym 1993;12(5):
374–89.
[61] Costa L, Camino G, Bertelli O, Borsini O. Mechanistic study
of the combustion behavior of polymeric materials in bench-
scale tests. I. Comparison between cone calorimeter and
traditional tests. Fire Mater 1995;19(3):133–42.
[62] Goff LJ. Investigation of polymeric materials using the cone
calorimeter. Polym Engng Sci 1993;33(8):497–500.
[63] Vanspeybroeck R, Van Hees P, Vandevelde P. Combustion
behavior of fabric and polyurethane flexible foam mock-up
combinations under cone calorimetry test conditions. Fire
Mater 1993;17(4):167–72.
[64] Brown, J.E., Braun, E., Twilley, W.H., (1988). Cone
calorimeter evaluations of the flammability of composite
materials. National Bureau of Standards PB88201330,
NBSIR 88-3733, March.
[65] Cleary TO, Quintiere JC. Flammability characterization of
foam plastics. National Institute of Standards and Technol-
ogy, PB92-123033, NISTIR 4664; October 1991
[66] Scudamore MJ, Briggs PJ, Prager FH. Cone calorimetry: a
review of tests carried out on plastics for the association of
plastic manufacturers in Europe. Fire Mater 1991;15(2):
65–84.
[67] Babrauskas V, Mulholland G. Mathematical modeling of
fires: smoke and soot determination in the cone calorimeter.
ASTM STP 983, 83-104. Philadelphia: ASTM; 1987.
I.S. Wichman / Progress in Energy and Combustion Science 29 (2003) 247–299 293

[68] Babrauskas V. Smoke and gas evolution rate measurements
on fire-retarded plastics with the cone calorimeter. Fire
Safety J 1989;14(3):135–42.
[69] Wang J, Tu H, Jiang Q, An XPS. Investigation of thermal
degradation and charring processes for polymers in the
condensed phase. J Fire Sci 1995;13:261–79.
[70] Delichatsios MA. Basic polymer material properties for
flame spread. J Fire Sci 1993;11:287.
[71] Delichatsios MA. A new interpretation of data from LIFT
(lateral ignition and flame transport) apparatus and modifi-
cations for creeping (countercurrent) flame spread. Sub-
mitted for publication
[72] Wichman IS, Morris SC, McIntosh AW. Experimental
measurements of flow and flame spread in the development
of a fire testing facility. Exp Therm Fluid Sci 2002;25:
595–603.
[73] Urbas J, Parker WJ. Using ICAL to determine the lateral
flame spread constants for a wall material. INTERFLAM’99;
1999. p. 1355–60
[74] Sirignano WA. A critical discussion of theories of flame
spread across solid and liquid fuels. Combust Sci Technol
1972;6:95–105.
[75] Burgoyne JH, Roberts AF. The spread of flame across a
liquid surface. I. The induction period. Proc Roy Soc A 1968;
308:55–68.
[76] Glassman I, Hansel JG, Eklund T. Hydrodynamic effects in
the flame spreading, ignitability and steady burning of liquid
fuels. Combust Flame 1969;13:99–101.
[77] Ross HD, Sotos RG. An investigation of flame spread over
shallow liquid pools in microgravity and nonair
environments. Twenty-Third Symposium (International) on
Combustion. Pittsburgh, PA: The Combustion Institute;
1990. p. 1649–55.
[78] DeRis JN. The spread of diffusion flame over a combustible
surface. PhD Thesis. Harvard University; 1968.
[79] Miller FJ, Ross HD. Smoke visualization of the gas flow
during flame spread across a liquid pool. Twenty-Seventh
Symposium (International) on Combustion. Pittsburgh, PA:
The Combustion Institute; 1998. p. 2715–22.
[80] Ross HD. Ignition of and flame spread over laboratory-scale
pools of pure liquid fuels. Prog Energy Combust Sci 1994;20:
17–63.
[81] Glassman I, Dryer FL. Flame spreading across liquid fuels.
Fire Safety J 1981;3:123–38.
[82] Miller FJ, Ross HD. Further observations of flame spread
over laboratory-scale alcohol pools. Twenty-Fourth Sym-
posium (International) on Combustion. The Combustion
Institute, Pittsburgh 1992. p. 1703–11.
[83] Garcia-Ybarra PL, Antoranz JC, Sankovitch V, Castillo JL.
Experimental evidence of self-excited relaxation oscillations
leading to homoclinic behavior in spreading flames. Phys
Rev E 1994;46(6):5225–9.
[84] Cai J, Lui F, Sirignano WA. Three dimensional flame
propagation above liquid fuel pools. Combust Sci Technol
2002;174:5–34.
[85] Ross HD, Miller FJ. Flame spread across liquid pools with
very low-speed opposed or concurrent airflow. Proceedings of
the Twenty-Seventh Symposium (International) on Combus-
tion. Pittsburgh: The Combustion Institute; 1998. p. 2723–9.
[86] Miller FJ, Ross HD, Kim I, Sirignano WA. Parametric
investigations of pulsating flame spread over a liquid pool.
Proceedings of the Twenty-Eighth Symposium
(International) on Combustion. Pittsburgh, PA: The
Combustion Institute; 2000. p. 2827–34.
[87] Zik O, Olami Z, Moses E. Fingering instability in combus-
tion. Phys Rev Lett 1998;81:3868–71.
[88] Olson SL, Baum HR, Kashiwagi T. Finger-like smoldering
over thin cellulosic sheets in microgravity. Twenty-Seventh
Symposium (International) on Combustion. Pittsburgh, PA:
The Combustion Institute; 1998. p. 2525–33.
[89] Clark TL, Jenkins MA, Coen J, Packham DR. A coupled
atmosphere-fire model: convective feedback on fire-line
dynamics. J Appl Meteorol 1996;35:875–901.
[90] Clark TL, Radke L, Coen J, Middleton D. Analysis of small-
scale convective dynamics in a crown fire using infrared video
camera imaging. J Appl Meteorol 1999;38:1401–20.
[91] Suzuki T, Kawamata M, Hirano T. Flame spread over fuel
soaked sand in an opposed air stream. Proceedings of the
Second Symposium (International) on Fire Safety Science;
1989. p. 199–208
[92] Williams FA. Mechanisms of fire spread. Sixteenth Sym-
posium (International) on Combustion. Pittsburgh, PA: The
Combustion Institute; 1976. p. 1281–94.
[93] Thomas PH. On concurrent upward surface spread of flame.
Fire Safety J 1994;22:89–99.
[94] Thomas PH. Fire, flames and dimensional analysis. Proceed-
ings of the Third International Symposium on Fire Safety
Science, Invited Plenary Lecture. New York, NY: Hemi-
sphere; 1990. p. 3–26.
[95] Hasemi Y. Thermal modeling of upward wall flame spread.
Proceedings of the First International Symposium on Fire
Safety Science. New York, NY: Hemisphere; 1986. p. 87–96.
[96] Saito K, Quintiere JG, Williams FA. Upward turbulent flame
spread. Proceedings of the First International Symposium on
Fire Safety Science. New York, NY: Hemisphere; 1986.
p. 75–86.
[97] Saito K, Williams FA, Wichman IS, Quintiere JG. Upward
turbulent flame spread on wood under external radiation.
J Heat Transfer 1989;111:438–4445.
[98] Delichatsios MA, Saito K. Upward fire spread: key
flammability properties, similarity solutions and flammabil-
ity indices. Proceedings of the Third International Sym-
posium on Fire Safety Science. New York, NY: Hemisphere;
1990. p. 217–26.
[99] Hasemi Y, Yoshida M, Nohara A, Nakabayashi T. Unsteady-
state upward flame spreading velocity along vertical
combustible solid and influence of external radiation on the
flame spread. Proceedings of the Third International
Symposium on Fire Safety Science. New York, NY:
Hemisphere; 1990. p. 197–206.
[100] Baroudi D, Kokkola M. Analysis of upward flame spread.
VTT Publications #89. ESPOO, Finland: VTT-Technical
Research Center of Finland; 1992.
[101] Wichman IS, Agrawal S. Wind-aided flame spread over thick
solids. Combust Flame 1991;83:127–45.
[102] Flint JM, Magill JH. Method for the quantitative evaluation
of flammability in polymers. J Appl Polym Sci 1974;18(4):
1243–5.
[103] Bhattacharjee S, King MD, Takahashi S, Nagumo S, Wakei
K. Downward flame spread over poly(methyl)methacrylate.
Twenty-Eighth Symposium (International) on Combustion.
Pittsburgh, PA: The Combustion Institute; 2000. p. 2891–7.
I.S. Wichman / Progress in Energy and Combustion Science 29 (2003) 247–299294
[104] Hirano T, Tazawa K. Effect of thickness on downward flame
spread over paper. Bull Jpn Assoc Fire Sci Engng 1976;
26(1):7–13.
[105] Hirano T, Koshida T, Akita K. Flame spread mechanisms
over PMMA surfaces. Bull Jpn Assoc Fire Sci Engng 1977;
27:33.
[106] Harkleroad M, Quintiere JG, Walton WD. Radiative ignition
and opposed flow flame spread measurements on materials.
Federal Aviation Administration Report FAA-A133171;
August 1983.
[107] Ohlemiller TJ, Dolan S. Ignition and lateral flame spread
characteristics of certain composite materials. National
Institute of Standards and Technology Report PB90-
205188, NISTIR 88-3733; 1989.
[108] Fernandez-Pello AC. Experimental investigation of
flame spread over condensed combustibles: gas-phase
interactions. National Bureau of Standards PB-275999;
December 1977.
[109] Fernandez-Pello AC, Hirano ST. Controlling mechanisms of
flame spread. Combust Sci Technol 1983;32:1–31.
[110] Babrauskas V, Peacock RD, Braun E, Bukowski RW, Jones
WW. Fire performance of wire and cable: reaction to fire
tests. A critical review of the existing methods and of new
concepts (NIST Technical Note 1291). Gaithersburg:
National Institute of Standards and Technology (NIST);
1991.
[111] Weber RO, deMestre NJ. Flame spread measurements on
single ponderosa pine needles: effect of sample orientation
and concurrent external flow. Combust Sci Technol 1990;70:
17–32.
[112] Brauman SK. Effect of sample temperature on combustion
performance of polymers. J Fire Flammability 1977;8:
210–24.
[113] Breillat C, Vantelon JP. Influence of the oxidizing tempera-
ture on the combustion of some well-known polymeric
materials. J Appl Polym Sci 1983;28(2):461–72.
[114] Fernandez-Pello AC, Ray SR, Glassman I. Flame spread in
an opposed flow: the effect of ambient oxygen
concentration. Eighteenth Symposium (International) on
Combustion. Pittsburgh, PA: The Combustion Institute;
1981. p. 579–87.
[115] Ray SR. Flame spread over solid fuels. PhD Thesis.
Princeton University, Princeton, NJ; 1981.
[116] Wichman IS. A model describing the influences of finite-
rate gas-phase chemistry on rates of flame spread over
solid combustibles. Combust Sci Technol 1984;40:
233–55.
[117] Brown JE, Loftus JJ, Dipert RA. Fire characteristics of
composite materials: a review of the literature. National
Bureau of Standards Report PB87-112314, NBSIR 85-3226;
August 1986.
[118] Babrauskas V, Harris Jr RH, Gann RG, Levin BC, Lee BT,
Peacock RD, Paabo M, Twilley W, Yoklavich MF, Clark
HM. Fire hazard comparison of fire-retarded and non-fire-
retarded products (NBS Special Publication SP 749). [US]
Natl. Bur. Stand. (NBS); 1988.
[119] Quintiere JG, Cleary TO. Heat flux from flames to vertical
surfaces. Fire Technol 1994;2nd Quarter:209–31.
[120] Babrauskas V. Flame fluxes in opposed-flow flame spread: a
review of the literature. SS report. Swedish National Testing
and Research Institute; 1995. p. 06.
[121] Delichatsios MA. Creeping flame spread: energy balance and
application to practical materials. Twenty-Sixth Symposium
(International) on Combustion. Pittsburgh: The Combustion
Institute; 1996. p. 1495–1503.
[122] Tewarson A. Fire hardening assessment technology for
composite systems. US Army Report ARL-CR-178;
November 1994.
[123] Oladipo AB, Wichman IS. Opposed flow flame spread over
wood fiber/thermoplastic composite materials. Combust
Flame 1999;118:317–26.
[124] Stuetz DE, DiEdwardo AH, Zitomer F, Barnes BP. Polymer
combustion. J Polym Sci 1975;13:585–621.
[125] Bhattacharjee S, Altenkirch RA. The effect of surface
radiation on flame spread in a quiescent microgravity
environment. Combust Flame 1991;84:160–9.
[126] Bhattacharjee S, Altenkirch RA, Srikantaiah N, Nayagam V.
A theoretical description of flame spreading over solid
combustibles in a quiescent environment at zero gravity.
Combust Sci Technol 1990;69:1–15.
[127] Ramachandra PA, Altenkirch RA, Bhattacharjee S, Tang L,
Sacksteder K, Wolverton MK. The behavior of flames
spreading over thin fuels in microgravity. Combust Flame
1995;100:71–84.
[128] West J, Bhattacharjee S, Altenkirch RA. Surface radiation
effects on flame spread over thermally thick fuels in an
opposing flow. J Heat Transfer 1994;116:646–51.
[129] Serecek P, Dvorak P. The composition and structure of
solid char residues after thermal degradation of polystyrene,
PVC and polyamide. Part 1. Fire Mater 1985;9(3):145–9.
[130] Mowrer FW, Brannigan V. Carbon monoxide production,
transport and hazard in buildings. In: Penney DG, editor.
[chapter 22] Carbon monoxide toxicity. Boca Raton: CRC
Press; 2000.
[131] Gardiner Jr WC, Olson DB. Chemical kinetics of high
temperature combustion. Ann Rev Phys Chem 1980;31:
377–99.
[132] Westbrook CK, Dryer FL. Chemical kinetic modeling of
hydrocarbon combustion. Prog Energy Combust Sci 1984;
10:1–57.
[133] Warnatz J. Rate coefficients in the C/H/O system. In:
Gardiner WC Jr, editor. Combustion chemistry. New York,
NY: Springer-Verlag; 1984. p. 197–360.
[134] Yetter RA, Dryer FL, Rabitz H. A comprehensive reaction
mechanism for carbon monoxide/hydrogen/oxygen kinetics.
Combust Sci Technol 1991;79:97–128.
[135] Frenklach M, Wang H, Rabinowitz MJ. Optimization and
analysis of large chemical kinetic mechanisms using the
solution mapping method—combustion of methane. Prog
Energy Combust Sci 1992;18:47–73.
[136] Ohlemiller TJ. Modeling of smoldering combustion
propagation. Prog Energy Combust Sci 1985;11:277–310.
[137] Broido A. Kinetics of solid-phase cellulose pyrolysis. In:
Shafizadeh F, Saskaren KV, Tillman DA, editors. Thermal
uses and properties of carbohydrates and lignins. New York,
NY: Academic Press; 1976.
[138] Rightly MLJ. Numerical analysis of carbon monoxide flames
by reduced kinetic and asymptotic methods. PhD Thesis.
University of California at San Diego; 1996.
[139] Tsuchiya Y, Sumi K. Thermal decomposition products of
polyethylene. J Polym Sci: Part A1, Polym Chem 1968;6:
415–24.
I.S. Wichman / Progress in Energy and Combustion Science 29 (2003) 247–299 295

[140] Morimoto T, Takeyama KK, Konishi F. Composition of
gaseous combustion products of polymers. J Appl Polym Sci
1976;20:1967–76.
[141] Chien JC, Kiang JK. Oxidative pyrolysis of poly (propylene).
Makromol Chem 1980;181:47–57.
[142] Department of Polymer Science, University of Mississippi;
1996. http://www.psrc.usm.edu/macrog/pp.htm.
[143] ChemQuest. Polyamides: in the U.S. adhesives industry.
Publication Date 01 November, 2001; 2001.
[144] Michal J, Mitera J, Kubat J. Major pyrolysis and thermo-
xidative products from certain polyamides. Fire Mater 1981;
5(1):1–5.
[145] Mitera J, Michal J. The combustion of products of polymeric
materials. II. GC–MS analysis of the combustion products of
polyethylene, polystyrene and polyamide. Fire Mater 1985;
9(3):111–6.
[146] Grand AF. Effect of experimental conditions on the evolution
of combustion products using a modified University of
Pittsburgh toxicity test apparatus. J Fire Sci 1985;3(4):
280–304.
[147] Brauman SK. CO and CO2 production during combustion of
some polymeric materials. J Combust Toxicol 1979;6:
228–37.
[148] Michal J. Determination of carbon monoxide in thermal
degradation products of polymeric materials. Fire Mater
1981;5(4):149–52.
[149] Comeford JJ. Study of the decomposition products of
polyurethane foam related to aircraft cabin flash fires. Final
Report, Federal Aviation Administration FAA-NA-73-69;
July 1973. p. 33.
[150] Einhorn IN, Ramakrishnan MS, Mickelson RW. Thermal
degradation of model urethane foams: an analytical study.
International 4th Annual Conference, Society of the Plastics
Industry (SPI), Cellular Plastics Division; November 1976.
p. 221–38.
[151] Einhorn IN, Ramakrishnan MS, Mickelson RW. Thermal
degradation of model fire-retarded urethane foams: an
analytical study. Part 2. International 4th Annual Conference,
Society of the Plastics Industry (SPI) Cellular Plastics
Division; November 1976. p. 239–56.
[152] Rotival C, Renacco E, Arfi C, Pauli AM, Pastor J. Gases
emitted during thermal decomposition of a polypropylene
film and a polyurethane adhesive. J Thermal Anal 1994;
41(6):1519–27.
[153] Boettner EA, Ball GL, Weiss B. Analysis of the volatile
combustion products of vinyl plastics. J Appl Polym Sci
1969;13:377.
[154] Zinn BT, Cassanova RA, Bankston CP, Browner RF, Powell
EA, Rhee JU, et al. Investigation of properties of the
combustion products generated by building fires. NBS-GCR-
77-116, PB276549. National Bureau of Standards (US);
1977. p. 103.
[155] Statheropoulos M. Study of the isothermal degradation of
poly(vinyl chloride) by direct mass spectrometry. J Anal
Appl Pyrol 1986;10:89–98.
[156] Galloway FM, Hirschler MM, Smith GF. Surface parameters
from small-scale experiments used for measuring HCl
transport and decay in fire atmospheres. Fire Mater 1991;
15:181–9.
[157] Fardell PJ, Murrell JM, Murrell JV. Chemical ‘fingerprint’
studies of fire atmospheres. Fire Mater 1986;10:21–8.
[158] Wilde DG. Combustion of polyurethane foam in a tunnel
ventilated at an airspeed of 5 metres per second. J Fire
Flammab 1980;11(Oct):263–74.
[159] Gallo MA. History and scope of toxicology. In: Klaassen CD,
editor. Casarett and Doull’s toxicology: the basic science of
poisons. New York: McGraw-Hill; 1996.
[160] Eaton DL, Klaassen CD. Principles of toxicology. In:
Klaassen CD, editor. Casarett and Doull’s toxicology:
the basic science of poisons. New York: McGraw-Hill;
1996.
[161] Nikula KJ, Avila KJ, Griffith WC, Manderly JL. Lung tissue
responses and sites of particle retention differ between rats
and cynomolgus monkeys exposed chronically to diesel
exhaust and coal dust. Fundamental Appl Toxicol 1997;37:
37–53.
[162] Kepler GM, Richardson RB, Morgan KT, Kimbell JS.
Computer simulation of inspiratory nasal airflow and inhaled
gas uptake in a rhesus monkey. Toxicol Appl Pharmacol
1998;150:1–11.
[163] Subramaniam RP, Richardson RB, Morgan KT, Kimbell JS,
Guilmette RA. Computational fluid dynamics simulations of
inspiratory airflow in the human nose and nasopharynx. Inhal
Toxicol 1998;10:91–120.
[164] Farrar DG, Galsten WA. Biological end-points for the
assessment of the toxicity of the products of combustion of
materials. Fire Mater 1980;4(1):50–8.
[165] Herpol C. Biological evaluation of toxicity caused by
combustion of building materials. Fire Mater 1980;4(3):
127–43.
[166] Herpol C, Vandervelde P. Calculation of a toxicity indexes
for materials, based on a biological evaluation method. Fire
Mater 1978;2(1):7–10.
[167] Hilado CJ, Cumming HJ, Machado AM. Relative toxicity of
pyrolysis gases from materials: specific toxicants and special
studies. Fire Mater 1978;2(4):141–53.
[168] Babrauskas V, Levin BC, Gann RG. A new approach to fire
toxicity data for hazard evaluation. Am Soc Test Mater
Standard News 1986;14:28–33.
[169] Gann RG, Levin BC. Toxic potency of fire smoke:
measurement and uses, fire and polymers—hazards
identification and prevention. ACS Symposium Series
425, 197th National Meeting. Dallas, TX; April 1990.
p. 3–11.
[170] Babrauskas V. Effective measurement techniques for heat,
smoke and toxic fire gases. Fire Safety J 1991;17:13–26.
[171] Babrauskas V, Levin BC, Gann RG, Paabo M, Harris RH,
Peacock RD, Yusa S. Toxic potency measurement for fire
hazard analysis. National Institute of Standards and Tech-
nology (NIST) PB92-137546, Special Publication 827; 1991.
p. 119
[172] Babrauskas V. Toxic hazard from fires: a simple assessment
method. Fire Safety J 1993;20:1–14.
[173] Gregus Z, Klaassen CD. Mechanisms of toxicity. In:
Klaassen CD, editor. Casarett and Doull’s toxicology:
the basic science of poisons. New York: McGraw-Hill;
1996.
[174] Levin BC, Paabo M, Gurman JL, Clark HM, Voklavich MF.
Further studies of the toxicological effects of different time
exposures to the individual and combined fire gases: carbon
monoxide, hydrogen cyanide, carbon dioxide and reduced
oxygen. Society of the Plastics Industry, Inc. International
I.S. Wichman / Progress in Energy and Combustion Science 29 (2003) 247–299296
Polyurethane Division 31st Meeting. Philadelphia, PA;
October 1988. p. 249–52.
[175] Barrow CS, Alarie Y, Stock MF. Sensory imitation evoked
by the thermal decomposition products of plasticized poly
(vinyl chloride). Fire Mater 1976;1:147–53.
[176] Murrell JM. A novel method for measuring nitrogen-
containing species in combustion effluents. Fire Mater
1986;10:57–62.
[177] Huggett C, Levin BC. Toxicity of the pyrolysis and
combustion products of poly(vinyl chlorides): a literature
assessment. Fire Mater 1987;11:131–42.
[178] Wagner JP. Survey of toxic species evolved in the pyrolysis
and combustion of polymers. Fire Res Abstr Rev 1972;14:1.
[179] Stark GWV. Smoke and toxic gases from burning plastics.
Prevent Control Fires Ships Symp 1972;32–44.
[180] Michal J, Mitera J, Tardon S. Toxicity of thermal degradation
products of polyethylene and polypropylene. Fire Mater
1976;1:160–8.
[181] Hilado CJ, Cumming HJ. The effect of test conditions on the
relative toxicity of the pyrolysis products from some plastics.
Fire Technol 1977;13(4):325–8.
[182] Paabo M, Levin BC. A review of the chemical nature and
toxicity of the decomposition products of polyethylenes. Fire
Mater 1987;11:55–70.
[183] Levin BC. A summary of the NBS literature reviews on the
chemical nature and toxicity of the pyrolysis and combustion
products from seven plastics: acrylonitrile–butadiene–styr-
enes (ABS). Fire Mater 1987;11:143–57.
[184] Morikawa T. Evolution of toxic gases from burning
polymeric materials in a small-scale box model. Fire Mater
1988;12:43–9.
[185] Larsen JB, Nelson GL, Williams BK, Spencer EG,
Spencer LM. Effects of metallic coatings on the combus-
tion toxicity of engineering plastics. Fire Mater 1994;18:
121–30.
[186] Rutkowski J, Levin BC. Acrylonitrile–butadiene–styrene
copolymers (ABS): pyrolysis and combustion products and
their toxicity. A review of literature. Fire Mater 1986;10:
93–105.
[187] Sumi K, Tsuchiya Y. Combustion products of polymeric
materials containing nitrogen in their chemical structure.
J Fire Flammability 1973;4:15–22.
[188] Hilado CJ, Schneider JE. Toxicity studies of a polyurethane
rigid foam. J Combust Toxicol 1977;4:79–86.
[189] Hartung R, Ball GL, Boettner EA, Rosenbaum R, Hollings-
worth ZR. Performance of rats on a rotarod during exposure
to combustion products of rigid polyurethane foams and
wood. J Combust Toxicol 1977;4(4):506–22.
[190] Herrington RM. Rate of heat, smoke and toxic gases released
from polyurethane foams. J Fire Flammability 1979;10:
308–25.
[191] Levin BC, Paabo M, Fultz ML, Bailey CS, Yin W, Harris SE.
An accurate inhalation toxicological evaluation of combus-
tion products from fire retarded and non-fire retarded flexible
polyurethane foam and polyester. National Bureau of
Standards (US) PB84-140227, NBSIR83-2791; November
1983. p. 70.
[192] Levin BC, Paabo M, Bailey CS, Harris SE. Toxicity of the
combustion products form a flexible polyurethane foam and a
polyester fabric evaluated separately and together by the
NBS toxicity test method. Proceedings of the First
International Symposium on Fire Safety Science; 1985.
p. 1111–22.
[193] Levin BC, Paabo M, Fultz ML, Bailey CS. Generation of
hydrogen cyanide from flexible polyurethane foam decom-
posed under different combustion conditions. Fire Mater
1985;9(3):125–34.
[194] Paabo M, Levin BC. Review of the literature on the gaseous
products and toxicity generated from the pyrolysis and
combustion of rigid polyurethane foams. Fire Mater 1987;
11(1):1–29.
[195] Hartzell GE. The combustion toxicology of polyurethane
foams. Polyurethanes World Cong Proc 1991;40–51.
[196] Prager FH, Kimmerle G, Maertins T, Mann M, Paulunn J.
Toxicity of the combustion and decomposition products of
polyurethanes. Fire Mater 1994;18:107–19.
[197] Herpol C. Comparative study of the toxicity of combustion
products form flame retardant and untreated materials. Fire
Mater 1983;7(4):193–201.
[198] Petajan JH, Vorhess KJ, Packham SC, Baldwin RC, Einhorn
IN, Grunnet ML, Dinger BG, Birky MM. Extreme toxicity
from combustion products of a fire-retarded polyurethane
foam. Science 1975;187:742–4.
[199] Hilado CJ, Cumming HJ. Relative toxicity of pyrolysis gases
from materials: effects of chemical composition and test
conditions. Fire Mater 1978;2(2):68–79.
[200] Braun E, Levin BC. Polyesters: a review of the literature on
products of combustion and toxicity. Fire Mater 1986;10:
107–23.
[201] Hilado CJ. Relative toxicity of pyrolysis products of
some foams and fabrics. J Combust Toxicol 1976;3(1):
32–60.
[202] Braun E, Levin BC. Nylons: a review of the literature on
products of combustion and toxicity. Fire Mater 1987;11:
71–88.
[203] Hilado CJ, Solis AN, Marcussen WH, Furst A. Effect of
temperature and heating rate on apparent lethal concen-
trations of pyrolysis products. J Combust Toxicol 1976;3(4):
381–92.
[204] Hilado CJ, Soriano JA, Kosola KL. Effect of heating rate on
toxicity of pyrolysis gases from some synthetic polymers.
J Combust Toxicol 1977;4(4):533–55.
[205] Guyot A, Bert M, Michel A. Smoke reduction from polyvinyl
chloride (PVC). Fire Safety J 1983;5:287–97.
[206] Smith GF. Assessment of PVC smoke. Society of Plastics
Engineering (SPE) Conference, Palisades Section; Septem-
ber 1987. p. 124–33.
[207] Hirschler MM, Purser DA. Irritancy of the smoke (non-
flaming mode) from materials used for coating wire and cable
products, both in the presence and absence of halogens in
their chemical composition. Fire Mater 1993;17:7–20.
[208] Brauman SK, Fishman N, Brolly AS, Chamberlain DL.
Sb2O3 – halogen fire retardance in polymers. IV.
Combustion performance. J Fire Retardant Chem 1976;3:
225–64.
[209] Harris RH, Babrauskas V, Levin BC, Paabo M. Data for fire
hazard assessment of selected non-halogenated and haloge-
nated fire retardants. Report of Test FR3983. National
Institute of Standards and Technology (NIST), PB92-
112473; October 1991. p. 55.
[210] Ballisteri A, Montaudo G, Scamporrino E, Puglisi C,
Vitalaini D, Cucinella S. Intumescent flame retardants for
I.S. Wichman / Progress in Energy and Combustion Science 29 (2003) 247–299 297

polymers. IV. The polycarbonate–aromatic sulfonates sys-
tem. J Polym Sci, Part A: Polym Chem 1988;26(8):2113–27.
[211] Camino C, Costa L, Martinasso G. Intumescent fire retardant
systems. Polym Degrad Stab 1989;23(4):359–76.
[212] Myers RE, Dickens ED, Licursi E, Evans RE. Ammonium
pentaborate: an intumescent flame retardant for thermoplas-
tic polyurethanes. J Fire Sci 1985;3(6):432–49.
[213] Camino G, Costa L. Thermal degradation of polymer-fire
retardant mixtures. Part IV. Mechanism of fire retardancy in
polypropylene-chlorinated paraffin mixtures. Polym Degrad
Stab 1982;4:167–71.
[214] Camino G, Costa L, Trossarelli L. Thermal degradation of
polymer-fire retardant mixtures. Part III. Degradation of
products of polypropylene-chlorinated paraffin mixtures.
Polym Degrad Stab 1982;4:133–44.
[215] Costa L, Camino G. Mechanism of action of a fire retardant
chloroparaffin. Polym Degrad Stab 1985;12:125–9.
[216] Costa L, Camino G. Thermal degradation of polymer-fire
retardant mixtures. Part V. Polyethylene–chloroparaffin
mixtures. Polym Degrad Stab 1985;12:105–16.
[217] Brauman SK. Phosphorus fire retardance in polymers. I.
General mode of action. J Fire Retard Chem 1977;4:18–37.
[218] Benbow AW, Cullis CF. The combustion of flexible
polyurethane foams: mechanisms and evaluation of flame
retardance. Combust Flame 1975;24(2):217–30.
[219] Hilado CJ, Damant GH. The effect of flame retardants on
properties, flexible polyurethane foams. J Fire Retardant
Chem 1976;3(2):84–98.
[220] Bonsignore PV, Levendusky TL. Alumina trihydrate as a
flame retardant and smoke suppressive filler in rigid high
density polyurethane foams. J Fire Flammability 1977;8(1):
95–114.
[221] McBrayer RL. Permanence of flame retardance in flexible
polyurethane foams. J Cellular Plast 1978;14(4):224–33.
[222] Handa T, Nagashima T, Ebihara N. Synergistic action of
Sb2O3 with bromine-containing flame retardant in polyole-
fins. Part 2. Structure–effect relationships in flame retardant
systems. J Fire Retardant Chem 1981;8(1):37–50.
[223] Rychla J, Rychla L. Effect of flame retardants on polyolefins.
Fire Mater 1986;10(1):7–10.
[224] Fenimore CP, Jones GW. Modes of inhibiting polymer
flammability. Combust Flame 1966;10:295–301.
[225] Hamins A, et al. Suppression of engine nacelle fires. National
Institute of Standards and Technology Report NIST, SP 890,
vols. I and II; 1995.
[226] Braun E. Report of fire test on an AM General Metro Bus.
National Bureau of Standards (US) NBSIR 75-718; June
1975. p. 21.
[227] Braun E, Davis S, Klote JH, Levin BC, Paabo M. Assessment
of the fire performance of school bus interior components.
National Institute of Standards and Technology PB90-
265307, NISTIR 4347; 1990.
[228] School Bus Safety. US Department of Transportation report;
May 1993. p. 12.
[229] Birky MM, Coats AW, Alderson SE, Brown JE, Paabo M,
Pitt B. Measurements and observations of the toxicological
hazard of fire in a metrorail interior mock-up. Fireline 1976;
PB205768:19.
[230] Braun E. Fire hazard evaluation of BART vehicles. National
Bureau of Standards (US), PB281383, NBSIR 78-1421;
March 1978. p. 24.
[231] Rakaczky JA. Fire and flammability characteristics of
materials used in rail passenger cars, a literature survey.
US Army Report, Ballistics Research Laboratory. Report No.
ARBRL-MR-03009; 1980. p. 100.
[232] Mniszewski K, Campbell J, Waterman TE, Wakeley H. Study
of smoke detection and fire extinguishment for rail transit
vehicles. Urban Mass Transportation Administration,
PB84-142652. Report No. UMTA-MA-06-0153-83-3;
1983. p. 130.
[233] Kaminski A. The current state of european railway fire safety
research. Urban Mass Transportation Administration Report
No. UMTA-MA-06-0152-85-2; June 1985. p. 80.
[234] Ketola HN. Evaluation and testing of rail transit undercar fire
detection and suppression systems. Urban Mass Transit
Administration, PB90-107152. Report No. UMTA-MA-06-
0120-89-1; 1989. p. 151.
[235] Federal Railroad Administration, Rail Passenger Equipment,
Reissuance of guidelines for selecting materials to improve
fire safety characteristics. Federal Register 1989;54(90):
1837–40.
[236] Peacock RD, Bukowski RW, Jones WW, Reneke PA,
Babrauskas V, Brown JE. Fire safety of passenger trains: a
review of current approaches and of new concepts. National
Institute of Science and Technology, PB94152006; January
1994. p. 165.
[237] Haley G, Silverman B, Tajima Y. Development of fire
resistant, non-toxic aircraft interior materials. National
Aeronautics and Space Administration (NASA) N77-14205,
CR-137920, NAS2-8835; September 1976. p. 85.
[238] Dokko W, Ramohalli K. Application of thermochemical
modeling to aircraft interior polymeric materials. Federal
Aviation Administration, DOT/FAA/CT-92/83, N83-12237;
June 1982. p. 74.
[239] Delichatsios MA. Modeling of aircraft cabin fires. National
Bureau of Standards (US), NBS-GCR-84-473, PB85-
137685; September 1984. p. 114.
[240] Reynolds TL, Porter KW. Aircraft cabin water
sprays disbenefits study. Federal Aviation Administration,
DOT/FAA/CT-92/6, AD-A274420; October 1993. p. 148.
[241] Garner RP. Potential for pulmonary heat injury resulting
from the activation of a cabin water spray system to flight
aircraft cabin fires. Federal Aviation Administration, DOT/
FAA/AM-95/17; May 1995. p. 11.
[242] Tapscott R. Halon replacement options for use in aircraft fire
suppression systems. Federal Aviation Administration, DOT/
FAA/AR-96/90; September 1996. p. 54.
[243] Reinfurt DW. A statistical evaluation of the effectiveness of
FMVSS 301 fuel system integrity. US Department of
Transportation, PB82-101965, DOT HS 805 969; June
1981. p. 95.
[244] Flora JD, ODay J. Evaluation of FMVSS 301-fuel system
integrity using police data. National Highway Traffic Safety
Administration (NHTSA) Technical Report, DOT HS-806-
362, UM-HSR1-82-11; March 1982. p. 136.
[245] Parsons GG. Evaluation of federal motor vehicle safety
standard 301-75, fuel system integrity: passenger cars. U.S.
Department of Transportation, DOT HS 806 335, NHTSA
Technical Report; 1983. p. 176.
[246] Tessmer J. An analysis of fires in passenger cars, light
trucks and vans. US Department of Transportation.
NHTSA Technical Report, DOT HS 808 208; 1994. p. 97.
I.S. Wichman / Progress in Energy and Combustion Science 29 (2003) 247–299298

[247] Mowrer FW, Milke JA, Clarke RM. Heavy truck fuel system
safety study. US Department of Transportation, PB90
148024, DOT HS 807 484; August 1989. p. 140.
[248] Berkowitz A. Updated vehicle survivability and travel
mileage schedules. National Highway Traffic Safety Admin-
istration (NHTSA) Technical Report, DOT HS 808 339;
November 1995. p. 32.
[249] Shields L, Scheibe RR, Angelos T. Motor-vehicle collision-
fire analysis: methods and results. National Fire Protection
Association (NFPA) Fall Meeting, Atlanta, GA, November
17, 1998. Also NHTSA-98-3588-77; 1998.
[250] Scheibe RR, Shields LE, Angelos T. Field investigation of
motor-vehicle collision fires. SAE 1999-01-0088. Also
NHTSA-98-3588-70; 1999.
[251] Tewarson A. A study of the flammability of plastics in
vehicle components and parts. NHTSA-98-3588-1 (1997).
Also FMRC J.1. 0B1R7.RC; 1997.
[252] Tewarson A. Generation of heat and chemical compounds in
fires. The SFPE Handbook of Fire Protection Engineering.
Quincy, MA: The National Fire Protection Association Press;
1995 [Chapter 4].
[253] Tewarson A. In: Mark JE, editor. Flammability, Chapter 42
of physical properties of polymers handbook. Woodbury,
NY: The American Institute of Physics; 1996.
[254] Abu-Isa I, Jodeh S, LaDue D. Thermal properties of
automotive polymers. IV. Thermal gravimetric analysis and
differential scanning calorimetry of selected parts from a
Chevrolet Camaro. NHTSA-98-3588-104; 1998.
[255] Santrock J. Flammability properties of engine
compartment fluids other than gasoline. NHTSA-98-3588-
199; 2002.
[256] Santrock J, Kononen DW. Flammability properties of engine
compartment fluids other than gasoline: autoignition charac-
teristics of non-gasoline motor vehicle fluids on heated
surfaces. NHTSA-98-3588-193; 2002.
[257] Santrock J. Evaluation of motor vehicle fire initiation and
propagation. Part 6. Propagation of an underbody gasoline
pool fire in a 1997 rear wheel drive passenger car. NHTSA-
98-3588-158; 2002.
[258] Knox III FS, Bonetti D, Perry C. User’s Manual for
BRNSIM/BURNSIM: a burn hazard assessment model.
USA ARL Report 93-13, Escape and Impact Branch,
Biodynamics and Biocommunications Division, Armstrong
Laboratory, Human Systems Division, Wright-Patterson Air
Force Base, OH and US Army Aeromechanical Research
Laboratory, Fort Rucker, Alabama; 1993.
[259] Purser DA. Toxicity assessment of combustion products. 2nd
ed. Section 2/Chapter 8, SFPE handbook of fire protection
engineering. 2.; 1995. p. 85–146.
[260] Santrock J. Evaluation of motor vehicle fire initiation and
propagation.Part 3. Propagationof an engine compartment fire
in a 1996 passenger van. NHTSA-98-3588-119; 2002.
[261] Santrock J. Evaluation of motor vehicle fire initiation and
propagation. Part 7. Propagation of an engine compartment
fire in a 1887 rear wheel drive passenger vehicle. NHTSA-
98-3588-178; 2002.
[262] Santrock J. Evaluation of motor vehicle fire initiation and
propagation. Part 10. Propagation of a mid-underbody
gasoline pool fire in a 1998 sport utility vehicle. NHTSA-
98-3588-189; 2002.
[263] Jensen JL, Santrock J. Evaluation of motor vehicle fire
initiation and propagation. Part 11. Crash tests on a
front-wheel drive passenger vehicle. NHTSA-98-3588-179;
2002.
[264] Ohlemiller TJ, Shields JR. The effect of polymer resin
substitution on the flammability of a standardized automotive
component in laboratory tests. NHTSA-98-3588-184. Also
NISTIR 6745; June 2002.
[265] Santrock J. Full scale vehicle fire tests of a control vehicle
and a test vehicle containing an HVAC module made from
polymers containing flame-retardant chemicals. NHTSA-98-
3588-190; 2002.
[266] Strom KA, Hamer AJ. Software for characterization of the
hazards posed by heat and exposure to toxic agents
associated with fire. NHTSA-98-3588-191; 2002.
[267] Santrock J. Identification of the base polymers in selected
components and parts from a 1997 Ford explorer by
pyrolysis/gas chromatography/mass spectrometry and atte-
nuated total reflectance/Fourier transform infrared spec-
troscopy. NHTSA-98-3588-182; 2002.
[268] Lemons DS. Perfect form: variational principles, methods
and applications in elementary physics. Princeton, NJ:
Princeton University Press; 1997.
I.S. Wichman / Progress in Energy and Combustion Science 29 (2003) 247–299 299