Material damping of aluminum by a resonant-dwell … DAMPING OF ALUMINUM BY A RESONANT-DWELL...
25
MATERIAL DAMPING OF ALUMINUM BY A RESONANT-DWELL TECHNIQUE by Neal Granick and Jesse E. Stern Goddard Space Flight Center Greenbelt, Md. NATIONAL AERONAUTICS AND SPACE ADMINISTRATION WASHINGTON, D. C. AUGUST 1965 https://ntrs.nasa.gov/search.jsp?R=19650021096 2018-07-08T20:14:08+00:00Z
Transcript of Material damping of aluminum by a resonant-dwell … DAMPING OF ALUMINUM BY A RESONANT-DWELL...
MATERIAL DAMPING OF ALUMINUM BY A RESONANT-DWELL TECHNIQUE
by Neal Granick and Jesse E. Stern
Goddard Space Flight Center Greenbelt, Md.
NATIONAL AERONAUTICS AND SPACE A D M I N I S T R A T I O N WASHINGTON, D. C . AUGUST 1965
https://ntrs.nasa.gov/search.jsp?R=19650021096 2018-07-08T20:14:08+00:00Z

NASA TN D-2893 TECH LIBRARY KAFB. NM
I111 lllll I llllllllll lllll~llr 0079blL
MATERIAL DAMPING OF ALUMINUM BY A
RESONANT-DWELL TECHNIQUE
By Neal Granick and Jesse E . Stern
Goddard Space Flight Center Greenbelt, Md.
NATIONAL AERONAUTICS AND SPACE ADMINISTRATION
For sale by the Clearinghouse for Federal Scientif ic and Technical Information Springfield, Virginio 22151 - Price $2.00

MATERIAL DAMPING OF ALUMINUM BY A RESONANT-DWELL TECHNIQUE
by Neal Granick and Jesse E. Stern
Goddard Space Flight Center
SUMMARY
At intermediate and high stress levels, material damping has been considered stress-amplitude-dependent and c o n t r i b u t i o n s from frequency-dependent anelastic mechanisms have been considered neg- ligible. These considerations are contradicted by the findings of this investigation for Aluminum 2024-T4. The relations between material damping, stress amplitude, and frequency were experimentally ex- amined for this material by means of a resonant-dwell technique em- ploying "identical" double cantilever reeds. Tests were run in air (760 mm, 70"F), and in vacuum (0.2 mm, 70"F), at stress amplitudes up to 20,000 psi and at frequencies from 15 to 1500 cps. Results showed that: damping as measured in air was largely aerodynamic drag and was displacement-amplitude and frequency dependent; damp- ing as measured in vacuum was wholly material damping, independent of s t r e s s amplitudes up to 20,000 psi, and dependent on frequency; and there was agreement with the Zener theory of thermal relaxation.
iii

CONTENTS
Summary . . . . . . . . . . . . . . . . . . . . . . . . . . . . . . . . . . . . . . iii
INTRODUCTION . . . . . . . . . . . . . . . . . . . . . . . . . . . . . . . . . 1
TEST SPECIMEN . . . . . . . . . . . . . . . . . . . . . . . . . . . . . . . . 4
TEST METHOD . . . . . . . . . . . . . . . . . . . . . . . . . . . . . . . . . 5
Facilities and Instrumentation . . . . . . . . . . . . . . . . . . . . . 5 Erro r s Due to External Damping . . . . . . . . . . . . . . . . . . . 5 Measurement E r ro r s . . . . . . . . . . . . . . . . . . . . . . . . . . . 7 Damping and Resonant Frequency Differences . . . . . . . . . . 7 Determination of Resonant Frequency . . . . . . . . . . . . . . . . Determination of Test Stress Levels . . . . . . . . . . . . . . . . .
8 10
TEST PROCEDURE . . . . . . . . . . . . . . . . . . . . . . . . . . . . . . . 11
Application of Optical Tracking Targets to Test Specimen . . .
Test Run In Air . . . . . . . . . . . . . . . . . . . . . . . . . . . . . . . Test Run In Vacuum . . . . . . . . . . . . . . . . . . . . . . . . . . . .
11 11 14 14
Dynamic Beam Balance (Reed Tuning) . . . . . . . . . . . . . . . .
RESULTS AND CONCLUSIONS . . . . . . . . . . . . . . . . . . . . . . . 14
References . . . . . . . . . . . . . . . . . . . . . . . . . . . . . . . . . . . . . 20
Appendix A-List of Symbols . . . . . . . . . . . . . . . . . . . . . . . . . 21
V

MATERIAL DAMPING OF ALUMINUM BY A RESONANT-DWELL TECHNIQUE
by Neal Granick and Jesse E. Stern
Goddard Space Flight Center
INTRODUCTION
Damping is an energy dissipative process which is manifested during the mechanical vibration of structural elements and systems. It is of particular interest to the dynamicist and designer who is concerned with the analysis and development of equipment which must function success- fully and survive in a mechanically dynamic environment.
The damping of structural systems may be separated into three general types: joint damping arising from friction sliding and slapping of joint interfaces; air o r fluid damping arising from loss or transmission of energy to the surrounding fluids; and material damping, an internal energy loss, arising from complex internal behavior of the material itself.
In order to design and predict the behavior of structural systems with greater accuracy, it is necessary to have quantitative damping information. This paper is a report on the quantitative evaluation of material damping of aluminum. Aluminum was selected for initial investigation since it is extensively used as a structural material for spacecraft. Other materials will be in- vestigated in the near future.
Considerable effort has been made in experimentally determining the material damping prop- erties of metals subject to vibration. Most metals investigated have exhibited a non-linear de- pendence of material damping with respect to vibration amplitudes and, in some cases, have also exhibited a dependence on frequency. Crandall (Reference 1) investigated the problem of material damping and proposed the following relations,
and
1

where
g = material damping coefficient, s = stress amplitude, w = vibration frequency (radians), T = relaxation t ime for temperature equalization in a specimen by transverse heat flow,
so, n = material constants.
The frequency dependent te rm in Equation 2 was suggested by Zener's relation (Reference 2)
when
h2 c
n2k 7 = -
for a flat beam of uniform thickness, where
a = coefficient of linear expansion, c = specific heat per unit volume, E = modulus of elasticity, T = absolute temperature, h = thickness of cantilever beam, k = thermal conductivity.
From Equations 1 and 2, Crandall derived explicit relations for evaluating the specimen damping coefficient of a cantilever beam at its first mode resonance,
and
where
p = mass density of beam material, a = acceleration amplitude of beam root,
= first mode resonant frequency, R = f (material, mode shape),
W 1
gs = specimen damping coefficient related to g by
2

Crandall also showed that
and for a cantilever beam
where
Q = magnification factor at resonance, 6 , = input root displacement at resonance, s r = output tip displacement at resonance.
For a given material, geometry and mode shape R , p , E , 4 and 5 reduce to
so, n , and T are constants and Equations
and
n 1
If the relaxation time T is large such that w12 7' >> 1 , then Equation 8 reduces to
n
g s = K' - w1
where
1
K' - - K($)=
Equations 6, 7, and 8 show that: the specimen damping coefficient can be determined by measuring the magnification factor at resonance; the material constant, n , can be evaluated by measuring the slope of a log-log plot of g s vs. a/wl for Equation 7, and gswl vs. a for Equation 8a; and So
can be computed when n has been determined.
3

A check of Equations 7 and 8a against data taken by Vet (Reference 3) correlated well with Equation 7 for steel and brass but failed for aluminum, and correlated well with Equation 8a for aluminum but failed for steel and brass . Vet's data included air damping and probably some joint damping. To evaluate more accurately the validity of Crandall's proposed relationships, damping tes ts were run which eliminated. minimized, or accounted for these external effects. This was accomplished by testing in a i r and in a vacuum, and by developing improved tes t techniques.
TEST SPECIMEN
'The test method selected for this investigation was a steady state excitation of a cantilever beam by an electromagnetic vibrator.
Before selecting a beam configuration, consideration was given to two problems affecting the dynamic behavior of the vibrating system: joint damping at the beam-vibrator table interface, and the generation of an undesired rocking mode on the beam-vibrator table system.
An examination of the single reed cantilever in Figures lb. IC and Id shows that a moment reaction, M O B , at the fastener, will always exist and have a value equal to or greater than the root moment, M ' . The moment, \I,,: increases the probability of joint damping. Further, to prevent a r o c ~ i n g mode i t is necessary that F'd ' . M'. To satisfy this relation, the beam must be posi- tioned by a time consuming. tr ial and e r ro r process until rocking is eliminated.
An examination of the double reed cantilever in Figures lb. IC and Id shows that i f F, F, , M, - M, , and F, and F, are equidistant from and parallel to the elastic axis. then. M,. themoment reactionat the fastener. vanishes and the probability of joint damping is reduced. Further, the sum of the moments (F,tl, - F2d2 - M, - M 2 ) also vanishes and the causes of rocking are eliminated. This is achieved by a double reed cantilever beam in which the geometry of both reeds is identical and the center of the base block is located on the geometric center of the vibrator table. For a well designed table the geometric center is coincident with the elastic axis, the center of gravity of the vibrator table, and the resultant electromagnetic driving force. For these reasons, the double reed cantilever beam was chosen for the test beam configuration.
Adequacy of the test specimen depends upon an ability to carefully fabricate each reed to the same geometry in order to have an identical and symmetrical response. In practice, there will always exist a small difference in "identical" reeds due to manufacturing techniques. To over- come this problem, the reeds were manually tuned to the same frequency. This was accomplished by exciting the beam specimen, observing the resonant frequencies of both reeds, and then placing additional mass on the tip of the reed exhibiting higher resonance until the resonant frequencies of both reeds were equal.
The test specimens were designed with first bending mode resonances in the frequency range 15-1500 cps. Length to width ratios of at least 6:l helped minimize the effects of Poisson's ratio. Reed thickness for some specimens was varied to determine the effect of the relaxation time, T .
4
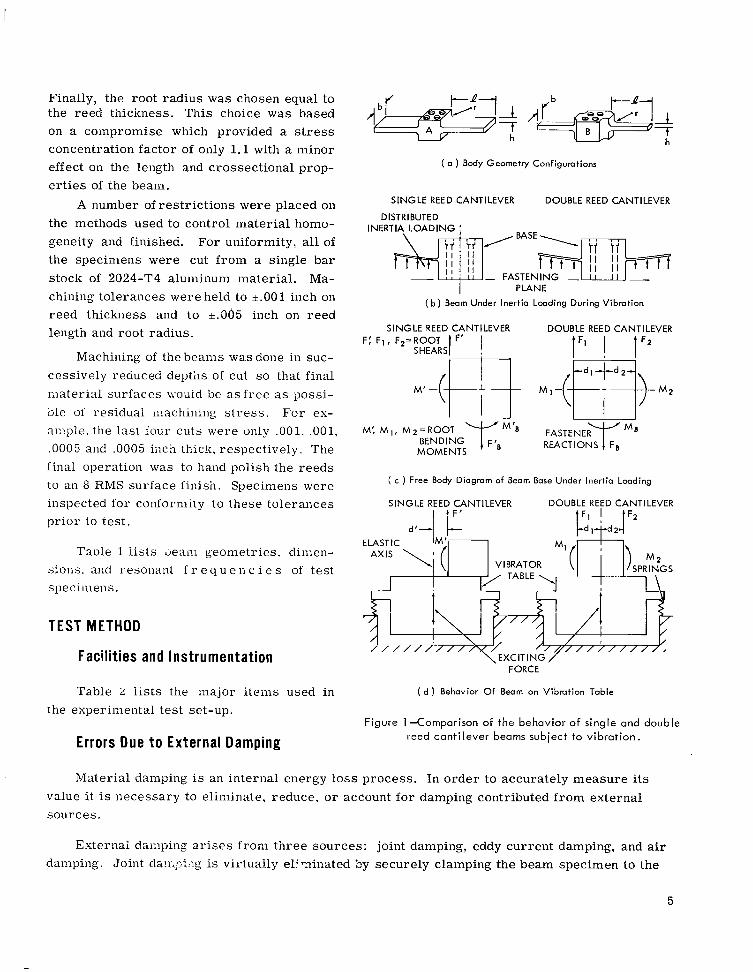
Finally, the root radius was chosen equal to the reed thickness. This choice was based on a coinpromise which provided a stress concentration factor of only 1.1 with a minor effect 011 the length and crossectional prop- e r t ies of the beam.
A number of restrictions were placed 011 the methods used to control material homo- geneity and finished. For uniformity, all of the specimens were cut from a single bar stock of 2024-T4 aluminum material. Ma- chining tolerances were held to k.001 inch on reed thickness and to k.005 inch 011 reed length and root radius.
Machining of the beanis was done i n suc- cessively reduced depths of cut so that final material surfaces would be a s f ree a s possi- ble oi residual machining s t r e s s . For ex- ai:iple. the last four cuts were only .001. .001, .0005 and .0005 inch thic!i. respectively. The final operation was to hand polish the reeds to an 8 RMS surface finish. Specimens were inspected for c o nf o nii it y to these t 01 er aiic e s prior to test.
Taule 1 l is ts 3eam geometries. dimen- sions. and resonant f r e q u e n c i e s of test si:, e c i 111 ens .
TEST METHOD
Facilities and Instrumentation
Table 2 lists the major iteiiis used i n the experiment a1 test set - up.
Errors Due t o External Damping
h h
( a ) Body Geometry Configurations
SINGLE REED CANTILEVER DOUBLE REED CANTILEVER
DISTRIBUTED INERTIA LOADING
I I I I
PLANE ( b ) Beam Under Inertia Loading During Vibration
SINGLE REED CANTILEVER DOUBLE REED CANTILEVER
IFi I lF2
( c ) Free Body Diagram of Beam Base Under Inertia Loading
SINGLE REED YNTILEVER DOUBLE REED CANTILEVER
I 1F
ELASTIC
SPRINGS VIBRATOR TABLE \
I / / / / / / / / EXCITING
FORCE
( d ) Behavior O f Beam on Vibration Table
Figure 1 -Comparison of the behavior of single and double reed canti lever beams subject to vibration.
Material damping is an internal energy loss process. In order to accurately measure i ts value it is necessary to eliminate, reduce. or account for damping contributed from external sources .
External damping a r i se s from three sources: joint damping, eddy current damping, and air damping. Joint da!y+i::g is virtually el! Tiinated by securely clamping the beam specimen to the
5
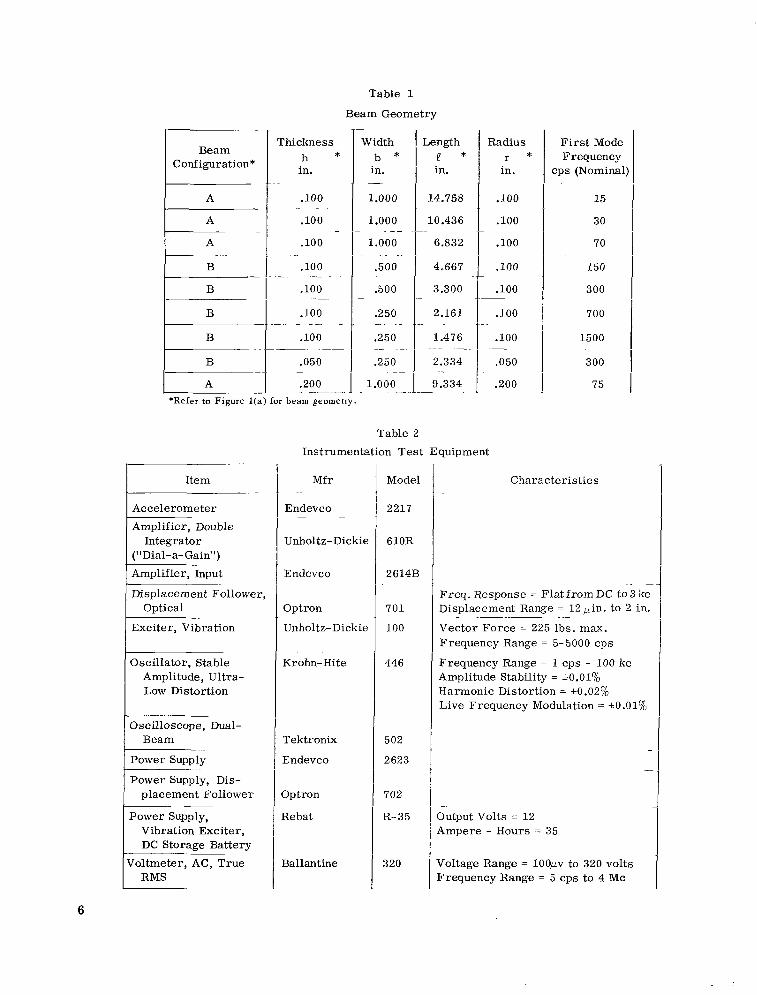
Table 1
Beam Geometry
Beam Configuration*
A
A
A
B
B __
B
B
B
A
Thickness h *
in.
.loo
. loo
. l oo
. l o o
. loo
. loo
. l oo
.050
.200
- . .
-
. .
~ ~~
- .. - - - -
-.
-
Width b *
in.
1.000
1.000
1.000
-500
.500
.250
.250
.250
1.000
-
_ _
-
-
- -
_ _
-
Length
in.
14.758
10.436
6.832
4.667
3.300
2.161
1.476
2.334
9.334
e *
__
.-
-
Radius
in.
. loo
. l oo
. l oo
. loo
. loo
r *
. loo
. l oo
*Refer to Figure l(a) for beam geometry.
Table 2 Instrumentation Test Equipment
.050
.200
Item
Accelerometer Amplifier, Double
Integrator ("Dial-a-Gain")
Amplifier, Input
Displacement Follower, Optical
Exciter, Vibration
Oscillator, Stable Amplitude, Ultra- Low Distortion
3scilloscope, Dual-
Power Supplv
Beam
~
Power Supply, Dis- placement Follower
Power Supply, Vibration Exciter, DC Storage Battery
roltmeter, AC, True RMS
Mfr
Endevco
-
- -
Unholtz-Dickie
Endevco
Optron
Unholtz-Dickie
Krohn-Hite
Tektronix
Endevco
Optron
Rebat
Ballantine
Model
2217
610R
2614B
701
100
446
502
2623
702
R-35
320
Fi rs t Mode Frequency
cps (Nominal
15
30
70
150
300
700
1500
300
75
Characteristics
.. -
Freq. Response = Flat from DC to 3 kc Displacement Range = 12@. to 2 in.
Vector Force = 225 Ibs. m a . Frequency Range = 5-5000 cps
Frequency Range = 1 cps - 100 kc Amplitude Stability = *O.Ol% Harmonic Distortion = *0.02% Live Frequency Modulation = * O . O l %
- -.
-.
output Volts = 12 Ampere - Hours = 35
Voltage Range = 1OOgv to 320 volts Frequency Range = 5 cps to 4 Mc
6

vibrator table and by eliminating, through design, conditions which foster excessive loads on the joint. Eddy current damping a r i se s from the movement of the beam in the magnetic field of the electrodynamic exciter. Tests were run in which the dc field current of the exciter was varied from 10 to 40 amperes. No measurable change in response was observed under these conditions. Therefore, the eddy current damping was negligible in these tests. All subsequent tes ts were run with an 8 ampere field current. Air damping and energy transfer to the air was eliminated by testing in a vacuum.
Measurement Errors
Previously, it was shown that the specimen damping coefficient was related to the magnifi- cation factor at resonance. Therefore, any e r r o r s in producing and measuring the input and output amplitudes must be eliminated. This requires a translational rigid body response of the beam- vibrator table system in the direction of the exciting force. The appearance of a coupled rocking mode on the system presents two problems: evaluating the relation between the input excitation and the output amplitudes of the reeds, and measuring the amount of beam energy transferred to or dissipated in the vibrator table support system. The use of the tuned double-reed cantilever beam described earlier virtually eliminated these problems.
Since material damping is small a high Q may be expected. From Equation 6c it can be seen
The input displacement, 6, , w a s derived by measuring the that e r r o r s in measuring b o and b r a r e critical, particularly with respect to 8, which may be
orders of magnitude smaller than 6r . input frequency and acceleration with a calibrated, high sensitivity, high signal-to-noise ratio, accelerometer- amplifier system. The system sensitivity was 500 mv/g; the system noise level was about 2 millivolts; and the lowest measured signal during the tes ts w a s approximately 20 millivolts for an acceleration of about 0.04g. The accuracy of this measurement technique w a s about +3% of reading. Ripple in the input displacement w a s eliminated by energizing the vibrator field with direct current from storage batteries rather than by a rectified alternating current
supply.
Reed tip displacements were measured by a massless non-contact method of measuring tip displacement, using optical displacement followers. The displacement followers provided an electrical signal proportional to displacement, permitting simultaneous measurement and com- parison of the two reed tip motions on a meter-oscilloscope arrangement. It was also possible to compare input and output motions. The accuracy of the displacement follower measurement system was about 1% of full scale. Measurements taken during this investigation were repeatable within 4.5%.
Damping and Resonant Frequency Differences
An analog computer study* was made to determine the effects on reed motion caused by dif- ferences in damping and resonant frequencies between the two reeds. The results showed that: a
*Heine, J., “Analysis of a Model for the Experimental Determination of Damping,” Private Communication.
7

I I 111 I I1.1.1111111111.11 111111II 1 1 1 1 1 1 . 1 1 1 ,111, .I.. 111 I I
1% damping difference produced about a 1-1/2% amplitude difference and no significant phase dif- ference between the two reeds; a 0.1% resonant frequency difference produced about a 50% ampli- tude difference and about 60" phase angle difference between reeds; and for each reed the phase angle between input and output displacements rapidly changed at frequencies very close to the resonant frequency of each reed.
This study indicated that it is critical for each reed to have the same natural frequency if valid data a r e to be obtained. It also indicated that the phase angle difference between the two reeds can be used as a highly accurate means of tuning the reeds to the same frequency.
Determination of Resonant Frequency
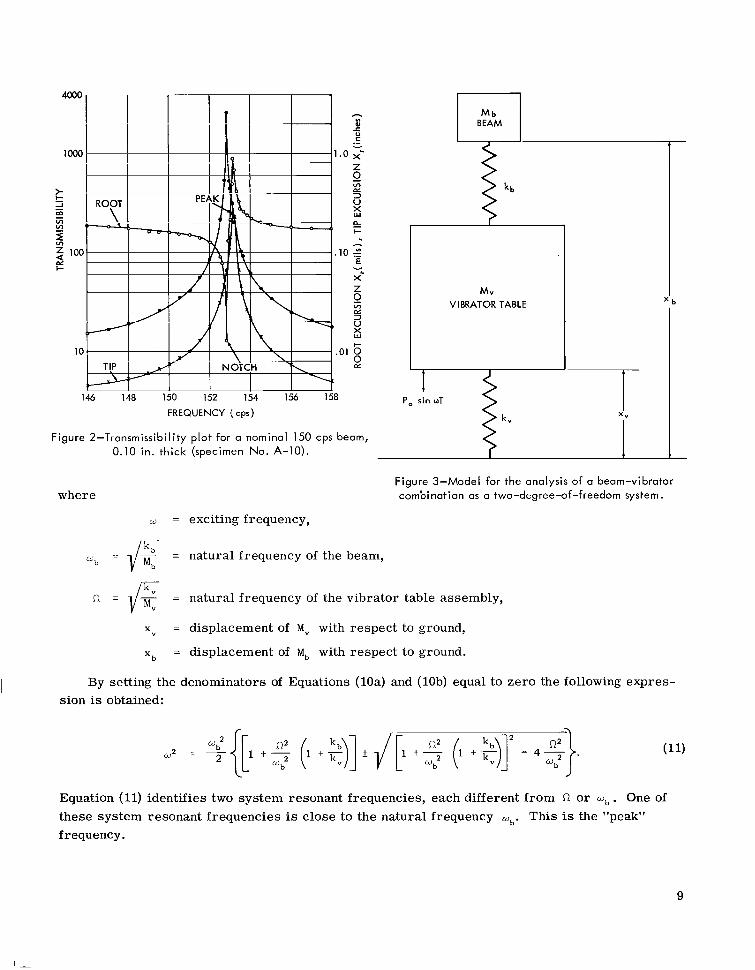
The natural frequencies of the reeds must be experimentally determined before material damping data is obtained. During this determination it was observed that two significant frequen- cies appeared: a "notch" frequency at which the input (root) amplitude reached a minimum for a fixed input force amplitude, and a "peak" frequency at which the output (tip) amplitude reached a maximum for the same fixed force input amplitude (see Figure 2). The difference between these frequencies w a s small. It was also observed that large differences in the magnification factor existed when the reeds were excited at the "notch" or "peak". This raised the questions, "What are the 'notch' and 'peak' frequencies," and "At what frequency do we excite the tes t specimen?".
To answer these questions a simplified analysis was performed. The following assumptions were made: the beam-vibrator table system is a two degree of freedom system with lumped parameters, the system is responsive only in translational modes, and damping is neglected since it i s very small and has no effect on resonant frequencies. A schematic arrangement of the sys- tem is shown in Figure 3 . The differential equations of motion for the system are:
(94 M v x v + (kv + kb) xy - kbxb = Po s i n w t ,
M,x, + k, (xb - xv) = 0 . (9b)
The solution to these equations is
and
f
8
4000
G -c C
xv = displacement of MY with respect to ground,
x b = displacement of Mb with respect to ground.
By setting the denominators of Equations (loa) and (lob) equal to zero the following expres- sion is obtained:
Mb BEAM
Equation (11) identifies two system resonant frequencies, each different from these system resonant frequencies is close to the natural frequency Wb. This is the "peak" frequency.
or wb . One of
k v)
2 k
3 2 100 .10 1 E
X + v
Z M" 9
t! 10 .01 0'
P
VIBRATOR TABLE Y) CT 3 V
9
Figure 2-Transmissibility plot for a nominal 150 cps beam,

It has been shown that Q is related to the specimen damping coefficient by
Q is defined as the magnification factor at resonance or the maximum magdica t ion factor. The magnification factor, F , for the beam is
and
It can also be seen from Equation 10a that xy = o when w = ab. Hence, can be identified as the "notch" frequency; and data on damping characterist ics must be obtained at this frequency, where the table's vibration amplitude is at a minimum.
Determination of Test Stress levels
Defining the relation between damping and s t r e s s amplitudes was one of the major objectives of this investigation. The use of strain gages suggested a simple and effective method for meas- uring the s t resses , but w a s discarded because it might have introduced additional and uncertain damping from the adhesive joint and from the gage backing material. It was decided that root s t resses could best be evaluated by measuring the dynamic displacement of a particular point on the cantilever reed, generally the tip, and computing the s t resses from the equations of dynamic displacement (Reference 4) :
wP4 1 - - S x - 8 ~ 1 [T (cash 1.875 p - COS 1.875 f) - I "I 368 (sinh 1.875f - sin 1 . 8 7 5 ~
h 1.76 hESx
r M r - 5 - ~- - (3 = -
cosh 1.875$- cos 1.875f) - ,368 (sinh 1.875F - sin
10

where
b x
M~ = bending moment at root,
y r = s t r e s s at cantilever root,
= displacement of cantilever at a distance x from the root.
1) = reed length,
h = reed thickness. = weight of beam per unit length.
In order to experimentally check the s t ress , : r , as computed by Equation 15, several of the reeds were instrumented with strain gages after the damping tes ts were run. These were located on the flat portion of the beam near the root radius. The reeds were excited at predetermined amplitudes, ? x ' and the measured s t r e s ses were observed. The s t resses computed from Equa- tion 15 were within 5% of the measured s t resses . This indicated that the technique of indirect s t r e s s measurement w a s satisfactory and reasonably accurate.
TESTPROCEDURE
Figure 4 shows the instrumentation block diagram; Figure 5 a typical test setup; and Fig- ure 6 beams for each resonant frequency.
Application of Optical Tracking
Targets t o Test Specimen
Beam specimens were cleaned with ace- tone o r trichlorethylene to remove al ldir t and oil film. Adhesive backed targets were cut to a height equal to the thickness of the reeds and to a width of 1/8,inch. Four targets were ap- plied to the tips of the reeds as shown in Fig- u r e 7. Where the tip amplitudes of the reeds were expected to exceed the range of the opti- cal displacement follower, the targets were moved a known distance in from the tip. The displacement of this point is related to the tip displacement through the bending curve equa- tion. Four s y m m e t r i c a l l y located targets were used t o limit unbalance in the reeds.
Dynamic Beam Balance (Reed Tuning)
After the targets w e r e attached, the test specimen was fastened to the vibrator table by
- K R F H HlTE UN$g OSCILLATOR A M P L l F I ER
DC POWER
ENDEVCO ACCELEROM
U N HO LTZ D l C K l E H SHAKER
A I RCRAFl BATTERIES I
1 I
OPTRON POWER SUPPLY
BALLANTINE i :q
TEKTRON I C OSCILLOSCOPE
BALLANTINE V T V M
ELECTRICAL ~
CONNECTION
CONNECTION MECHANICAL CONNECTION
OPTICAL ----
Figure 4-Instrumentation block diagram.
11

P
Figure 5-Typical measurement test setup.
t
700 CPS
150 CPS
Figure 6-Beams for each measurement frequency.
12

four #10 cap screws with about 20 inch pounds torque per screw. Two were optical displace- ment followers focussed or "locked on" the targets, one at each reed. The output of the displacement followers was fed into a dual beam oscilloscope. The following was then performed:
1. The tes t specimen was excited with a low level, fixed-force amplitude through a fre- quency range of about 5% below and above the calculated natural frequency of the reeds.
ALUMINIZED REFLECTIVE
SURFACE OPTICAL TRACKING TARGETS
1
OPTICAL TRACKING TARGETS THICKNESS
TARGET 0 0
0 0 DULL BLACK 1.
Figure 7-Location of optical tracking targets.
2. The displacement follower output signals were observed on the oscilloscope noting the frequency at which each reed reached its maximum amplitude and the phase angle between ampli- tudes as each reed passed through i t s maximum amplitude (Figure 8). If the phase angle was zero the two reeds were tuned to the same natural frequency.
3 . Where a phase angle existed a t r ia l mass w a s added to the tip of the higher natural fre- quency reed and steps (1) and (2) were repeated.
4. If a phase angle still existed after step (3), additional mass was added or previously added mass was removed until the phase angle was zero, indicating that the reeds were tuned to the same natural frequency. The addition o r removal of mass was determined by the magnitude and shift in the phase angle (Figure 8 (b and c).
1 9 , + INITIAL PHASE --! p- PHASE ANGLE
I ' I ANGLE I I Q 2 < Q '
1 .
2 .
Reeds not tuned to same frequency ( init ial condition) added Reed 1 initially lower natutul frequency than reed 2.
Reeds after insufficieni trial mass has been
Reed after excessive trial moss has been added
Reeds tuned to some frequency ( f ina l condition).
Figure 8-Reed t ip displacement as seen on dual-beam oscilloscope.
13
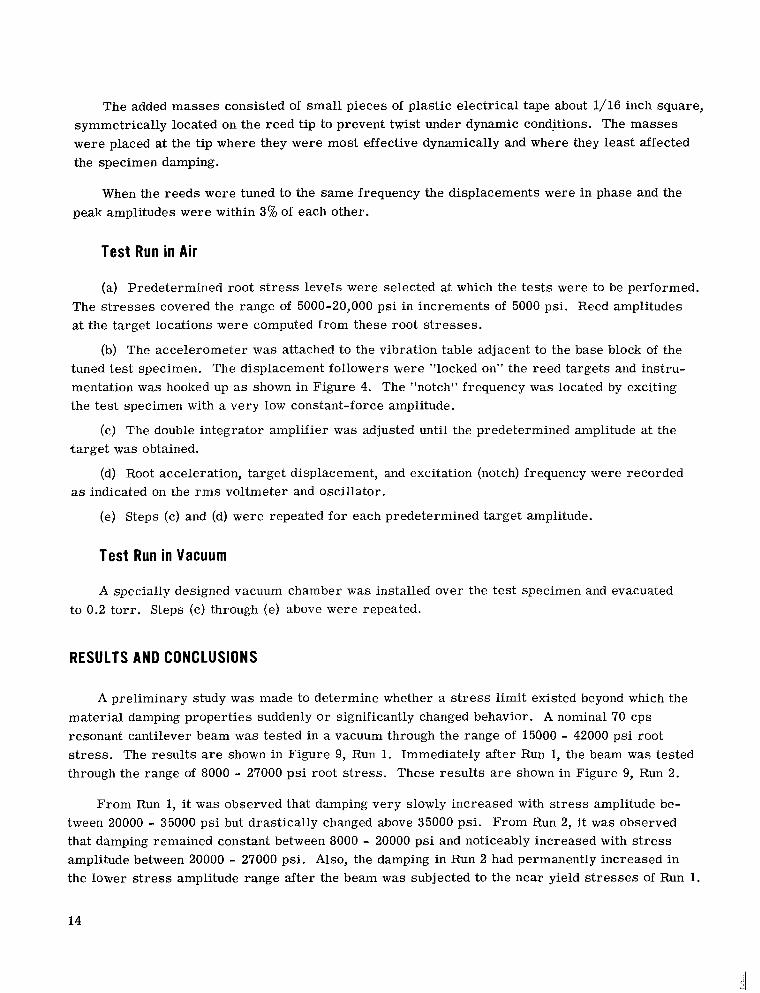
The added masses consisted of small pieces of plastic electrical tape about 1/16 inch square, symmetrically located on the reed tip to prevent twist under dynamic conditions. The masses were placed at the tip where they were most effective dynamically and where they least affected the specimen damping.
When the reeds were tuned to the same frequency the displacements were in phase and the peak amplitudes were within 3% of each other.
Test Run in Air
(a) Predetermined root s t r e s s levels were selected at which the tes ts were to be performed. The s t resses covered the range of 5000-20,000 psi in increments of 5000 psi. Reed amplitudes at the target locations were computed from these root s t resses .
(b) The accelerometer w a s attached to the vibration table adjacent to the base block of the tuned test specimen. The displacement followers were "locked on" the reed targets and instru- mentation was hooked up as shown in Figure 4. The "notch" frequency was located by exciting the test specimen with a very low constant-force amplitude.
(c) The double integrator amplifier was adjusted until the predetermined amplitude at the target was obtained.
(d) Root acceleration, target displacement, and excitation (notch) frequency were recorded as indicated on the r m s voltmeter and oscillator.
(e) Steps (c) and (d) were repeated for each predetermined target amplitude.
Test Run in Vacuum
A specially designed vacuum chamber w a s installed over the tes t specimen and evacuated to 0.2 torr . Steps (c) through (e) above were repeated.
RESULTS AND CONCLUSIONS
A preliminary study was made to determine whether a s t r e s s limit existed beyond which the material damping properties suddenly o r significantly changed behavior. A nominal 70 cps resonant cantilever beam was tested in a vacuum through the range of 15000 - 42000 psi root s t ress . The results are shown in Figure 9, Run 1. Immediately after Run 1, the beam was tested through the range of 8000 - 27000 psi root s t ress . These results a r e shown in Figure 9, Run 2.
From Run 1, it was observed that damping very slowly increased with s t ress amplitude be- tween 20000 - 35000 psi but drastically changed above 35000 psi. From Run 2, it was observed that damping remained constant between 8000 - 20000 psi and noticeably increased with s t r e s s amplitude between 20000 - 27000 psi. Also, the damping in Run 2 had permanently increased in the lower s t r e s s amplitude range after the beam was subjected to the near yield s t resses of Run 1.
14

Therefore, tes ts were limited to s t r e s s levels up to 20,000 psi to maintain the original ma- ter ia l damping characteristics of the beams.
The results of the investigation for alu- minum 2024-T4 a re shown in Figures 10-15 and in Table 3 and Table 4. Figures 10- 12 are plotted in accordance with the log form of Equation 8a,
0 1 1 . 2
G 1 . 1
u.
(3 $1 .0
8 a Q v
0 -
L u
0 3 0.9 K' n
PEAK R O O T STRESS ( x 1000 psi) log g s = log- + (m) l o g a . (16)
w1 m
I
~i~~~~ 13 is plotted in accordance with a modified log form of Equation 8a,
Figure 9-Graph showing the location of stress l imit and the effect of near y ie ld stresseson thedamping coefficient.
m r- I
Figure 10 compares damping for a nomi-
ured in air at ambient pressures and in a
u 0
z nal 70 cps resonant frequency beam as meas- $ I I N V A T U M
d
I 1 20,000 psi
20,000 psi
I I 2 .
I I , # I
vacuum of 0.2 torr , over the same s t r e s s amplitude range of 5000 to 20,000 psi. The "in 2 U l o - s i , >L air" plot shows the non-linear behavior of damping in air w h e r e the quantity n , has a value of 0.78 as calculated from the slope of the plot. This compares with 0.77 as reported by Crandall (Reference l). The slope of the "in vacuum" plot is zero, hence the quantity n is zero, indicating that the damping in vacuum is independent of s t r e s s amplitude. It should be noted here that g s = g where n = o (see Reference 1).
5 5000 psi
0.01 0.05 0.1 0.5
ROOT ACCELERATION ( g )
Figure 10-Comparison of damping in VaCUVm with damping i n air for a nominal 70 cps beam stressed be-
tween 5000 and 20,000 psi at beam root.
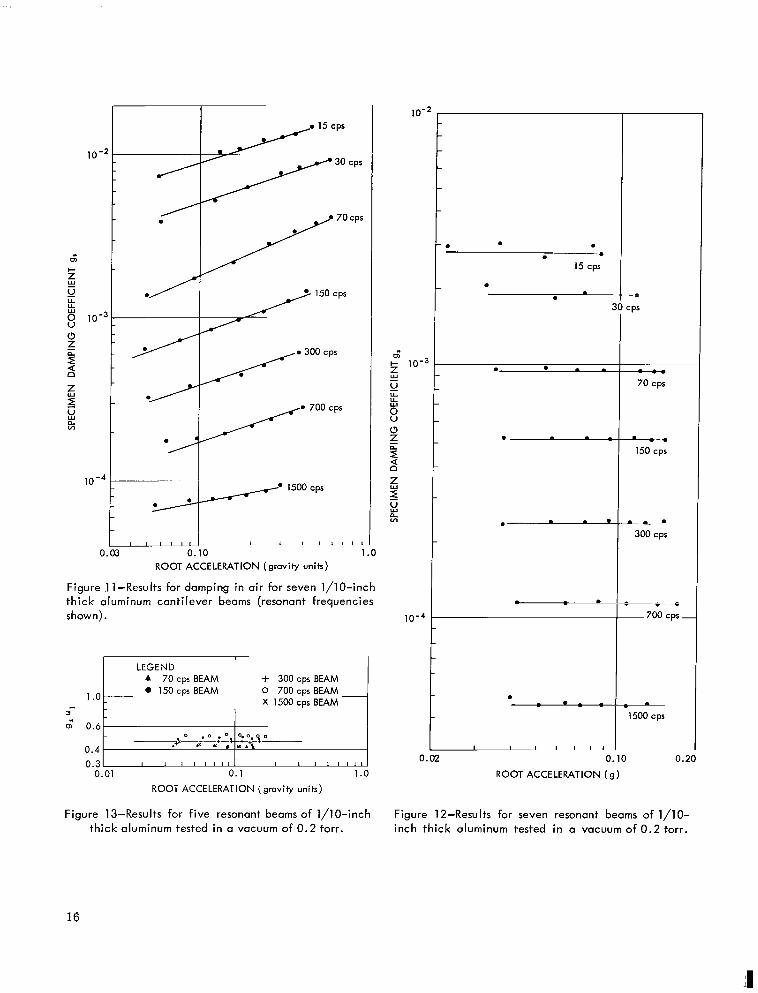
Figure 11 shows the non-linear behavior of damping in air for the ser ies of beams tested. It shows that damping is frequency and amplitude dependent. The amplitude dependence appears to be due to displacement o r velocity and not to s t r e s s (Figure 12). The non-linear behavior then may be attributed to air damping.
Figure 12 shows the behavior of damping in vacuum for the same ser ies of beams. The slopes of all the curves are zero, hence n is zero and s t r e s s amplitude independence is shown. The damping here is material damping only and its dependence on frequency is clearly evident.
Figure 13 further shows the independence of damping on stress amplitude and the constancy of the product g s u .
15
10-2
.. m
I-
5
i 10-3
4 d t r 8
u U U
0 E
n. ln
1 .o - 3
o, 0.6
0.4
0
LEGEND A 70cps BEAM + 300cps BEAM 0 150 cps BEAM 0 700 cps BEAM
X 1500 cps BEAM -
I *-d-m+T 2;$: 0 . O .o 0.0
I
7 l5OoCPS
I I I I I I I 1 1 I t 1 1 1
1 i
ROOT ACCELERATION (gravity units)
Figure 11-Results for damping in air for seven l/lO-inch thick aluminum cantilever beams (resonant frequencies shown).
0.31 I I l l I I I I I I I I l l
0.01 0.1
ROOT ACCELERATION (gravity unik)
Figure 13-Results for f ive resonant beams of l/lO-inch thick aluminum tested in a vacuum of 0.2 torr.
t
~ -___ 15 cps
t t 2 2 n. v)
0 1 .
10-4i 0 - t
- 70 cps
- 150 cps
L a- 0
300 cps
-- . --4
~ 700 cps -
- 1500 cps
0.02 0.10 0.20
ROOT ACCELERATION (9)
Figure 12-Results for seven resonant beams of 1/10- inch thick aluminum tested i n a vacuum of 0.2 torr.
16

f 2
THEORETICAL
FREQUENCY (cpr)
Figure 14-Comparison of damping as calculated by theoretical thermal relaxation equations and as meas- ured e x p e r i m e n t a l l y (forO.lO-inch thickaluminum beams).
a
/ THEORETICAL
Figures 14 and 15 show good correlation with Zener's expression; (Equation 3).
The following conclusions may be drawn from the results obtained.
1. A unique, simple and accurate technique has been developed for measuring ma- terial damping.
2. Material damping of Aluminum 2024-T4 is (1) independent of s t ress amplitudes up to 20,000 psi and (2) frequency de- pendent in the range 15-1500 cps.
1.0
BEAM THICKNESS h (in)
EXPERIMENTAL
/
h 2 c n 2 k
T = -
Figure 15-Comparison of gw as measuredon three thick- nesses of beams with theoretical gw for beams in the same thickness range #2t2 >> 1 ).
3. Material damping of Aluminum 2024-T4 is independent of s t r e s s history at s t resses below 20,000 psi.
4. Material damping of Aluminum 2024-T4 can be quantitatively evaluated by the Zener re- lation, g = (~ZET/~) (m/l + m ~ ) .
5. Air damping as observed during these tests provides a significant contribution to total damping and may be as much as 10 t imes greater than material damping.
Manuscript received July 29, 1964.
17
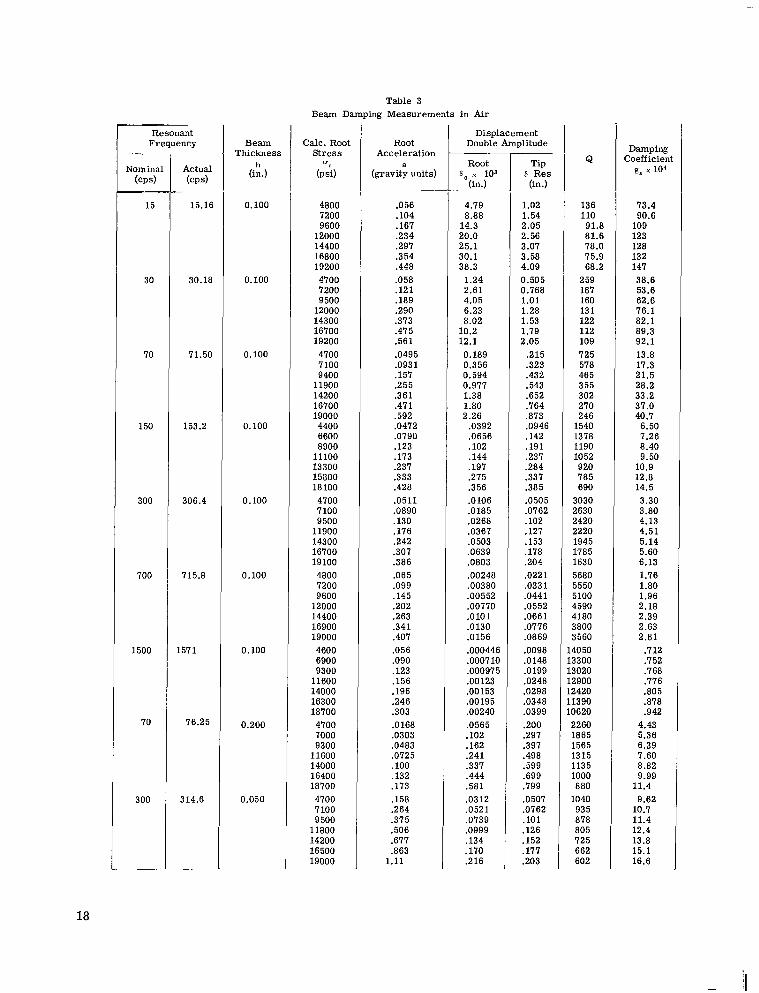
Table 3 Beam Damping Measurements in Air
Resonant Frequency
Nomina (CPS)
15
30
70
150
300
700
1500
70
300
-
Actual (CPS)
~ ~
15.16
30.18
71.50
153.2
306.4
715.8
1571
76.25
314.6
__
Beam Thickness
h (in.)
0.100
0.100
0.100
0.100
0.100
0.100
0.100
0.200
0.050
Calc. Root Stress 0,
(Psi)
4800 7200 9600
12000 14400 16800 19200 4700 7200 9500
12000 14300 16700 19200 4700 7 100 9400
11900 14200 16700 19000 4400 6600 8900
11 100 13300 15800 18100 4700 7 100 9500
11900 14300 16700 19100 4800 7200 9600
12000 14400 16900 19000 4600 6900 9300
11600 14000 16300 18700 4700 7000 9300
11600 14000 16400 18700 4700 7 100 9500
11800 14200 16500 19000
Root
a Accelera
(gravity U I
.056
. lo4
.167
.234
.297
.354
.448 .058 .121 .189 .290 .373 .475 .561 .0495 .093 1 .157 .255 .361 .47 1 .592 .0472 .0790 .123 .173 .237 .333 .428 .0511 .0890 .130 .176 .242 .307 .386 .065 .099 .145 .202 .263 .341 .407 .056 .090 .123 .156 .196 2 4 6 .303 .0168 .0303 .0483 .0725 .loo .132 .173 .158 .264 .375 .506 .677 .863
1.11
Displacement Double Amplitude
Root
(in.)
4.79 8.88
8, 103 -~
14.3 20.0 25.1 30.1 38.3
1.24 2.61 4.05 6.23 8.02
10.2 12.1 0.189 0.356 0.594 0.977 1.38 1.80 2.26
.0392
.0656
.lo2
.144
.197
.275
.356
.0106
.0185
.0268
.0367
.0503
.0639
.0803
.00248
.00380
.00552
.00770
.0101
.0130
.0156
.000446
.000710
.000975
.00123
.00153
.00195
.00240
.0565
.lo2
.162
.241
.337
.444
.581
.0312
.0521
.0739
.0999
.134
.170
.216
Tip 6 Res
(in.)
1.02 1.54 2.05 2.56 3.07 3.58 4.09 0.505 0.768 1.01 1.28 1.53 1.79 2.05
.215
.323
.432
.543
.652
.764
.873
.0946
.142
.191
.237 2 8 4 .337 .385 .0505 .0762 . lo2 .127 .153 .178 .204 .0221 .033 1 .0441 .0552 .OM1 .OW6 .0869 .0098 .0148 .0199 .0248 .0298 .0348 .0399 .zoo .297 .397 .498 .599 .699 .I99 .0507 .0762 .lo1 .126 .152 .177 .203
Q
136 110 91.8 81.6 78.0 75.9 68.2
259 187 160 13 1 122 112 109 725 578 465 355 302 270 246
1540 1378 1190 1052 920 785 690
3030 2630 2420 2220 1945 1785 1630 5680 5550 5100 4590 4180 3800 3560 4050 3300 3020 2900 2420 1390 0620 2260 1865 1565 1315 1135 1000 880
1040 935 878 805 725 662 602
DamPi."g
g* x 104 Coefficient
73.4 90.6
109 123 128 132 147 38.6 53.6 62.6 76.1 82.1 89.3 92.1 13.8 17.3 21.5 28.2 33.2 37.0 40.7
6.50 7.26 8.40 9.50
10.9 12.8 14.5 3.30 3.80 4.13 4.51 5.14 5.60 6.13 1.76 1.80 1.96 2.18 2.39 2.63 2.81
.712
.752
.768
.776
.805
.878
.942 4.43 5.36 6.39 7.60 8.82 9.99
9.62 11.4
10.7 11.4 12.4 13.8 15.1 16.6
18

Table 4 Beam Damping Measurements in Vacuum
Resonant Frec
Nominal (CPS)
15
30
70
150
300
700
1500
70
300
:ncy ~
Actual (CPS)
15.18
30.30
71.60
153.2
306.5
716.2
1572
76.26
314.8
Beam Thickness
h (in.)
0.100
0.100
0.100
0.100
0.100
0.100
0.100
0.200
0.050
Calc. Root S t ress
or
(Psi)
4800 7200 9600
12000 14400 16800 19200 4800 7200 9600
12000 14400 16700 19300 4800 7300 9700
12100 14500 16900 19400 4500 6800 9000
11300 13400 15800 18000 4700 7000 9400
11700 14000 16300 18800 4800 7 100 9400
11900 14300 16700 19200 4600 6900 9200
11500 13800 16300 4900 7200 9700
12000 14400 16500 19200 4500 6800 9200
11300 13800 16000 18400
Root Acceleration
a
(gravity units)
.0223
.0345
.0405 ,0510 .0632 .OD3 .0833 .0307 .0433 .0560 .0729 ,0870 . lo1 .115 .0340 ,0520 .Of390 .OB60 . lo3 .120 ,135 .0370 .0570 .0760 .0930 .114 .132 .149 .0360 .0554 .0742 .0925 .111 ,128 .150 .0420 ,0630 .0850 ,107 .126 .147 ,169 .038 .054 .071 .088 . lo9 .130 .0095 .0137 .0186 ,0255 .0319 .0368 .0453 .126 .191 2 5 1 .324 .381 .448 .514
Displacement Double A
Root
(in.) s, 103
1.89 2.93 3.43 4.33 5.36 6.65 7.07
.660
.924 1.18 1.56 1.85 2.14 2.44
.132
.201
.266
.331
.395 ,461 .518 .0308 .0474 ,0632 .0774 .0948 .110 .124 .0075 .0115 .0154 .0193 ,0231 .OX7 .0312 ,00159 .00240 .00323 .00405 .00476 .00558 .00640 .000303 .000428 .000565 .000700 .000839 .00103 .0326 .0460 .0625 .OB56 . lo7 .124 .I52 .0248 .0377 .0506 .Of339 .0763 .0884 .lo1
plitude
Tip b Res (in.)
1.01 1.53 2.04 2.55 3.06 3.57 4.08
.510
.774 1.02 1.29 1.54 1.79 2.06
.217
.326
.434 ,546 .656 .766 ,874 .096 .I45 .192 .240 .287 .339 .384 .0497 .0751 .0999 .125 .150 ,175 .201 ,0218 ,0326 .0433 .0545 .0654 ,0766 .0880 .0098 .0147 .0197 .0246 .0295 .0348 2 1 2 .310 .413 .513 .616 .706 3 2 1 .0480 .0733 .0980 .121 .147 .171 .197
Q
342 332 379 376 365 3 42 3 69 493 53 5 551 527 532 534 539
1047 1037 1045 1052 1059 1060 1077 1990 1960 1940 1980 1935 1965 1980 4240 4170 4140 4150 4140 4180 4140 8770 8720 8570 8640 8770 8770 8770
20600 2 1900 22200 22400 22500 21600
4150 4290 4250 3880 3660 3650 3450 1228 1238 1233 1205 1230 1233 1240
29.2 30.1 26.4 26.6 27.4 29.2 27.1 20.27 18.71 18.13 18.96 18.80 18.73 18.55 9.55 9.64 9.57 9.50 9.44 9.43 9.28 5.02 5.11 5.15 5.05 5.17 5.09 5.05 2.36 2.40 2.42 2.41 2.42 2.39 2.42 1.14 1.15 1.17 1.16 1.14 1.14 1.14
.485
.456
.450
.446
.445
.463 2.41 2.33 2.35 2.58 2.73 2.74 2.90 8.15 8.08 8.11 8.30 8.13 8.11 8.07

REFERENCES
1. Crandall, S. H., "On Scaling Laws for Material Damping," National Aeronautics and Space Administration, Washington, D. C., NASA TN-D- 1467, December 1962.
2. Zener, C. M., "Elasticity and Anelasticity of Metals," Chicago: University of Chicago, 1948.
3 . Vet, M., "Dwell Sweep Correlation Study," Collins Radio Co., Cedar Rapids, Iowa, CER-1582, 1963.
4. Jacobsen, L. S., and Ayre, R. S., "Engineering Vibrations," New York: McGraw-Hill Book Company, 19 58.
20
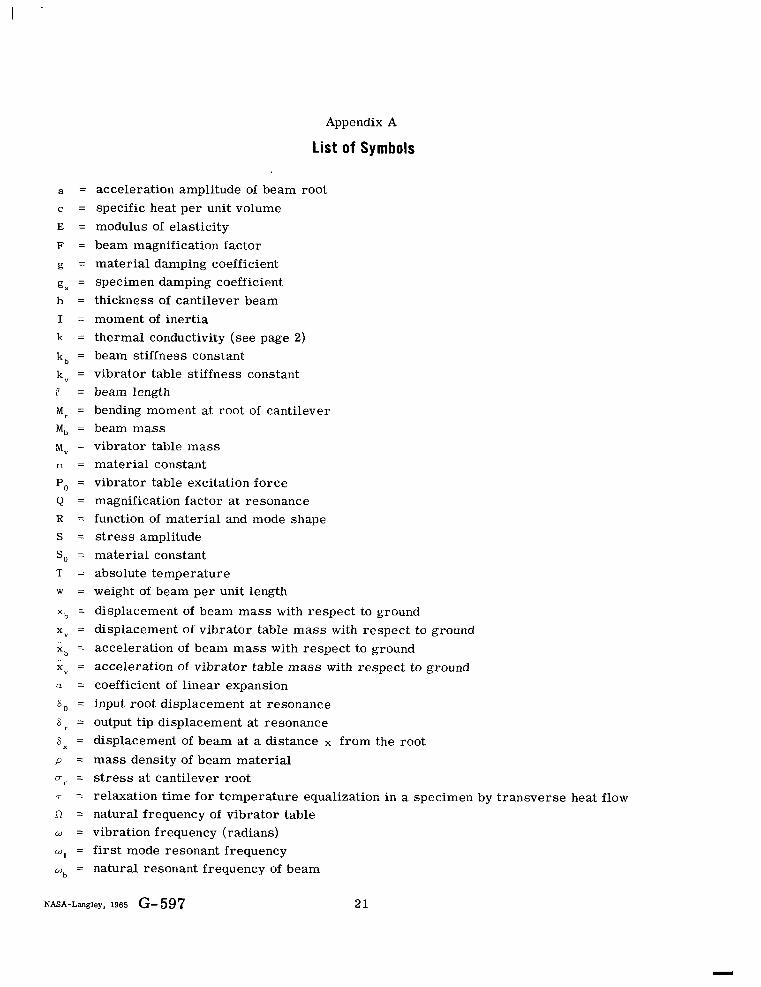
Appendix A
List of Symbols
a = acceleration amplitude of beam root c = specific heat per unit volume E = modulus of elasticity F = beam magnification factor g = material damping coefficient gs = specimen damping coefficient h = thickness of cantilever beam I = moment of inertia k = thermal conductivity (see page 2) k, = beam stiffness constant
k v = vibrator table stiffness constant P = beam length M r = bending moment at root of cantilever M, = beam mass M~ = vibrator table mass n = material constant Po = vibrator table excitation force Q = magnification factor at resonance R = function of material and mode shape S = s t r e s s amplitude So = material constant T = absolute temperature w = weight of beam per unit length xb = displacement of beam mass with respect to ground x V = displacement of vibrator table mass with respect to ground X, = acceleration of beam mass with respect to ground xV = acceleration of vibrator table mass with respect to ground a = coefficient of linear expansion 8, = input root displacement at resonance S r = output tip displacement at resonance
s x = displacement of beam at a distance x from the root p = mass density of beam material D~ = s t r e s s at cantilever root 7
R = natural frequency of vibrator table w = vibration frequency (radians) ul = first mode resonant frequency &), = natural resonant frequency of beam
= relaxation time for temperature equalization in a specimen by transverse heat flow
NASA-Langley, 1965 G- 597 21